Abstract
The article deals with the creation of a calibration model of lactic acid content in an aqueous solution. The research concept included the preparation of a control tool for the process of modifying the properties of the food fraction for methane fermentation bacteria. The thesis was formulated that it is possible to prepare a systemic solution for real-time observation and monitoring of lactic acid secretion during the digestion of a hydrated mixture of food fractions. The scientific aim of the work was to develop and verify a calibration model of lactic acid content in an aqueous mixture with limited transparency for visible light waves. The research methodology was based on near-infrared spectroscopy with multivariate analysis. Stochastic modeling with noise reduction based on orthogonal decomposition was used. A calibration model was created using Gaussian processes (GP) to predict the lactic acid concentration in an aqueous solution or mixture using an NIR-Vis spectrophotometer. The design of the calibration model was based on absorbance spectra and computational data from selected wavelength ranges from 450 nm to 1900 nm. The measurement data in the form of spectra were limited from the initial wider range (400–2250 nm) to reduce interference. The generated calibration model achieved a mean error level not exceeding 2.47 g∙dm−3 of the identified lactic acid fraction. The coefficient of determination R2 was 0.996. The effect of absorbing the emitter waves was achieved despite the limited transparency of the mixture.
1. Introduction
1.1. Feed and Food Waste and Methods of Its Processing
Organic waste such as food and feed waste can be managed in various ways. This possibility stems from the content of these wastes in components such as proteins, fats, carbohydrates, vitamins, and minerals, which may come from various raw materials. This waste can undergo various processes of biodegradation, fermentation, or decay, leading to the formation of gases such as methane and carbon dioxide. Food waste is usually moist due to the water content in food, which affects the rate of decomposition and fermentation processes and can increase the weight of the waste [1,2].
Feed and food waste is susceptible to biodegradation, which means that it can be broken down by microorganisms such as bacteria, fungi, and protozoa. Biodegradation leads to the production of nutrients, but can also generate unpleasant odors and gases. Food waste can include food scraps, expired food products, peelings, bones, husks, and inedible parts of plants and animals. It can occur on a household scale as well as on an industrial or commercial level [3].
Excess food waste is a serious environmental problem. Food decomposition produces methane, which is a significant greenhouse gas contributing to climate change. Food waste also takes up space in landfills, contributing to the problem of waste management. In order to minimize the negative impact of food waste on the environment, recycling and composting practices are increasingly being promoted. Recycling food waste can include using it to produce compost, biogas, or other forms of energy recovery. Raising public awareness of the problem of food waste and educating people on how to reduce food waste are key to effectively managing this issue [4].
First and foremost, organic waste can be used for energy and fertilizer production.
Energy production includes technologies such as:
- -
- Incineration;
- -
- Methane fermentation;
- -
- Gasification;
- -
- Pyrolysis.
Waste incineration is the oldest and most common method of converting waste into energy. However, it is necessary to ensure that the fuel has the lowest possible moisture content. Modern incineration technologies are equipped with exhaust gas treatment systems that minimize the emission of harmful substances into the atmosphere [5].
Methane fermentation is a process of biological decomposition of organic matter in anaerobic conditions, resulting in the production of biogas. The main components of biogas are methane, which is an energy carrier, and carbon dioxide [1].
Currently, methane fermentation on an industrial scale is seeking new sources of substrates and methods for their conversion in order to increase feed digestibility and/or increase energy yield from biomass fractions. Czekała et al. [6] emphasize the importance of raw material quality and processing (grinding, homogenization, moisture control). According to the researchers, this promotes increased biogas productivity and methane content. The result is stabilization of heat and electricity supply through the CHP system of biogas plants. In turn, in Wałowski’s research [7], the integration of substrate preparation processes has an impact on the efficiency of biomass conversion into energy in biogas plants. The simulation showed that combining heating and mixing, controlling the flow of incoming feed fractions and the outflow of digestate fractions, together with the elimination of system and process limitations as a whole, reduces losses. Substrates and transformation products undergo a process optimized in terms of efficiency criteria and energy reduction.
Not only the physical conversion of substrates is important for the efficiency of the methane fermentation process, but also the conversion of their structure through the influence of microorganisms. For example, inoculating silage substrate with the Lactobacillus buchneri strain shortens the latent phase and increases the rate of biogas production [8].
Gasification is the process of thermochemical conversion of waste into synthesis gas (syngas) under high temperature and controlled oxygen access conditions. Syngas consists mainly of hydrogen, carbon monoxide, and methane and can be used as a fuel for electricity and heat production or as a raw material in the chemical industry [5,9].
Pyrolysis is the process of thermochemical decomposition of organic materials under anaerobic conditions, resulting in the formation of pyrolytic oils, pyrolytic gas, and charcoal. These products can be used as fuels or raw materials for energy production [10].
Organic waste can be used for fertilization purposes primarily through composting. This process plays a key role in waste management. Composting is a natural biological process in which microorganisms, bacteria, and fungi break down organic waste, transforming it into nutrient-rich compost. This compost can be used as fertilizer to improve soil structure, increase its water capacity, and provide essential nutrients to plants [11].
The use of waste as fertilizer contributes to the sustainable management of natural resources, reducing the amount of waste going to landfills and reducing the demand for chemical fertilizers. In addition, composting and other processes that convert waste into fertilizers help reduce greenhouse gas emissions, such as methane, which is produced during the decomposition of waste in landfills [12].
However, the composting process requires adequate control to ensure that the processed waste is safe and does not contain any harmful components.
1.2. The Role of Lactic Acid Fermentation in the Anaerobic Stabilization of Waste
Lactic fermentation helps stabilize organic waste anaerobically, serving as the initial stage of fermentation. It makes the material more biologically stable, less prone to rotting, and more suitable for further processes such as methane fermentation (biogas). It is also an important element in the composting of organic waste [13].
First, the sugars contained in the waste are converted into lactic acid by lactic acid bacteria (Lactobacillus, Leuconostoc, Pediococcus). Lactic acid, in turn, lowers the pH of the waste mass to between 3.5 and 4.5. This, in turn, inhibits the growth of unwanted putrefactive bacteria, pathogens, and mold. The resulting acidic environment favors lactic acid bacteria and eliminates pathogens, making the waste more stable and suitable for longer storage, for example for methane fermentation. By reducing the risk of material decay, emissions of gases such as hydrogen sulfide and ammonia are reduced [14].
Lactic fermentation is an important form of substrate preparation for the methane fermentation process. It breaks down hydrocarbons and acidifies the mass, which facilitates the subsequent decomposition of the substrate by methanogenic bacteria.
In addition, lactic acid can be a precursor in the methanogenic fermentation process, even though it does not directly participate in methane production. However, it is an intermediate substance, similar to propionic acid, in the earlier stages of the digestion process. Lactic fermentation, like methane fermentation, accelerates the breakdown of complex biofractions such as proteins, carbohydrates and fats. As a result, the organic compounds that are formed are easier to digest due to the hydrolysis stage, which is similar to methane fermentation. Lactic acid is associated with acidogenic fermentation, where it is a product of the conversion of simpler biopolymers by bacteria. Alongside short-chain fatty acids, alcohols, hydrogen and carbon dioxide, it is an intermediate product under favorable conditions. Subsequent stages of the fermentation process (acetogenesis and methanogenesis) result in the utilization of lactic acid as an intermediate nutrient for specialized groups of bacteria [15].
According to Piątek and Bartkowiak [16], the physical conversion of biomass facilitates the extraction of nutrients from indigestible biomass. Similarly, preliminary lactic fermentation is a source of nutrients for the methane fermentation process with reduced energy requirements of the bacterial deposit. In both cases, the level of mineralization of the organic feed fraction increases.
In short, lactic fermentation improves process hygiene, increases biological safety, increases biogas production efficiency, and reduces odor and sanitary problems [17,18].
1.3. Evaluation of Technological Parameters of Lactic Fermentation
The topic of the thesis addressed the issue of analyzing and evaluating the technological parameters of the lactic fermentation process. The bacterial culture used in the lactic fermentation process metabolizes specific nutrients based on products belonging to the food and feed group. An example of a characteristic food substrate is molasses, which is produced in the processing of sugar beets and is a semi-finished product for both the food and feed industries. One of the key parameters of the lactic fermentation process is the concentration of lactic acid, which varies in different phases of the fermentation process. The ability to obtain information about the concentration of lactic acid by observing the fermenting fraction in real time is extremely helpful in making decisions during the production process of the aforementioned acid. An alternative to observing the concentration of lactic acid in real time is to obtain samples from the reaction chamber and analyze them post factum. An attempt was therefore made to adapt the spectral analysis method supported by a calibration model to replace chromatographic methods and enable real-time observation of lactic fermentation products.
The key research issue is to develop methodological calibration models for the detection of lactic acid in a mixture of molasses and water with reduced transparency using transmission and absorption of generated waves.
The objective of the work was formulated.
The aim of this work is to demonstrate the possibility of assessing lactic acid concentration in an aqueous environment, taking into account mixtures of nutrients and aqueous solvents, using near-infrared spectral analysis.
Spectral analysis, also known as spectral analysis, is a type of teleanalysis, a method of qualitative and quantitative determination of substances based on the spectrum, including methods of generating spectra [19].
The main objective of the research was to generate spectral spectra using the wavelength range in visible light and infrared up to 1900 nm, and to create a calibration model based on optimization operations using mathematical tools.
In order to achieve the objective of the study, it was necessary to identify a number of sub-tasks.
First, an aqueous solution of lactic acid was prepared and the range of lactic acid concentrations characteristic of the lactic fermentation process on a technical scale was outlined.
In the next step, a test station equipped with an absorption and reflection measuring head was prepared, using a wavelength range from 450 nm to 1900 nm.
Following the preparatory work, the next step was to obtain spectral spectra of the solvent, concentrated lactic acid, and aqueous lactic acid solution.
In the further part of the study, an attempt was made to obtain spectral spectra of an aqueous molasses solution.
In the final stage of the research, a calibration model for lactic acid content in the aquatic environment and in an aqueous molasses solution was developed using software “Camo UnscramblerX 10.1”.
Optimization activities related to the construction of calibration models have been planned, taking into account the model accuracy criterion.
2. Materials and Methods
2.1. General Characteristics of the Research Material
The research material used in the study was demineralized water, molasses, and lactic acid. To create aqueous solutions with different concentrations of lactic acid.
Molasses is a thick, viscous liquid with a dark brown color, which is a by-product of the sugar production process from sugar cane or sugar beets.
Molasses has a density of approximately 1.209 g·cm3, which is higher than the density of water. The density of molasses may vary slightly depending on the source of the raw material and the sugar content. It is highly soluble in water due to its high sugar content. It consists mainly of sugars (sucrose, glucose, fructose), but also contains significant amounts of minerals (calcium, magnesium, potassium), vitamins (vitamin B6) and small amounts of proteins and other organic compounds.
During sugar refining, after the crystalline sugar has been separated, the remaining syrup, which contains a high percentage of unrefined sugars, minerals, vitamins, and other organic substances, is called molasses. In the case of sugar cane, molasses is a by-product of white sugar production, while in the case of sugar beets, it is produced during the extraction and purification of beet sugar.
It is an easily digestible substrate for fermentation bacteria regardless of the metabolic pathway. To prepare a molasses-based bacterial culture medium, molasses is usually diluted with demineralized water to the appropriate sugar concentration (usually around 5–25%). Other nutrients are then added, such as nitrogen sources (e.g., yeast extract), mineral salts (e.g., phosphates, sulfates), and the pH of the medium is adjusted [20,21]. The chemical composition of molasses is shown in Table 1. The results were confirmed with data from the literature [20].

Table 1.
Chemical composition of molasses. The results were confirmed with data from the literature [20]. Source, own research [20].
The creation of lactic acid models involved adding an appropriate dose of lactic acid to an aqueous solution in order to change its concentration and enable the observation of spectral spectra characteristic of growth in an aqueous environment and in an aqueous molasses solution.
At room temperature, lactic acid is a colorless, syrupy liquid that can crystallize into solids at lower temperatures. It has a melting point of approximately 16–17 °C for pure lactic acid and a boiling point of approximately 122 °C at a pressure of 15 mm Hg. The density of lactic acid at 20 °C is approximately 1.209 g·cm3 [22,23].
Lactic acid is a weak acid with a pKa value of approximately 3.86, which means that it partially dissociates in aqueous solutions to form lactate ions (C3H5O3−) and hydrogen ions (H+). Its ability to react with alcohols leads to the formation of esters such as lactates, and under suitable polymerization conditions, it can form polylactide (PLA), a biodegradable plastic. Lactic acid can also undergo oxidation and reduction reactions, depending on the reaction conditions, and is relatively stable over a wide pH range [23].
2.2. Research Equipment
2.2.1. Marking the Weight of the Laboratory Sample
The mass of the laboratory sample was determined using an electronic scale. Two types of scales were used for this purpose. The first scale had a measuring range from 0 to 5000 g with an accuracy of 0.01 g and was used to prepare laboratory samples and analyze physicochemical parameters. Thanks to its resolution, it enabled accurate measurements of even hundredths of a gram.
2.2.2. Determining the Sample Volume
The sample volume was determined using a minilab 201 automatic pipette (HTL Biotechnology, Javené, France). It was calculated that at a density of 1.209 g·cm3 of lactic acid, the concentration of one sample was 0.96 g·dm−3. For both probes, 146 dosages were performed in sequence. After each dosing, the spectral spectrum was measured.
The dosage of lactic acid to the aqueous molasses solution is shown in Table 2 for the A40 probe and Table 3 for the Niron probe.
Table 2.
Lactic acid dosage for the A40 head.
Table 3.
Lactic acid dosage for the Niron head.
2.2.3. Ambient Temperature
The temperature in the laboratory room can affect the behavior of the sample and the subsequent spectrum, therefore, the test was carried out at an appropriate laboratory temperature of 20–25 degrees to maintain the right conditions for each measurement. At refrigerator temperature, the solution visibly thickened, so it was heated to 25 degrees on a stirrer. Lactic acid was also at a temperature of 20–25 degrees for each measurement.
2.2.4. Research Station in the Process of Acquiring Spectral Spectra in the near Infrared Range
The AgroSpec spectrometer from Tec5 AG was used by the Department of Biosystems Engineering at the University of Life Sciences to obtain spectra from an aqueous solution of molasses. AgroSpec is a mobile, stationary, VIS–NIR spectrophotometer (Tec5 Technology for Spectroscopy, Oberursel, Germany) [24].
The device allows for recording near-infrared spectra using reflection and transmission methods, with RP-7 and A40 probes, and an optical fiber was used for the connection. The samples were placed on a rotating table, on a Petri dish above the A40 probe. For the Niron probe, it was necessary to immerse the probe in a container with an aqueous solution of molasses. The distance between the A40 probe and the table is 55 mm. Lighting was provided by an RP-7 bulb located above the sample. The spectrum of the solution was obtained using the MultiSpec Pro II program (Standard). A magnetic stirrer was used to thoroughly mix the aqueous molasses solution with lactic acid. The test setup is shown in Figure 1.
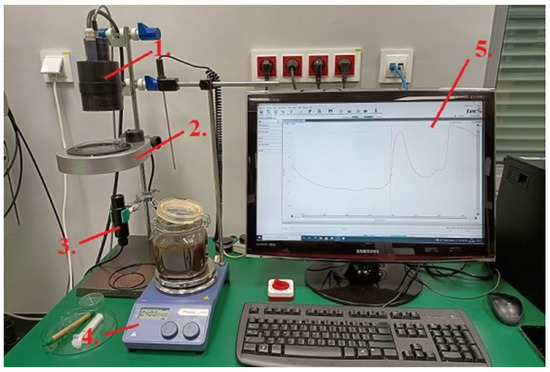
Figure 1.
Research station for obtaining NIR spectra (1.—RP-7 probe, 2.—rotating table with Petri dish, 3.—A40 probe, 4.—magnetic stirrer, 5.—computer with software for recording the obtained spectra). [Source: own study].
A MINILAB 201 automatic pipette (Figure 2) was used for precise dosing of lactic acid, allowing dosing in the range from 0.001 to 0.5 cm3. The test material was applied to a Petri dish using 20 cm3 syringes. Camo Unscrambler X version 10.1 software was used to analyze and model the obtained spectral spectra.
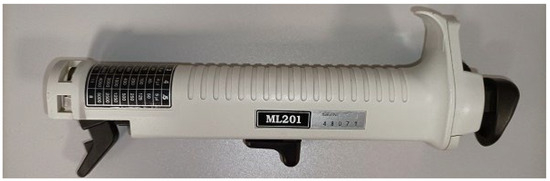
Figure 2.
MINILAB 201 automatic pipette. [Source: own study].
2.2.5. Statistical Analysis of Research Results
It was assumed that a statistically significant difference indicates that the observed variation between the analyzed groups or variables is sufficiently substantial that its occurrence by random chance is highly improbable.
The adopted research design and applied analytical instruments provided grounds to assume that the identified differences were not attributable to sampling errors or stochastic variability. A significance level of 0.05 (5%) was established, defining the threshold beyond which the difference could be considered statistically meaningful.
Within the framework of a statistical procedure for comparing intergroup variance (ANOVA), an attempt was undertaken to determine whether significant differences existed among the mean values of the examined data groups.
The process of data validation was based on the following hypotheses:
- Null hypothesis (H0): there is no statistically significant difference in the mean values between the analyzed data groups;
- Alternative hypothesis (H1): there exists a statistically significant difference in the mean values between the analyzed data groups.
Empirical data were collected as multiple repetitions of individual measurements (a minimum of three replicates), followed by a variance analysis. When the p-value obtained from the ANOVA test was lower than the predetermined significance threshold (e.g., 0.05), the null hypothesis was rejected, indicating that the mean values of the analyzed datasets differed significantly.
3. Results
3.1. Acquisition of Spectral Spectra of Concentrated Lactic Acid
The research was designed to use transmission and reflection methods in the construction of spectral spectra of lactic acid. First, the task was specified, which was to demonstrate that it is possible to obtain spectral spectra of concentrated lactic acid for both methods, therefore Niron and A40 heads were used, which characterized both research methods. Three repetitions of the concentrated lactic acid scanning process were performed. The results of the study are presented graphically (Figure 3 and Figure 4). A spectral spectrum of concentrated lactic acid (ca. 90%, density 1.209 g·cm−3) was obtained using the Niron head. To achieve the objective of the study, a laboratory sample of lactic acid was prepared and scanned to obtain spectral patterns in the analyzed wavelength range (Figure 3).
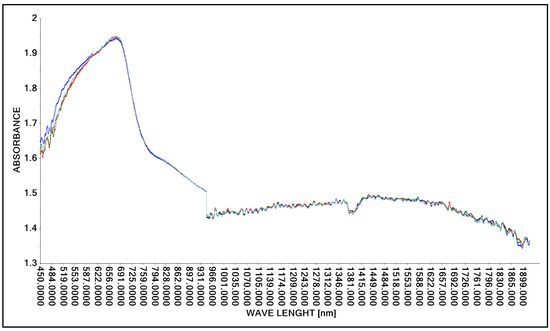
Figure 3.
Spectrum comparison of concentrated lactic acid (concentation ca. 90%) obtained with the Niron probe.
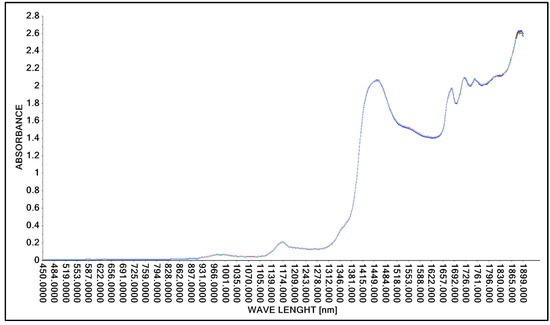
Figure 4.
Spectrum comparison of concentrated lactic acid obtained with the A40 probe.
As in the case of tests using the Niron probe, the A40 probe was used to obtain spectral spectra of concentrated lactic acid. The test was repeated three times to verify the repeatability of the test method used. As in the case of scans obtained with the Niron probe, spectral spectra in the wavelength range of 450 nm to 1900 nm were obtained with the A40 probe (Figure 4).
The physical properties of the lactic acid used in the research, its viscosity, density, and transparency to visible light suggested that the preparation of an aqueous solution of lactic acid and the determination of spectral spectra for this solution should produce a similar effect to that observed in the case of concentrated acid spectral spectra. Therefore, it was decided to continue the research and perform spectral analysis of the aqueous solution of lactic acid. The next stage was to bring the research closer to the stage of obtaining spectral analysis of lactic acid in mixtures with nutrients for the bacterial bed.
3.2. Acquisition of Spectral Spectra of an Aqueous Solution of Lactic Acid
3.2.1. Spectral Spectrum of an Aqueous Solution of Lactic Acid Using a Niron Head
Based on the guidelines for changing the acid concentration in an aqueous solution (Table 2 and Table 3), the process of obtaining spectral spectra was carried out. In the first step, the possibility of obtaining spectral spectra for an aqueous solution of lactic acid was tested. The spectra obtained were in the wavelength range from 450 nm to 1900 nm. The spectral spectra for 146 analyzed samples of aqueous lactic acid solution are presented in graphical form (Figure 5).
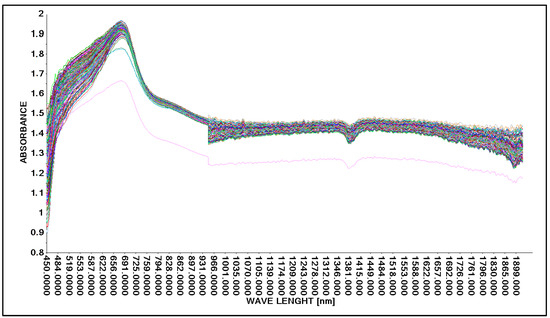
Figure 5.
Comparison of absorption spectra in an aqueous solution with lactic acid without correction using a Niron measure head.
The characteristics of the model fitting error to the data were determined.
Partial least squares (PLS) regression is a statistical method that is related to principal component regression and is a reduced-rank regression. Instead of finding the hyperplane of maximum variance between the response and the independent variables, it finds a linear regression model by projecting the predicted variables and the observed variables onto a new space of maximum covariance. Since both the X and Y data are projected onto the new space, the family of PLS methods is known as bilinear factor models.
The main idea behind the PLS transformation is that the vectors of input and output variables differ. When one input variable is independent of another input variable, the output variables show an upward trend, the variable being the slope of the response vector.
The purpose of building the model is to predict sensory measurements based on chemical measurements. The predictors are therefore chemical variables that we want to predict will be sensory data. The result obtained was corrected by changing the wavelength range accepted in the form of a training data range. Among other things, the following were used: “baseline” transformation and “moving average 9” transformation, where data corrections for model construction were made by automatically (software) and intuitively (decision of the person operating the software) removing outliers (Figure 6). (decision of the person operating the software) (Figure 6). As a result, 10 model solutions were created, differing in the aforementioned data ranges (wavelength ranges) and model quality parameters such as: RMSE (root mean square error), R2 (coefficient of determination). The best model, called “PLS Nitron 950–1900 baseline Moving Average 9 without out aut” for the Niron head, was characterized by the parameter RMSE = 4.930 g·dm−3 and the parameter R2 = 0.990 (Table 4).
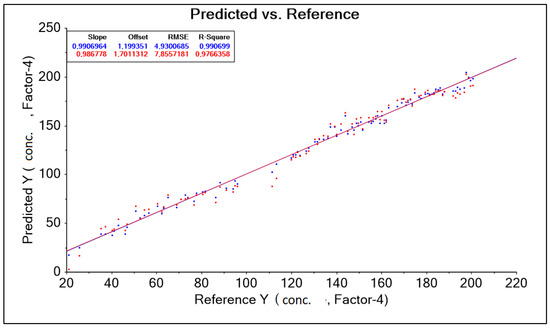
Figure 6.
PLS Niron 950–1900 nm Baseline Moving Average 9 chart without outliers, forecasts, and references.
Table 4.
The results of predictive model parameters for the Niron head obtained after transformation on a set of spectral spectra for different levels of lactic acid concentration in an aqueous solution.
The tests were repeated using the A40 probe for the aforementioned aqueous lactic acid solution. The dividing line between the results therefore runs mainly between two alternative methods of generating spectral spectra, i.e., the use of the Niron probe and the A40 probe. The aforementioned mathematical transformations serve to optimize the qualitative effects of the model. The results of the tests for the use of the A40 probe and the construction of a calibration model for an aqueous solution of lactic acid are presented in Section 3.2.2.
3.2.2. Spectral Spectrum of an Aqueous Solution of Lactic Acid Using the A40 Head
As in the case of studies involving the acquisition of spectral spectra using the Niron head, in the next research step, spectral spectra were acquired in the accepted range of lactic acid concentrations (Table 3) using the A40 head. The results of the research were presented in graphical form for the full wavelength range from 450 nm to 1900 nm (Figure 7).
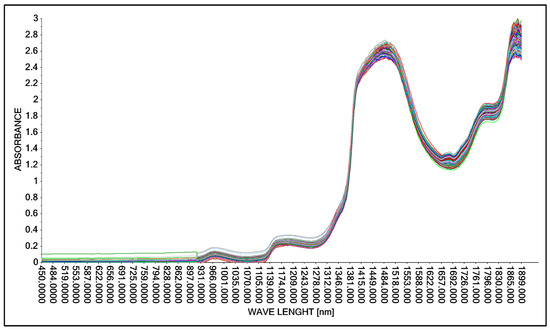
Figure 7.
Comparison of absorption spectra in an aqueous solution with lactic acid using the A40 head.
The obtained result was corrected by changing the wavelength range adopted in the form of a training data range. Among other things, the following were used: “baseline” transformation and “SGolay” transformation, as well as data corrections for model construction by automatically (software) and intuitively (decision of the person operating the software) removing outliers. (decision of the person operating the software). As a result, nine model solutions were created, differing in the aforementioned data ranges (wavelength ranges) and model quality parameters such as: RMSE (root mean square error), R2 (coefficient of determination). The best model, called “PLS A40 920–1900 baseline without out manually,” for the A40 head was characterized by the parameter RMSE = 4.186 g·dm−3 and the parameter R2 = 0.994 (Figure 8, Table 5).
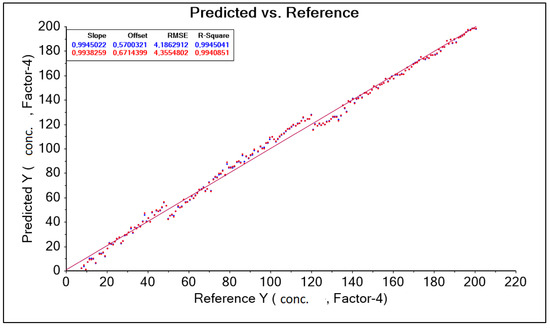
Figure 8.
PLS graph A40 920–1900 nm Baseline without manually corrected forecasts and references.
Table 5.
Results of predictive model parameters for the A40 sensor obtained after transformation on a set of spectral spectra for different levels of lactic acid concentration in an aqueous solution.
3.3. Acquisition of Spectral Spectra of Aqueous Solutions of Lactic Acid and Molasses
3.3.1. Spectral Spectra of an Aqueous Solution of Lactic Acid and Molasses Using a Niron Head
The research was continued using the A40 head and the Niron head. The medium in which the lactic acid concentration was analyzed was changed. In this case, an aqueous solution of lactic acid and molasses was analyzed. As in the case of building calibration models for an aqueous solution of lactic acid (Section 3.2.1 and Section 3.2.2), the division of results is mainly between two alternative methods of generating spectral spectra, i.e., the use of the Niron probe and the A40 probe (Figure 9).
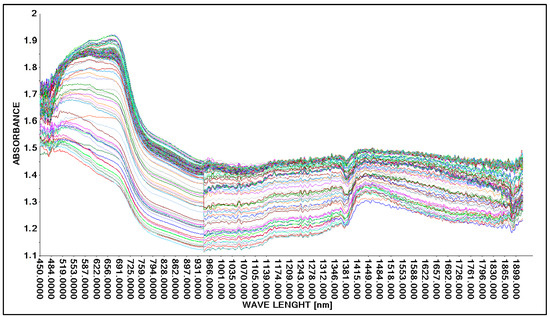
Figure 9.
Comparison of absorption spectra of molasses in a 25% aqueous solution with lactic acid.
The aforementioned mathematical transformations were again used to achieve qualitative optimization of the model.
As in the case of studies involving the acquisition of spectral spectra for an aqueous solution of lactic acid, in the next research step, spectral spectra were obtained in the accepted range of lactic acid concentrations (Table 3) using the Niron head. The tests were performed for the full wavelength range, from 450 nm to 1900 nm.
The result obtained was corrected by changing the wavelength range adopted in the form of a training data range. Among other things, the following were used: baseline transformation and data corrections for model construction by automatically (software) and intuitively (decision of the person operating the software) removing outliers. As a result, 13 model solutions were created, differing in the aforementioned data ranges (wavelength ranges) and model quality parameters such as: RMSE (root mean square error), R2 (coefficient of determination). The best model, called “PLS Niron 500–1850 nm without out manually 5” for the Niron head, was characterized by the parameter RMSE = 4.435 g·dm−3, parameter R2 = 0.985 (Figure 10, Table 6).
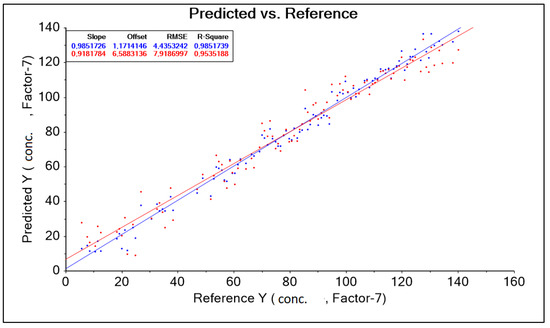
Figure 10.
PLS Niron Baseline 500–1850 nm graph without out manually corrected 5 predicted and references.
Table 6.
Results of predictive model parameters for the Niron sensor obtained after transformation on a set of spectral spectra for different levels of lactic acid concentration in a solution contaminated with molasses.
3.3.2. Spectral Spectra of an Aqueous Solution of Lactic Acid and Molasses Using an A40 Head
As in the case of studies involving the acquisition of spectral spectra for an aqueous solution of lactic acid and molasses using the Niron head, in the next research step, spectral spectra were acquired in the accepted range of lactic acid concentrations (Table 3) using the A40 head. The tests were performed for the full wavelength range, from 450 nm to 1900 nm (Figure 11).
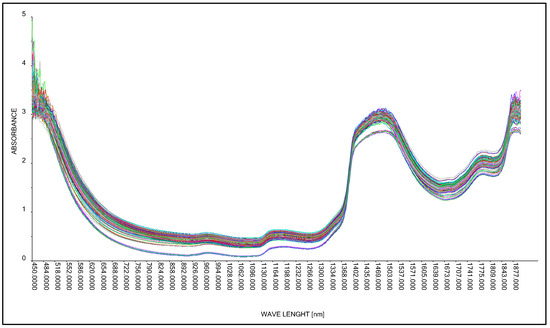
Figure 11.
Comparison of absorption spectra of molasses in a 25% aqueous solution with lactic acid.
The result obtained was corrected by changing the wavelength range adopted in the form of a training data range. Among other things, a baseline transformation without data correction was used to build the model by removing outliers. As a result, four model solutions were created, differing in the aforementioned data ranges (wavelength ranges) and model quality parameters such as RMSE (root mean square error) and R2 (coefficient of determination). The best model, called “PLS A40 550–1850 nm baseline” for the A40 head, was characterized by the parameter RMSE = 2.305 g·dm−3, parameter R2 = 0.997 (Figure 12, Table 7). During the study, the spectral curves of an aqueous molasses solution without lactic acid additive were also analyzed.
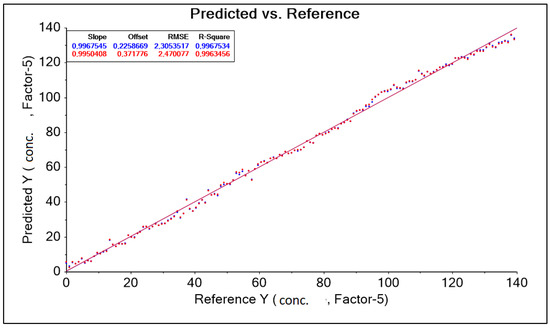
Figure 12.
PLS A40 graph 550–1850 nm Baseline forecasts and references.
Table 7.
Results of predictive model parameters for the A40 sensor obtained after transformation on a set of spectral spectra for different levels of lactic acid concentration in a solution contaminated with molasses.
4. Discussion
The main objective of this study was to develop a model that would enable rapid prediction of lactic acid content in organic substrates such as food and feed waste. Rapid prediction is crucial for the proper preparation of raw materials when developing technologies for the management of this type of waste. This is particularly important in the case of preparing substrates for biogas plants for energy purposes, where it is essential to limit the occurrence of components that contaminate the methane fermentation process [25,26].
Biogas plants usually store substrate in the form of silage to ensure constant access to raw materials and continuity of operation. In such cases, it is important to control not only the process taking place in the fermenter, but also the substrate, which, if handled improperly, can disrupt the process [27,28].
Currently, rapid tests for organic waste samples that allow the determination of lactic acid content are not widely available. Therefore, the authors of this study decided to attempt to develop such a model. For this purpose, a set of samples contaminated with molasses was prepared to simulate a substrate sample that could be used, among other things, in a biogas plant.
There are several problems with recognizing key product fractions using rapid spectral detection methods based on prepared calibration models. Complex substances, polymers and molecules pose a barrier to specific methods, spectral detection and other related methods in terms of the use of transmission or reflection methods. The issue of the usefulness of spectral analysis, in terms of a wide spectrum of emitted wavelengths, also applies to the identification of many organic acids. Popular methods of constructing detection or prediction models using spectral analysis in the visible to infrared range encounter a number of limitations in the fermentation process environment (e.g., lactic, methane) [29].
One of the limitations is the natural color, white, yellow and syrupy consistency of the target fermentation products. In combination with the organic substrate residue, from which the unrefined form of acid (e.g., ACA acids) is obtained in a biochemical process, the transparency to visible and infrared light waves is impaired [30].
Modelling based on near-infrared (NIR) spectral spectra for materials with low transparency is challenging due to the strong absorption and scattering of radiation in their structure. In such cases, it is crucial to use appropriate methods for correcting optical effects and advanced signal processing techniques, such as scatter correction (e.g., MSC, SNV) and dimensionality reduction (e.g., PCA). Chemometric models, e.g., PLS (Partial Least Squares), allow reliable information about the composition of the material to be obtained despite limited transparency, but require a carefully selected set of calibration and validation data [31,32].
However, Xue, X. et al. [28] undertook the task of developing a rapid model for determining the lactic acid content in corn silage. In their study, they developed a quantitative model for predicting changes in lactic acid content during secondary fermentation of corn silage based on a colorimetric sensor array (CSA) combined with hyperspectral imaging. The results showed that the accuracy of the model’s predictions can be significantly improved by selecting appropriate pre-processing methods for different color-sensitive dyes. The CARS-CPO-SVR model (Competitive adaptive reweighted sampling (CARS), crested porcupine optimizer (CPO), support vector regression (SVR)) showed better prediction accuracy, with a coefficient of determination of the prediction set (R2P), root mean square error of prediction (RMSEP), and ratio of performance to deviation (RPD) of 0.9617, 2.0057, and 5.1997, respectively. These comprehensive results confirm the validity of combining CSA with hyperspectral imaging to accurately determine the lactic acid content in silage, providing a scientific and innovative method for testing the quality of corn silage. It can be noted that the model developed by the authors is characterized by good accuracy.
Previous scientific work on the subject of lactic acid content modeling has usually focused on identification and mathematical modeling [33,34] or on models relating to foodstuffs of animal origin, in this case primarily dairy products [35].
Macedo, M.G. et al. [33] used near-infrared spectroscopy (NIRS) as a tool for simultaneously predicting the production yield of exopolysaccharides (EPS; 0–3 g·L−3) and the concentrations of lactic acid (0–59 g·L−3) and lactose (0–68 g·L−3) in supernatants from batch cultures of Lactobacillus rhamnosus RW-9595M, conducted at a controlled pH in a medium containing whey permeate. In order to develop calibration models, correlations between the second derivative of 164 NIRS transmittance spectra and reference data on the concentrations of the determined compounds were analyzed in the wavelength ranges of 1653–1770 nm and 2041–2353 nm using the partial least squares method (PLS) method. Lactic acid and lactose concentrations were determined by high-performance liquid chromatography (HPLC), while EPS content was estimated using a newly developed ultrafiltration-based method. The obtained coefficients of determination (R2) and standard cross-validation errors (RMSECV) for the calibration models were 0.91 and 0.26 g·L−3 for EPS, 0.99 and 2.54 g·L−3 for lactic acid, and 0.98 and 3.32 g·L−3 for lactose, respectively. These calibrations were verified on the basis of 45 randomly selected samples from six independent farms, which were not included in the calibration process. High agreement was found between the results obtained by reference methods and the predictions based on NIRS, with correlation coefficients and standard errors of prediction of 0.99 and 1.64 g·L−3 for lactic acid, 0.99 and 4.5 g·L−3 for lactose, and 0.91 and 0.32 g·L−3 for EPS. The results obtained indicate that NIRS spectroscopy can be an effective tool for rapid monitoring and control of the lactic fermentation process with exopolysaccharide production.
Păucean, A. et al. [34] developed a model based on infrared absorption analysis for the determination of lactic acid in the production and preservation of fermented dairy products, cheeses, sourdough bread, and lactate-fermented vegetables. The aim of the study was to monitor lactic acid production by Lactobacillus planta-rum ATCC 8014 and Lactobacillus casei ATCC 393—both as single strains and in co-fermentation—using Fourier transform infrared spectroscopy (FTIR) supported by multidimensional analysis. Three types of MRS media enriched with different carbohydrates were used for the study, reflecting the diverse matrices of plant and animal raw materials. Lactic acid concentration was determined using the HPLC reference method. The calibration set (n = 36) was used to build the model, while the validation set (n = 13) was used to test the robustness of the developed model. The coefficients of determination between the predicted and reference values were 0.986 and 0.965, while the mean square error for the calibration and validation sets was 0.127 and 0.263 g·L−1, respectively. The results confirmed the effectiveness of FTIR spectroscopy in combination with multivariate statistics as a fast, reliable, and economical tool for routine monitoring of lactic acid.
In a study by Sørensen, L.K. [35], predictive models were developed for determining lactic acid (Lac), acetic acid (HAc), pH, ammonia (NH3-N), and ethanol (EtOH) in grass and corn silage using near-infrared spectroscopy (NIR). Better accuracy of Lac, pH, and NH3-N determinations was obtained for dry materials, while HAc was determined more precisely in wet samples.
The standard deviation to RMSECV ratios were as follows:
- −
- For grass silage (dry material): 4.9 (Lac), 2.0 (HAc), 3.7 (pH), 3.1 (NH3-N);
- −
- For grass silage (wet material): 3.3 (EtOH);
- −
- For corn silage: 4.7 (Lac), 1.9 (HAc), 2.4 (pH), 2.9 (NH3-N), 4.0 (EtOH).
Drying at 80 °C had a minimal effect on Lac concentration, but had a more significant effect on NH3-N and HAc content, depending on the type of silage.
The results presented in this way allow us to conclude that the model developed in this article does not differ in quality from the studies of other authors, and moreover, it provides for a different application of research aimed at the energy management of organic biomass with high morphological diversity, which characterizes food and feed waste.
5. Conclusions
Research conducted on the concept of monitoring lactic acid levels in the process of preparing biomass fractions for biogas production confirmed the thesis of the study. The results of the research allowed for the formulation of a series of conclusions, substantive comments, and recommendations.
- ◦
- First, the possibility of determining the concentration of lactic acid in liquid mixtures using the near-infrared (NIR) method in the analyzed wavelength range from 400 nm to 2250 nm was confirmed.
- ◦
- Identifying spectral noise clearly outlines the limitation of the data range (in the model up to 1900 nm) and improves the quality of the built calibration models.
- ◦
- Identification of optimal wavelength sub-ranges and gradual modifications of spectral spectra allow the areas of most valuable data for the calibration model to be determined.
- ◦
- The collection of data with increased size (150 NIR scans each time) contributed to the preparation of correct models of lactic acid concentration both in aqueous solution and in a mixture with molasses.
- ◦
- It has been demonstrated that Niron and A40 detection heads (absorption and reflectance) in the range of 450–1900 nm enable the creation of a high-quality database through the effective activation of lactic acid chemical bonds in an environment with limited optical transparency.
- ◦
- The results of the quality parameters of the calibration models confirmed that the proprietary method of spectral acquisition using 50 mL samples in a glass Petri dish is correct. The radiation waves penetrated the sample and reflected off the surface in a manner that allowed spectra to be obtained and changes in lactic acid concentration to be identified.
- ◦
- Building an effective neural network-based calibration model that recognizes the presence of lactic acid in a water-molasses mixture requires successive model iterations with wavelength range control to effectively improve the model quality parameters.
- ◦
- Mathematical transformations, such as baseline, moving average, SGolay filter, and outlier elimination, play a key role. This is an effective strategy for achieving high correlation between the model and the predictive and validation data.
- ◦
- It was found that the addition of 25% molasses—despite significantly reducing the transparency of the solution—does not prevent the construction of a high-quality NIR model. The spectral response of lactic acid is recognizable even in the difficult molasses medium, thanks to the excitation of chemical bonds in the NIR and partially MIR ranges.
- ◦
- The models were characterized by low RMSE errors and high R2, confirming the effectiveness of the method in determining lactic acid concentration in aquatic environments and in food/feed mixtures.
The authors of the study plan to verify the concept of converting the biomass decomposition process by dividing it into stages in order to obtain biogas with a higher calorific value.
Author Contributions
Conceptualization, M.H. and M.A.; methodology, M.H. and M.A.; software, M.A. and M.H.; validation, M.A., M.H. and P.M.; formal analysis, M.A. and M.H.; investigation, M.H. and M.A.; resources, M.A., M.H., P.M., K.D., M.K. and K.E.K.; data curation, M.A., M.H. and P.M.; writing—original draft preparation, M.A., M.H., P.M., K.D., M.K. and K.E.K.; writing—review and editing, M.A., M.H., K.D., M.K. and K.E.K.; visualization, M.H., M.A. and P.M.; supervision, M.H., M.A., and P.M.; project administration, M.H.; funding acquisition, K.D., M.K. and K.E.K. All authors have read and agreed to the published version of the manuscript.
Funding
The costs were incurred from funds from the IDUB University Development Strategy for 2024–2026 in the discipline of Environmental Engineering, Mining and Energy under the task “Stage: 1, payment from funds: SUBB.RNN.24.019” and from funds from the IDUB University Development Strategy for 2024–2026 in the discipline of Agriculture and Horticulture under the task “Stage: 1, payment from funds: SUBB.RNN.24.019”. Research plan no. SD.WTZ.24.086.
Data Availability Statement
The original contributions presented in the study are included in the article, further inquiries can be directed to the corresponding author.
Conflicts of Interest
The authors declare no conflicts of interest.
References
- Zhao, X.F.; Yuan, Y.Q.; Chen, Q.K.; Li, Q.; Huang, Y.; Wu, D.; Li, L. Effect of total solids contents on the performance of anaerobic digester treating food waste and kinetics evaluation. In Proceedings of the E3S Web of Conferences 272, 01026 ICEPG 2021, Xiamen, China, 21–23 May 2021. [Google Scholar] [CrossRef]
- Li, Y.; Jin, Y.; Borrion, A.; Li, H.; Li, J. Effects of Organic Composition on the Anaerobic Biodegradability of Food Waste. Bioresour. Technol. 2017, 243, 836–845. [Google Scholar] [CrossRef]
- Yasin, N.H.M.; Mumtaz, T.; Hassan, M.A. Food waste and food processing waste for biohydrogen production: A review. J. Environ. Manag. 2013, 130, 375–385. [Google Scholar] [CrossRef] [PubMed]
- Kibler, K.M.; Reinhart, D.; Hawkins, C.; Motlagh, A.M.; Wright, J. Food waste and the food-energy-water nexus: A review of food waste management alternatives. Waste Manag. 2018, 74, 52–62. [Google Scholar] [CrossRef] [PubMed]
- Eriksson, O. Energy and Waste Management. Energies 2017, 10, 1072. [Google Scholar] [CrossRef]
- Czekała, W.; Pulka, J.; Jasiński, T.; Szewczyk, P.; Bojarski, W.; Jasiński, J. Waste as substrates for agricultural biogas plants: A case study from Poland. J. Water Land Dev. 2023, 56, 45–50. [Google Scholar] [CrossRef]
- Wałowski, G. Assessment of technological simulation of an agricultural biogas installation using integration mechanisms. J. Water Land Dev. 2023, 59, 283–290. [Google Scholar] [CrossRef]
- Kupryś-Caruk, M.; Lisowski, A.; Chomontowski, C. The effect of silage additive on the kinetics of biogas production from lignocellulosic perennial crops. J. Water Land Dev. 2023, 56, 58–66. [Google Scholar] [CrossRef]
- Tezer, Ö.; Karabağ, N.; Öngen, A.; Çolpan, C.Ö.; Ayol, A. Biomass gasification for sustainable energy production: A review. Int. J. Hydrogen Energy 2022, 47, 15419–15433. [Google Scholar] [CrossRef]
- Modak, S.; Katiyar, P.; Talukdar, D.; Gole, B. Pyrolytic evaluation of essential oil industry waste: Effect of pyrolysis temperature on bio-oil composition. J. Environ. Manag. 2025, 392, 126757. [Google Scholar] [CrossRef]
- Mieldažys, R.; Jotautienė, E.; Pocius, A.; Jasinskas, A. Analysis of organic agricultural waste usage for fertilizer production. Agron. Res. 2016, 14, 143–149. [Google Scholar]
- Chojnacka, K.; Mikula, K.; Skrzypczak, D.; Izydorczyk, G.; Gorazda, K.; Kulczycka, J.; Kominko, H.; Moustakas, K.; Witek-Krowiak, A. Practical aspects of biowastes conversion to fertilizers. Biomass Convers. Biorefin. 2024, 14, 1515–1533. [Google Scholar] [CrossRef]
- Huang, J.; Wang, J.; Liu, S. Advanced Fermentation Techniques for Lactic Acid Production from Agricultural Waste. Fermentation 2023, 9, 765. [Google Scholar] [CrossRef]
- Walters, K.A.; Myers, K.S.; Ingle, A.T.; Donohue, T.J.; Noguera, D.R. Effect of Temperature and pH on Microbial Communities Fermenting a Dairy Coproduct Mixture. Fermentation 2024, 10, 422. [Google Scholar] [CrossRef]
- Adamski, M.; Czechlowski, M.; Durczak, K.; Garbowski, T. Determination of the Concentration of Propionic Acid in an Aqueous Solution by POD-GP Model and Spectroscopy. Energies 2021, 14, 8288. [Google Scholar] [CrossRef]
- Piątek, M.; Bartkowiak, A.M. Effectiveness of using physical pretreatment of lignocellulosic biomass. J. Water Land Dev. 2023, 58, 62–69. [Google Scholar] [CrossRef]
- Zaccariello, L.; Mastellone, M.L.; D’Amelia, L.I.; Catauro, M.; Morrone, B. Assessment of Integration between Lactic Acid, Biogas and Hydrochar Production in OFMSW Plants. Energies 2020, 13, 6593. [Google Scholar] [CrossRef]
- Curtin, L.V. Molasses—General Considerations; National Feed Ingredients Association: Iowa, IA, USA, 1983. [Google Scholar]
- Al-Amin, K.; Kawsar, M.; Mamun, M.T.R.B.; Hossain, M.S. Fourier transform infrared spectroscopic technique for analysis of inorganic materials: A review. Nanoscale Adv. 2025, 7, 6677–6702. [Google Scholar] [CrossRef]
- Šarić, L.Ć.; Filipčev, B.V.; Šimurina, O.D.; Plavšić, D.V.; Šarić, B.M.; Lazarević, J.M.; Milovanović, I.L. Sugar beet molasses: Properties and applications in osmotic dehydration of fruits and vegetables. Food Feed Res. 2016, 43, 135–144. [Google Scholar] [CrossRef]
- Bogoczek, R.; Napierała, W. Kwas mlekowy jakość, właściwości i kierunki zastosowań. Przemysł Spożywczy Rocz. 1998, 52, 43–47. [Google Scholar]
- van Lieshout, G.P. The Physical Properties of Lactic Acid and Derivatives; A Literature Review; TU Delft: Delft, The Netherlands, 1992. [Google Scholar]
- Czekała, W.; Nowak, M.; Bojarski, W. Characteristics of Substrates Used for Biogas Production in Terms of Water Content. Fermentation 2023, 9, 449. [Google Scholar] [CrossRef]
- Tekin, Y.; Kuang, B.; Mouazen, A.M. Potential of on-line visible and near infrared spectroscopy for measurement of pH for deriving variable rate lime recommendations. Sensors 2013, 13, 10177–10190. [Google Scholar] [CrossRef]
- Atelge, M.R.; Atabani, A.E.; Banu, J.R.; Krisa, D.; Kaya, M.; Eskicioglu, C.; Kumar, G.; Lee, C.; Yildiz, Y.Ş.; Unalan, S.; et al. A critical review of pretreatment technologies to enhance anaerobic digestion and energy recovery. Fuel 2020, 270, 117494. [Google Scholar] [CrossRef]
- Kintl, A.; Vítěz, T.; Huňady, I.; Sobotková, J.; Hammerschmiedt, T.; Vítězová, M.; Brtnický, M.; Holátko, J.; Elbl, J. Effect of Mycotoxins in Silage on Biogas Production. Bioengineering 2023, 10, 1387. [Google Scholar] [CrossRef] [PubMed]
- Kupryaniuk, K.; Witaszek, K.; Vaskina, I.; Filipek-Kaźmierczak, S.; Kupryaniuk, J.; Sołowiej, P.; Dach, J. The Effect of Corn Ensiling Methods on Digestibility and Biogas Yield. Energies 2025, 18, 188. [Google Scholar] [CrossRef]
- Xue, X.; Tian, H.; Zhao, K.; Yu, Y.; Xiao, Z.; Zhuo, C.; Sun, J. Rapid Lactic Acid Content Detection in Secondary Fermentation of Maize Silage Using Colorimetric Sensor Array Combined with Hyperspectral Imaging. Agriculture 2024, 14, 1653. [Google Scholar] [CrossRef]
- Moll, V.; Beć, K.B.; Grabska, J.; Huck, C.W. Investigation of Water Interaction with Polymer Matrices by Near-Infrared (NIR) Spectroscopy. Molecules 2022, 27, 5882. [Google Scholar] [CrossRef] [PubMed] [PubMed Central]
- Roger, J.M.; Mallet, A.; Marini, F. Preprocessing NIR Spectra for Aquaphotomics. Molecules 2022, 27, 6795. [Google Scholar] [CrossRef] [PubMed] [PubMed Central]
- Saager, R.B.; Cuccia, D.J.; Durkin, A.J. Determination of optical properties of turbid media spanning visible and near-infrared regimes via spatially modulated quantitative spectroscopy. J. Biomed. Opt. 2010, 15, 017012. [Google Scholar] [CrossRef] [PubMed] [PubMed Central]
- Gál, L.; Paračková, P.; Kaliňáková, B.; Šimonová, S.; Reháková, M.; Čeppan, M. Microbial contaminated paper substrate: UV–Vis–NIR spectra of model systems. Chem. Pap. 2024, 78, 2603–2611. [Google Scholar] [CrossRef]
- Macedo, M.G.; Laporte, M.F.; Lacroix, C. Quantification of exopolysaccharide, lactic acid, and lactose concentrations in culture broth by near-infrared spectroscopy. J. Agric. Food Chem. 2002, 50, 1774–1779. [Google Scholar] [CrossRef] [PubMed]
- Păucean, A.; Vodnar, D.C.; Mureșan, V.; Fetea, F.; Ranga, F.; Man, S.M.; Muste, S.; Socaciu, C. Monitoring lactic acid concentrations by infrared spectroscopy: A new developed method for Lactobacillus fermenting media with potential food applications. Acta Aliment. 2017, 46, 420–427. [Google Scholar] [CrossRef]
- Sørensen, L.K. Prediction of Fermentation Parameters in Grass and Corn Silage by Near Infrared Spectroscopy. J. Dairy Sci. 2004, 87, 3826–3835. [Google Scholar] [CrossRef]


Disclaimer/Publisher’s Note: The statements, opinions and data contained in all publications are solely those of the individual author(s) and contributor(s) and not of MDPI and/or the editor(s). MDPI and/or the editor(s) disclaim responsibility for any injury to people or property resulting from any ideas, methods, instructions or products referred to in the content. |
© 2025 by the authors. Licensee MDPI, Basel, Switzerland. This article is an open access article distributed under the terms and conditions of the Creative Commons Attribution (CC BY) license (https://creativecommons.org/licenses/by/4.0/).