Abstract
The article analyses the hosting capacity of low-voltage (LV) power grids for connecting distributed energy sources (DER), mainly photovoltaic installations (PV), considering technical limitations imposed by power system operating conditions. The main objective of the research was to develop a simple equation that enables the quick estimation of the maximum power of an energy source that can be safely connected at a given point in the network without causing excessive voltage rise or overloading the transformer and line cable. The analysis was performed on the basis of relevant calculation formulas and simulations carried out in DIgSILENT PowerFactory, where a representative low-voltage grid model was developed. The network model included four transformer power ratings (40, 63, 100, and 160 kVA) and four cable cross-sections (25, 35, 50, and 70 mm2), which made it possible to assess the impact of these parameters on grid hosting capacity as a function of the distance from the transformer station. Based on this, the PHCI indicator was developed to determine the hosting capacity of a low-voltage network, using only the transformer rating and the length and cross-section of the line for the calculations. A comparison of the results obtained using the proposed equation with detailed calculations showed that the approximation error does not exceed 15%, which confirms the high accuracy and practical applicability of the proposed approach.
1. Introduction
The rapid development of distributed energy can cause power supply problems in low-voltage (LV) networks [1,2]. Considering the intensive implementation of new and existing support systems for the development of renewable energy sources (RES) [3], as well as the falling prices of renewable energy technologies, a steady increase in the number of distributed sources installed at various points in the power system can be expected [4]. This situation indicates that the system is evolving from a centralised to a decentralised structure, in which distributed sources are beginning to play an increasingly important role [5,6]. Distribution system operators are constantly trying to determine the extent to which existing distribution networks are able to cope with future energy demand and energy generation without exceeding system limits [7,8] and the extent to which connection requests can be accepted [9]. High penetration of photovoltaic systems in low-voltage distribution networks can lead to power quality issues [10]. At the same time, the time mismatch between generation and loads hinders the local use of photovoltaic resources [11,12] and causes significant voltage deviations [13], and even interruptions [14], which threaten the security of the grid [15,16]. Today, power quality is not only a technical issue but also an economic and social concern [17]. In the case of so-called sensitive loads, failure to maintain power quality parameters, particularly voltage stability, can lead to malfunctioning of electrical devices, damage to them, and, in the case of the industrial sector, generate significant financial losses [18,19]. Poor power quality is estimated to cause annual financial losses of €100–150 billion in the European Union (EU), while preventive measures to avoid such high costs account for only a small percentage of this amount [20].
Accurate forecasting of the amounts of energy generated and consumed in the system is a key tool for effective energy resource management [21,22]. It also facilitates the management of potential surpluses or deficits in renewable energy generation [23]. The capacity of the low-voltage distribution network, from the point of view of sources, is defined as the maximum power of renewable energy sources that can be integrated into the network while meeting safety requirements [5,9]. Therefore, several attempts have been made to determine the hosting capacity of power grids [24,25,26]. Cerna et al. [27] proposed a programming model that improves the power grid load factor by evenly distributing residential, commercial, and industrial loads throughout the day. In [28], it was proposed to optimise flows through scheduling based on load priority. Koirala et al. [9] compare the deterministic approach (analysis of boundary scenarios) with the stochastic one (probabilistic, Monte Carlo) to assess which methods better reflect real network constraints. The method presented in [29] provides a significant acceleration of computations (better scalability) while maintaining a good level of solution quality (voltages, balance), although—as they note—there may be a risk of suboptimality compared to full models.
Although models and dependencies for calculating the connectable power of energy sources have existed for a long time, they are not widely used because they either require data that are difficult to obtain or are complicated and expensive to use [30]. Therefore, the authors attempted to define a simple equation that would enable the calculation of the hosting capacity at a given point in the low-voltage grid, which, due to the lack of need to obtain hard-to-find data, could be widely used by both prosumers and distribution system operators. The main objective of the study was to develop a simple index that would enable a quick estimation of the maximum power of an energy source that can be connected at a given point in a low-voltage network.
2. Materials and Methods
Verification of the possibility of connecting energy sources to the low-voltage grid consists of [31]:
- (1)
- checking the voltage changes:where ΔU%—percentage voltage change relative to the rated voltage, SE—apparent power of the analysed source, cosφE—power factor of the source, Rk, Xk—resistance and reactance of the power grid at the connection point, Un—rated voltage of the grid.
- (2)
- checking the rapid voltage changes caused by the activation of a single source (voltage fluctuations):where SkPCC—short-circuit power at the connection point, SE—apparent power of the analysed source, k—starting factor (ratio of the starting current of the source to its rated current). If accurate data for k are unavailable, a value of k = 1.2 can be assumed for photovoltaic systems.
- (3)
- checking the long-term current-carrying capacity of a power line:where IrAPCC—maximum current fed into the grid by existing and new sources, Iz—long-term current-carrying capacity of low-voltage lines.
- (4)
- checking the short-circuit strength of electrical power equipment,
- (5)
- verifying that the aggregate connection power of all existing and planned sources on the power line does not exceed the rated capacity of the transformer installed at the medium/low-voltage (MV/LV) substation.
The maximum power of a source that can be connected at the analysed point of the power grid without causing an excessive voltage rise can be expressed as follows [31]:
where ΔUmax%—maximum permissible percentage voltage change caused by the source operation (ΔUmax% = 3%), cosφE—power factor of the source, Rk, Xk—resistance and reactance of the grid at the connection point, and Un—rated voltage of the grid.
The following equation is more commonly used in practical analyses [32]:
where ΔUmax—maximum permissible absolute voltage change caused by the source operation (for LV networks: ΔUmax = 12 V), SkPCC—short-circuit power at the connection point, tgφE—rated power factor of the source, and tgφk—tangent of the short-circuit impedance angle at the connection point, calculated as the ratio of the network resistance to reactance.
Based on the results of statistical analyses, a simulation model of a representative low-voltage power grid was developed in DIgSILENT PowerFactory with the following parameters:
- connection point to the 15 kV grid with a short-circuit capacity of 100 MVA,
- low-voltage grid rated voltage: 0.4 kV,
- four transformer power variants:
- ○
- 40 kVA,
- ○
- 63 kVA,
- ○
- 100 kVA,
- ○
- 160 kVA,
- Four variants of cross-sections of overhead XLPE-insulated aerial cable lines leaving the power station:
- ○
- AsXSn 4 × 25 mm2,
- ○
- AsXSn 4 × 35 mm2,
- ○
- AsXSn 4 × 50 mm2,
- ○
- AsXSn 4 × 70 mm2,
- each line departing from the transformer station is 2 km in length,
- each line includes 20 customers spaced at equal intervals of 0.1 km,
- each low-voltage line node (80 nodes in total) connected to a load with adjustable active and reactive power,
- each low-voltage line node connected to a power source with adjustable active and reactive power (a total of 80 power sources).
As part of the hosting capacity simulation studies, four variants of the sample LV power grid configuration were analysed, each consisting of four combinations:
- option W01—network powered by a 40 kVA MV/LV transformer, with AsXSn cables with cross-sections of 25 mm2, 35 mm2, 50 mm2 and 70 mm2 used in the lines,
- option W02—network powered by a 63 kVA MV/LV transformer, with AsXSn cables with cross-sections of 25 mm2, 35 mm2, 50 mm2 and 70 mm2 used in the lines,
- option W03—network powered by a 100 kVA MV/LV transformer, with AsXSn cables with cross-sections of 25 mm2, 35 mm2, 50 mm2 and 70 mm2 used in the lines,
- option W04—network powered by a 160 kVA MV/LV transformer, with AsXSn cables with cross-sections of 25 mm2, 35 mm2, 50 mm2 and 70 mm2 used in the lines.
3. Results and Discussion
In order to calculate the maximum power values of the energy source that can be connected at individual points of the power grid without causing excessive voltage rise, the short-circuit power values SkPCC (Figure 1, Figure 2, Figure 3 and Figure 4) and the tangent of the short-circuit impedance angle tgφk (Figure 5, Figure 6, Figure 7 and Figure 8) were determined for all nodes of the analysed low-voltage power grid.
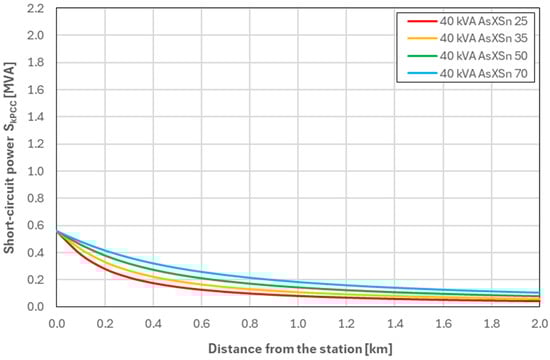
Figure 1.
Values of SkPCC as a function of the distance from the MV/LV substation—for a network equipped with a 40 kVA transformer (Variant W01).
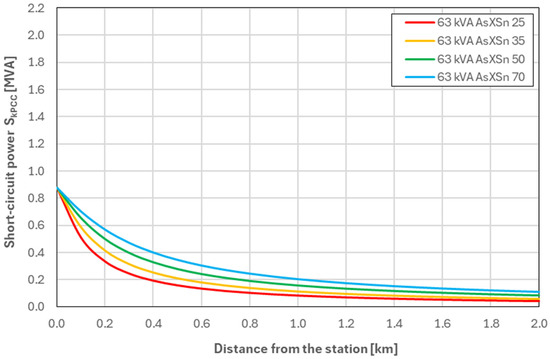
Figure 2.
Values of SkPCC as a function of the distance from the MV/LV substation—for a network equipped with a 63 kVA transformer (Variant W02).
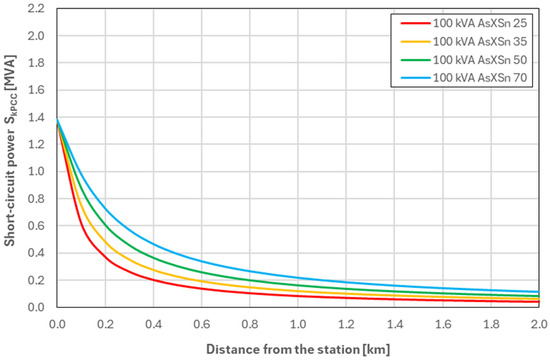
Figure 3.
Values of SkPCC as a function of the distance from the MV/LV substation—for a network equipped with a 100 kVA transformer (Variant W03).
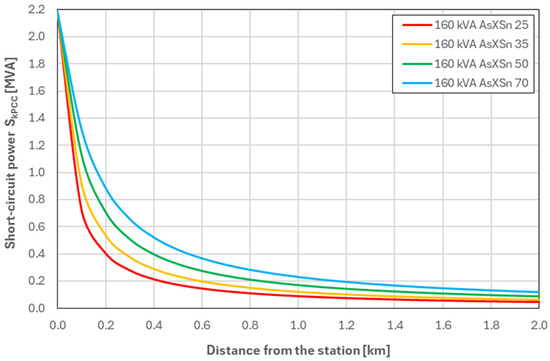
Figure 4.
Values of SkPCC as a function of the distance from the MV/LV substation—for a network equipped with a 160 kVA transformer (Variant W04).
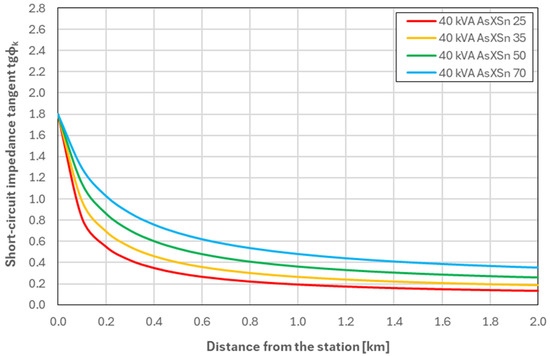
Figure 5.
Values of tgφk as a function of the distance from the MV/LV substation—for a network equipped with a 40 kVA transformer (Variant W01).
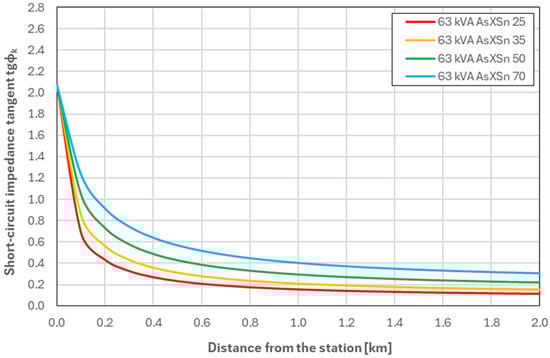
Figure 6.
Values of tgφk as a function of the distance from the MV/LV substation—for a network equipped with a 63 kVA transformer (Variant W02).
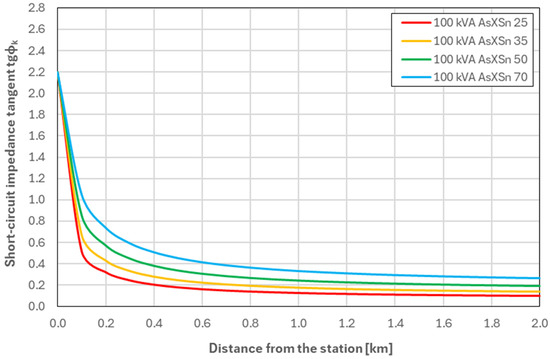
Figure 7.
Values of tgφk as a function of the distance from the MV/LV substation—for a network equipped with a 100 kVA transformer (Variant W03).
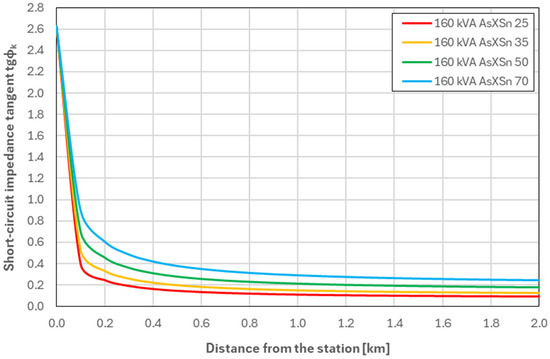
Figure 8.
Values of tgφk as a function of the distance from the MV/LV substation—for a network equipped with a 160 kVA transformer (Variant W04).
Analysis of the waveforms presented in Figure 1, Figure 2, Figure 3 and Figure 4, reveals a clear correlation between the transformer power and the short-circuit power values at the connection point (SkPCC). For Variant W01, which employs a 40 kVA transformer, the SkPCC values are the lowest and decrease rapidly with increasing distance from the MV/LV substation. This indicates that networks with such transformers are highly sensitive to voltage fluctuations and exhibit relatively low stability. In Variant W02 (63 kVA transformer), the curve follows a similar trend but with higher SkPCC values across the entire distance range. The most favourable performance is observed for variant W04, which uses a 160 kVA transformer, where SkPCC values are the highest and their variation with distance is minimal. The network in this variant is characterised by the highest power transmission capacity and the least influence of distance from the station on operating parameters. Comparing all variants, it can be concluded that as the transformer power increases, the operating conditions of the low-voltage network improve, which translates into lower voltage fluctuations and greater power supply stability.
Analysis of the waveforms presented in Figure 5, Figure 6, Figure 7 and Figure 8, which illustrate changes in the short-circuit impedance angle tangent tgφk as a function of distance from the MV/LV station, reveals a clear correlation between transformer power and the nature of changes in this parameter. In variant W01, corresponding to a 40 kVA transformer, the tgφk values are the lowest at the station (compared to the other variants) but exhibit a gentler decline with increasing distance from the station. In variant W02, which uses a 63 kVA transformer, the tgφk curve becomes more even after exceeding 1 km of line length. Variant W03 with a 100 kVA transformer is characterised by an even more stable tgφk curve (levelling occurs after approximately 600 m). The highest tgφk values near the station were obtained for variant W04, but with distance there is a significant decrease in tgφk, which stabilises after approximately 400 m.
Based on the previously calculated values of short-circuit power SkPCC and short-circuit impedance angle tangent tgφk, as well as Equation (5), the values of maximum source power Pmax that can be connected at individual points of the power grid without causing excessive voltage rise were calculated. For the calculations, it was assumed that the sources would only produce active power: cosφE = 1 (tgφE = 0). The results of the calculations are shown in Figure 9, Figure 10, Figure 11 and Figure 12.
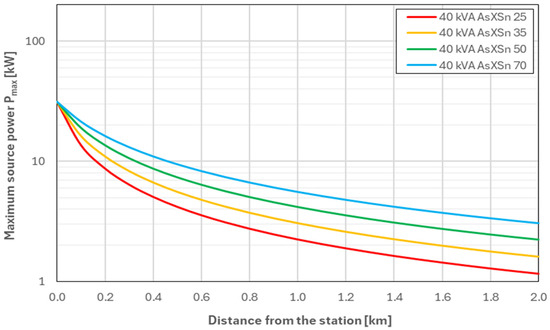
Figure 9.
Values of Pmax as a function of the distance from the MV/LV substation—for a network equipped with a 40 kVA transformer (Variant W01).
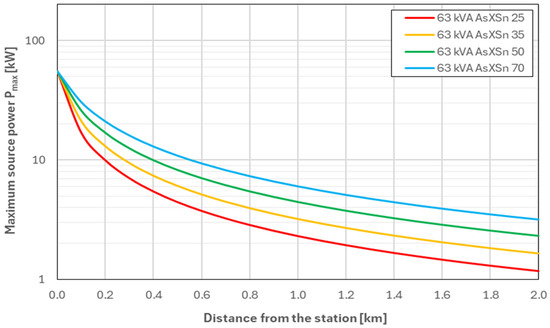
Figure 10.
Values of Pmax as a function of the distance from the MV/LV substation—for a network equipped with a 63 kVA transformer (Variant W02).
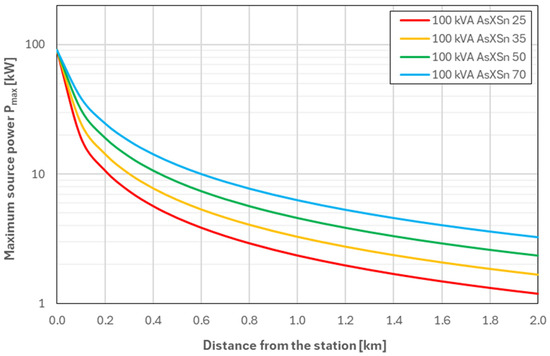
Figure 11.
Values of Pmax as a function of the distance from the MV/LV substation—for a network equipped with a 100 kVA transformer (Variant W03).
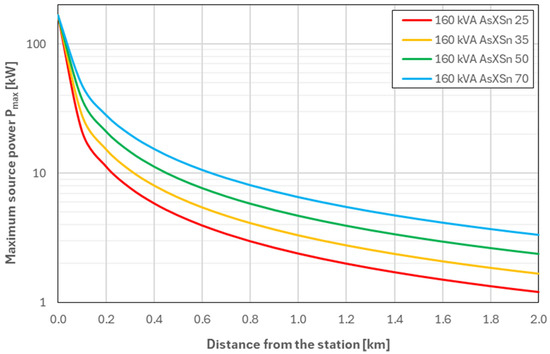
Figure 12.
Values of Pmax as a function of the distance from the MV/LV substation—for a network equipped with a 160 kVA transformer (Variant W04).
The analysis of the maximum source power values Pmax presented in Figure 9, Figure 10, Figure 11 and Figure 12 allows for a clear assessment of the impact of transformer power and conductor cross-section on the hosting capacity of LV networks.
In the case of variant W01 (40 kVA, Figure 9), the lowest Pmax values are observed across the entire analysed line length. At the substation, the hosting capacity reaches 31.5 kW, whereas at a distance of 0.5 km it decreases (depending on cable cross-section) to 4.2–9.5 kW. At the end of the analysed line (2 km), these values decrease to 1.17–3.06 kW, confirming that networks supplied by a 40 kVA transformer exhibit very limited hosting capacity in distant points of the line.
Variant W02 (63 kVA, Figure 10) is characterised by noticeably higher hosting capacity. At the station, the Pmax value is 55 kW, which is almost 75% more than for the 40 kVA transformer. More distant points of the line also show improved parameters—at a distance of 0.5 km from the station, it is possible to connect sources with a power of 4.5–11 kW, and at 2 km with 1.19–3.2 kW. This indicates that at greater distances from the station, the change in transformer power does not exhibit a significant impact on the hosting capacity, and the main factor here is the line impedance.
Even more favourable conditions are observed in variant W03 (100 kVA, Figure 11). In the immediate vicinity of the station, it is possible to connect a 91 kW source, while at a distance of 0.5 km, 4.6–12 kW is still available, which is on average 18% more than in the case of a 40 kVA transformer. At the end of the line (2 km), Pmax reaches 1.2–3.27 kW.
The highest Pmax values were obtained for variant W04 (160 kVA, Figure 12). At the connection point located right next to the station, it is possible to connect a 167 kW source, which corresponds to an increase of 83.5% compared to a 100 kVA transformer. At a distance of 0.5 km, it is possible to connect sources with a power of 4.7–12.5 kW, while at the end of the line, 1.21–3.35 kW, which is the highest value among all the configurations analysed.
The obtained results clearly confirm that both the transformer power and the conductor cross-section are parameters of key importance for assessing the possibility of connecting energy sources to LV networks. It is worth emphasising that in all variants two key tendencies are visible:
- increasing the transformer power significantly improves the hosting capacity only at a short distance from the substation (up to approximately 0.5 km),
- the impact of increasing the conductor cross-section on the hosting capacity of sources is much greater at the end of the line than at the beginning of the line.
The methods described in the literature for calculating the power generated in a given low-voltage power line are quite complex [33]. In [34], highlighted the non-linear relationships among variables in the power flow equation. Umoh et al. [30,35,36] emphasised the need to use specialised, expensive software. Furthermore, calculating the maximum connection power Pmax based on Equation (5) requires knowledge of a lot of data that are difficult to obtain. Therefore, in order to facilitate the application of the equation, certain simplifications must be made. Firstly, it was assumed that the power factor of the source is cosφE = 1 (tgφE = 0), which is characteristic of photovoltaic installations, which constitute the majority of RES installed in low-voltage grids. Another simplifying assumption was to omit the impedance of the medium-voltage (MV) power system in the replacement model. In this case, the short-circuit impedance Zk, represented indirectly by the short-circuit power SkPCC, will consist of the series-connected impedances of the transformer ZT and the section of the line ZL from the transformer to the connection point. In this case, the short-circuit power can be expressed as follows:
where ZT—complex impedance of the MV/LV transformer, ZL—complex impedance of the LV line from the transformer to the connection point, RT, XT—resistance and reactance of the MV/LV transformer, RL, XL—resistance and reactance of the LV line from the transformer to the connection point, ST—rated power of the MV/LV transformer, ΔPCu—rated load losses of the MV/LV transformer, ΔUZ—rated short-circuit voltage of the MV/LV transformer, s—cross-section of LV line conductors, γ—conductivity of LV line conductors, X0—unit reactance of the LV line, l—length of the LV line from the transformer to the connection point.
Using the equivalent parameters of the power network elements, the tangent of the short-circuit impedance angle at the source connection point can also be expressed as follows:
After substitution and simplification, we obtain:
Furthermore, certain quantities can be considered approximately constant; therefore, the following assumptions were made:
- rated voltage of low-voltage network: Un = 400 V,
- conductivity for aluminium wires: γ = 35 m/(Ωmm2),
- rated load losses of the MV/LV transformer: ΔPCu ≈ 20·ST.
Considering the above simplifications, the equation describing the value of the hosting capacity indicator PHCI, which represents the maximum power of a source that can be connected at a specific point in the power network, takes the following form:
where ΔUmax—maximum permissible voltage change caused by the source operation [V], ST—rated power of the MV/LV transformer [kVA], s—cross-section of LV line cables [mm2], l—length of the LV line from the transformer to the connection point [km].
The above indicator relies solely on the permissible voltage variation criterion and does not consider the current-carrying capacity of the transformer and distribution cables. As shown by the analysis presented in [37], some values of the maximum connection power Pmax exceed both the maximum power of the transformer and the long-term ampacity of the cables (especially near the transformer station). Therefore, these indicators should be supplemented with the load capacity conditions of these devices, and then the maximum connection power must meet three conditions simultaneously:
The values of the PHCI indicators described by Equation (10) are correct under the assumption that no other energy sources or storage units are connected to the analysed LV power network. Previous studies and analyses conducted by the authors have shown that existing energy sources connected to the analysed line reduce the hosting capacity, and this influence is strongly dependent on the location of their connection and decreases with decreasing distance from the transformer station. Connecting an additional energy source at the MV/LV substation has a negligible effect on reducing the hosting capacity deeper in the network. This effect increases linearly up to the point of the considered connection, reaching 100% of the additional energy source’s power. Beyond this point, the hosting capacity remains approximately constant. An analogous but opposite relationship occurs when storage units are connected. The connection of an energy storage system increases the hosting capacity. This effect is strongly dependent on the storage unit’s connection point—it decreases with decreasing distance from the transformer station. Connecting a storage unit at the MV/LV substation has a negligible effect on increasing the hosting capacity deeper in the network. Based on this, the influence of existing energy sources and storage units on the network’s hosting capacity can be described as follows:
where —power of the i-th existing energy source connected to the analysed LV power line, —power of the i-th existing energy storage connected to the analysed LV power line, —power of the i-th existing energy source connected to the analysed MV/LV transformer, —power of the existing energy storage connected to the analysed MV/LV transformer, —number of existing energy sources connected to the analysed LV power line, —number of existing energy storage connected to the analysed LV power line, —number of existing energy sources connected to the analysed MV/LV transformer, —number of existing energy storage connected to the analysed MV/LV transformer, —distance of the i-th existing energy source from the transformer station, —distance of the i-th existing energy storage from the transformer station, —length of the LV line from the transformer to the connection point.
Those indicated in Equations (10) and (11) are innovative, and therefore it was necessary to determine the error associated with their use. As part of the analysis of the effectiveness of the PHCI indicator, tests were carried out to determine the accuracy of the approximation of the maximum connection power in relation to the detailed equation (Equation (5)), by calculating the percentage error:
The parameter values of individual transformers (from different manufacturers) vary within the same rated power. Therefore, the analysis of PHCI indicator approximation errors was carried out for the average rated parameters of MV/LV transformers available on the Polish market, based on measurement data from a set of 1780 MV/LV transformers located within two selected energy regions in the Podlaskie Province. The calculated percentage approximation error used in computing the PHCI indicator is shown in Figure 13.
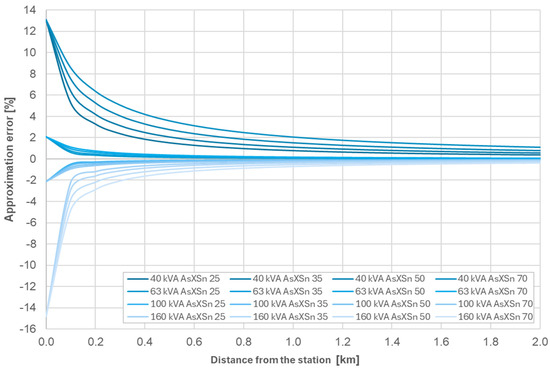
Figure 13.
Percentage approximation error values of the PHCI indicator for the average rated parameters of MV/LV transformers.
When analysing the waveforms shown in Figure 13, moderate error fluctuations are observed for greater distances between the source and the transformer station (above 400 m). The largest approximation errors occur in the immediate vicinity of the station; however, even in this case, they do not exceed 15%, with the smallest errors occurring for 63 kVA and 100 kVA transformers. The percentage errors are therefore relatively low, which means that the simplifications adopted in developing the equation for calculating PHCI allow the power that can be connected at a given point to be calculated with sufficient accuracy (compared to the detailed formulas).
4. Conclusions
The simulation results showed a clear correlation between transformer power and the stability of network operating parameters. As transformer power increased, the short-circuit power at the connection points also increased, resulting in lower voltage fluctuations and greater power supply stability. Networks with lower power transformers, especially 40 kVA units, were characterised by significant limitations regarding the possible connection power of distributed energy sources, especially at points distant from the station. The use of higher-power transformers and cables with a larger cross-section, in contrast, allowed for the connection of a larger number of renewable energy sources and ensured better network operating conditions.
In order to simplify the assessment of hosting capacity, the PHCI indicator was developed, enabling quick estimation of the permissible hosting capacity as a function of distance from the station, transformer capacity, and cable cross-section. This innovative indicator can be easily applied in practice without the need for complicated calculations. A comparison of the results obtained using the PHCI indicator with accurate calculations showed that the approximation error does not exceed 15%, which confirms the high accuracy and practical usefulness of the proposed approach. The developed method is an effective tool to support the planning of low-voltage network development, helping distribution system operators to assess the technical feasibility of connecting new photovoltaic installations and other renewable energy sources.
In future research, the authors intend to develop an indicator enabling the estimation of the power of a renewable energy source that can be connected to a medium-voltage grid.
Author Contributions
Conceptualisation, G.H. and A.F.; methodology, G.H.; software, Z.S.; validation, G.H.; formal analysis, G.H.; investigation, A.F.; resources, G.H. and A.F.; data curation, Z.S.; writing—original draft preparation, G.H.; writing—review and editing, Z.S. and A.F.; visualisation, G.H. and Z.S.; supervision, G.H.; project administration, Z.S.; funding acquisition, A.F. All authors have read and agreed to the published version of the manuscript.
Funding
This research was funded by The National Centre for Research and Development of the Republic of Poland, grant number GOSPOSTRATEG9/000D/2022 from 27 June 2023, “The Energy Transition Observatory as an instrument for supporting Poland’s socio-economic development (OTE)”.
Data Availability Statement
The original contributions presented in this study are included in the article. Further inquiries can be directed to the corresponding author.
Conflicts of Interest
The authors declare no conflicts of interest.
References
- Zeraati, M.; Golshan, M.E.H.; Guerrero, J.M. Voltage Quality Improvement in Low Voltage Distribution Networks Using Reactive Power Capability of Single-Phase PV Inverters. IEEE Trans. Smart Grid 2019, 10, 5057–5065. [Google Scholar] [CrossRef]
- Chai, Y.Y.; Guo, L. Distributed Voltage Control of Distribution Network with High Penetration Photovoltaics. Power Syst. Technol. 2018, 42, 738–746. [Google Scholar] [CrossRef]
- Cader, J.; Olczak, P.; Koneczna, R. Regional dependencies of interest in the “My Electricity” photovoltaic subsidy program in Poland. Polityka Energetyczna—Energy Policy J. 2021, 24, 97–116. [Google Scholar] [CrossRef]
- Juarez-Perez, E.J.; Momblona, C.; Casas, R.; Haro, M. Enhanced power-point tracking for high hysteresis perovskite solar cells with a galvanostatic approach. Cell Rep. Phys. Sci. 2024, 5, 101885. [Google Scholar] [CrossRef]
- Al-Saffar, M.; Musilek, P. Reinforcement learning-based distributed BESS management for mitigating overvoltage issues in systems with high PV penetration. IEEE Trans. Smart Grid 2020, 11, 2980–2994. [Google Scholar] [CrossRef]
- Hołdyński, G.; Skibko, Z.; Walendziuk, W. Power and Energy Losses in Medium-Voltage Power Grids as a Function of Current Asymmetry—An Example from Poland. Energies 2024, 17, 3706. [Google Scholar] [CrossRef]
- Liu, B.; Braslavsky, J.H. Robust Dynamic Operating Envelopes for DER Integration in Unbalanced Distribution Networks. IEEE Trans. Power Syst. 2024, 39, 3921–3936. [Google Scholar] [CrossRef]
- Gandhi, O.; Kumar, D.S.; Rodriguez-Gallegos, C.; Srinivasan, D. Review of power system impacts at high PV penetration Part I: Factors limiting PV penetration. Sol. Energy 2020, 210, 181–201. [Google Scholar] [CrossRef]
- Koirala, A.; Van Acker, T.; D’hulst, R.; Van Hertem, D. Hosting capacity of photovoltaic systems in low voltage distribution systems: A benchmark of deterministic and stochastic approaches. Renew. Sustain. Energy Rev. 2022, 15, 111899. [Google Scholar] [CrossRef]
- Hołdyński, G.; Skibko, Z.; Borusiewicz, A.; Marczuk, A.; Koniuszy, A. Effect of Reactive Power Generation in Photovoltaic Installations on the Voltage Value at the Inverter Connection Point. Energies 2024, 17, 4863. [Google Scholar] [CrossRef]
- Zhang, Z.; Zhang, Y.; Yue, D.; Dou, C.; Ding, L.; Tan, D. Voltage Regulation with High Penetration of Low-Carbon Energy in Distribution Networks: A Source–Grid–Load-Collaboration-Based Perspective. IEEE Trans. Ind. Inform. 2022, 18, 3987–3999. [Google Scholar] [CrossRef]
- Gao, Y.; Ai, Q.; Yousif, M.; Wang, X. Source-load-storage consistency collaborative optimization control of flexible DC distribution network considering multi-energy complementarity. Int. J. Electr. Power Energy Syst. 2018, 107, 273–281. [Google Scholar] [CrossRef]
- Mishra, S.; Mallick, R.K.; Nayak, P.; Ramasamy, T.N.; Panda, G. Dynamic power quality disturbance classification in grid-integrated PV systems: Leveraging clark transformed modal voltage and subspace weighted KNN. IEEE Access 2024, 12, 116572–116586. [Google Scholar] [CrossRef]
- Saxena, V.; Kumar, N.; Singh, B.; Panigrahi, B.K. A voltage support control strategy for grid integrated solar PV system during abnormal grid conditions utilizing interweaved GI. IEEE Trans. Ind. Electron. 2020, 68, 8149–8157. [Google Scholar] [CrossRef]
- Murray, W.; Adonis, M.; Raji, A. Voltage control in future electrical distribution networks. Renew. Sustain. Energy Rev. 2021, 146, 111100. [Google Scholar] [CrossRef]
- Azizivahed, A.; Arefi, A.; Ghavidel, S.; Shafie-Khah, M.; Li, L.; Zhang, J.; Catalao, J.P.S. Energy management strategy in dynamic distribution network reconfiguration considering renewable energy resources and storage. IEEE Trans. Sustain. Energy 2019, 11, 662–673. [Google Scholar] [CrossRef]
- Suproniuk, M.; Skibko, Z.; Stachno, A. Diagnostics of some parameters of electricity generated in wind farms. Przegląd Elektrotechniczny 2019, 95, 107–110. [Google Scholar] [CrossRef]
- Zhang, Y.; Zhang, L.; Liu, B.; Chen, J.; Yao, W. Voltage Sag Sensitive Load Type Identification Based on Power Quality Monitoring Data. Int. J. Electr. Power Energy Syst. 2024, 158, 109936. [Google Scholar] [CrossRef]
- Liubčuk, V.; Radziukynas, V.; Kairaitis, G.; Naujokaitis, D. Power Quality Impact and Its Assessment: A Review and a Survey of Lithuanian Industrial Companies. Inventions 2025, 10, 30. [Google Scholar] [CrossRef]
- Lennerhag, O.; Bollen, M.; Ackeby, S.; Rönnnberg, S. Voltage Variations and Intermittent Production; report 14:42; Elforsk: Stockholm, Sweden, July 2014. (In Swedish) [Google Scholar]
- Ahmad, T.; Zhang, H.; Yan, B. A Review on Renewable Energy and Electricity Requirement Forecasting Models for Smart Grid and Buildings. Sustain. Cities Soc. 2020, 55, 102052. [Google Scholar] [CrossRef]
- Seyedzadeh, S.; Rahimian, F.P.; Glesk, I.; Roper, M. Machine Learning for Estimation of Building Energy Consumption and Performance: A Review. Vis. Eng. 2018, 6, 5. [Google Scholar] [CrossRef]
- Sharma, V.; Cortes, A.; Cali, U. Use of Forecasting in Energy Storage Applications: A Review. IEEE Access 2021, 9, 114690–114704. [Google Scholar] [CrossRef]
- Sun, S.; Yang, S.; Yu, P.; Cheng, Y.; Xing, J.; Wang, Y.; Yi, Y.; Hu, Z.; Yao, L.; Pang, X. A Reinforcement Learning-Based Approach for Distributed Photovoltaic Carrying Capacity Analysis in Distribution Grids. Energies 2025, 18, 5029. [Google Scholar] [CrossRef]
- Tang, Y.; Han, Y.; Zhang, W.; Jin, D.; Gao, S.; Zhang, J. Research on Distributed Generation Access to Distribution Network for Siting and Capacity Determination and Reactive Power Optimization. In Proceedings of the 2025 2nd International Symposium on New Energy Technologies and Power Systems (NETPS), Hangzhou, China, 23–25 May 2025; pp. 62–69. [Google Scholar] [CrossRef]
- Lu, J.; Du, H.; Zhao, R.; Li, H.; Tan, Y.; Guo, W. Optimal Scheduling of the Active Distribution Network with Microgrids Considering Multi-Timescale Source-Load Forecasting. Electronics 2024, 13, 3455. [Google Scholar] [CrossRef]
- Cerna, F.V.; Coêlho, J.K.; Fantesia, M.P.; Naderi, E.; Marzband, M.; Contreras, J. Load factor improvement of the electricity grid considering distributed energy resources operation and regulation of peak load. Sustain. Cities Soc. 2023, 98, 104802. [Google Scholar] [CrossRef]
- Wang, X.; Li, F.; Dong, J.; Olama, M.M.; Zhang, Q.; Shi, Q.; Park, B.; Kuruganti, T. Tri-level scheduling model considering residential demand flexibility of aggregated HVACs and EVs under distribution LMP. IEEE Trans. Smart Grid 2021, 12, 3990–4002. [Google Scholar] [CrossRef]
- Antic, T.; Keane, A.; Capuder, T. Solving scalability issues in calculating PV hosting capacity in low voltage distribution networks. arXiv 2023, arXiv:2301.12345. [Google Scholar] [CrossRef]
- Umoh, V.; Davidson, I.; Adebiyi, A.; Ekpe, U. Methods and Tools for PV and EV Hosting Capacity Determination in Low Voltage Distribution Networks—A Review. Energies 2023, 16, 3609. [Google Scholar] [CrossRef]
- Connection Criteria and Technical Requirements for Micro and Small Installations Connected to the Low-Voltage Distribution Network of the Distribution System Operator. Polish Society for Transmission and Distribution of El-Electric Energy. Poznań. 11 August 2014. Available online: https://www.google.com/url?sa=t&source=web&rct=j&opi=89978449&url=https://pgedystrybucja.pl/content/download/acd5ed458bf33f88db89590a78d73af4/file/Kryt_oc_przyl_wytw_nN.pdf%3FinLanguage%3Dpol-PL%26version%3D2%26contentId%3D1041&ved=2ahUKEwjsgtid4peRAxWeAtsEHcKZG20QFnoECBoQAQ&usg=AOvVaw0bdIg8KkYECuH-_Y0XIrOZ (accessed on 20 October 2025). (In Polish).
- Lubośny, Z. Wind Power Plants in the Electric Power System; Scientific and Technical Publishers: Warsaw, Poland, 2007. (In Polish) [Google Scholar]
- Qi, X.G.; Xi, P.; Liu, H.; Xu, Z. Analysis of Distribution Network’s Acceptance Capacity for Distributed Photovoltaics. Adv. Electr. Power Energy 2017, 5, 143–152. [Google Scholar] [CrossRef]
- Yuan, J.; Weng, Y.; Tan, C.-W. Determining Maximum Hosting Capacity for PV Systems in Distribution Grids. Int. J. Electr. Power Energy Syst. 2022, 135, 107342. [Google Scholar] [CrossRef]
- Muñoz-Delgado, G.; Contreras, J.; Arroyo, J.M. Multistage generation and network expansion planning in distribution systems considering uncertainty and reliability. IEEE Trans. Power Syst. 2016, 5, 3715–3728. [Google Scholar] [CrossRef]
- Zakariazadeh, A.; Jadid, S.; Siano, P. Stochastic multi-objective operational planning of smart distribution systems considering demand response programs. Electr. Power Syst. Res. 2014, 111, 156–168. [Google Scholar] [CrossRef]
- Modi, G.; Singh, B. Power quality improvement in solar energy conversion system integrated to weak ac grid. J. Inst. Eng. Ser. B 2024, 105, 1511–1526. [Google Scholar] [CrossRef]
Disclaimer/Publisher’s Note: The statements, opinions and data contained in all publications are solely those of the individual author(s) and contributor(s) and not of MDPI and/or the editor(s). MDPI and/or the editor(s) disclaim responsibility for any injury to people or property resulting from any ideas, methods, instructions or products referred to in the content. |
© 2025 by the authors. Licensee MDPI, Basel, Switzerland. This article is an open access article distributed under the terms and conditions of the Creative Commons Attribution (CC BY) license (https://creativecommons.org/licenses/by/4.0/).