Abstract
The high proportion of renewable energy connected to the grid poses new challenges to the safe and economic operation of active distribution networks (ADNs). However, most of the existing research focuses on single-objective optimization or ignores the influence of the uncertainty of renewable energy output and the demand response mechanism, and lacks verification of the scalability of models in large-scale systems. For an active distribution network system with distributed wind power and photovoltaic access, this paper establishes a multi-objective day-ahead optimal dispatching model that takes into account economy, reliability, and safety. The research adopts a scenario-based method and chance-constrained programming (CCP) to handle the uncertainty of wind and solar output. It combines the quasi-Monte Carlo (QMC) method and Kantorovich distance to achieve scenario generation and reduction, and introduces price-based and incentivized demand response mechanisms to form four combined optimization models. The multi-objective optimization solution was carried out based on the multi-objective evolutionary algorithm based on decomposition (MOEA/D), verifying the effectiveness of the proposed method in terms of operation cost, load shedding expectation, and node voltage limit control. The case study is based on the improved IEEE 30-node and 200-node 49-generator systems. The results indicate that this method can effectively balance multiple objectives such as operation costs, load shedding expectations, and node voltage limit; can significantly enhance the renewable energy consumption capacity of active distribution networks; and can provide an effective solution for the optimal dispatching of active distribution networks with a high proportion of renewable energy.
1. Introduction
Energy is the foundation of economic and social development. With the depletion of fossil energy and the intensification of environmental problems, the development of renewable energy has become a key approach to addressing the energy crisis and climate change. Among them, wind energy and solar energy have the greatest potential for sustainable development.
According to the reports of the China Renewable Energy Engineering Institute [] and the China Electricity Council [], China has consistently maintained global leadership in renewable energy development, with its installed capacity of wind power and photovoltaic power ranking first in the world for many consecutive years. However, due to the randomness and fluctuation of wind power and photovoltaic power generation, as well as the limitations of traditional energy storage technologies, some renewable energy sources still have a relatively high abandonment rate. Data from the National New Energy Consumption Monitoring and Early Warning Center [] show that the utilization rate of wind power and photovoltaic power in some regions of China remains low, and the abandonment of wind and solar power is still serious. If the abandoned electricity can be fully utilized, it will bring about significant economic and social benefits []. These challenges have prompted scholars to conduct extensive research on methods to improve renewable energy integration and system optimization dispatching strategies.
Unlike traditional power system dispatch, the incorporation of highly volatile and stochastic wind and photovoltaic power transforms the problem into one of stochastic optimization. In traditional optimization dispatching problems, since thermal power is controllable by humans, the optimization problem is deterministic, and the constraints are also deterministic. However, in cases involving wind and solar generating units and other renewable energy units, due to the uncertainty of wind and solar energy, the power output of the units is no longer certain, and the optimization problem becomes stochastic optimization. The methods for handling stochastic optimization problems are mainly divided into two types: robust optimization and methods that convert stochastic optimization problems into deterministic optimization problems, including chance-constrained programming and scenario-based methods.
Among these three types of optimization methods, robust optimization pursues decision stability as well as worst-case feasibility, and it does not require detailed knowledge of the distribution probability of uncertain variables. Ref. [] proposed a two-stage robust optimization method for hydrogen energy systems considering offshore wind power hydrogen production and multi-type demand response. Ref. [] proposed a data-driven decentralized robust optimization (DRO) method in the context of solving the scheduling problem of the electric–thermal–hydrogen integrated energy system (ETH-IES) under source-load uncertainty. Ref. [] proposed a probabilistic power and energy balance risk scheduling method based on distributed robust optimization (DRO). Although robust optimization has strong conservatism and feasibility, it is difficult to reflect the probability characteristics of wind and solar output and will also lead to a decrease in economic efficiency.
With its ability to manage the uncertainties associated with renewable energy, CCP has become a widely recognized and applied stochastic optimization technique in power system dispatch. Its core idea is to allow the constraints to hold with a certain probability, thereby achieving a better balance between system safety and economy. Ref. [] established an economic dispatch problem for power systems with wind power based on CCP, using confidence level to describe the constraints and the objective function, which can effectively solve the stochasticity problem of wind power. Ref. [] established a multi-microgrid self-consistent energy system stochastic chance-constrained optimization configuration model to address the power supply problem for highway transportation infrastructures. However, CCP strikes a balance between economy and safety by setting confidence levels, and its results are relatively sensitive to confidence parameters.
The scenario-based approach is the mainstream method for handling the uncertainty of power generation from renewable sources. Its core lies in representing the probability distribution characteristics of random variables through a limited number of typical scenarios. Research in the areas of scenario generation and reduction techniques has made significant progress. Refs. [,,] all use the scenario-based method to handle the uncertainty of wind power, covering the statistical characteristics of prediction errors through multi-stage scenario trees, dynamically updating dispatch decisions using rolling planning, and minimizing costs through stochastic optimization. Ref. [] established an optimization operation model for the wind and solar power hydrogen production system using the scenario-based method. Ref. [] tackled the uncertainty issue arising from high wind–solar penetration by integrating a non-parametric kernel density estimation approach with a scenario generation method, which was used to model renewable energy variability and produce representative output scenarios. By optimizing dispatch decisions against a collection of scenarios, the solution generated by the scenario-based method is robust and performs well across many possible outcomes, not just the most likely one. This prevents the system from being overly vulnerable to unfavorable forecast errors. Hence, our proposed approach also focuses on this category of scenario-based methods.
To describe the uncertainty of wind and solar power output, existing studies generally adopt probability and statistics methods for stochastic modeling. Ref. [] adopted the Weibull distribution to model wind speed for calculating wind power output and cost and utilized the lognormal distribution to describe the uncertainty of photovoltaic power. Refs. [,,,] respectively adopted the Weibull distribution and Beta distribution to model the random characteristics of wind speed and photovoltaic output and verified the validity and applicability of the models through case studies. Existing studies show that Weibull distribution and Beta distribution can accurately and closely reflect the actual statistical characteristics of wind speed and photovoltaic output and have been widely applied in the research of wind and solar energy output modeling and scene generation. Due to the simplicity of modeling and high computational efficiency of this method, this paper still adopts this method to describe the uncertainty of wind energy and solar energy output.
On the solution techniques to the scenario-based stochastic optimizations, many researchers have turned to rely on intelligent algorithms recently. Commonly used intelligent algorithms include genetic algorithms, particle swarm algorithms, etc. Ref. [] proposed a method for configuring a hybrid renewable energy system based on multi-objective optimization. The research employed three multi-objective optimization algorithms (multi-objective Pareto search, MOGA, and hybrid MOGA) for solution comparison, effectively addressing the trade-off between the renewable energy penetration rate and system economic efficiency. Ref. [] addressed the design problem of a renewable energy hybrid system for off-grid electric vehicle charging stations (EVCSs) and proposed an innovative method based on multi-objective optimization. By comparing the performance of four multi-objective optimization algorithms (MOPSO, NSGA-II, NSGA-III, MOEA/D), the adaptability of the system under seasonal fluctuations was verified, providing a solution for the construction of renewable energy charging stations in remote areas.
In recent years, MOEA/D has been widely applied in the optimization of renewable energy systems and has demonstrated superior global search and multi-objective trade-off capabilities. Ref. [] proposed an improved MOEA/D algorithm (MOEA/D-P) based on probability distribution guidance to solve the three-objective layout optimization problem of wind power generation fields. Ref. [] formulated a bi-objective model aiming to minimize the loss of power supply probability (LPSP) and the cost of electricity (COE), which was solved using an improved decomposition-based multi-objective evolutionary algorithm (IMOEAD). Ref. [] proposed a two-stage temporal–spatial hedging strategy for a water–solar complementary system based on the MOEA/D-GABS algorithm. Ref. [] proposed the MOEA/D-MRA algorithm and demonstrated its effectiveness in solving the Ma-OPF problem. Although MOEA/D is widely used in the field of multi-objective optimization, it still has some limitations. MOEA/D relies on the information exchange among neighborhood individuals; if the neighborhood is not defined properly, it may fall to local optimum or lead to an unbalanced distribution of the solution set. Despite this, MOEA/D is still regarded as one of the representative algorithms for solving multi-objective optimization problems due to its clear structure, strong scalability, and the ability to balance global search and the distribution of solution sets. Especially in the multi-objective optimization scheduling of the active distribution network studied in this paper, there are significant conflicts among the objectives, such as economy, reliability and safety. The decomposition mechanism of MOEA/D can transform the multi-objective problem into multiple interrelated single-objective sub-problems for parallel optimization, thereby obtaining an evenly distributed Pareto solution set while ensuring computational efficiency. Therefore, considering the model complexity, algorithm stability, and interpretability comprehensively in this paper, the multi-objective optimization algorithm based on MOEA/D is still selected as the core solution method.
To address the above issues, the main contributions have been made for multi-objective optimal dispatching of active distribution networks with distributed wind and photovoltaic power integration. Firstly, regarding wind power and photovoltaic power modeling, Weibull distribution and Beta distribution are used to probabilistically model wind speed and sunlight intensity, providing a reliable data basis for subsequent stochastic optimization; secondly, regarding stochastic optimization methods, the scenario generation technology based on QMC method and Cholesky decomposition is proposed, combined with the backward reduction strategy of Kantorovich distance, effectively handling the uncertainty of wind and solar power output; finally, regarding optimization algorithms, the MOEA/D algorithm is applied to solve multi-objective optimization problems, achieving the collaborative optimization of economic, reliability, and safety goals. The case analysis shows that the proposed method can obtain high-quality Pareto solution sets in both the IEEE 30-node and 200-node 49-machine systems, verifying the effectiveness of the model and algorithm.
The remainder of this paper is organized as follows. Section 2 outlines the fundamental principles of active distribution network optimization, including the models for wind/photovoltaic power output and demand response. The stochastic optimization approach based on the scenario method is presented in Section 3, detailing the strategies for scenario generation and reduction. A multi-objective optimization scheduling model, along with its objective function and constraints, is established in Section 4. Section 5 conducts a case study using the IEEE 30-bus system. Section 6 analyzes the results and conducts an extended verification on a 200-node 49-generator system. Conclusions are provided in Section 7.
2. Fundamentals of Optimizing Operation for Active Distribution Networks
The active distribution network (ADN) is a multi-energy coupling system composed of distributed renewable energy, energy storage devices, and flexible loads. The goal of its optimized operation is to achieve a comprehensive coordination of economy, reliability, and safety under the condition of the uncertainty of renewable energy output. To this end, it is necessary to establish an optimized scheduling framework that simultaneously considers the source–load interaction and the characteristics of demand response. The core ideas of the active distribution network optimization operation studied in this paper can be summarized into the following three aspects as below.
- (1)
- Output models of distributed renewable energy sources
The randomness and fluctuation of wind power and photovoltaic power are described by establishing probability models. Common methods include Weibull distribution modeling for wind speed and Beta distribution modeling for solar irradiance to achieve statistical representation of the uncertainty of wind and solar output.
- (2)
- Model of Demand Respond
Demand response (DR) is an important component of the active distribution network. By introducing two types of demand response mechanisms, namely those based on price and those based on incentives, peak shaving and valley filling of loads as well as adaptive adjustment can be achieved, thereby enhancing the flexibility and stability of the system in responding to fluctuations in wind and solar output.
- (3)
- Optimize the scheduling framework
The optimal dispatching of active distribution networks is usually described as a multi-objective optimization problem, with the aim of achieving a balance among economy, reliability, and safety. Due to the randomness of wind and solar power output, in the subsequent chapters of this paper, the stochastic optimization method (Section 3) and MOEA/D (Section 4) will be respectively adopted for modeling and solution to construct a complete multi-objective day-ahead optimization scheduling system.
The overall research idea and process of the multi-objective optimization dispatching of the active distribution network is presented in Figure 1, covering the main links such as data input, random scene modeling, and optimization solution.
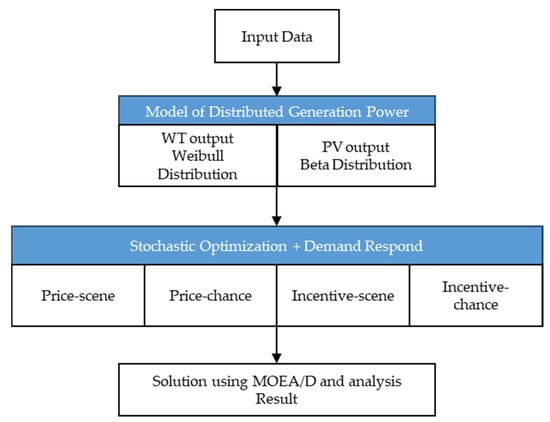
Figure 1.
Process of the multi-objective optimization dispatching of the ADN.
2.1. Output Models of Distributed Energy Sources
2.1.1. Generation Output Prediction Model of Wind Turbine
This paper uses the Weibull distribution to simulate wind speed data. When the wind speed has been estimated, the wind turbine output model is given in Equation (1) []:
where is the output power of the wind turbine, is the rated output power of the wind turbine, is the cut-in wind speed of the wind turbine, is the cut-out wind speed, and is the rated wind speed.
2.1.2. Generation Output Prediction Model of Photovoltaic
As known from Ref. [], under illumination, the probability density of light intensity roughly obeys the Beta distribution, and the photovoltaic output power also satisfies the Beta distribution, as in Equation (2):
where is the photovoltaic output power, is the maximum photovoltaic output power, Γ denotes the gamma function, and and are two parameters in the Beta distribution, which can be calculated by Equation (3) and Equation (4), respectively []:
where, is the average for the historic data of light intensity and is the standard deviation.
2.2. Model of Demand Response
As the load controllability in the smart power grid strengthens, demand response becomes an effective approach to addressing the uncertainty due to renewable distributed generation. Demand response refers to the behavior of the power consumer who alters the power usage pattern in response to price signals or incentive mechanisms. According to the variation in load demands, the demand response schemes can be categorized as those based on price or incentive.
2.2.1. Demand Response Based on Price
Taking advantage of the time-of-use power price, demand response based on price guides the user to shift loads. The model for price elasticity of demand can well depict the change of power price and user loads. Based on Ref. [], price elasticity of demand refers to the sensitivity of power usage in a certain period to the power price, i.e., the ratio between the rate of power consumption change and the rate of price change, as calculated by (5) and (6), respectively:
where and are the sensitivity of power usage to the power price at the same period i and during other periods j, which are called the self-elasticity and the cross-elasticity, respectively; represents the change in power consumption during period i and is the original power usage during period i; is the change in power price at period i and means the original power price at period i; is the change in power price at period j, while represents the original power price at period j. The self-elasticity and the cross-elasticity form the elasticity matrix E seen as (7):
The diagonal elements belong to the category of self-elasticity, while the remaining non-diagonal elements belong to cross-elasticity. t is the number of periods. The elasticity matrix can be obtained by conducting a statistical analysis for the historic power consumption data of the user. On the premise of maximizing benefits for the user, the power usage of the user at period i is (8):
2.2.2. Demand Response Based on Incentive
Incentive demand response is based on the signed agreement that uses financial compensation or preferential power price policy to incentivize the user to engage in the load reduction project required by the power system. In this paper, the mode of interruption load is adopted to offer compensation when the user chooses to cut off the load within a certain period of time.
3. Stochastic Optimization Based on Scene Method
Chance-constrained programming and the scene method are two typical approaches of stochastic optimization []. The scene method mainly contains two aspects, scene generation and scene reduction. The solution to the targeted expectation is to regard the randomness of the stochastic variable as countless “scenes”. Specifically, a large number of scenes are first generated according to the probability distribution of the stochastic variable. Then, scenes with a low probability or high resemblance to other scenes are removed. For the limited scenes remaining after reduction, their expectations can be obtained with discussions. In this paper, stochastic optimization based on the scene method is adopted to handle the uncertainty of wind and photovoltaic powers.
3.1. Overview of the Scene Method
The “scene” is the input data used to describe the randomness in decision-making problems that contain uncertain factors. The idea of the scene method is to seek the optimum expectation of the objective function, and the constraining condition also only requires that the expectation satisfies the constraints. The optimization programming model can be formulated as (9):
where denotes the mathematical expectation.
3.2. Scene Generation
Considering that several periods are included in each day, each stochastic variable (wind or photovoltaic output) is expressed as a time sequence , where t represents the number of periods. The quasi-Monte Carlo (QMC) method is used to generate representative samples from the variable’s probability distribution.
Scene sampling samples each period in the time sequence separately with the same sampling times. For simplicity, it is assumed that each period is independent of each other. If the same Sobel point sequence sampling is adopted for each period, the correlation of the corresponding samples would be high, making it impossible to form the scene series in sequence. Therefore, it is necessary to post-process the sampling result to reduce correlation. Among various correlation-reducing methods, Cholesky decomposition is adopted in this paper.
Similarly, for instance, say samples are drawn at each period for the t periods in total, the matrix P of the samples extracted at all the periods is first generated as (10):
A matrix L is generated randomly that is the same size as P. Each row of L is a stochastic combination of non-repetitive integers from 1 to . Then, the correlation coefficient matrix of each row of L is calculated, which is decomposed into a nonsingular lower tridiagonal matrix D, satisfying the following equation []:
Construct a matrix G using the following Formula (12):
The elements in each row of matrix L in the above Equation (16) are ranked according to the size of the elements of each row in matrix G; then each element in matrix L represents the position of the corresponding location element of matrix P in the row. Afterwards, the elements of each row in matrix P are interchanged according to the position indicated by the location element of matrix L.
As each column of matrix P signifies a scene of a random variables and the elements of each row are the stochastic sampling values at the corresponding period, Cholesky decomposition actually rearranges the sampled points at each period. The advantage of Cholesky decomposition lies in the fact that if samples are drawn at each period, there will be scene sequences regardless of the total period number. However, its correlation of sequences is higher than that of the scene tree method, so it is generally adopted when the number of periods is large.
3.3. Scene Reduction Strategy Based on Kantorovich Distance
Kantorovich distance shown in (13) is a type of probability distance that is used to characterize the distance between two scene sets, with the definition of Ref. []:
where s, s′ denotes the scene; Ω, denotes the scene set; characterizes a certain type of distance between scene s and s′, which is typically shown in 2-norm; gives the probability of a simultaneous occurrence of s and s′; and if s and s′ are independent, becomes . If s, s′ is the only element in the scene set of Ω, , according to Equation (13), the distance between Ω and is calculated by (14):
where s is the only element in scene set Ω, while there are plenty of elements in ; according to Equation (13), the distance between Ω and is calculated by (15):
For the scene with a single stochastic variable, backward reduction is adopted in this paper to reduce scenes. All scenes are supposed to be reserved at first, which are then deleted selectively. Each time, the probability of the deleted scene is added to the scene with the shortest Kantorovich distance relative to it. Therefore, the probability information will not be lost, though the computation speed would be relatively slow. The detailed scene reduction procedure is as follows:
Step 1: Initialize the total number of scenes Ns and the ultimately required number of scenes Nc; initialize the probability of all the scenes to be 1/Ns.
Step 2: According to Equation (20), calculate the distance between each scene and the scene set excluding the scene itself. Find the scene with the closest distance to other scenes and delete it.
Step 3: According to Equation (19), calculate the distance between the deleted scene and every other scene, locate the closet scene, and add the probability of the deleted scene to it.
Step 4: Ns = Ns − 1, as long as Ns > Nc, skip to step 2 and continue the reduction.
Certainly, the wind turbines and photovoltaic generators are at different locations on the power grid, and their powers exert varied influences on the power system. Therefore, it is impossible to simply put the stochastic variable scenes of multiple wind and photovoltaic outputs in cascade into integrated scenes and then perform reduction. The sequential combination method is the most widely applied at present, which separately reduces the scenes of several random variables and combines them into integrated scenes simply according to the default corresponding position. This method fails to consider all the possible combinations; if full consideration is required, similar to the scene tree method mentioned above, the integrated scenes obtained will include a large number of scenes, thus increasing the amount of computation.
4. Optimal Scheduling Model and Its Solution Technique
4.1. Objective Function
The objective of optimization in this paper is to enhance the economy, reliability, and security of active distribution networks. The objective functions that embody the improvement of the three kinds of performances correspond to a minimized expectation of the required load shedding, a minimized node voltage limit, and a minimized operation cost of active distribution networks.
Objective 1.
minimize the expectation of load shedding
(1) For a system with w components, the total sampling times are determined to be Nt. Construct a w-dimension Sobel point sequence with a length of Nt, and the jth dimension is .
(2) Determine the operation status of each component in the system at the ith sampling. Supposing that the forced outage rate of the jth component is Dj, determine the status of the jth component in the system according to and decide the system status vector at the ith sampling:
where indicates that the component is working properly while means the component is shut down.
(3) Calculate the corresponding indicator according to the reliability index function.
Objective 2.
minimize the node voltage limit
Objective 3.
minimize the operation cost of active distribution networks
(1) Output cost
can be approximately expressed with a cubic function, as shown in (21):
where nf is the number of thermal power units, is the output of the jth thermal power unit, while A, B, C, and D are coefficients.
(2) Operation and maintenance cost
A certain operation cost will be incurred in the operation process of thermal power units and energy storing devices, which can be expressed as (22):
where ns is the number of energy storing devices, is the operation cost of the jth thermal power unit, denotes the operation cost of the jth energy storing device, and is the output of the jth energy storing device.
(3) Depreciation cost
The installation cost of the energy storing devices and thermal power units is calculated in the form of depreciation and counted by the hour, as shown as (23):
where is the installation cost of the jth thermal power unit, means the installation cost of the jth energy storing device, is the life of the thermal power unit, and is the life of the energy storing device.
(4) Benefit transfer cost
In demand response based on price, partial profit is given back to the user to alter the user load. This benefit transfer cost can be expressed as (24):
where d is the number of loads, is the jth load before demand response, is the jth load after demand response, is the electricity price before demand response, and is the electricity price after demand response.
In demand response based on incentive, the benefit transfer cost is formulated as (25):
where ω contains all the interruptible loads, and is the unit-time compensation for the jth interruptible load.
4.2. Constraints
Three types of constraints are mainly considered in day-ahead scheduling of active distribution networks, i.e., the constraint of unit output, the constraint of the energy storing device, and the constraint of demand response.
- (1)
- Constraint of unit output
1. Upper and lower limits of the output of thermal power units are formulated as (26):
where is the output of the thermal power units, and and are the upper and lower limits of the output.
2. Flexible regulating ability
where rh represents the rated range of output. A positive value of rh means an increase in the output, while a negative one indicates a decrease.
- (2)
- Constraint of the energy storing device
1. Upper and lower limits of output
where, is the charge–discharge power of the energy storing device, which is positive when charging and negative when discharging; and are the upper and lower limits of the charge–discharge power.
2. Constraint of state of charge (SOC)
where and are the upper and lower SOC limits of the energy storing device. The updating formula for SOC is
where can be expressed as shown in (31):
where η is the charge and discharge efficiency of the energy storing device, and is the capacity of the energy storing device. In addition, within a dispatch period, the ultimate value of SOC should be the same as the initial value, as shown in (32):
- (3)
- Constraint of demand response
When demand response is introduced, the electricity bill in a period for the user should not increase, as expressed in (33):
After introducing demand response, the user transfers the load based on power price though the overall load within a period should not be decreased, as formulated in (34):
The power prices at peak and valley times should be restricted by a certain ratio to realize the goal of peak load shifting, as formulated in (35):
where is the power price at peak times, while is the power price at valley times. Typically, = 2, = 5.
The power price should not be excessively low. The power prices are ranked as peak time price > normal time price > valley time price, so only the power price at valley times needs to be restricted, as shown in (36):
4.3. Solution Technique
This paper adopts the MOEA/D algorithm to solve the day-ahead dispatching problem of multi-objective optimization in the above-mentioned active distribution network. The specific solution steps and processes are shown in Figure 2.
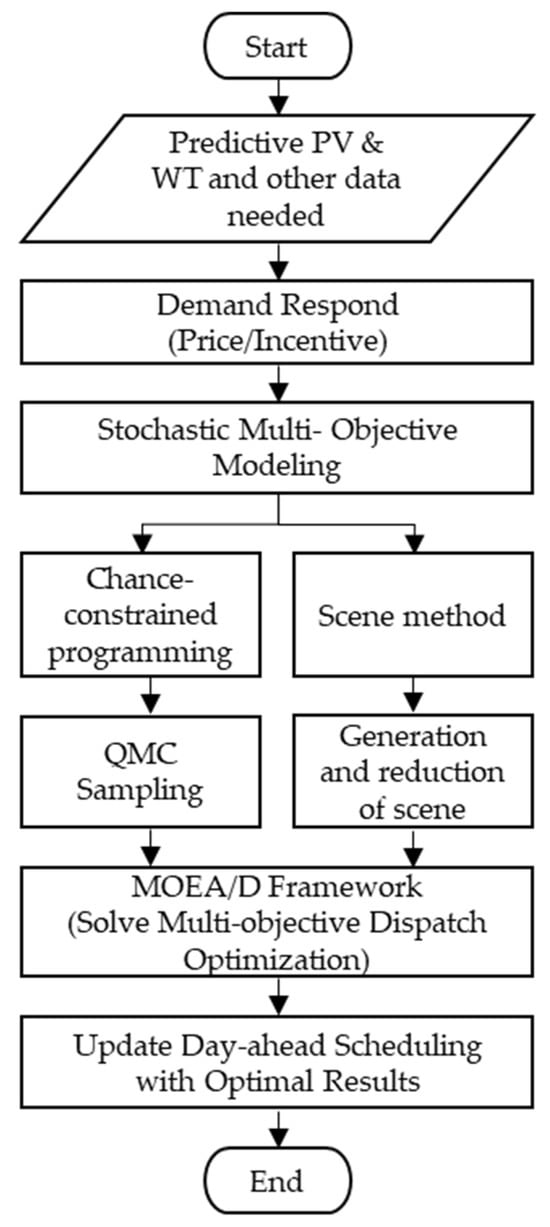
Figure 2.
Schematic diagram of day-ahead scheduling.
5. Case Study
This section takes the improved IEEE30-node system as an example, uses the MOEA/D algorithm to solve the chance-constrained programming model and the scenario method model, respectively, and compares and analyzes the results to calculate the sensitivity of the algorithm parameters. Finally, the performance of the algorithm for large-scale systems was tested on a 200-node 49-generator system.
5.1. Basic Data
The revised IEEE 30-node network [] is taken as an example to validate the feasibility of the established model and algorithm. For comparison, besides the scene method, the chance-constrained scheduling based on Monte Carlo is realized as well.
The generators at nodes 2 and 8 are replaced by wind turbines 1 and 2 with a rated power of 50 MW; node 5 is replaced by a photovoltaic generator with a maximum output of 50 MW; and an energy storing device with a capacity of 25 MW is installed at node 18. The specific parameters are as follows.
The output and flexibility constraints of the thermal power units at nodes 1, 11, and 13 are shown in Table 1. The parameters A, B, C, and D of the thermal power charge are given in Table 2, while the maintenance and installation costs are shown in Table 3.

Table 1.
Thermal power unit output limit.

Table 2.
Thermal power cost parameters.

Table 3.
Thermal power unit maintenance cost and installation cost.
The cut-in wind speed, the rated wind speed, and the cut-out wind speed of wind turbines 1 and 2 are 3 m/s, 16 m/s, and 25 m/s, respectively. The size parameter c and shape parameter k in the Weibull distribution of wind speed at the corresponding position are given in Table 4. The parameters of α and β in the Beta distribution of the photovoltaic generator are given in Table 5. The energy storing device has a capacity of 25 MW and an efficiency of η = 0.9. The lower and upper limits of the charge–discharge power are = 0.5 MW and = 10 MW, respectively. The bounds of SOC are = 0.2, and = 1.0. The maintenance cost is 0.0332 CNY/kW∙h, while the installation cost is CNY 133,500.

Table 4.
Weibull distributes size parameter c and shape parameter k.

Table 5.
Beta distribution parameters α and β.
In the demand response model based on price, the variation trend of the user load is shown in Figure 3.
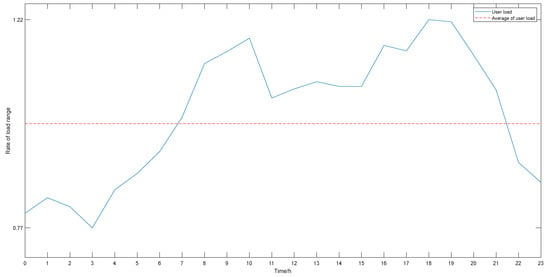
Figure 3.
Load curve before and after demand response.
A day of 24 h is divided into three parts: peak hours: 07:00–11:00, 17:00–21:00; normal hours: 12:00–16:00, 22:00–23:00; and valley hours: 24:00–6:00 of the next day. The original electricity price is 425 CNY/kW∙h. The price elasticity of user demand at various periods is shown in Table 6.

Table 6.
User demand price elasticity.
In the demand response model based on incentive, the load of node 12 is interruptible, and the compensation fee is 1.420 CNY/kW∙h.
In the calculation of the reliability index, the number of QMC times is 100, the outage rate of the wind turbines is set to be 0.05, the outage rate of the photovoltaic generator is set as 0.07, while the outage rates of the thermal power units are configured as 0.04, 0.06, and 0.08. In the scene method, 1000 original scenes are generated and then reduced to 20. The times of Monte Carlo simulations in chance-constrained scheduling is 25, and the confidence is set to be 0.95. In the MOEA/D algorithm, the evolution probability is CR = 0.9, and the evolutionary scaling factor is F = 0.5.
5.2. Prediction of Wind and Photovoltaic Output
In the scene method, the wind and photovoltaic scenes before and after reduction are given in Figure 4, Figure 5, Figure 6 and Figure 7.
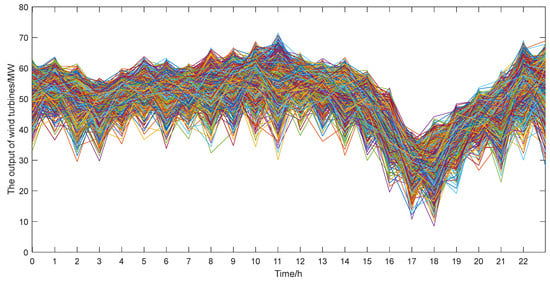
Figure 4.
Output scene before wind turbine reduction.
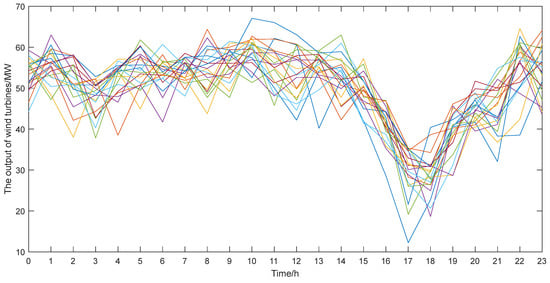
Figure 5.
Output scene after wind turbine reduction.
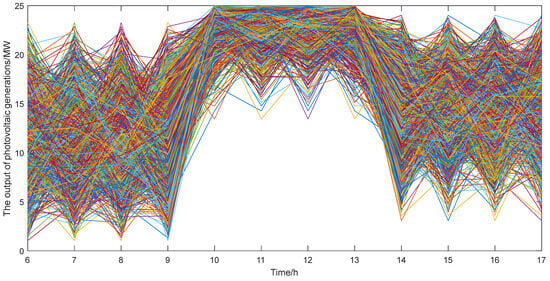
Figure 6.
Output scene before photovoltaic generator reduction.
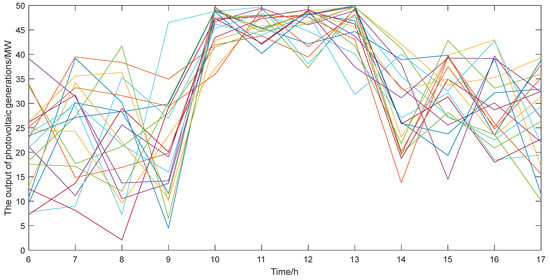
Figure 7.
Output scene after photovoltaic generator reduction.
6. Results and Analyses
Depending on the random quantity handling and demand response method, the solutions can be categorized into four combinations: scene–incentive, chance–incentive, scene–price, and chance–price. The Pareto charts of each combination obtained after 100 iterations of the MOEA/D algorithm are shown below.
In the scene-based model, 1000 initial scenes of wind and photovoltaic outputs were generated using the QMC method and reduced to 20 representative scenes through a Kantorovich distance-based reduction. Each reduced scene was assigned a non-uniform probability weight equal to the sum of merged original probabilities. For the chance-constrained programming (CCP) model, the confidence level was set to 0.95, meaning that all constraints are satisfied with at least 95% probability, corresponding to a violation probability of 0.05.
The optimal values for each combination found after 100 iterations of the MOEA/D algorithm are shown in Table 7. Figure 8 shows the Pareto optimal solution set obtained by the improved IEEE 30-node system under four different model combinations, reflecting the trade-off relationship among the economy, reliability, and security of the system. Each point on the Pareto front represents an optimal solution among the three objectives of operating cost, load shedding expectation, and node voltage limit. It can be seen that all four models have obtained uniformly distributed and well-convergent Pareto frontiers, indicating that the MOEA/D algorithm can effectively search for representative non-dominated solution sets in a multi-objective space. However, different optimization methods and demand response mechanisms have had a significant impact on the shape of the Pareto surface.

Table 7.
Optimal values of MOEA/D algorithm after 100 iterations.
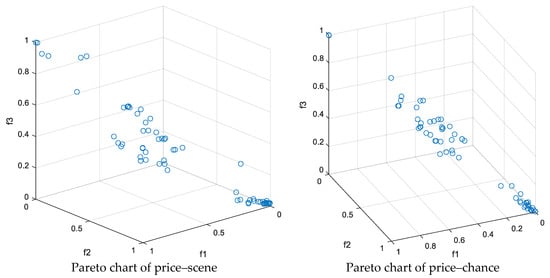
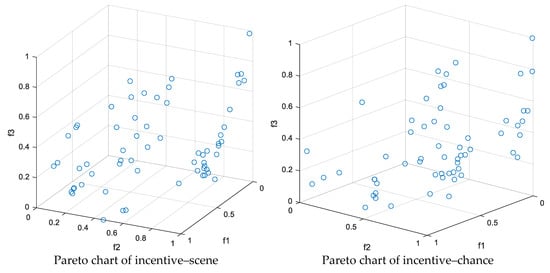
Figure 8.
Pareto charts of the four combinations.
Among the results, the Pareto front of the incentive-based demand response model moves as a whole towards reliability; that is, the expected value of load shedding is lower. This indicates that encouraging users to participate in peak shaving and valley filling through economic compensation can effectively reduce the risk of load interruption in the system, thereby enhancing the reliability and safety of operation. The Pareto frontier of the price-based demand response model extends more towards the economic direction, indicating that the electricity price signal has a greater cost advantage in guiding user load transfer but is slightly inferior in ensuring reliability. By comparing the two stochastic optimization methods, it can be found that the Pareto frontier obtained by the scene method is smoother and more continuous, indicating that this method can describe the uncertainty of wind and solar power output in more detail and obtain a richer solution set distribution. Chance-constrained programming, due to the introduction of confidence constraints, has more concentrated solutions and is generally closer to the low-cost region, demonstrating stronger economic efficiency but relatively conservative reliability.
The trade-off optimal values for each combination found after 100 iterations of the MOEA/D algorithm are shown in Table 8.

Table 8.
Trade-off optimal values of MOEA/D algorithm after 100 iterations.
As can be seen from the figures and tables above, the Pareto surfaces obtained from the demand response based on price and incentive are different. Among the three objective functions, f3, the economy, is the most seriously influenced. Though the difference in the optimal values is small, the variation of the trade-off values is significant. This is due to the fact that the minimum is mostly determined by the lower limit of the output and the deprecation cost of the unit, while the maximum is determined by their respective functions.
For the two different modes of demand response, both the scene method and chance-constrained scheduling can obtain good Pareto surfaces, with little difference in their results. Therefore, the two combinations of the price demand response are selected for further investigation. The average and standard deviation of the trade-off values for the scene method and chance-constrained scheduling after iteration are shown in Table 9.

Table 9.
Statistical data of trade-off optimum.
As indicated in Table 5, Table 6, Table 7, Table 8 and Table 9, the statistical indicators of the results obtained from chance-constrained scheduling and the scene method are similar, though significant fluctuations are present in terms of different objective functions, which are positively related to the order of magnitude of the objective function.
Sensitivity analysis is conducted for the cross probability CR and the scaling factor F in the evolution algorithm of MOEA/D. The sum of the normalized trade-off optimal solutions from the three original objective functions are taken as the objective function. The relative sensitivity analysis method based on perturbation analysis introduced in Ref. [] is followed to obtain the sensitivity, as shown in Table 10.

Table 10.
Sensitivity of the MOEA/D algorithm.
It can be seen that a significant difference exists for chance-constrained scheduling and the scene method under the two different parameters; however, in general, the sensitivity of CR is higher than that of F.
Finally, the algorithm is tested in a 200-node 49-generator system to evaluate its capability to handle large-scale systems. The system contains 6 wind turbines, 4 photovoltaic generators, 5 energy storing devices, with 100 iterations. The obtained Pareto charts are shown in Figure 9.
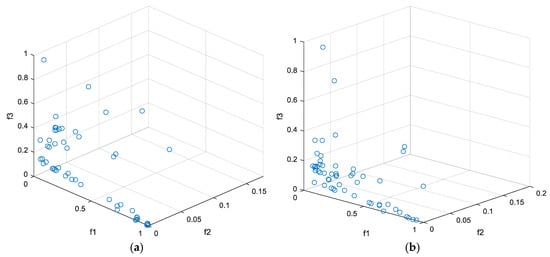
Figure 9.
Pareto charts of the 200-generator system obtained from the two methods. (a) Pareto chart of the 200-node system by the scene method. (b) Pareto chart of the 200-node system by CCP.
Figure 9 shows the Pareto optimal solution set obtained by using two stochastic optimization methods, namely the scene method and chance-constrained programming, in a large-scale active distribution network with 200-node 49-manchine system. From the perspective of overall distribution, the Pareto frontiers of both methods can clearly depict the trade-off relationship among the economy, reliability, and security of the system, and the solution set distribution is continuous, indicating that the MOEA/D algorithm proposed in this paper still has good stability and convergence performance even when the system scale increases significantly.
Compared with the 30-node system, the Pareto front of the 200-node system moves towards reliability and safety, indicating that as the system capacity expands and the number of nodes increases, the redundancy of the network structure improves, resulting in a decrease in the voltage constraint violation rate and the demand for load shedding, and the system safety is improved to a certain extent. Meanwhile, there is a more obvious negative correlation between economic indicators and reliability indicators; that is, in large-scale systems, further enhancing reliability often requires a higher economic cost. This trend conforms to the actual laws of multi-objective scheduling: the larger the system, the higher the coordination complexity of power distribution and energy flow, and the optimization results better reflect the contradictions and balance among the objectives.
From the comparison of the two stochastic optimization methods, it can be seen that the Pareto front of the scene method still maintains good continuity and uniform distribution, demonstrating its robustness when dealing with uncertainties in large-scale systems. The solution set of chance-constrained programming is more concentrated and mainly distributed in the low-cost region, indicating that it suppresses risk diffusion through confidence constraints, making the solution more conservative but slightly more economically viable. Overall, both methods can obtain reasonable non-dominated solution sets in large-scale systems, verifying the scalability and practicability of the model and algorithm proposed in this paper.
7. Conclusions
In this paper, based on the combinations of demand response based on price or incentive and the scene method or chance-constrained scheduling, four models are established. The MOEA/D algorithm is utilized in problem solving, and the results are counted, compared, and analyzed. Moreover, the parameter sensitivity of the MOEA/D algorithm is calculated. The following conclusions are drawn:
- (1)
- The four models proposed in this paper can solve well the multi-objective day-ahead optimization scheduling problem of active distribution networks containing wind power, photovoltaic power, storage, and demand response.
- (2)
- The results obtained by chance-constrained scheduling and the scene method are mostly the same. Both methods can effectively solve the stochastic optimization issue, merely demonstrating a large difference in parameter sensitivity of the MOEA/D algorithm.
There are still some limitations and room for development regarding this work, as listed below:
- (1)
- The wind and photovoltaic outputs were represented using simplified probability distributions, which may not fully capture the temporal and spatial correlations in real data.
- (2)
- The uncertainty factors only take into account the output of renewable energy and do not simultaneously incorporate other random sources such as load fluctuations and electricity price changes.
Future research will integrate multi-source uncertainty modeling and combine machine learning prediction methods to further enhance the adaptability of the model and the robustness of scheduling decisions.
Author Contributions
Conceptualization, J.Z.; data curation, W.L. (Weida Li); formal analysis, W.L. (Wanying Li); funding acquisition, J.Z.; investigation, W.L. (Wanying Li); methodology, W.L. (Weida Li) and J.Z.; resources, X.Y.; software, W.L. (Weida Li) and X.Y.; supervision, J.Z.; validation, W.L. (Wanying Li) and X.Y.; visualization, W.L. (Weida Li) and X.Y.; writing—original draft, W.L. (Wanying Li); writing—review and editing, J.Z. All authors have read and agreed to the published version of the manuscript.
Funding
This work was supported by the National Natural Science Foundation of China under Grant No. 62173284, the Open Project Fund of the Research Institute of Xiamen University under Grant No. 202401YB006, the Key Industrial Guidance Project of Fujian Province under Grant No. 2024H0003, and the Natural Science Foundation of Guangdong Province under Grant No. 2024A1515010544.
Data Availability Statement
The data presented in this study are available on request from the corresponding author. The data are not publicly available due to privacy.
Conflicts of Interest
Author Xiaoxiao Yu was employed by the Global Energy Interconnection Development and Cooperation Organization. The remaining authors declare that the research was conducted in the absence of any commercial or financial relationships that could be construed as a potential conflict of interest.
References
- China Renewable Energy Engineering Institute. China Renewable Energy Development Report 2023; China Water & Power Press: Beijing, China, 2024. (In Chinese) [Google Scholar]
- China Electricity Council. 2024 China Electric Power Industry Annual Development Report 2024 [EB/OL]. Available online: https://mp.weixin.qq.com/s/jfsHWg88we1qEh5wSCXkog (accessed on 7 October 2024). (In Chinese).
- National New Energy Consumption Monitoring and Early Warning Center. 2024 National New Energy Grid Integration and Consumption Report [EB/OL]. Available online: https://mp.weixin.qq.com/s/2SA4s8afIDoe0g3AWSuNw (accessed on 6 February 2025). (In Chinese).
- Zhang, Y.; Wang, N.; Guo, Z. Carbon Emissions and Economic Benefits Analysis of the Synthetic Ammonia Pathway Utilizing Curtailed Wind and Solar Power in China. Electr. Equip. Econ. 2025, 1, 221–225. (In Chinese) [Google Scholar]
- Wang, Y. Two-stage robust optimization of a hydrogen-based integrated energy system considering offshore wind power hydrogen production and multi-type demand response. Electr. Eng. 2025, 107, 1–20. [Google Scholar] [CrossRef]
- Ma, M.; Long, Z.; Liu, X.; Lee, K.Y. Distributionally robust optimization of electric–thermal–hydrogen integrated energy system considering source–load uncertainty. Energy 2025, 316, 134568. [Google Scholar] [CrossRef]
- Shi, J.; Qin, J.; Li, H.; Li, Z.; Ge, Y.; Liu, B. Probabilistic Power and Energy Balance Risk Scheduling Method Based on Distributed Robust Optimization. Energies 2024, 17, 4894. [Google Scholar] [CrossRef]
- Wang, Q.; Guan, Y.; Wang, J. A Chance-Constrained Two-Stage Stochastic Program for Unit Commitment with Uncertain Wind Power Output. IEEE Trans. Power Syst. 2012, 27, 206–215. [Google Scholar] [CrossRef]
- Huang, X.; Ji, W.; Ye, X.; Feng, Z. Configuration Planning of Expressway Self-Consistent Energy System Based on Multi-Objective Chance-Constrained Programming. Sustainability 2023, 15, 5605. [Google Scholar] [CrossRef]
- Pappala, V.S.; Erlich, L.; Rohrig, K.; Dobschinski, J. A Stochastic Model for the Optimal Operation of a Wind-Thermal Power System. IEEE Trans. Power Syst. 2009, 24, 940–950. [Google Scholar] [CrossRef]
- Tuohy, A.; Meibom, P.; Denny, E.; O’Malley, M. Unit Commitment for Systems with Significant Wind Penetration. IEEE Trans. Power Syst. 2009, 24, 592–601. [Google Scholar] [CrossRef]
- Sturt, A.; Strbac, G. Efficient Stochastic Scheduling for Simulation of Wind-Integrated Power Systems. IEEE Trans. Power Syst. 2012, 27, 323–334. [Google Scholar] [CrossRef]
- Ma, B.; Zheng, J.; Xian, Z.; Wang, B.; Ma, H. Optimal Operation Strategy for Wind–Photovoltaic Power-Based Hydrogen Production Systems Considering Electrolyzer Start-Up Characteristics. Processes 2024, 12, 1756. [Google Scholar] [CrossRef]
- Dai, C.; Fei, X.; Weichun, G.; Huang, P.; Zhou, Y. A Coordinated Dispatching Model Considering Generation and Operation Reserve in Wind Power-Photovoltaic-Pumped Storage System. Energies 2020, 13, 4834. [Google Scholar]
- Rambabu, M.; Kumar, V.G.; Rao, V.B.; Sravan Kumar, B. Optimal power flow solution of an integrated power system using elephant herd optimization algorithm incorporating stochastic wind and solar power. Energy Sources Part A Recovery Util. Environ. Eff. 2025, 47, 10987–11007. [Google Scholar] [CrossRef]
- Yuan, T.; Mu, Y.; Liu, Y. Optimal operation of a microgrid with risk-averse information gap decision theory: Enhancing profitability through uncertainty management. Electr. Eng. 2025, 107, 1–23. [Google Scholar] [CrossRef]
- Kenari, T.M.; Ozdemir, A. Simultaneous impacts of correlated photovoltaic systems and fast electric vehicle charging stations on the operation of active distribution grids. Sustain. Energy Grids Netw. 2024, 40, 101583. [Google Scholar] [CrossRef]
- Nou, P.; Zhang, Y.; Yang, Y. The Impact of Voltage Stability Constraint L-Index on Power System Optimization Base on Interior Point Algorithm by Considering the Integration of Renewable Energy. J. Phys. Conf. Ser. 2021, 1887, 012031. [Google Scholar] [CrossRef]
- Wang, Z.; Wang, S.; Ni, H.; Wang, J.; Zhang, J. A configuration and scheduling optimization method for integrated energy systems considering massive flexible load resources. Front. Energy Res. 2025, 13, 1556000. [Google Scholar] [CrossRef]
- Marin, R.S.; Soares, G.C. Multi-objective optimisation for hybrid electric system setup in a remote island. J. Ocean Eng. Mar. Energy 2025, 11, 1–24. [Google Scholar] [CrossRef]
- Alshammari, F.N.; Samy, M.M.; Barakat, S. Comprehensive Analysis of Multi-Objective Optimization Algorithms for Sustainable Hybrid Electric Vehicle Charging Systems. Mathematics 2023, 11, 1741. [Google Scholar] [CrossRef]
- Zhang, C.; Li, H.; Li, X.; Cheng, J.; Lei, Z.; Gao, S. Probabilistic bootstrap-based evolutionary algorithm for three-objective wind farm turbine position optimization. Swarm Evol. Comput. 2025, 96, 101972. [Google Scholar] [CrossRef]
- Bouchekara, H.E.R.H.; Sha’aban, A.Y.; Shahriar, S.M.; Abdullah, S.M.; Ramli, M.A. Sizing of Hybrid PV/Battery/Wind/Diesel Microgrid System Using an Improved Decomposition Multi-Objective Evolutionary Algorithm Considering Uncertainties and Battery Degradation. Sustainability 2023, 15, 11073. [Google Scholar] [CrossRef]
- Tuo, X.; Hong, L.; Gang, Z.; Zhang, K.; Li, P. A point Dispatch Operation Method of Hydropower and Photovoltaic: Based on the Two-Stage Hedging Model. Appl. Sci. 2022, 12, 11348. [Google Scholar]
- Zhang, Z.X.; Li, P. MOEA/D with many-stage dynamical resource allocation strategy to solution of many-objective OPF problems. Int. J. Electr. Power Energy Syst. 2020, 120, 106050. [Google Scholar] [CrossRef]
- Dey, B.; Sharma, G.; Bokoro, N.P. Incentive-based demand response policies for techno-economic microgrid operation—A comparative analysis. Electr. Eng. 2025, 107, 14313–14336. [Google Scholar] [CrossRef]
- Ying, Y.; Wu, Y.; Su, Y.; Fu, R.; Liang, X.; Xu, H. Dispatching approach for active distribution network considering PV generation reliability and load predicting interval. J. Eng. 2017, 2017, 2433–2437. [Google Scholar] [CrossRef]
- Qu, X.; Hui, H.; Yang, S.; Li, Y.; Ding, Y. Price elasticity matrix of demand in power system considering demand response programs. IOP Conf. Ser. Earth Environ. Sci. 2018, 121, 052081. [Google Scholar] [CrossRef]
- Mazadi, M.; Rosehart, W.D.; Malik, O.P.; Aguado, J.A. Modified Chance-Constrained Optimization Applied to the Generation Expansion Problem. IEEE Trans. Power Syst. 2009, 24, 1635–1636. [Google Scholar] [CrossRef]
- Ma, M.; Bai, C.; Zhang, S.; Qian, L.; Yan, H. KECANet: A novel convolutional kernel network for ocean SAR scene classification with limited labeled data. Front. Mar. Sci. 2022, 9, 935600. [Google Scholar] [CrossRef]
- Zhao, C.; Duan, Q.; Lu, J.; Wang, H.; Sha, G.; Jia, J.; Zhou, Q. Coordinated Optimization Method for Distributed Energy Storage and Dynamic Reconfiguration to Enhance the Economy and Reliability of Distribution Network. Energies 2024, 17, 6040. [Google Scholar] [CrossRef]
- Liu, W.; Zhang, T.; Yang, X.; Wang, J. Calculation and optimization of inter-regional available transfer capability considering wind power uncertainty and system improvement measures. Front. Energy Res. 2023, 11, 1177754. [Google Scholar] [CrossRef]
- Xi, Q.; Li, F.Z.; Luo, C. Sensitivity analysis of AnnAGNPS model’s hydrology and water quality parameters based on the perturbation analysis method. Huan Jing Ke Xue 2014, 35, 1773–1780. [Google Scholar]
Disclaimer/Publisher’s Note: The statements, opinions and data contained in all publications are solely those of the individual author(s) and contributor(s) and not of MDPI and/or the editor(s). MDPI and/or the editor(s) disclaim responsibility for any injury to people or property resulting from any ideas, methods, instructions or products referred to in the content. |
© 2025 by the authors. Licensee MDPI, Basel, Switzerland. This article is an open access article distributed under the terms and conditions of the Creative Commons Attribution (CC BY) license (https://creativecommons.org/licenses/by/4.0/).