You are currently viewing a new version of our website. To view the old version click .
Energies
  • Article
  • Open Access

23 November 2025

Coordinated Active and Reactive Power Control of VSC-HVDC for Enhancing Static Voltage Stability in AC/DC Systems

,
,
,
,
and
1
School of Electrical and Power Engineering, HoHai University, 8 Fochengxi Road, Nanjing 211100, China
2
State Grid Jiangsu Electric Power Co., Ltd. Research Institute, 1 Pawell Road, Nanjing 211103, China
*
Author to whom correspondence should be addressed.
Energies2025, 18(23), 6127;https://doi.org/10.3390/en18236127 
(registering DOI)
This article belongs to the Special Issue Analysis and Control of Power System Stability

Abstract

When conducting research on the static voltage stability of AC/DC systems with voltage source converter-high voltage direct current (VSC-HVDC) transmission lines, the focus is often given to reactive power control, neglecting the potential from active power support. Based on the minimum modulus eigenvalue, this paper proposes to coordinately control active and reactive power of VSC-HVDC to improve the static voltage stability of AC/DC systems. Firstly, the converter loss is quantified and taken into account to solve the power flow of the AC/DC system. Secondly, the minimum modulus eigenvalue of the system is calculated based on the Jacobian matrix in the power flow solution process to characterize the static voltage stability of the system. Then, taking the minimum modulus eigenvalue of the AC/DC system as the optimization objective, with power flow, node voltage, and converter power as constraints, and with the active and reactive power injections of HVDC as optimization variables, an optimization model is built to determine the optimal adjustment of active and reactive power of VSC-HVDC. Finally, the particle swarm optimization algorithm is utilized to solve the optimization model. Simulations in MATLAB show that compared with only active power control and only reactive power control, the proposed control method can significantly improve the static voltage stability of the system while ensuring its safe operation.

1. Introduction

With the continuous advancement of the “dual carbon” strategic goals, the new power system exhibits dual high characteristics []. Compared with the traditional power system, the new power system with a higher penetration rate of new energy cannot rapidly generate a large amount of reactive power to provide stable voltage support, and the risk of static voltage instability also increases accordingly []. On the other hand, in the new power system, VSC-HVDC is being widely applied due to its advantages such as commutation immunity to grid voltage, independent control of active and reactive power, and the ability to supply power to passive loads [,,]. At present, plenty of flexible direct current transmission projects have been in operation worldwide []. With the expanding application scope and increasing transmission capacity of VSC-HVDC, the mutual influence between DC and AC systems is intensifying. In particular, how to efficiently analyze the static voltage stability of AC/DC systems containing VSC-HVDC and how to improve the static voltage stability of the system through VSC-HVDC control have become urgent problems to be solved at present.
In the existing research on the static voltage stability of AC and DC systems, the commonly used analysis methods are mostly based on continuous power flow [], characterization of the feasible region [], L index [], and minimum modulus eigenvalue []. Reference [] plotted the P-V curve of the system using continuous power flow and proposed characterizing the static voltage stability of the AC-DC system by the difference between the actual operating voltage and the threshold voltage. Reference [] derives the equivalent power index through the reactive static voltage stability criterion, and then characterized the feasible domain boundary in the form of a radar chart based on this index. Although both continuous power flow and feasible region methods can directly and accurately determine the system’s static voltage stability margin, they cannot explain the system’s weak links or instability mechanisms. Moreover, both methods suffer from relatively low computational efficiency: continuous power flow requires multiple iterations to solve power flow equations with slow convergence near the collapse point, while precisely characterizing high-dimensional feasible regions incurs extremely high computational costs.
Reference [] proposes taking the minimum L index as the optimization objective of reactive power scheduling to enhance the static voltage stability of the system. Reference [] uses the L index to characterize the static voltage stability of the receiving end system in the flexible direct current grid-connected offshore wind power system, and selects the optimal access position for offshore wind power with the minimum L index as the optimization objective. However, the L index is a local index that relies on specific node voltages and node impedance matrices. The output results are independent values for each node, which does not deeply characterize the global instability mode and is prone to misjudgment due to individual weak nodes, especially when there are significant changes in the system structure []. The minimum modulus eigenvalue has a clear physical meaning. It characterizes the relative distance between the current operating point of the system and the critical point of voltage instability. In addition, the solution of the minimum modulus eigenvalue is based on the Jacobian matrix that reflects the overall relationship of the system, and thus can accurately reflect the overall characteristics of the system. Reference [] characterizes the overall static voltage stability of multi-feed AC/DC systems using the minimum modulus eigenvalue. Reference [] describes the static voltage stability of AC/DC systems based on the minimum modulus eigenvalue and takes it as a constraint in the day-ahead scheduling model to ensure the feasibility of the scheduling plan. Therefore, the minimum modulus eigenvalue is used to describe static voltage stability in this paper.
To enhance the static voltage stability margin of AC/DC systems, it can be achieved by installing and adjusting reactive power compensation equipment. Reference [], aiming to enhance system voltage stability, comprehensively optimized the installation location and capacity of synchronous condensers while considering installation costs. Reference [] identifies key load nodes and lines in AC/DC systems through state-mode sensitivity and performs reactive power compensation on key load nodes to improve the overall static voltage stability of the system. As VSC-HVDC gradually becomes a key technology for building a power system with a high proportion of renewable energy, the static voltage stability of the system can also be effectively improved through the optimized control of VSC-HVDC. Reference [] calculates the ideal power control quantity based on the system load margin and the power control sensitivity of the load margin to VSC-HVDC. Reference [] reveals the mapping relationship between the weak nodes of voltage stability and the control variables of the converter station based on the sensitivity of the minimum modulus eigenvalue to power, and improves the static voltage stability of the system by optimizing the power control quantity of the converter.
However, most of the above-mentioned studies have focused on the regulation of reactive power, neglecting the control risks existing in relying solely on reactive power regulation and the potential for voltage support in tapping into active power regulation. Reference [] indicates that as the VSC penetration rate increases, if the system only provides reactive power support to ensure voltage stability, it will lead to an increase in D-axis current, thereby affecting the normal operation of power electronic devices. Reference [] research shows that active power control can also enhance the stability of static voltage and prevent the problem of voltage over-limit. Accordingly, this paper proposes the cooperative control strategy of VSC-HVDC active and reactive power for the improvement of static voltage stability. The main contributions of this paper are as follows:
  • Based on the theory of minimum modulus eigenvalue analysis, a numerical analysis method suitable for quantifying the static voltage stability margin of AC/DC power systems is proposed.
  • The power coupling relationship between the sending-end and receiving-end converters of VSC-HVDC is taken into account to improve analysis accuracy.
  • Through the coordinated control of active and reactive power in the VSC-HVDC converter station, the static voltage stability of the AC/DC power system has been effectively enhanced under the premise of meeting the actual operation constraints.
The main arrangements of this article are as follows. Firstly, the loss model of the converter station is combined with the power flow calculation method to calculate the minimum modulus eigenvalue of the AC/DC system to characterize the static voltage stability of the system. Secondly, an optimization model for the cooperative control of VSC-HVDC active and reactive power is established. In addition, a single-objective particle swarm optimization algorithm with a penalty function introduced is adopted to solve this optimization model. Finally, the effectiveness and rationality of the proposed active and reactive power cooperative control strategy are verified in the AC/DC system with VSC-HVDC.

2. Static Voltage Stability Analysis of AC/DC System

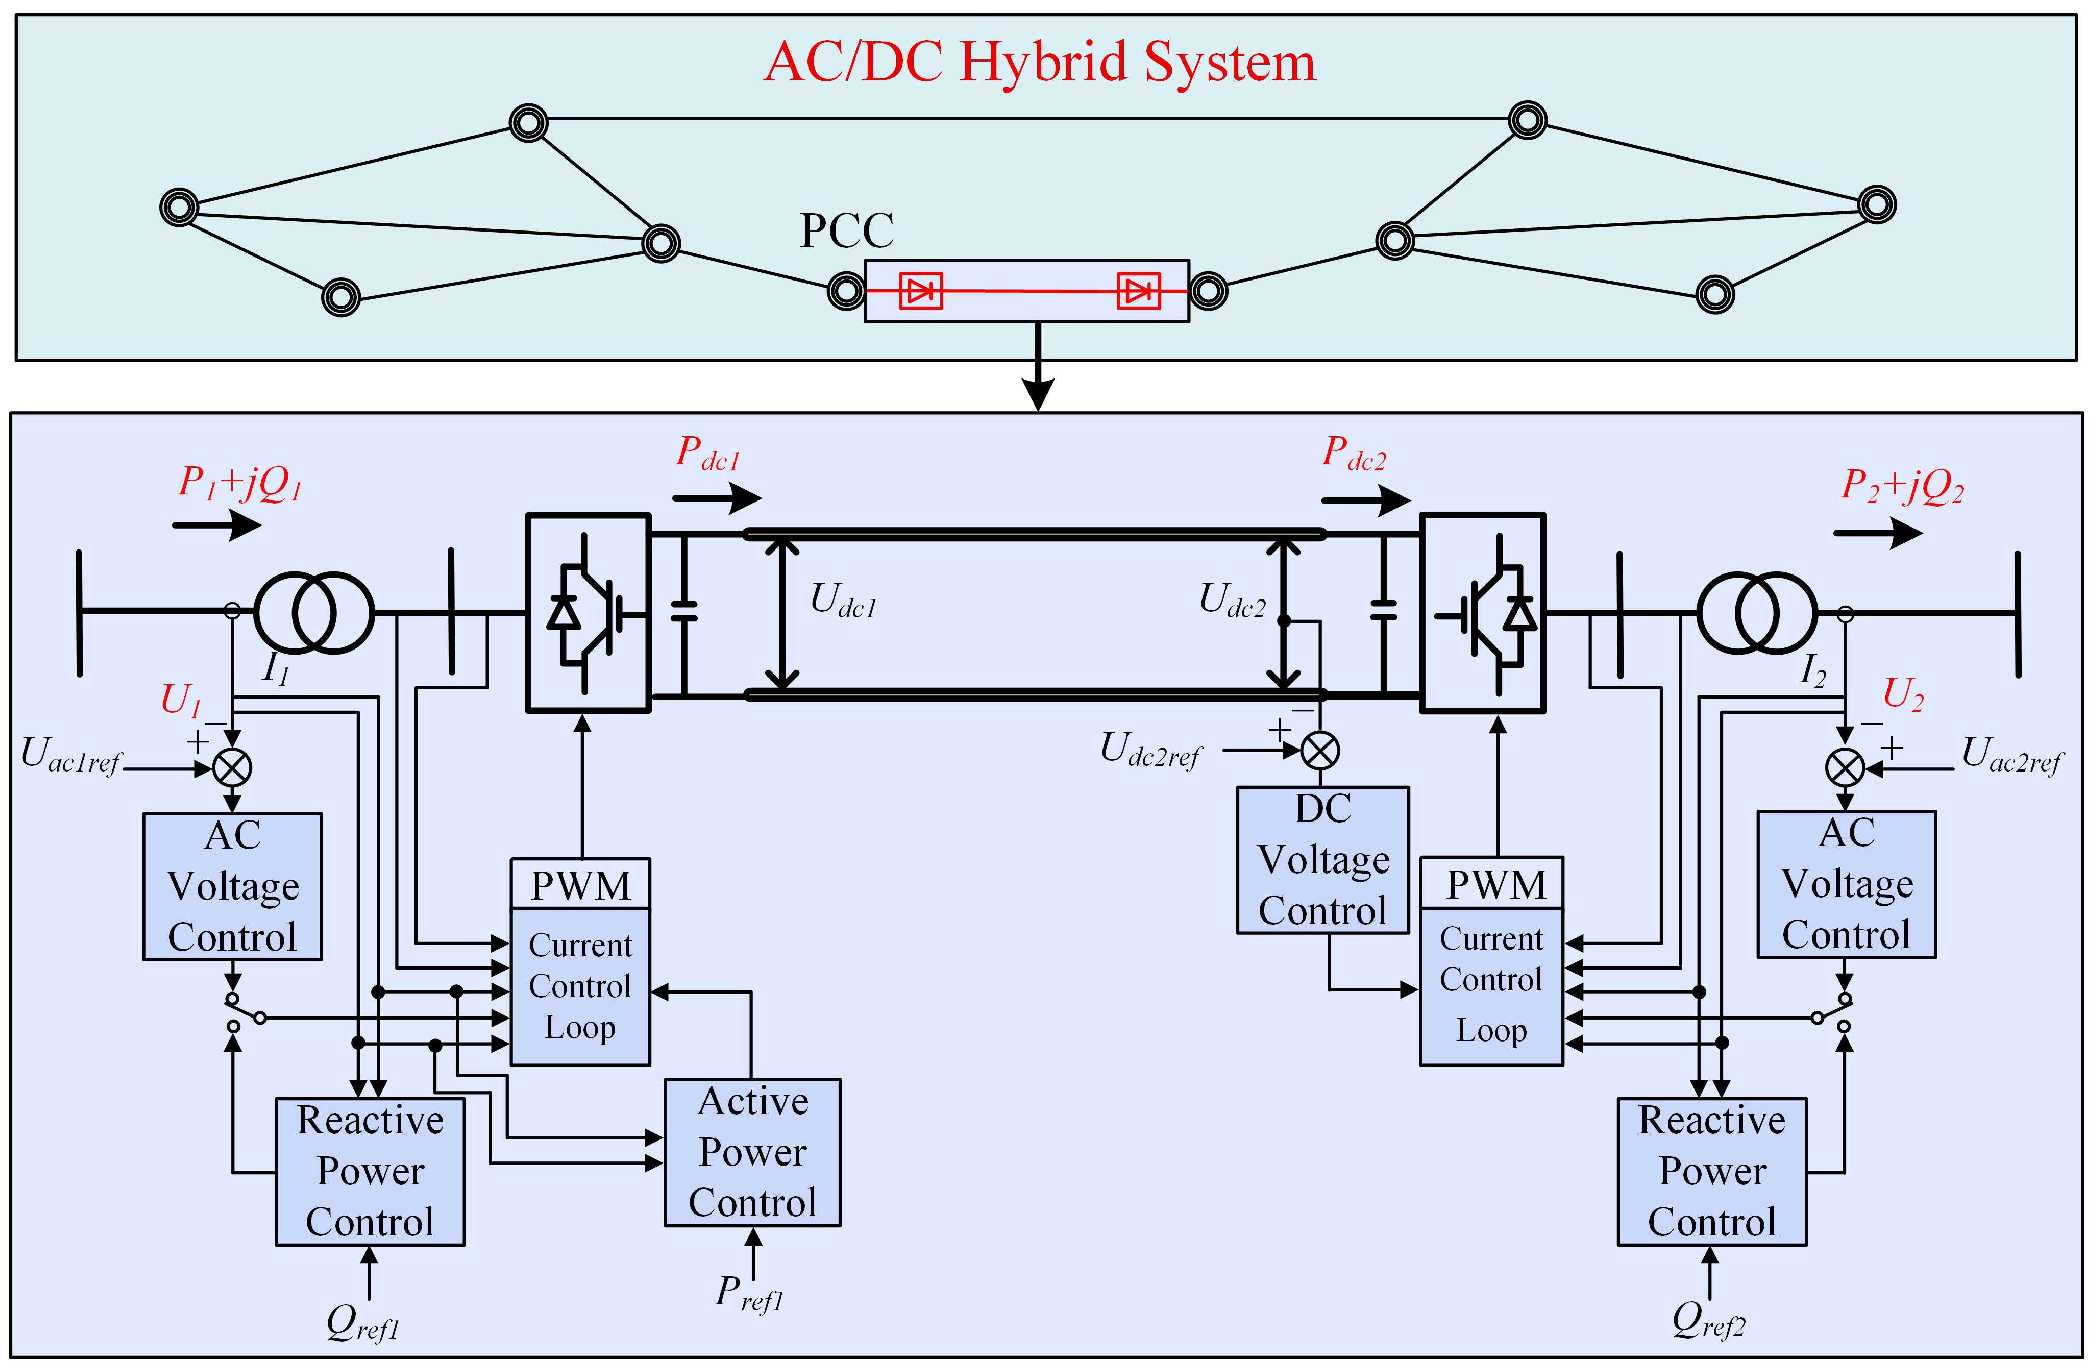
This section proposes a numerical analysis method suitable for quantifying the static voltage stability margin of AC/DC power systems (shown in Figure 1) based on the power flow model of AC/DC systems and the theory of minimum modulus eigenvalue analysis. Firstly, the node type of the Point of Common Coupling (PCC) is determined based on the control mode of the converter. Then, the converter loss is modeled to improve the accuracy of power flow analysis. Finally, the static voltage stability index of the AC/DC system is calculated based on the Jacobian matrix obtained during the solution process of the AC/DC power flow model.
Figure 1. Topology diagram of VSC-HVDC system.

2.1. Power Flow Solution Methods for the AC/DC System

2.1.1. The Power Relationship Between VSC-HVDC and AC System

The power flow calculation methods for AC/DC hybrid systems can be divided into two types: the unified iterative method and the alternating iterative method. Among them, the alternating iteration method only requires adding DC power flow calculation to the existing AC power flow program. Due to its good inheritance, simple implementation, and flexible control mode switching, it has been widely applied. When calculating the power flow of AC/DC power systems containing VSC-HVDC using the alternating iteration method, the principle of solving the power flow for the DC grid first and then for the AC grid is followed [].
In the solution process, it is first necessary to clarify the control strategies of each VSC converter station. For a converter station controlled by a constant DC voltage, the DC voltage is known, but the DC power is unknown. For a converter station with constant active power control, under the premise of known losses, it can be considered that the DC power is known, while the DC voltage is unknown. Therefore, the DC power and DC voltage of each VSC converter station can be solved through the DC power flow. In addition, for a converter station with constant AC voltage control, the converter bus voltage is known. For a converter station with constant reactive power control, the reactive power injected into the AC system is known.
Therefore, in power flow calculations, a VSC converter station can be equivalently modeled as a generator, and the AC bus bar of each converter station can be regarded as the PCC of the AC system and the DC system, which can be regarded as a PQ or PV node according to the control mode. The node classification under different control modes is shown in Figure 2. In this paper, the constant reactive power control is applied for both converters and thus the PCC points are both regraded as PQ nodes.
Figure 2. Bus Classification under Different Control Modes.

2.1.2. Power Flow Solution Method Considering Converter Station Losses

During the aforementioned solving process, to improve computational efficiency, numerous studies neglect converter station losses by equating the active power injected into the AC system directly with the DC power obtained from DC power flow solutions. However, for higher computational accuracy requirements, detailed modeling of VSC losses becomes essential. As indicated in references [,], the converter station losses Ploss can be expressed as:
P l o s s a I s 2 + b I s + c
where the loss parameters a, b, and c are constants. Is denotes the current flowing through the converter station, calculated as follows:
I s = P s 2 + Q s 2 U s 2
where Ps and Qs represent the active and reactive power injected into the converter station, respectively, and Us denotes the PCC voltage of the converter station. By substituting (2) into (1), we obtain:
P l o s s = ( a P s 2 + Q s 2 U s 2 + b P s 2 + Q s 2 U s 2 + c )
When the loss of the converter station is taken into account, the active power at the AC bus of the sending-end converter can be expressed as:
P 1 = P d c 1 + P l o s s 1 = P d c 1 + ( a 1 P 1 2 + Q 1 2 U 1 2 + b 1 P 1 2 + Q 1 2 U 1 2 + c 1 )
where P1 denotes the active power at the PCC of the sending-end converter station; Pdc1 is the DC power at the sending end; Ploss1 represents the loss of the sending-end converter station; U1 is the PCC voltage of the sending-end converter station; and a1, b1, and c1 are the loss parameters of the sending-end converter station.
The active power at the AC bus of the receiving-end converter station can be expressed as:
P 2 = P d c 2 P l o s s 2 = P d c 2 ( a 2 P 2 2 + Q 2 2 U 2 2 + b 2 P 2 2 + Q 2 2 U 2 + c 2 )
where P2 denotes the active power at the PCC of the receiving-end converter station; Pdc2 is the DC power at the receiving end; Ploss2 represents the loss of the receiving-end converter station; U2 is the PCC voltage of the receiving-end converter station; and a2, b2, and c2 are the loss parameters of the receiving-end converter station.
When solving the AC–DC system power flow considering converter station losses, the DC power flow is first calculated to obtain the DC power. Next, the AC bus powers of the converter stations are determined using (4) and (5). Finally, the converter station buses are modeled as PQ or PV nodes according to Figure 1 for the AC power flow calculation.

2.2. Static Voltage Stability Analysis of AC/DC Systems Based on the Minimum Modulus Eigenvalue

The Jacobian matrix obtained from the power flow calculation is a real square matrix and is diagonalizable, hence the eigenvalue decomposition is applied to analyze the voltage stability.
The static power flow equations of the power system are linearized and used for the power flow equations, as in (6):
Δ P a Δ Q a = H N M L Δ θ Δ U / U = J Δ θ Δ U / U
where ∆Pa = [∆PPQ,∆PPV]T, ∆Qa = [∆QPQ]T. The correction amount of active power includes the correction amount of active power of the PQ node and the PV node. The correction amount of reactive power only includes the correction amount of reactive power at the PQ node. ∆θ and ∆U represent the deviations of the bus voltage angles and magnitudes. H, N, M and L are the submatrices of the Jacobian matrix J.
The eigenvalues of the Jacobian matrix are, respectively, λ1, λ2, …, λn, the mathematical relationship between the determinant and the eigenvalue of the Jacobian matrix is:
J = λ 1 λ 2 λ n = i = 1 n λ i
The minimum modulus eigenvalue quantitatively characterizes the proximity of the current operating condition to the static voltage stability limit []. As this eigenvalue decreases, the system’s voltage stability margin diminishes, increasing its vulnerability to voltage collapse.
To solve the minimum modulus eigenvalue of the AC/DC system, first of all, the node type of the PCC needs to be determined according to the control mode of the converter station. Secondly, based on the node type, the corresponding power flow equation is added to the AC system power flow equation system to form the power correction equation system of the AC/DC systems. Finally, the minimum modulus eigenvalue of the AC/DC system is solved based on the Jacobian matrix of the AC/DC system. Equation (6) becomes:
Δ P a Δ P P C C Δ Q a Δ Q P C C = H 1 H 2 N 1 N 2 H 3 H 4 N 3 N 4 M 1 M 2 L 1 L 2 M 3 M 4 L 3 L 4 Δ θ Δ θ P C C Δ U / U Δ U P C C / U
where ∆PPCC and ∆QPCC represent the active and reactive power correction at point PCC. H1, N1, M1, L1 and H, N, M, L in Equation (6) are the same. H2 is the partial derivative of the active power correction at the AC node with respect to the voltage phase angle at the PCC point, and H3 is the partial derivative of the active power correction at the PCC point with respect to the voltage phase angle at the AC node. H4 is the partial derivative of the active power correction at point PCC with respect to the voltage phase angle at point PCC. N2 is the partial derivative of the active power correction at the AC node with respect to the voltage amplitude at the PCC point, and N3 is the partial derivative of the active power correction at the PCC point with respect to the voltage amplitude at the AC node. N4 is the partial derivative of the active power correction at point PCC with respect to the voltage amplitude at point PCC. M2 is the partial derivative of the reactive power correction at the AC node with respect to the voltage phase angle at the PCC point, and M3 is the partial derivative of the reactive power correction at the PCC point with respect to the voltage phase angle at the AC node. M4 is the partial derivative of the reactive power correction at point PCC with respect to the voltage phase angle at point PCC. L2 is the partial derivative of the reactive power correction at the AC node with respect to the voltage amplitude at the PCC point, and L3 is the partial derivative of the reactive power correction at the PCC point with respect to the voltage amplitude at the AC node. L4 is the partial derivative of the reactive power correction at point PCC with respect to the voltage amplitude at point PCC. ∆θPCC and ∆UPCC represent the correction amounts of the phase angle and amplitude of the voltage at the PCC point.
When the active power and reactive power of the converter are adjusted, the correction quantities of active and reactive power in the power flow equation will also change accordingly, thereby affecting the node voltage obtained in each power flow iteration process. Since each element in the Jacobian matrix is a function of the voltage phase angle and amplitude, adjusting the active and reactive power of the converter station will affect each element in the Jacobian matrix and thus the eigenvalues of the Jacobian matrix. In conclusion, reasonably adjusting the active and reactive power of the converter will have a positive impact on the static voltage stability of the system.
Take the use of P-Q control for the sending end converter and Udc-Q control for the receiving end converter as an example. At this point, both the PCC point at the sending end and the receiving end are PQ nodes. Then, in Equation (8), ∆PPCC = [∆P1,P2]T, ∆QPCC= [∆Q1,Q2]T. Therefore, changing the four control quantities at the PCC points at the sending end and the receiving end can improve the static voltage stability of the system. However, it can be known from Equations (4) and (5) that the active power input into the AC system by the receiving converter station is not controlled, instead it is determined by the active control quantity of the sending converter station and the power transmission losses. Therefore, due to the coupling between ∆P1 and ∆P2, there are only three adjustable independent control quantities, namely the active control quantity P1 and reactive control quantity Q1 of the sending converter station, and the reactive control quantity Q2 of the receiving converter station.

3. Optimization Model to Cooperatively Control Active and Reactive Power for VSC-HVDC

3.1. Construction of the Optimization Model

To ensure the overall voltage stability of the system and the transmission efficiency of VSC-HVDC, this study takes the maximization of the system’s minimum modulus eigenvalue as the optimization objective. The constraints include power flow balance, bus voltages, generator outputs, converter station transmission powers and the VSC-HVDC transmission power. The optimization variables are the active and reactive power adjustments of the sending-end converter stations and the reactive power adjustments of the receiving-end converter stations. Based on these, an optimization control model for VSC-HVDC transmission within the power grid has been established.
The objective function is to maximize the system’s minimum modulus eigenvalue, which can be expressed as:
max λ ( Δ P 1 , Δ Q 1 , Δ Q 2 )
where λ denotes the system’s minimum modulus eigenvalue, and ∆P1, ∆Q1, and ∆Q2 represent the active and reactive power adjustment of the sending-end converter station and the reactive power adjustment of the receiving-end converter station, respectively.
The power flow balance constraints can be specifically expressed as:
P G i P L i = U 1 i j = 1 N U 1 j [ G i j cos θ i j + B i j sin θ i j ]
Q G i Q L i = U i j = 1 N U j [ G i j sin θ i j B i j cos θ i j ]
where PGi and PLi represent the active power output of the generator and the active load at bus i; QGi and QLi represent the reactive power output of the generator and the reactive load at bus i; Gij, Bij, and θij denote the conductance, susceptance, and voltage angle difference between buses i and j in the admittance matrix; and Ui and Uj are the voltage magnitudes at buses i and j.
The voltage constraints can be specifically expressed as:
U i min U i U i max
where Uimin, Uimax, and Ui represent the lower voltage limit value, upper voltage limit value, and the voltage at bus i in the sending-end system, respectively.
The generator output constraints can be specifically expressed as:
S G i min S G i S G i max
where SGimin, SGimax, and SGi represent the lower limit value, upper limit value, and the apparent power of generator i in the sending-end system, respectively.
The transmission power constraints of the converter stations can be divided into those for the sending-end converter stations and those for the receiving-end converter stations, which can be specifically expressed as:
P 10 + P 1 2 + Q 10 + Q 1 2 S
P 20 + P 2 2 + Q 20 + Q 2 2 S
where S denotes the transmission power limit of the VSC-HVDC system; P10 and Q10 represent the active and reactive power transmitted by the sending-end converter station under the initial operating condition; P20 and Q20 represent the active and reactive power transmitted by the receiving-end converter station under the initial operating condition.
In addition, the primary purpose of VSC-HVDC is to transfer electric power and thus the active power should not be too small, which can be expressed by:
P 10 + P 1 50 % S
where S represents the transmission power limit of the VSC-HVDC system; P1 represents the active power transmitted by the converter station at the sending end under the initial operating conditions. ∆P1 is the active power adjustment amount of the converter station at the sending end.

3.2. Solution of the Optimization Model

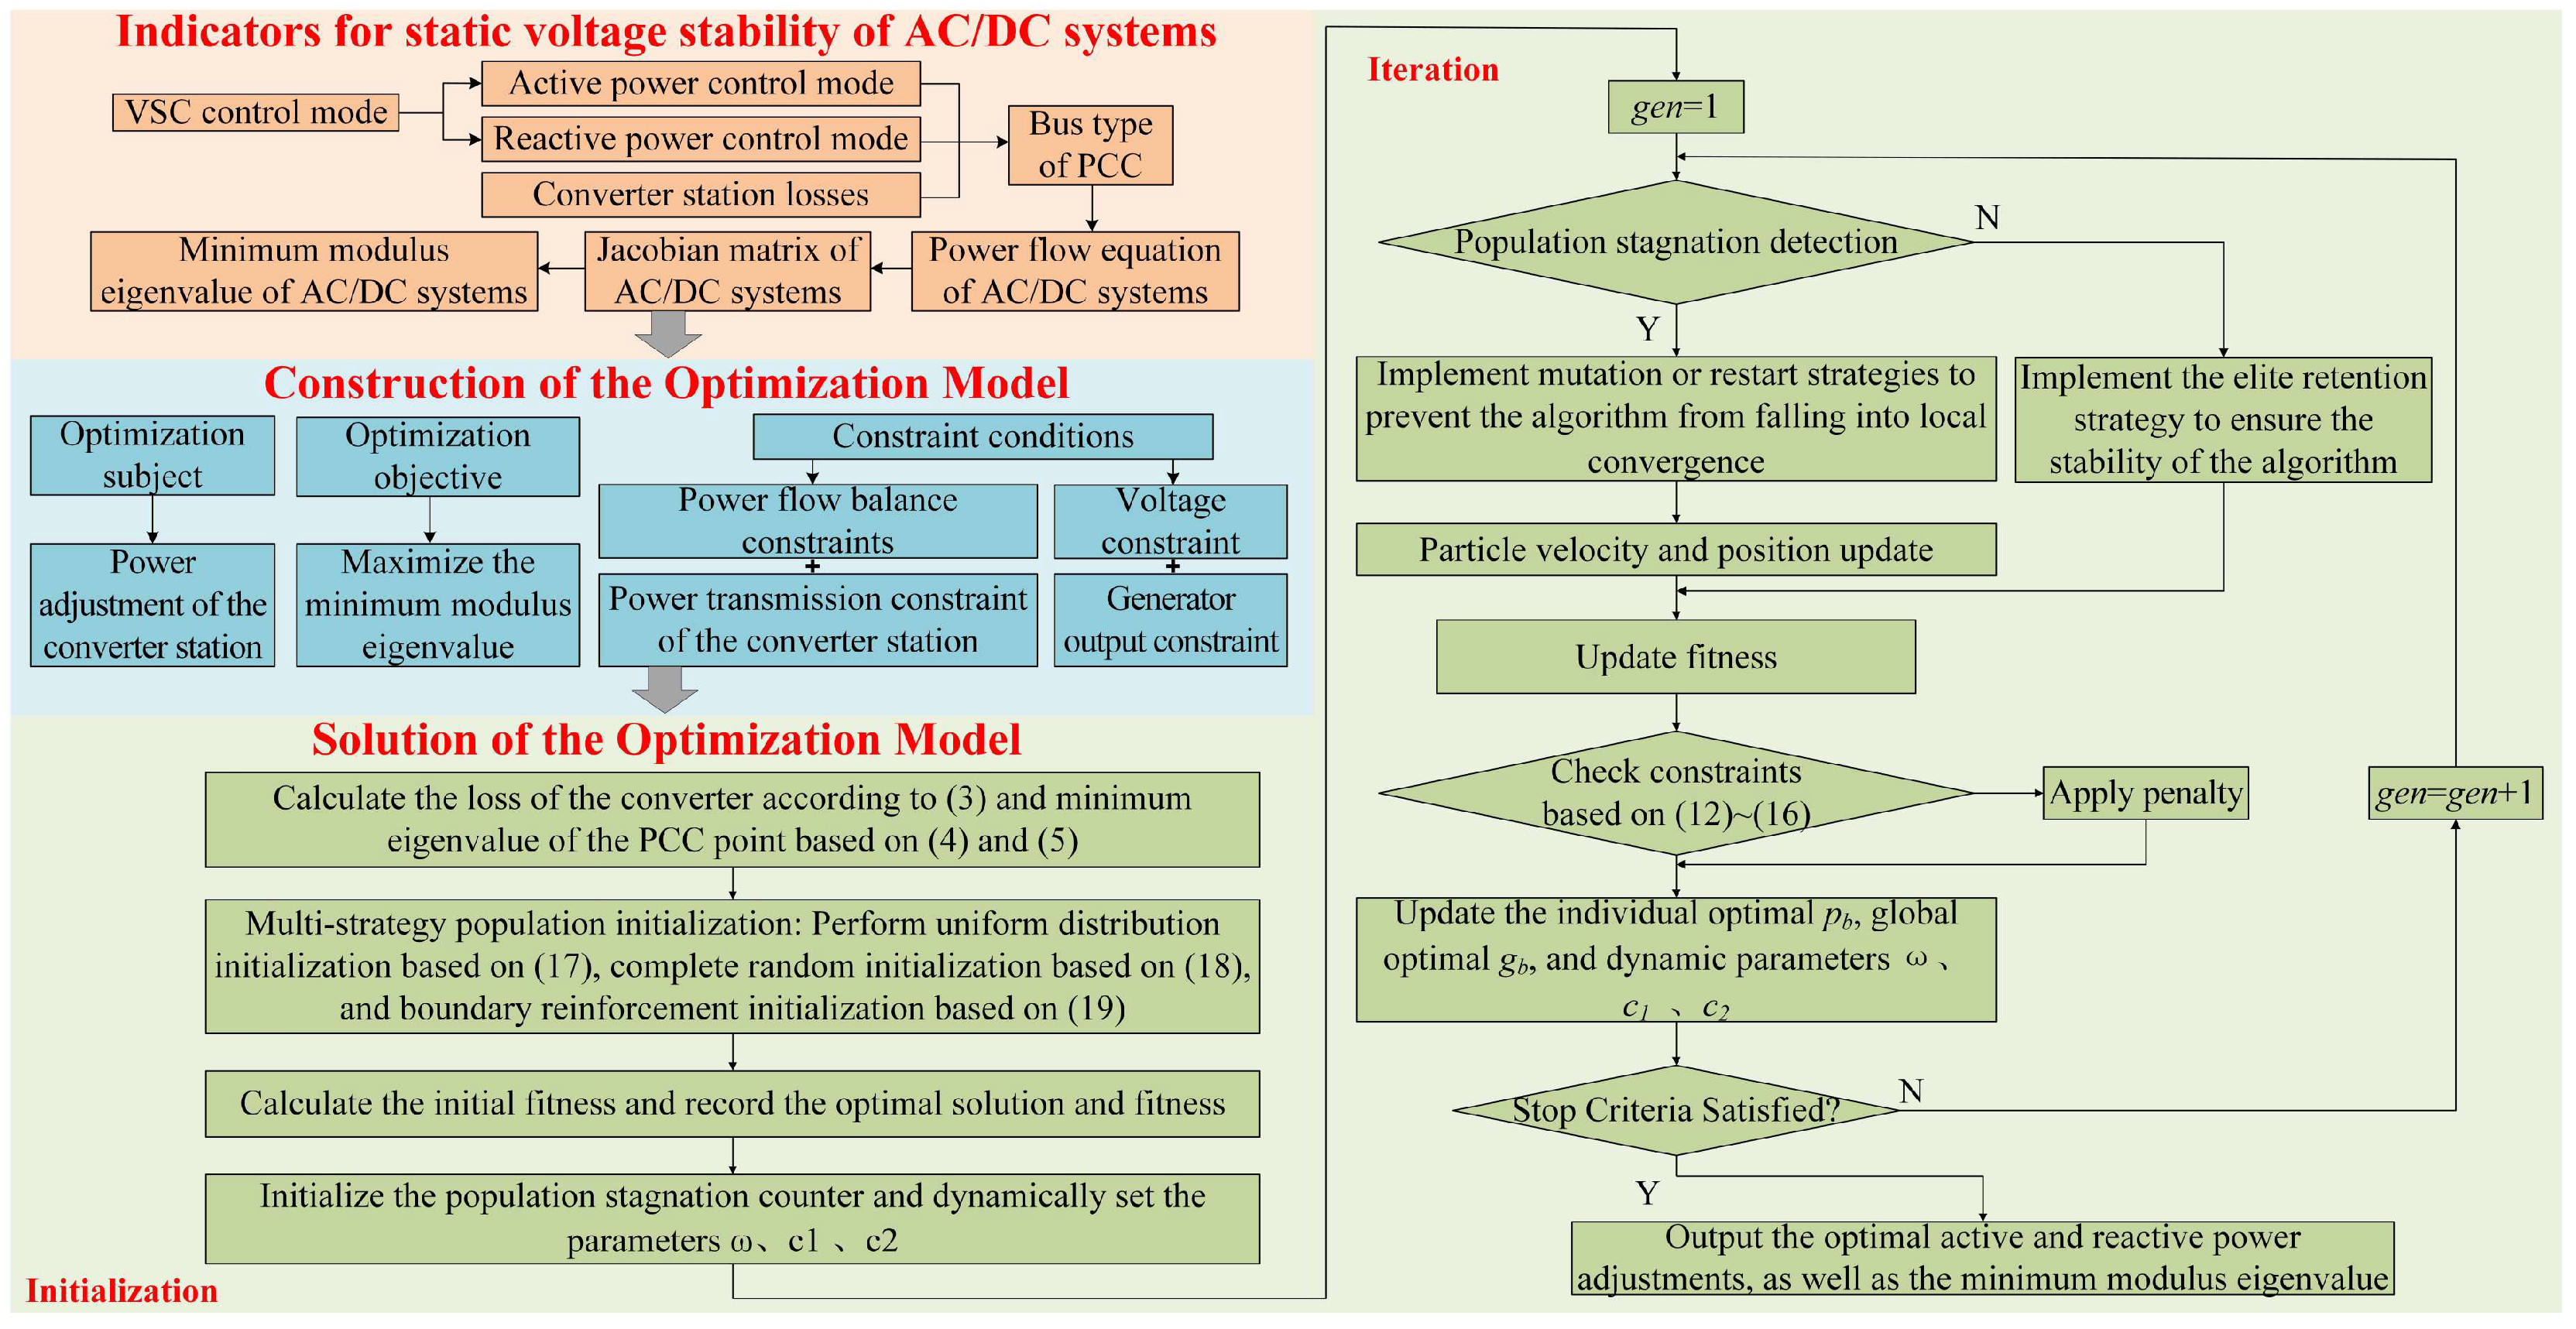
The aforementioned optimization model is essentially a multivariate nonlinear optimization problem. This paper employs an improved particle swarm optimization (PSO) algorithm to solve the optimization model. This enhanced algorithm incorporates four key improvements over the traditional PSO. The first aspect involves dynamic multi-stage parameter adaptive adjustment. Traditional PSO algorithms with fixed parameter settings are prone to falling into local optima. The improved PSO algorithm adopted in this paper divides the iterative optimization process into three phases: exploration, balance, and exploitation. During the exploration phase, the cognitive coefficient c1 is increased while the social coefficient c2 is decreased, allowing particles to fully explore the solution space and avoid premature convergence. In the balance phase, the cognitive coefficient c1 linearly decreases while the social coefficient c2 linearly increases, balancing the particle’s individual exploration and social learning. During the exploitation phase, the cognitive coefficient c1 is further linearly reduced and the social coefficient c2 is linearly increased to improve convergence accuracy.
The second aspect is a multi-strategy population initialization method. Traditional random initialization in PSO may lead to uneven population distribution, affecting global search capability. The improved PSO algorithm used in this paper proportionally combines uniformly initialized particles, completely randomly initialized particles, and boundary-enhanced initialized particles, ensuring both global coverage and enhanced boundary search. Among these, the position of the i-th particle initialized with uniform distribution can be expressed as:
p o p ( i ) = p o p m i n + ( p o p m a x p o p m i n ) ( i 1 ) / ( s i z e p o p 1 )
where popmax represents the maximum particle position, popmin denotes the minimum particle position, and sizepop indicates the number of particles.
The position of the i-th particle initialized with complete randomness can be expressed as:
p o p ( i ) = p o p m i n + ( p o p m a x p o p m i n ) r a n d
where popmax represents the maximum particle position, popmin denotes the minimum particle position, and rand is a random number within the range [0, 1].
The position of the i-th particle initialized with boundary enhancement can be expressed as:
p o p ( i ) = p o p m i n + 0.1 ( p o p m a x p o p m i n ) r a n d       r a n d > 0.5   p o p m a x 0.1 ( p o p m a x p o p m i n ) r a n d       r a n d 0 . 5  
where popmax represents the maximum particle position, popmin denotes the minimum particle position, and rand is a random number within the range [0, 1].
The third aspect involves a hierarchical response strategy. To address the issue of traditional PSO easily falling into local optima, this study introduces a stagnation counter that statistically tracks whether the optimal fitness changes between two consecutive generations. When mild stagnation is detected, a Gaussian mutation strategy is applied to randomly selected particles to introduce perturbations and increase population diversity. When severe stagnation occurs, the worst-performing 40% of particles are identified and fully reinitialized.
The fourth aspect is an elite retention strategy. To ensure rapid convergence toward the optimal region in each iteration and reduce random influences, the top-performing particles are preserved according to an elite retention ratio, thereby enhancing the stability and reliability of the results. The workflow of the improved PSO algorithm is illustrated in Figure 3.
Figure 3. Flowchart of the VSC-HVDC active and reactive power coordinated control strategy.

4. Case Study

4.1. System Under Study

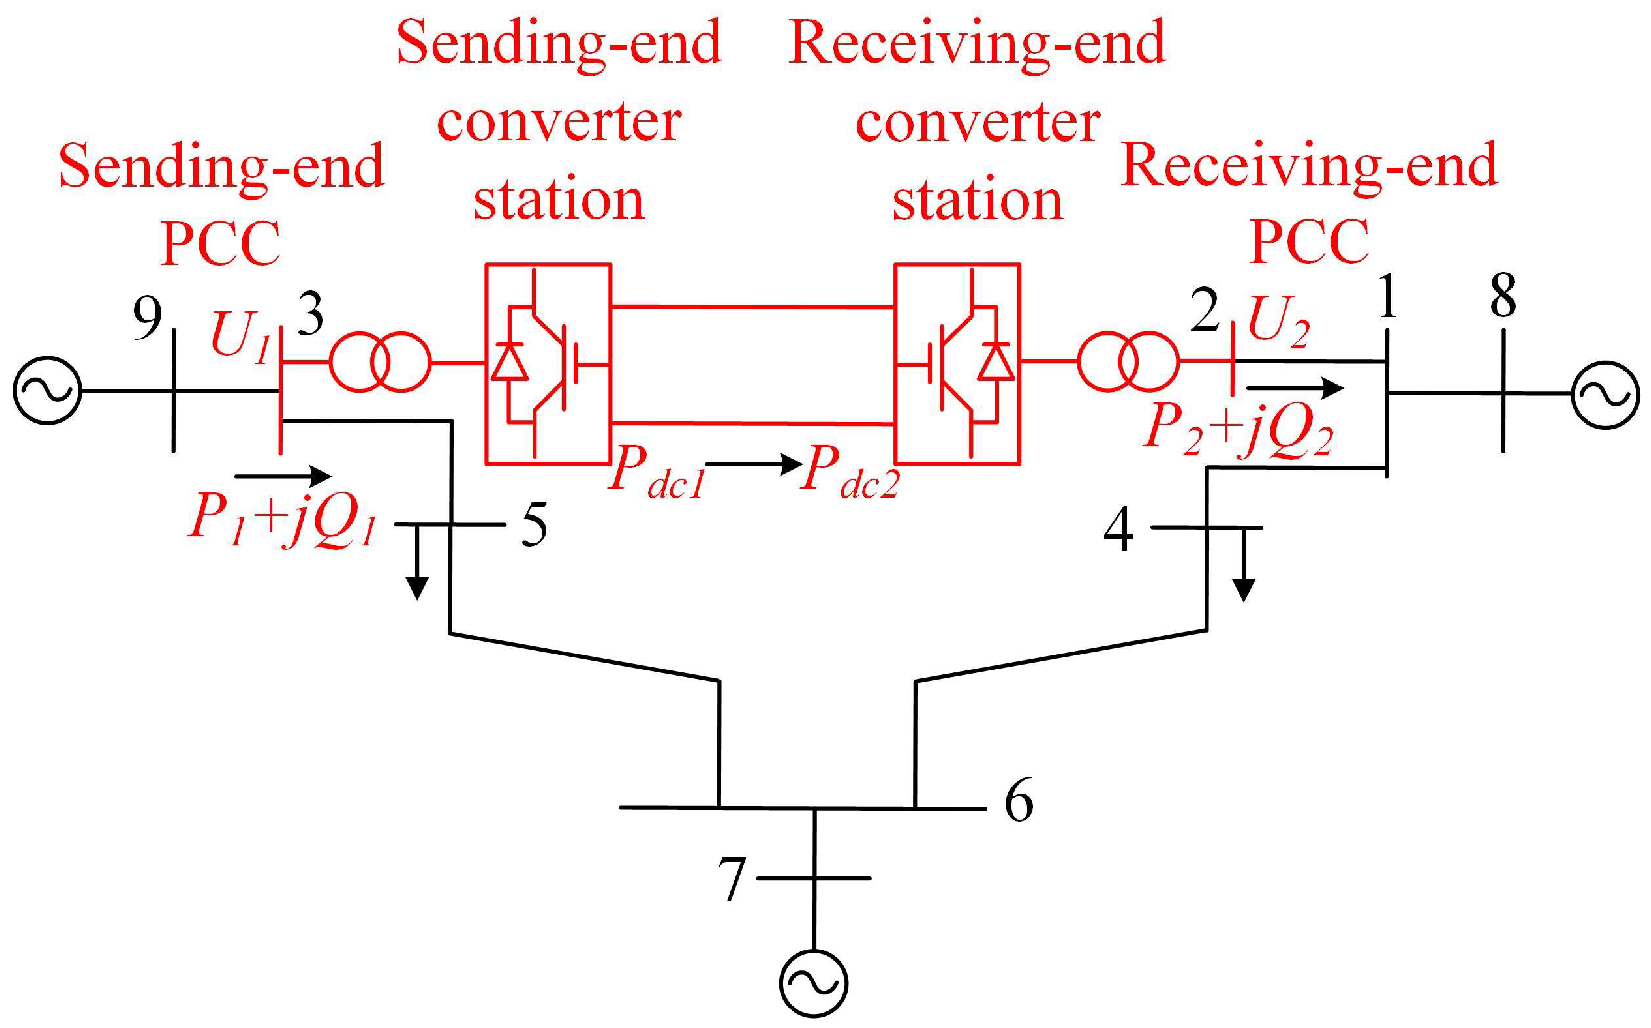
To verify the effectiveness of the coordinated active and reactive power control strategy for AC/DC systems proposed above, simulations are conducted by using an IEEE 9-bus system with VSC-HVDC transmission. The system configuration is shown in Figure 4. One of the lines in the standard IEEE 9-bus system is replaced by a VSC-HVDC transmission line. The HVDC transmission system has a rated voltage of ±290 kV and a rated power of 650MW, operating in bipolar mode. The sending-end converter adopts P-Q control mode, while the receiving-end converter uses Udc-Q control mode. The simulation was conducted on a computer equipped with an Intel Core i7-13700H processor (14 cores, 20 threads) and 16 GB of DDR5-5200 RAM. The software environment consisted of the Windows 11 operating system and MATLAB R2023b.
Figure 4. IEEE 9-Bus System Schematic Diagram.

4.2. Fitting and Verification of VSC-HVDC Converter Loss Function

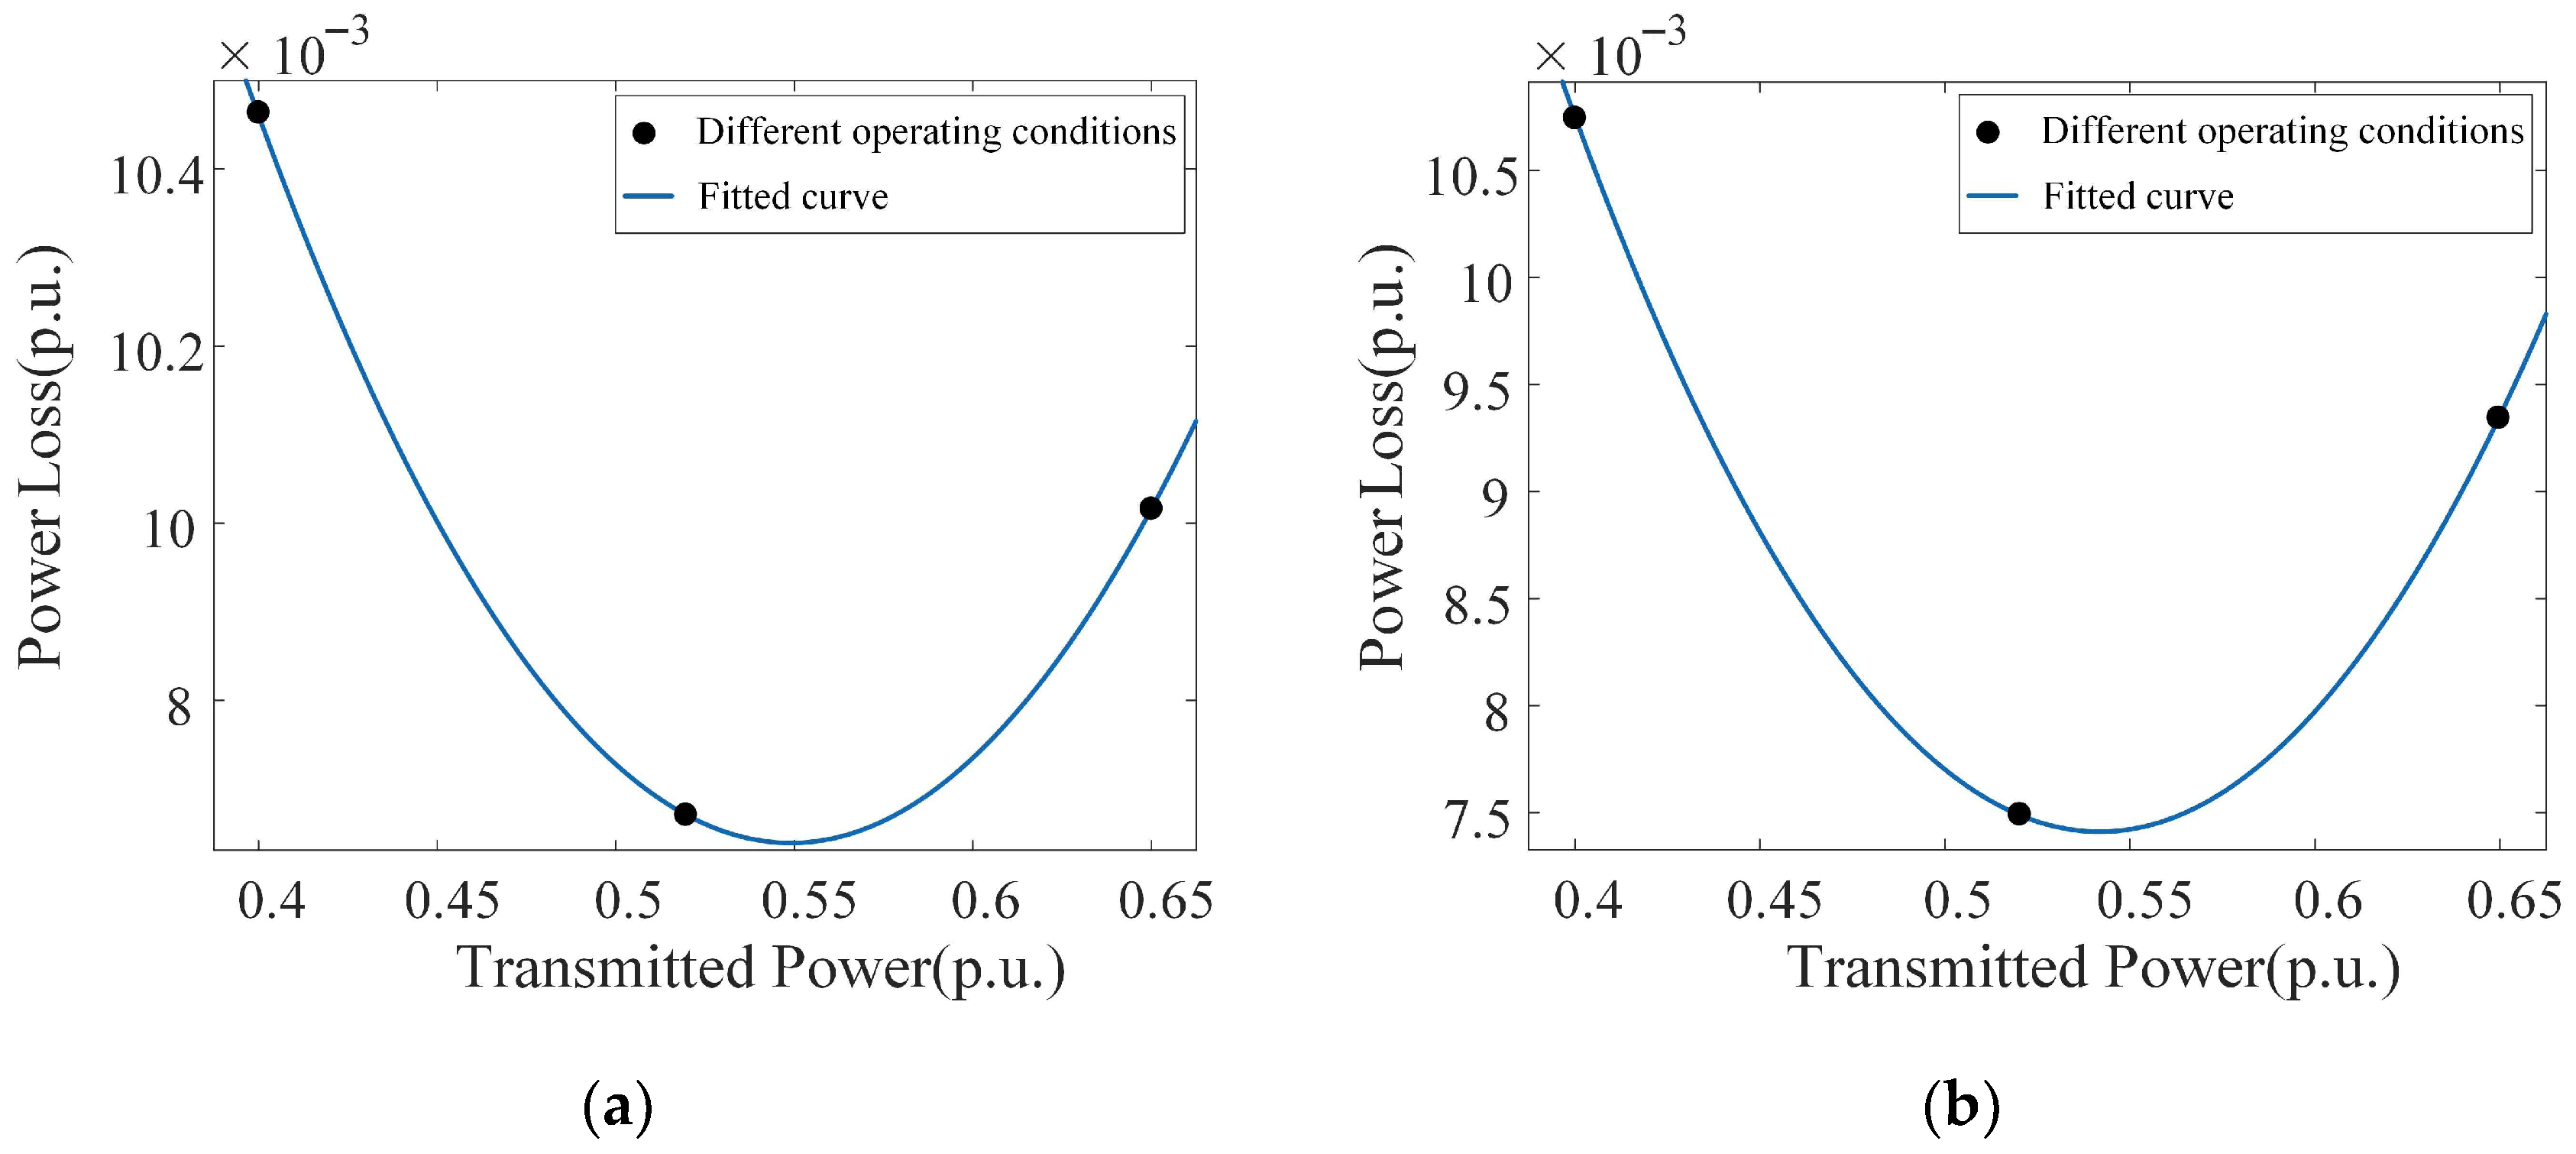
According to (3), neglecting voltage fluctuations, the converter station’s loss power has a quadratic relationship with P 2 + Q 2 of the PCC. The loss parameters of the converter station can be determined by simulating and measuring the PCC power and losses under three different operating conditions. Specifically, the power references of the sending-end converter station are set to three different values, resulting in three distinct operating conditions, respectively. The receiving-end converter station is similarly set with three different operating conditions. The fitting curves are shown in Figure 5 and the fitting results are shown in Table 1. To verify the accuracy of the fitted results, a fourth operating condition is applied to both converter stations, and the verification results are presented in Table 2.
Figure 5. Loss function fitting curve. (a) Fitting curve of the loss function of the converter at the sending end; (b) Fitting curve of the loss function of the converter at the receiving end.
Table 1. Loss Parameters.
Table 2. Verification of Loss Function.
As shown in Table 2, the errors between the converter losses calculated using the loss model and those obtained from simulation are very small. This not only indicates the rationality of the selected loss model in this study, but also fully demonstrates the accuracy of the loss parameters fitted in Table 1, providing a solid data basis for the subsequent coordinated active and reactive power control.

4.3. Influence of Active and Reactive Power Variation on the System’s Static Voltage Stability

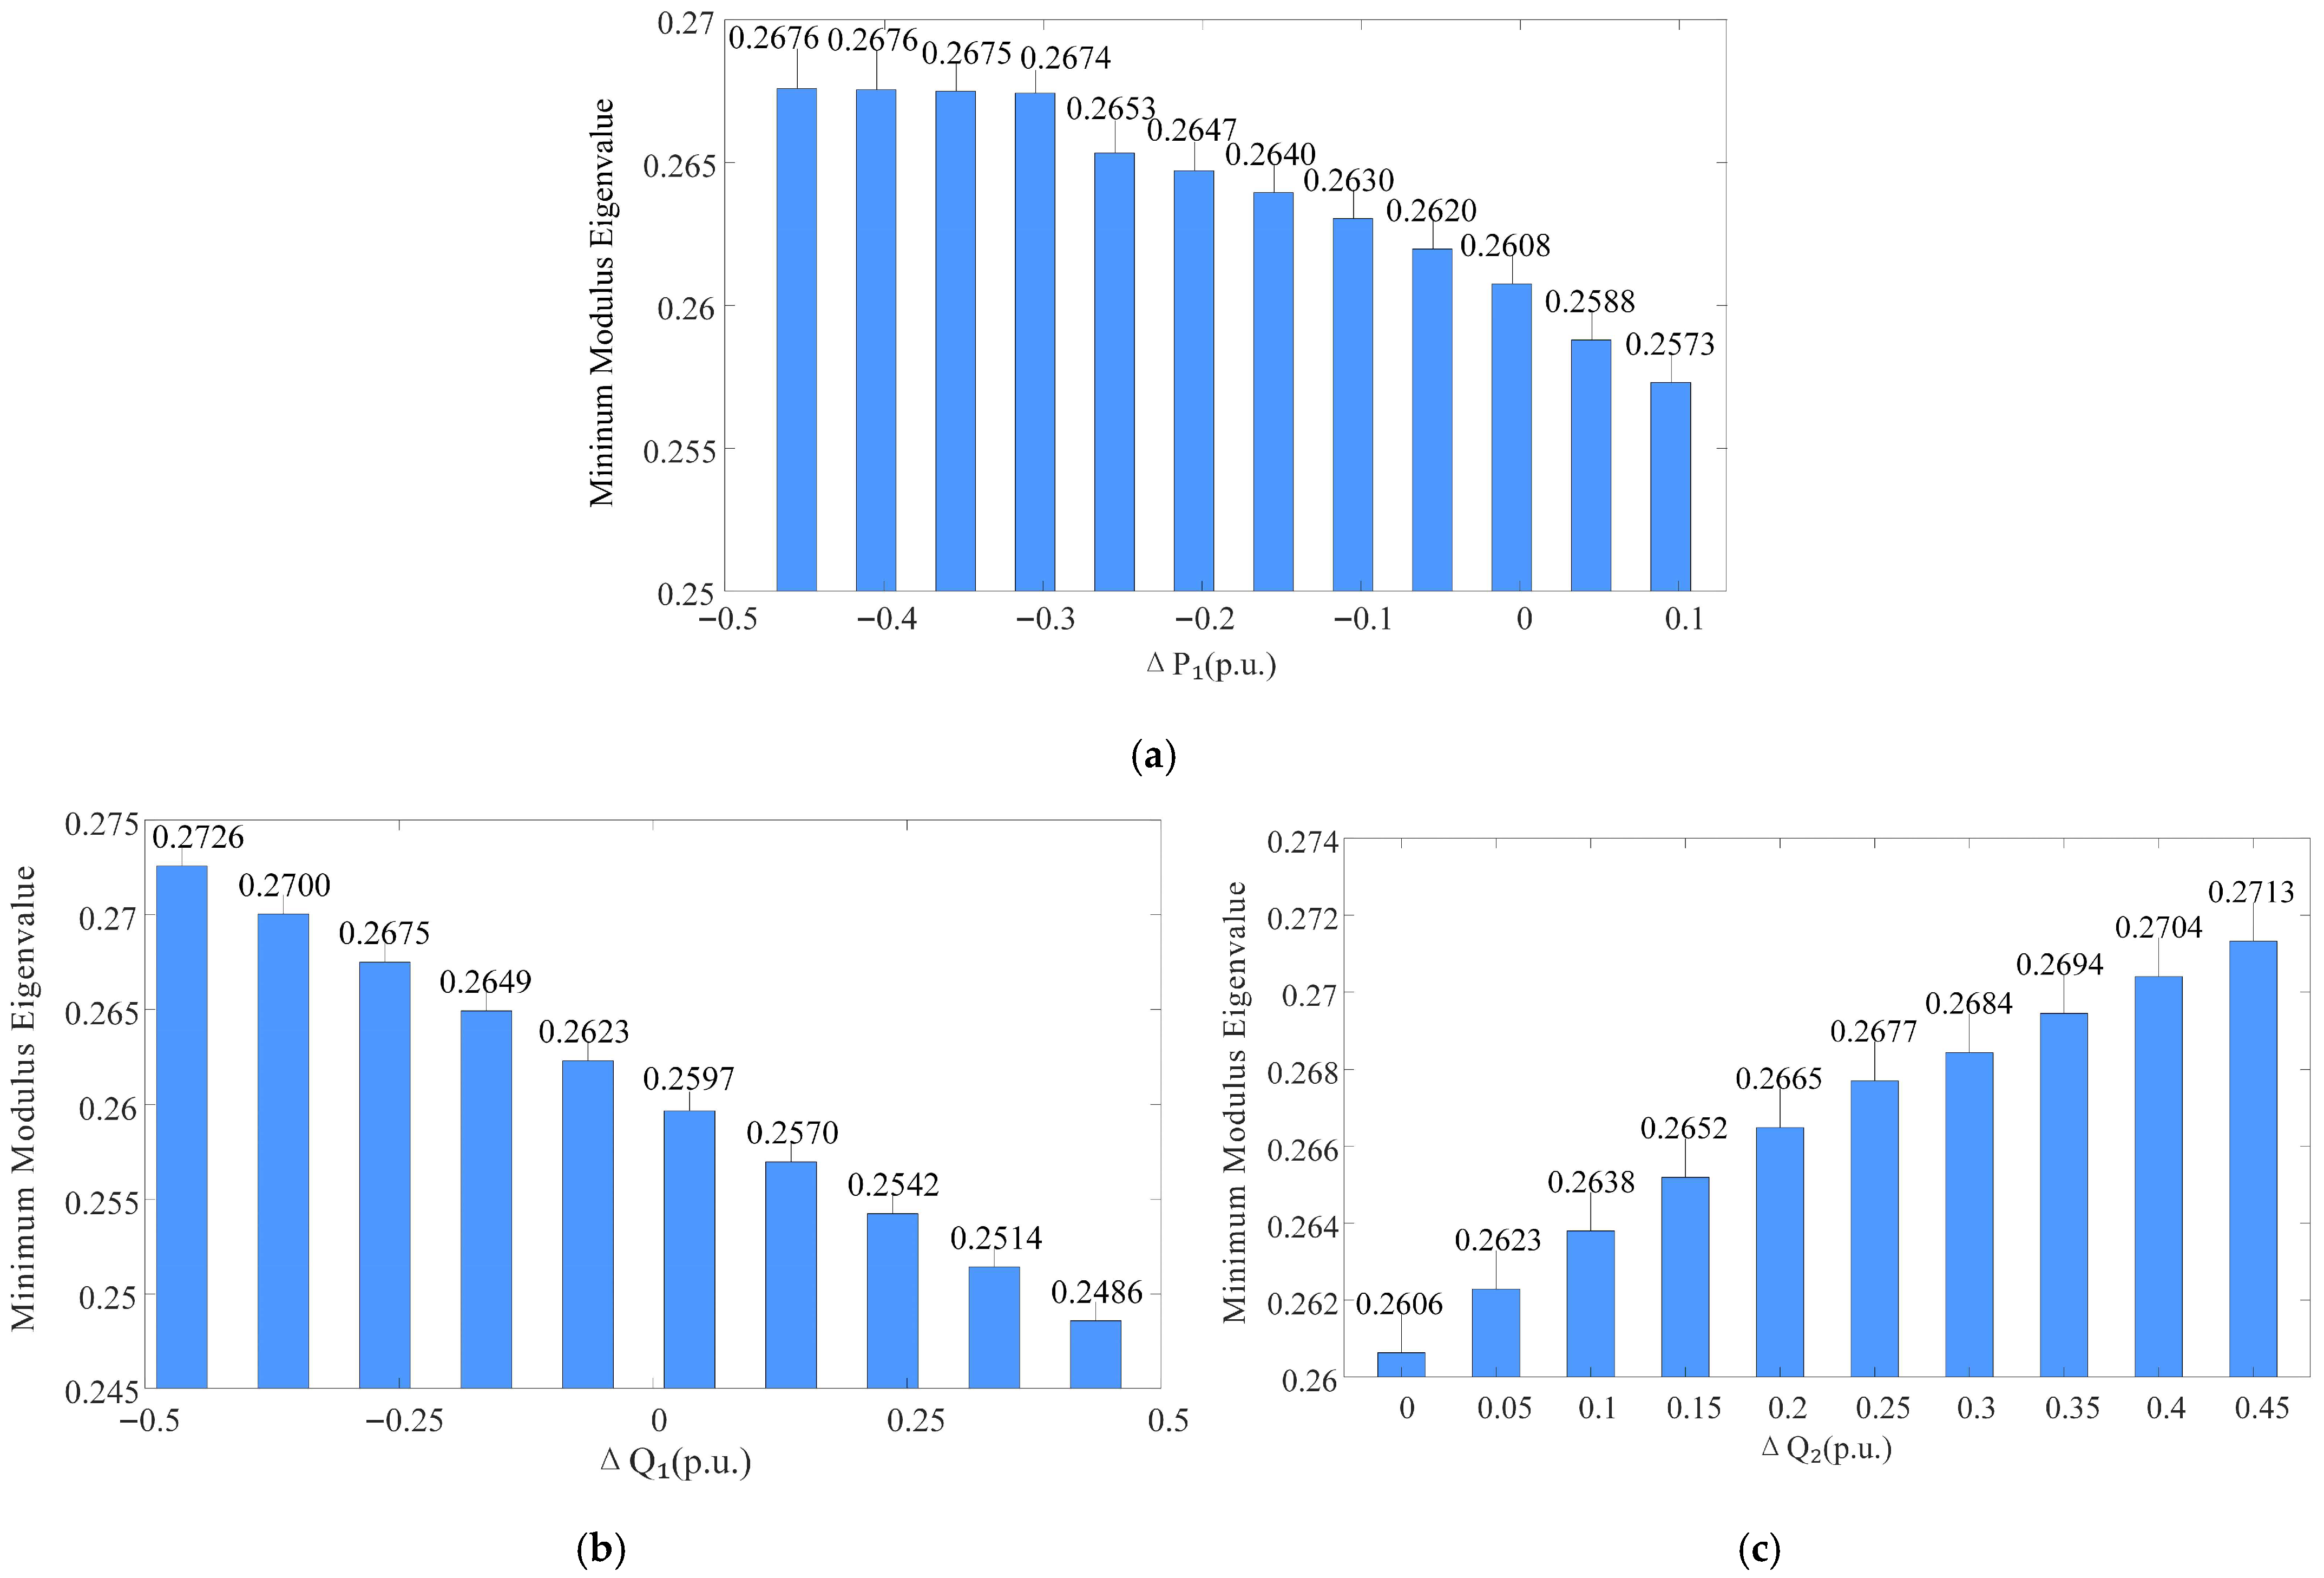
As can be seen from Section 2.2 of this paper, both active power control and reactive power control will affect the Jacobian matrix elements and power flow distribution of the system, thereby influencing the static voltage stability of the system. The changes in minimum modulus eigenvalue as functions of different power variations are shown in Figure 6. When the active and reactive power at the sending-end converter station increase, the system’s minimum modulus eigenvalue decreases, and the static stability margin of the system declines. Conversely, when the receiving-end converter station injects more reactive power into the AC system, the system’s minimum modulus eigenvalue rises, and the static stability margin improves. In summary, different control powers have varying effects on the system’s static voltage stability, and the influence of a single control power may be limited. Therefore, this study employs an optimization model to coordinate the three control powers to achieve the best static voltage stability of the system.
Figure 6. The influence of power variation on the static voltage stability of the system. (a) Sending-end active power; (b) Sending-end reactive power; (c) Receiving-end reactive power.

4.4. Performance of Coordinated Active and Reactive Power Control in the IEEE 9-Bus System

To verify the effectiveness of the coordinated active and reactive power control strategy proposed in Section 3, the following three cases are studied:
Case 1: Only active power control is activated.
Case 2: Only reactive power control is activated.
Case 3: Coordinated active and reactive power control is applied.
The initial active power reference of the sending-end converter station is set as Pref = 0.8 p.u., and the initial reactive power reference is Qref = 0. The receiving-end converter station’s initial reactive power reference is Qref = 0. The system’s initial minimum modulus eigenvalue is λ0 = 0.2606. The allowable AC system bus voltage range is 0.9 p.u.~1.1 p.u.
When only active power control is performed, the active power adjustment range is −0.3 p.u.~0.2 p.u., while the sending-end and receiving-end converter reactive powers remain at their initial values of 0.
When only reactive power control is performed, the reactive power adjustment range for both sending-end and receiving-end converters is −0.6 p.u.~0.6 p.u., with the sending-end active power remains at the initial state of 0.8 p.u.
When both active and reactive power are controlled in coordination, the active power adjustment range is −0.3 p.u.~0.2 p.u., and the reactive power adjustment range for both sending-end and receiving-end converters is −0.866 p.u.~0.866 p.u.
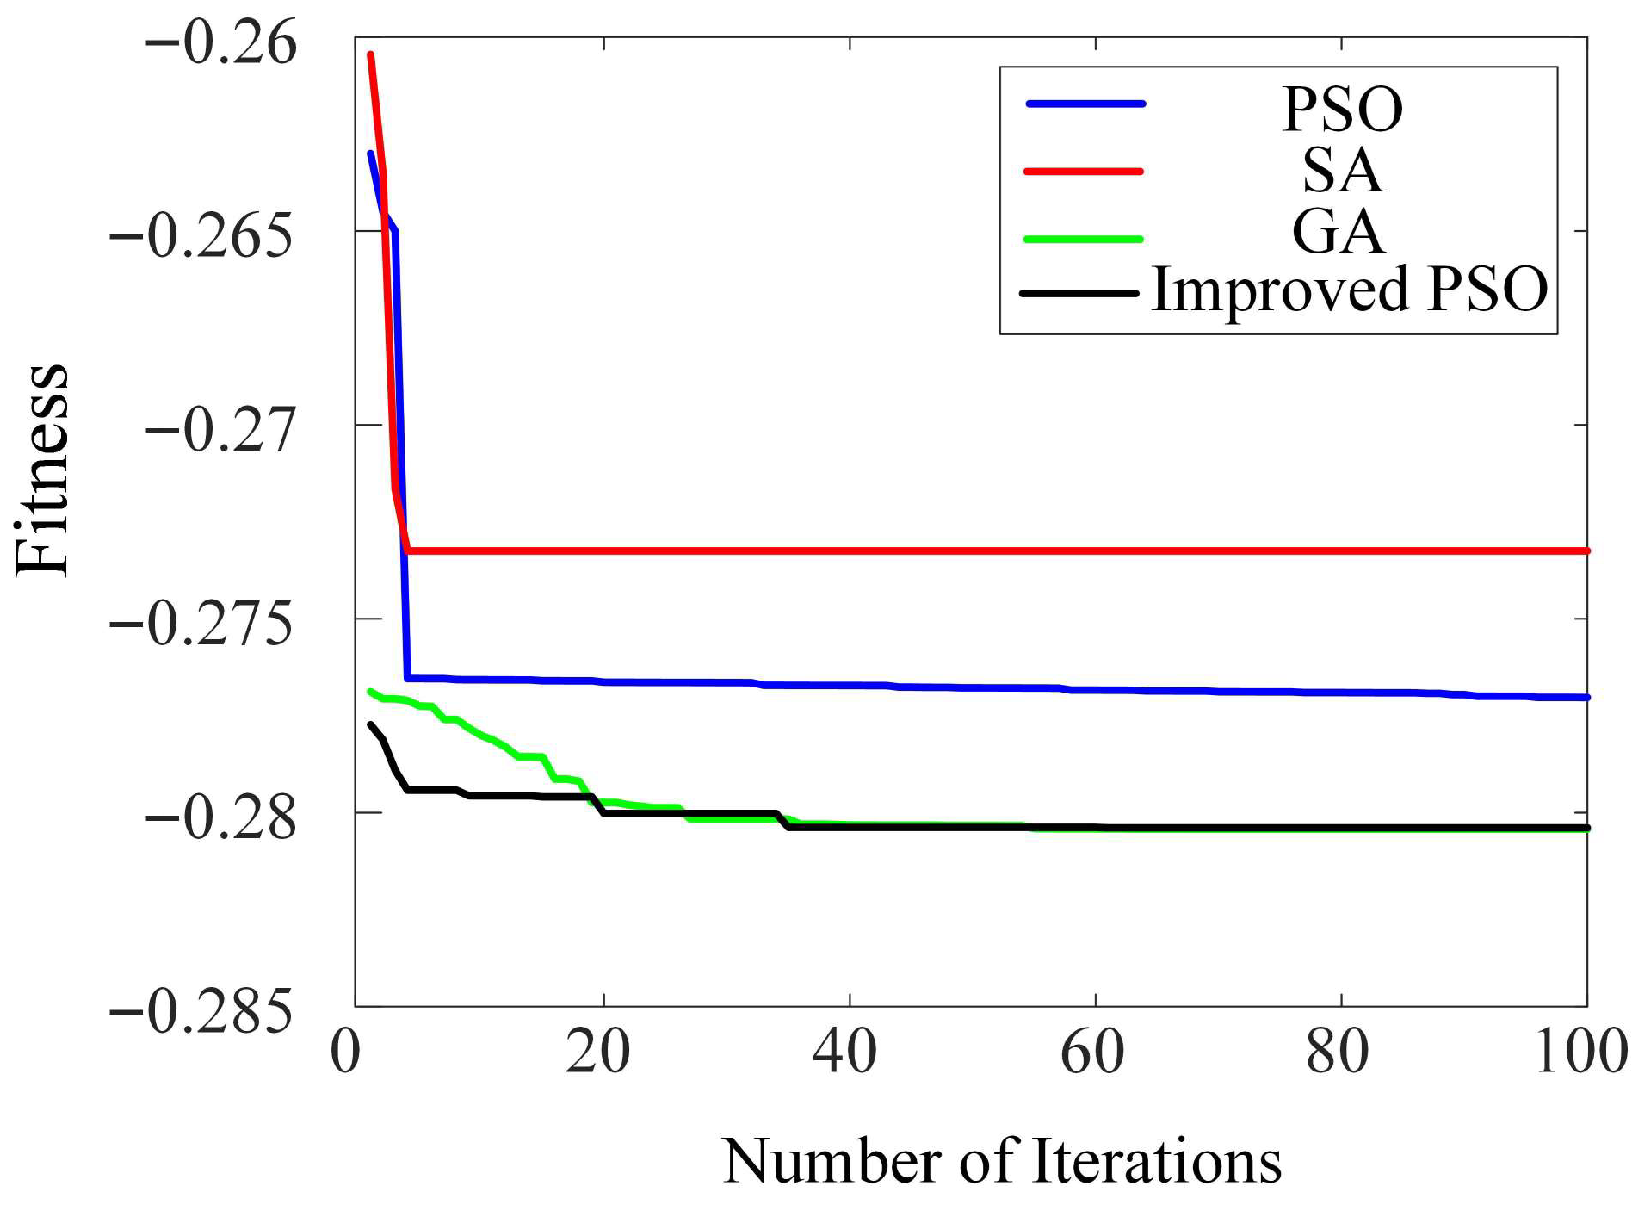
Based on the optimization model developed in Section 3.1 for coordinated active and reactive power optimization of the flexible HVDC system, four optimization algorithms were employed for solution: SA (Simulated Annealing), GA (Genetic Algorithm), conventional PSO (Particle Swarm Optimization), and an Improved PSO algorithm. The parameter settings for the optimization algorithms were configured as follows: population size of 100, maximum iteration count of 100, elite retention ratio of 15%, Gaussian mutation rate of 0.1, mild stagnation threshold of 10, and severe restart threshold of 20. The optimization process was divided into exploration (iterations 1–30), balance (iterations 31–70), and exploitation (iterations 71–100) phases, with corresponding parameter adjustments: during the exploration phase, the inertia weight ω was 0.9, cognitive coefficient c1 was 2.5, and social coefficient c2 was 0.5; in the balance phase, ω decreased linearly from 0.7 to 0.4, c1 decreased linearly from 2.5 to 1.0, and c2 increased linearly from 0.5 to 2.0; during the exploitation phase, ω decreased linearly from 0.4 to 0.2, c1 decreased linearly from 1.0 to 0.3, and c2 increased linearly from 2.0 to 2.5. The variation trends of the optimization objective values with respect to iteration numbers for each algorithm are shown in Figure 7.
Figure 7. Comparison of Iteration Results among Different Algorithms.
As can be observed from the figure, the improved PSO algorithm adopted in this paper achieves a smaller final optimization value compared to both the SA algorithm and the traditional PSO algorithm, demonstrating superior optimization performance. When compared to the GA algorithm, while there is minimal difference in their final optimization values, the curve of the improved PSO algorithm decreases rapidly during the early iteration stages and approaches near-convergence around approximately the 30th generation. In contrast, the GA algorithm only reaches a comparable level around the 50th generation. In summary, the improved PSO algorithm exhibits faster convergence speed and satisfactory optimization effectiveness. Therefore, this paper employs the algorithm to solve the coordinated control strategy for active and reactive power in the VSC-HVDC system. The corresponding optimization results are presented in Table 3.
Table 3. Comparison of the results of the three situations.
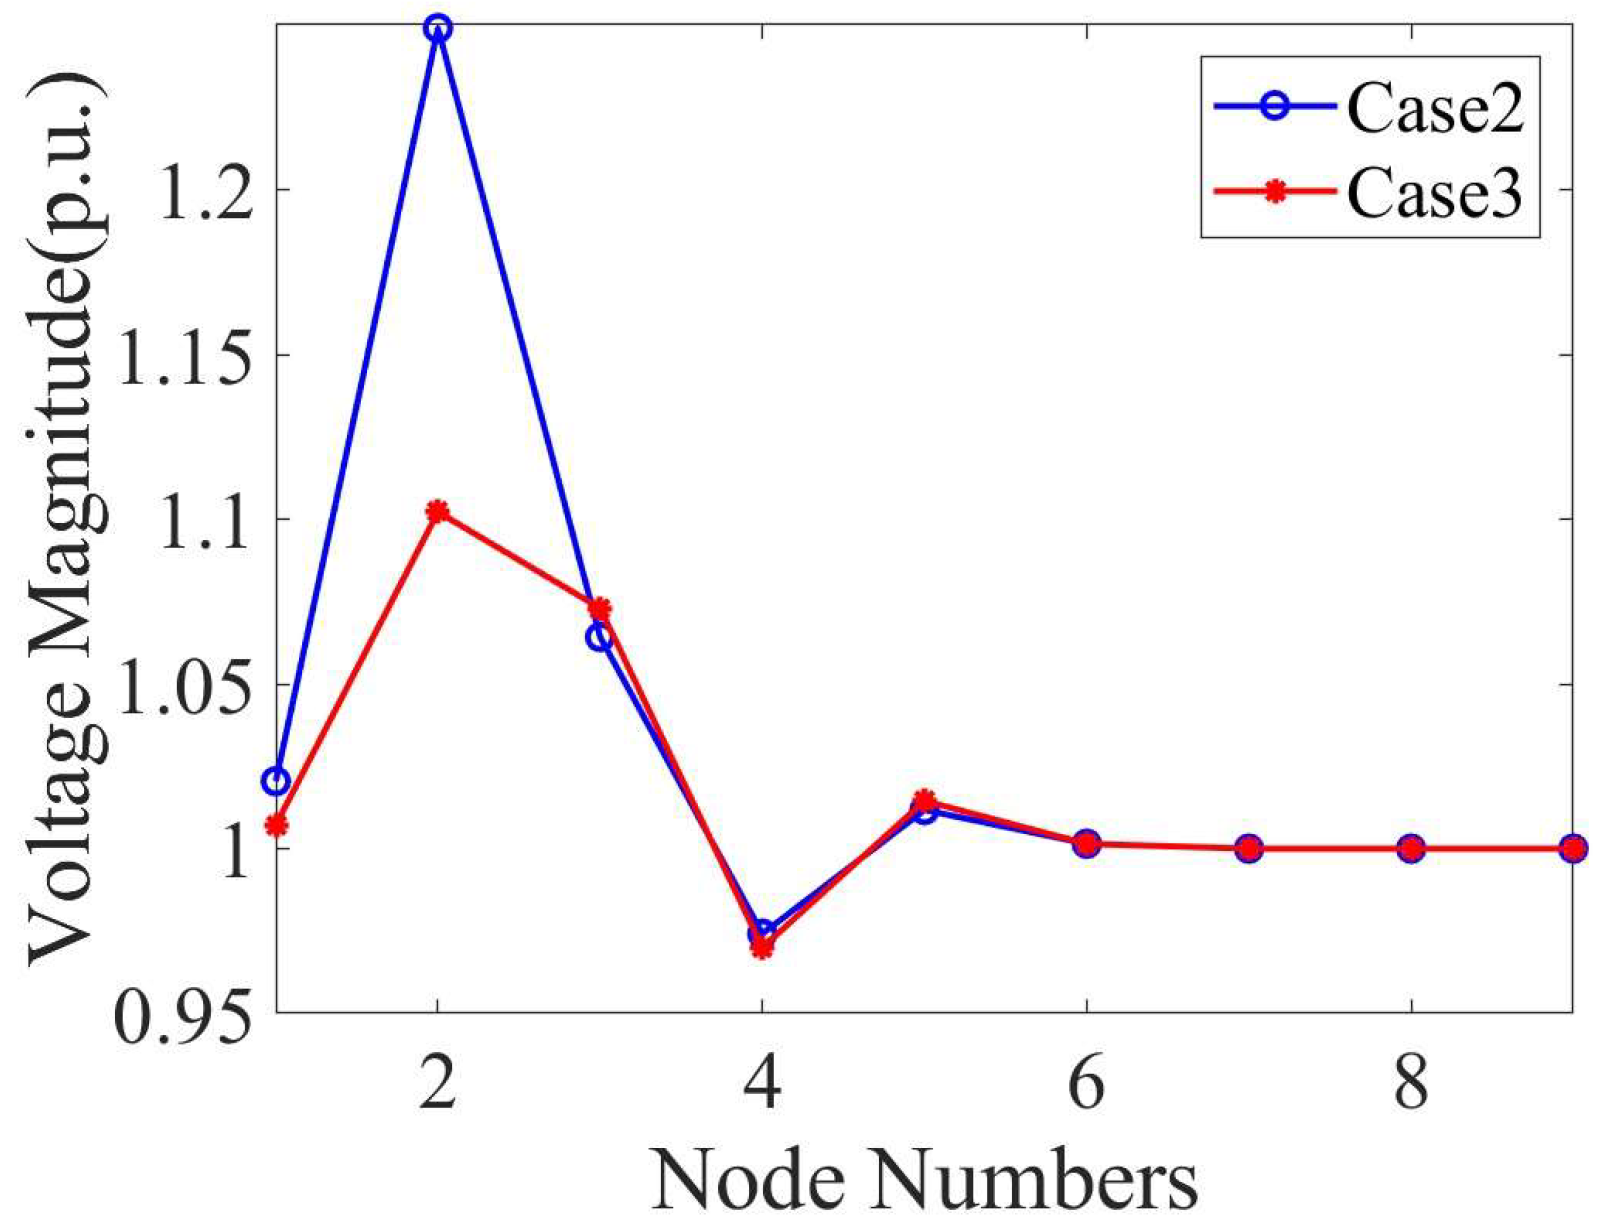
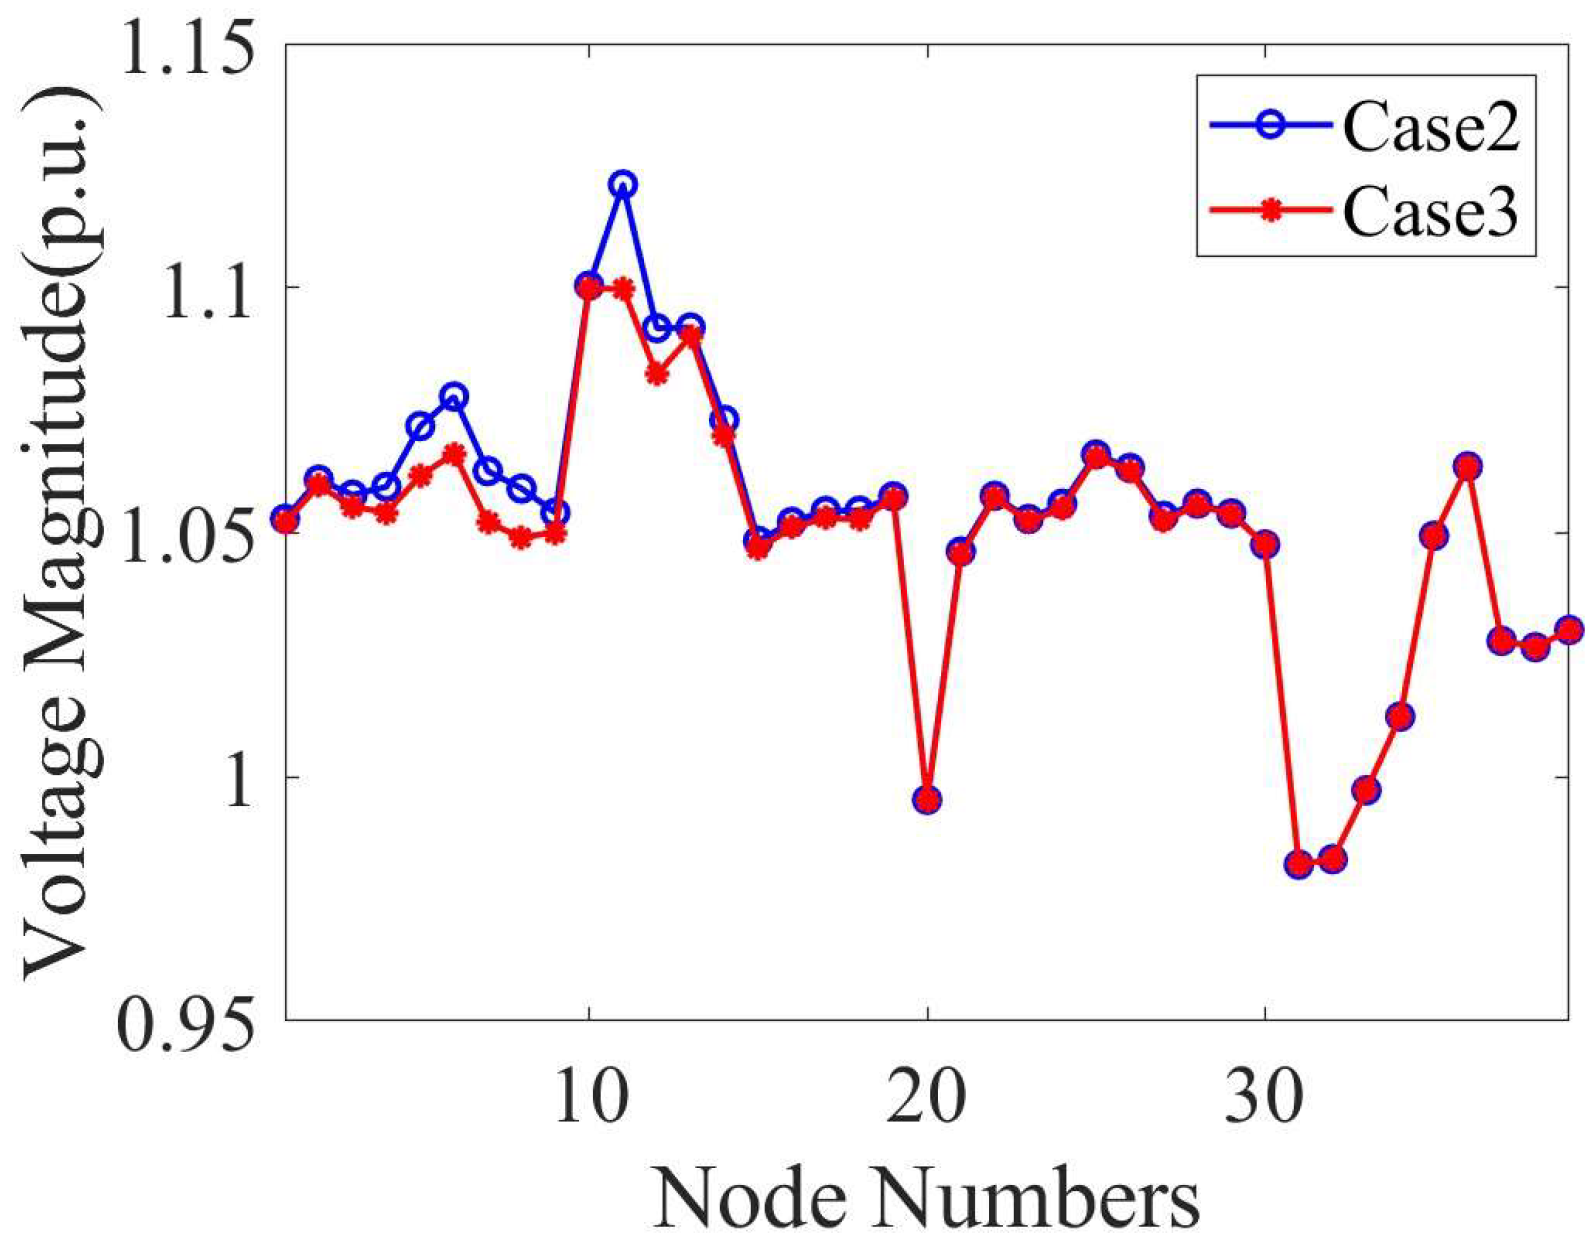
As can be seen from the table, when the system only performs active power control, the system voltage stability margin is 0.2632, which is 1.00% higher than the situation where the power is not adjusted. When the system only performs reactive power control, the system voltage stability margin is 0.2732, which is 4.83% higher than the situation where the power is not adjusted. When the VSC-HVDC active and reactive power work together to provide voltage support, the minimum modulus eigenvalue of the system reaches 0.2802, which is 7.52% higher than that without power adjustment, and the static voltage stability margin of the system is improved most significantly. It should be noted that if only the reactive power of the VSC-HVDC is adjusted, the voltage stability margin can also reach 0.2802. At this time, the reactive power adjustment amounts of the converters at both ends of the VSC-HVDC are −0.6 p.u. and 0.7 p.u, respectively, but the AC/DC system will face the problem of voltage over-limit. Figure 8 shows the voltage amplitude at each node when the VSC-HVDC only provides reactive power support to increase the system voltage stability margin to 0.2804. It can be seen from the figure that the voltage at node 2 in the system is the largest, reaching 1.2490 p.u., which exceeds the voltage upper limit by 13.55%. When VSC-HVDC provides active and reactive power support collaboratively, the voltages at each node are all within the allowable range, and no problems such as voltage over-limit occur.
Figure 8. Comparison of node voltages when the minimum modulus eigenvalue reaches 0.2732 in both Case 2 and Case 3.

4.5. The Impact of DC Voltage Gain on System Voltage Stability

The initial DC voltage gain in this study is set to kp = 2, ki = 1. To verify its impact on system voltage stability, a comparative configuration with kp = 1, ki = 0.5 is established.
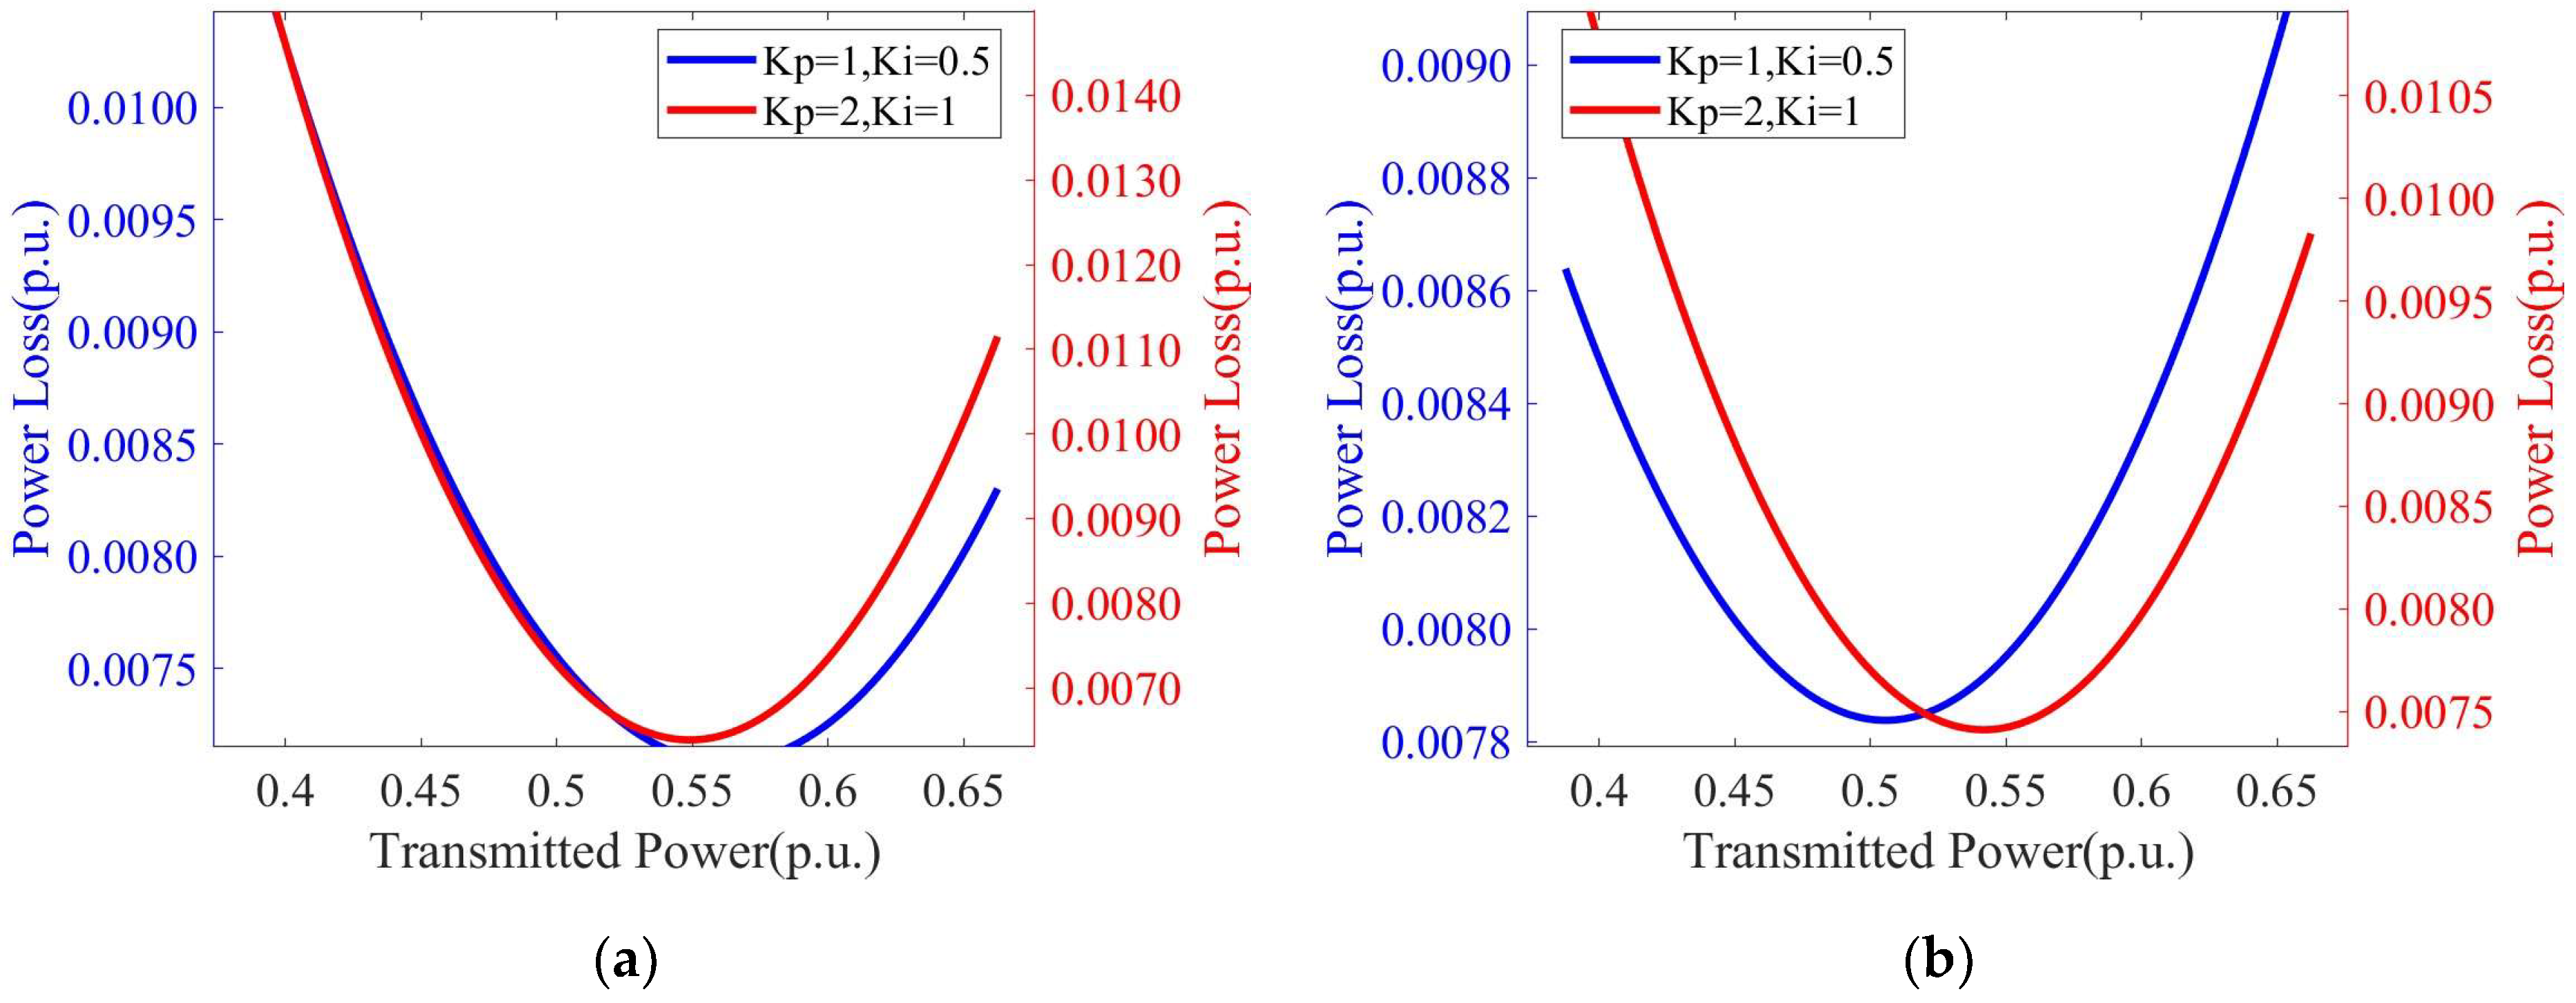
The loss functions of the converter under different control parameters are fitted separately, with the fitting curves shown in Figure 9. The results indicate that the DC voltage gain influences the fitting outcomes of the converter loss function. Hereinafter, the operating condition corresponding to kp = 2, ki = 1 is referred to as Case 1, and that corresponding to kp = 1, ki = 0.5 as Case 2. The optimal power adjustment amounts for the two cases are solved separately, and the results are presented in Table 4.
Figure 9. Fitted curves of loss functions under different DC voltage gain settings. (a) Fitting curve of the loss function of the converter at the sending end; (b) Fitting curve of the loss function of the converter at the receiving end.
Table 4. Performance Comparison under Different DC Voltage Gains.
By applying the optimization results obtained from Case 1 to the loss function of Case 2, the system voltage stability margin is calculated to be 0.2802, indicating a decline in voltage stability. These results demonstrate that the DC voltage gain does indeed affect system voltage stability, yet the loss function fitting method proposed above can accurately account for this influence.

4.6. Performance of Coordinated Active and Reactive Power Control in the IEEE 39-Bus System

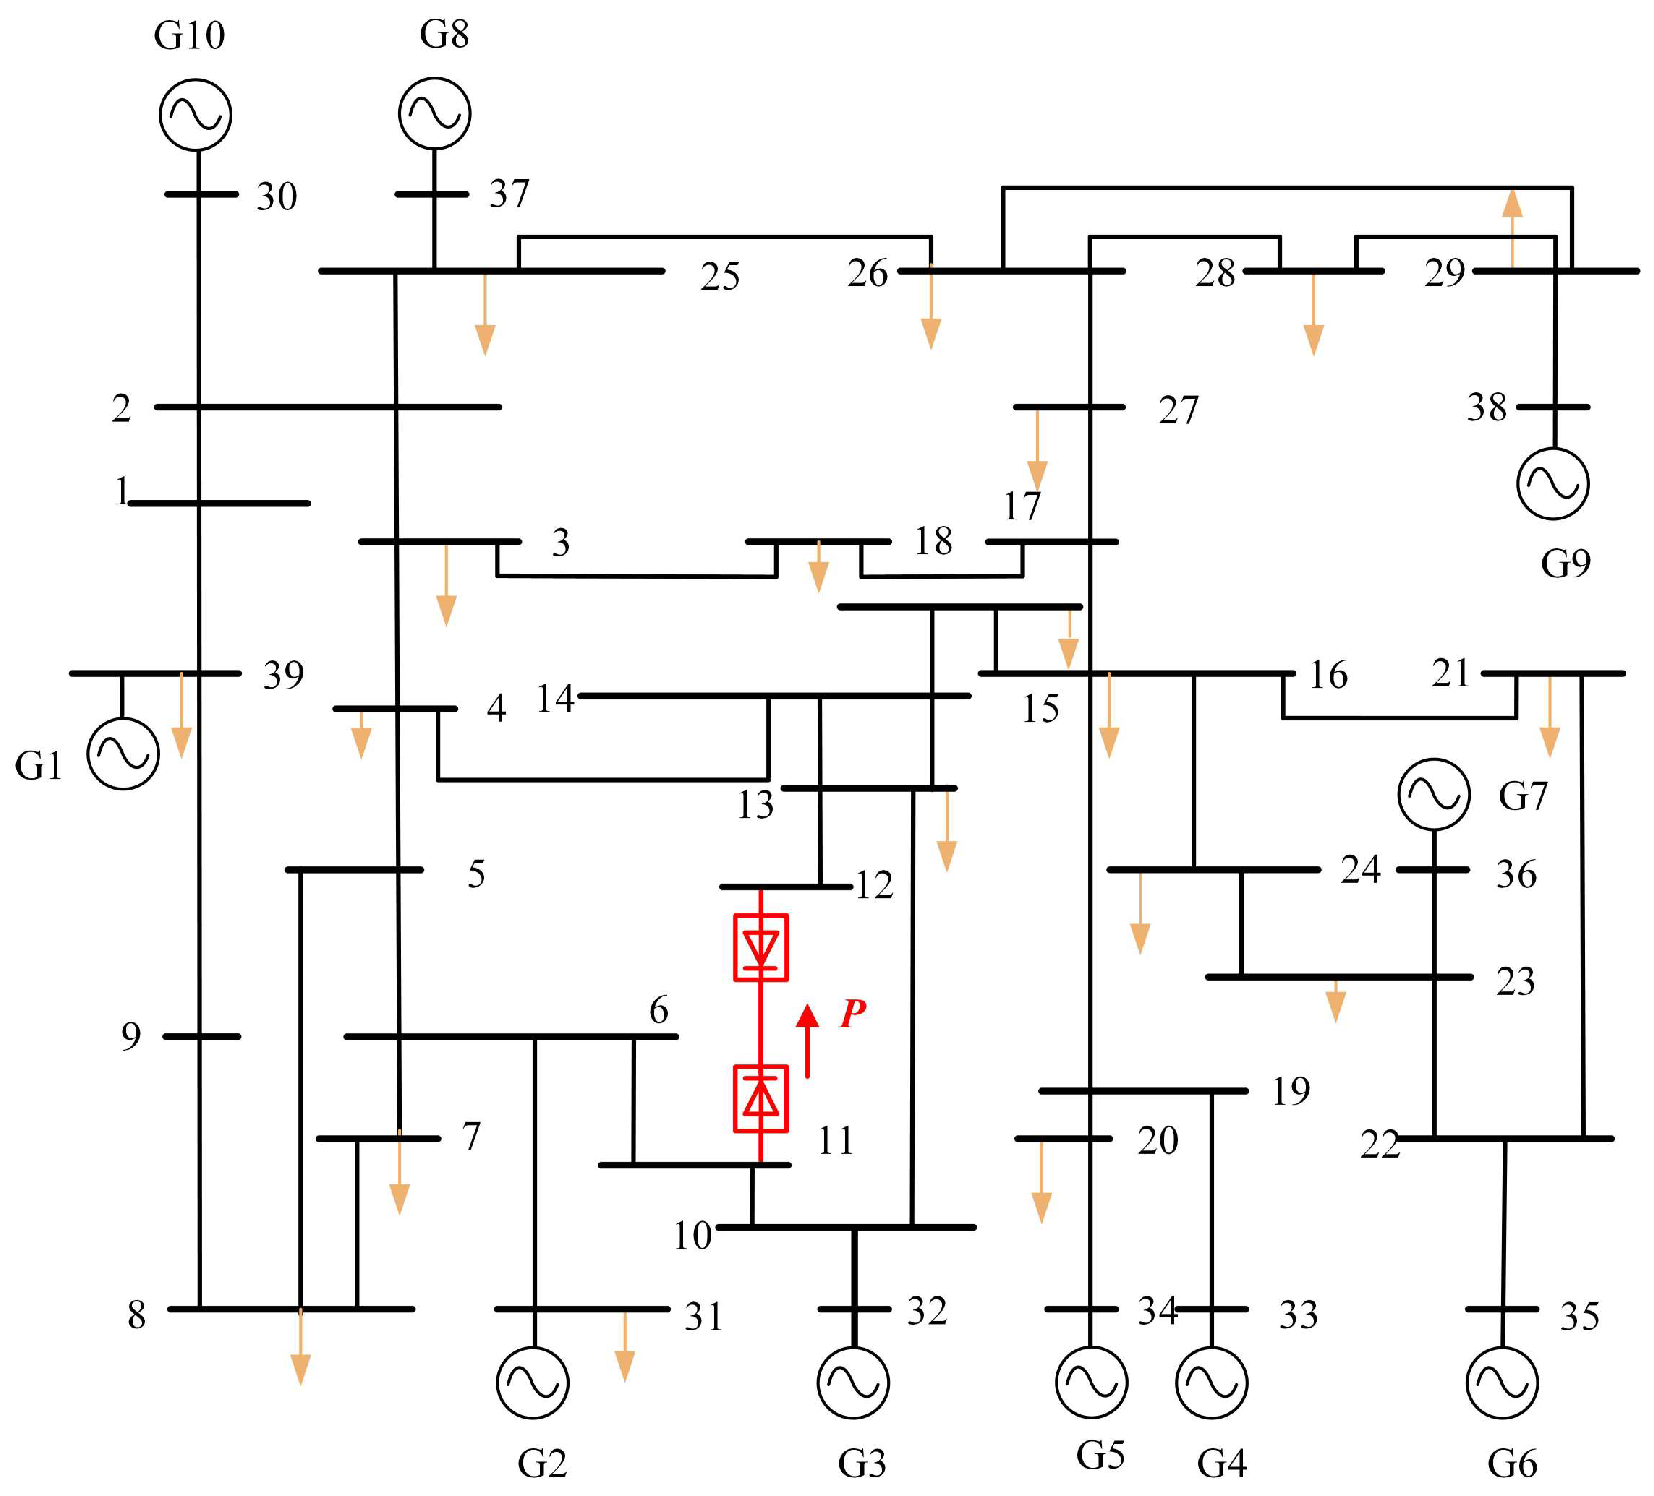
Section 4.4 validated the effectiveness of the proposed method in the IEEE 9-bus system. This section further extends its application to a modified IEEE 39-bus system to verify its general applicability. Figure 10 illustrates the configuration of the modified IEEE 39-bus system, where one AC transmission line is replaced by a VSC-HVDC link. The VSC-HVDC system operates at a rated voltage of ±290 kV with a transmission capacity of 1050 MW in bipolar mode. The sending-end converter adopts P-Q control, while the receiving-end converter employs Udc-Q control. The parameter settings of the optimization algorithm remain consistent with those in Section 4.4.
Figure 10. Schematic diagram of the modified IEEE 39-bus system.
This section continues to analyze three control scenarios: active power control only, reactive power control only, and coordinated active–reactive power control. The initial active power reference at the sending-end converter is set to Pref = 0.8 pu, with the initial reactive power reference Qref = 0. The receiving-end converter is initialized with Qref = 0. The initial minimum modulus eigenvalue of the system is λ0 = 0.5627. The adjustment ranges for the optimization variables remain consistent with those defined in Section 4.4. The corresponding optimization results for each scenario are summarized in Table 5.
Table 5. Comparison of the results of the three situations.
As observed from the table, all three control strategies effectively enhance the static voltage stability of the IEEE 39-bus system. Among them, the coordinated active–reactive power control yields the most significant improvement, increasing the static voltage stability by 12.81% compared to the pre-optimization condition. This represents a 1.51% improvement over reactive power control alone and a 9.61% improvement overactive power control alone. As shown in Figure 11, when only reactive power control is applied and the system voltage stability margin reaches 0.6348, a voltage violation occurs, with the maximum system voltage reaching 1.1212 p.u., exceeding the upper voltage limit by 1.93%. In conclusion, the proposed coordinated active–reactive power control strategy for VSC-HVDC systems demonstrates consistent effectiveness in enhancing voltage stability across systems of different scales, enabling full utilization of the voltage support capability of VSC-HVDC.
Figure 11. Comparison of node voltages when the minimum modulus eigenvalue reaches 0.6348 in both Case 2 and Case 3.

5. Conclusions

This paper focuses on the static voltage stability problem in power systems. By incorporating the influence of voltage source converter high-voltage direct current (VSC-HVDC) transmission, the minimum modulus eigenvalue of the power system is derived. The power coupling relationship between the sending-end and receiving-end converters of the VSC-HVDC system is specifically elucidated. Building upon this foundation, an optimization model is established to coordinate the active and reactive power control of the VSC-HVDC system. Simulation results demonstrate that appropriate adjustment of VSC-HVDC active and reactive power not only satisfies system operational constraints such as converter power limits and steady-state voltage boundaries but also effectively enhances the static voltage stability of the system. Specifically, in the IEEE 9-bus system, coordinated active–reactive power control yields the most significant improvement, enhancing static voltage stability by 7.60% compared to the pre-optimization condition. This represents a 2.49% improvement over reactive power control alone and a 6.41% improvement overactive power control alone. Similarly, in the IEEE 39-bus system, coordinated control achieves the best performance with a 12.81% improvement in static voltage stability compared to the baseline, outperforming reactive power control alone by 1.50% and active power control alone by 9.52%. For future research, further investigation will be conducted on the impact of VSC-HVDC on transient voltage stability and quantitative assessment methods for transient voltage stability in AC-DC hybrid systems, as well as the practical feasibility of implementing the proposed method in real-world systems.

Author Contributions

Conceptualization, J.G.; methodology, L.Z.; software, N.Z.; validation, Y.J.; formal analysis, X.P.; investigation, X.S.; writing—original draft preparation, J.G.; writing—review and editing, L.Z.; visualization, N.Z.; funding acquisition, Y.J. All authors have read and agreed to the published version of the manuscript.

Funding

This work was supported by the Science & Technology Project of State Grid Corporation of China under Grant 4000-202318465A-3-2-ZN. Project title: Research on frequency and voltage support for deep-sea wind power integrated through VSC-HVDC system.

Data Availability Statement

The original contributions presented in this study are included in the article. Further inquiries can be directed to the corresponding author.

Conflicts of Interest

Ningyu Zhang and Yuqiao Jia are employed by the company “State Grid Jiangsu Electric Power Co., Ltd.”. The remaining authors declare no conflicts of interest.

Abbreviations

The following abbreviations are used in this manuscript:
VSC-HVDCVoltage source converter—high-voltage direct current transmission
PCCPoint of common coupling
PSOParticle swarm optimization

Nomenclature

SymbolDefinitionUnit/Description
PlossThe converter station lossesDimensionless (p.u.)
aLoss parameterDimensionless
bLoss parameterDimensionless
cLoss parameterDimensionless
IsThe current flowing through the converter stationDimensionless (p.u.)
PsThe active power injected into the converter stationDimensionless (p.u.)
QsThe reactive power injected into the converter stationDimensionless (p.u.)
UsThe PCC voltage of the converter stationDimensionless (p.u.)
JJacobian matrixDimensionless (feature vector)
λminMinimum modulus eigenvalueDimensionless
P1The active and reactive power adjustment of the sending-end converter stationDimensionless (p.u.)
Q1The reactive and reactive power adjustment of the sending-end converter stationDimensionless (p.u.)
Q2The reactive and reactive power adjustment of the receiving -end converter stationDimensionless (p.u.)
UiThe voltage at bus i in the sending-end systemDimensionless (p.u.)
SGiThe apparent power of generator i in the sending-end systemkW
SThe transmission power limit of the VSC-HVDC systemkW
c1Cognitive coefficientDimensionless
c2Social coefficientDimensionless
ωInertia weight Dimensionless
popParticle positionDimensionless
sizepopNumber of particlesDimensionless
kpDC voltage proportional gainDimensionless
kiDC voltage integral gainDimensionless

References

  1. Zhang, G.; Ren, J.; Zeng, Y.; Liu, F.; Wang, S.; Jia, H. Security assessment method for inertia and frequency stability of high proportional renewable energy system. Int. J. Electr. Power Energy Syst. 2023, 153, 109309. [Google Scholar] [CrossRef]
  2. Wang, B.; Kou, Y.; Zhang, D.; Zhang, Q.; Li, H.; Lu, Z.; Qiao, Y. Voltage strength assessment of sending/receiving systems with a high proportion of new energy and HVDC. Appl. Syst. Innov. 2025, 8, 120. [Google Scholar] [CrossRef]
  3. Zafari, L.; Liu, Y.; Ukil, A.; Nair, N.-K.C. Advances in HVDC systems: Aspects, principles, and a comprehensive review of signal processing techniques for fault detection. Energies 2025, 18, 3106. [Google Scholar] [CrossRef]
  4. Stan, A.; Costinaș, S.; Ion, G. Overview and assessment of HVDC current applications and future trends. Energies 2022, 15, 1193. [Google Scholar] [CrossRef]
  5. Kumar, D.; Shireen, W.; Ram, N. Grid integration of offshore wind energy: A review on fault ride through techniques for MMC-HVDC systems. Energies 2024, 17, 5308. [Google Scholar] [CrossRef]
  6. Rao, H.; Zhou, Y.; Li, W.; Zou, C.; Wang, Z. Engineering application and development prospect of VSC-HVDC transmission technology. Autom. Electr. Power Syst. 2023, 47, 1–11. (In Chinese) [Google Scholar]
  7. Benato, R.; Gardan, G.; Milano, F. Effect of uniformly distributed parameter line models on the evaluation of PV curves and of the maximum loading condition. IEEE Trans. Power Syst. 2022, 37, 4974–4977. [Google Scholar] [CrossRef]
  8. Qiu, Y.; Wu, H.; Zhou, Y.; Song, Y. Global parametric polynomial approximation of static voltage stability region boundaries. IEEE Trans. Power Syst. 2017, 32, 2362–2371. [Google Scholar] [CrossRef]
  9. Khan, N.H.; Wang, Y.; Tian, D.; Jamal, R.; Kamel, S.; Ebeed, M. Optimal siting and sizing of SSSC using modified salp swarm algorithm considering optimal reactive power dispatch problem. IEEE Access 2021, 9, 49249–49266. [Google Scholar] [CrossRef]
  10. Xu, Q.; Guo, J.; Pan, X.; Sun, X.; Xu, H. Extraction of influencing variables for power system static stability indicators based on reciprocal information entropy causal inference. In Proceedings of the 2024 9th Asia Conference on Power and Electrical Engineering (ACPEE), Shanghai, China, 11–13 April 2024; pp. 2509–2513. [Google Scholar]
  11. Lu, J.; Qiu, J.; Feng, J.; Xu, K.; Xing, C.; Xin, Q. Analysis of the Voltage Stability Margin of the Sending-end Grid for the Large-scale PV Cluster Transmission by VSC-HVDC. In Proceedings of the 2025 IEEE International Conference on Power Systems and Smart Grid Technologies (PSSGT), Chongqing, China, 11–13 April 2025; IEEE: New York, NY, USA, 2025; pp. 123–128. [Google Scholar]
  12. Ma, J.; Zeng, Y.; Sheng, H.; Zhang, Z. Static voltage stability evaluation method based on equivalent power index. Power Syst. Technol. 2025, 49, 2347–2355. (In Chinese) [Google Scholar]
  13. Chen, G.; Liu, L.; Song, P.; Du, Y. Chaotic improved PSO-based multi-objective optimization for minimization of power losses and L index in power systems. Energy Convers. Manag. 2014, 86, 548–560. [Google Scholar] [CrossRef]
  14. Liu, X.; Tan, Z.; Yuan, Z.; Liu, Y. Combination weighting-based method for access point optimization of offshore wind farm. Energy Rep. 2022, 8, 900–907. [Google Scholar] [CrossRef]
  15. Kessel, P.; Glavitsch, H. Estimating the voltage stability of a power system. IEEE Trans. Power Deliv. 1986, 1, 346–354. [Google Scholar] [CrossRef]
  16. Rehman, B.; Liu, C.; Wei, W.; Fu, C.; Li, H. Applications of eigenvalues in installation of multi-infeed HVDC system for voltage stability. Int. Trans. Elect. Energy Syst. 2020, 30, e12645. [Google Scholar] [CrossRef]
  17. Yan, M.; Xu, L.; Zhang, X.; Wang, G.; Huang, Y. Robust day-ahead scheduling method for multi-infeed HVDC systems considering static voltage stability constraints. In Proceedings of the 4th Energy Conversion and Economics Annual Forum (ECE Forum 2024), Beijing, China, 14–15 December 2024; pp. 774–781. [Google Scholar]
  18. Zhao, L.; Wang, Z.; Sheng, H.; Li, Y.; Wang, X.; Wang, Y.; Yu, H. Optimal Configuration Model for Large Capacity Synchronous Condenser Considering Transient Voltage Stability in Multiple UHV DC Receiving End Grids. Energies 2024, 17, 5346. [Google Scholar] [CrossRef]
  19. Guo, X.; Tang, J.; Shu, T.; Peng, S.; Xie, K. Static voltage stability assessment on hybrid alternating current/voltage source converter-multiple terminal direct current system using improved modal analysis. Trans. China Electrotech. Soc. 2021, 36, 3741–3752. (In Chinese) [Google Scholar]
  20. Chen, H.; Huang, Y.; Jiang, T.; Li, X.; Li, G. Voltage stability analysis and control for AC/DC system with VSC-HVDC. Power Syst. Technol. 2017, 41, 2429–2435. (In Chinese) [Google Scholar]
  21. Urquidez, O.A.; Xie, L. Singular value sensitivity based optimal control of embedded VSC-HVDC for steady-state voltage stability enhancement. IEEE Trans. Power Syst. 2016, 31, 216–225. [Google Scholar] [CrossRef]
  22. Liu, Y.; Yao, L.; Liao, S.; Xu, J.; Cheng, F. A static voltage stability enhancement method for power systems with a high proportion of voltage source converters. IEEE Trans. Power Syst. 2025, 40, 4019–4032. [Google Scholar] [CrossRef]
  23. Guo, J.; Zou, L.; Pan, X.; Zhang, N.; Jia, Y.; Sun, X.; Xie, Z.; Li, W. Research on coordinated active and reactive power control of VSC-HVDC connected renewable energy system for enhancing static voltage stability. In Proceedings of the 2025 IEEE 3rd International Conference on Power Science and Technology (ICPST), Kunming, China, 16–18 May 2025; pp. 1568–1573. [Google Scholar]
  24. Wu, X. Research on Electromechanical Transient Modeling and Voltage Support of VSC-HVDC Systems. Master’s Thesis, Zhejiang University, Hangzhou, China, 2023. (In Chinese). [Google Scholar]
  25. Wu, X.; Qu, H.; Xin, W.; Wang, M. An efficient model of hybrid AC/DC grid power flow based on the simplified VSC station model. In Proceedings of the 2023 8th Asia Conference on Power and Electrical Engineering (ACPEE), Tianjin, China, 14–16 April 2023; pp. 329–333. [Google Scholar]
  26. Li, Z.; Yu, J.; Wu, Q.H. Approximate linear power flow using logarithmic transform of voltage magnitudes with reactive power and transmission loss consideration. IEEE Trans. Power Syst. 2018, 33, 4593–4603. [Google Scholar] [CrossRef]
  27. Xu, Q.; Pan, X.; Guo, J.; Zhang, H.; Li, W.; Sun, X. Clustering of operating scenarios for new energy power systems based on the variables affecting static voltage stability. In Proceedings of the 2024 IEEE PES 16th Asia-Pacific Power and Energy Engineering Conference (APPEEC), Nanjing, China, 25–27 October 2024; pp. 1–5. [Google Scholar]
Disclaimer/Publisher’s Note: The statements, opinions and data contained in all publications are solely those of the individual author(s) and contributor(s) and not of MDPI and/or the editor(s). MDPI and/or the editor(s) disclaim responsibility for any injury to people or property resulting from any ideas, methods, instructions or products referred to in the content.

Article Metrics

Citations

Article Access Statistics

Article metric data becomes available approximately 24 hours after publication online.