You are currently viewing a new version of our website. To view the old version click .
Energies
  • Article
  • Open Access

21 November 2025

Numerical Simulation of Co-Firing Biomass in a 660 MW Coal-Fired Boiler

,
,
,
,
,
,
and
1
MOE Key Laboratory of Thermo-Fluid Science and Engineering, Xi’an Jiaotong University, Xi’an 710049, China
2
Institute of Thermal Science and Technology, Shandong University, Jinan 250061, China
3
Xi’an Thermal Power Research Institute Co., Ltd., Xi’an 710000, China
4
Center for Ecology and Environmental Protection Education and Communications of Shandong Province, Jinan 250100, China
This article belongs to the Special Issue Biomass and Municipal Solid Waste Thermal Conversion Technologies: 3rd Edition

Abstract

To address the challenges of combustion stability and pollutant control during biomass co-combustion in coal-fired boilers under deep peak regulation, a numerical simulation study was conducted on a 660 MW front-and-rear wall opposed-fired pulverized coal boiler using computational fluid dynamics (CFD) technology. First, the reliability of the numerical model was validated under the Boiler Maximum Continuous Rating (BMCR) condition by comparing the simulated results of furnace outlet temperature and NO concentration with on-site operational data, with relative errors of 1.2% and 1.9%, respectively, both within the acceptable range of 5%. Subsequently, the effects of different biomass co-combustion ratios (0%, 5%, 10%, 15%, 20%) and injection positions (primary air nozzles of lower, middle, and upper burners) on the in-furnace velocity field, temperature field, component distribution (O2, CO, CO2), and NO emissions were systematically analyzed. The results indicate that increasing the biomass co-combustion ratio does not alter the overall variation trend of flue gas components but significantly affects their concentrations: the O2 content at the furnace outlet decreases gradually, while the CO2 content increases, and the NO emission concentration decreases continuously. A 20% co-combustion ratio is identified as the optimal choice, balancing combustion efficiency and NO reduction. Regarding injection positions, biomass injected at the middle burner’s primary air nozzle achieves the best NO control effect, reducing NO emissions by 22% compared to pure coal combustion. This is attributed to the formation of a stable reducing atmosphere in the main combustion zone, which facilitates NOx reduction. The research findings provide valuable theoretical references and technical support for the parameter optimization and safe, low-emission operation of biomass co-combustion in large-scale coal-fired boilers.

1. Introduction

Energy is the core guarantee for human survival and economic development. China’s energy endowment, characterized by abundant coal, meager oil and scarce gas, determines the long-term dominant position of coal in the energy consumption structure. Statistics show that coal accounted for as high as 55.3% of China’s total energy consumption in 2023, far exceeding that of oil, natural gas, nuclear energy and renewable energy [], among which coal-fired power generation contributed more than 60% of the national total power generation []. However, driven by the “dual carbon” goals, the role of coal-fired power is transforming from a base-load power source to a peak-regulating power source, requiring it to undertake deep peak-regulating tasks to adapt to the volatility of renewable energy such as wind power and photovoltaic power []. This transformation demands that coal-fired boilers operate frequently under variable load conditions, and load fluctuations can significantly change the flow field, temperature field and component distribution in the furnace, thereby affecting the combustion stability, heat transfer efficiency and pollutant emission characteristics of the boiler.
Currently, the core industrial challenge facing the operation of coal-fired boilers lies in the dynamic changes in in-furnace combustion characteristics under variable load conditions, which are prone to triggering a series of safety and efficiency risks. On one hand, at low loads, the reduction in total air volume and gas flow velocity may weaken flame stability, cause local oxygen deficiency and incomplete combustion, thereby increasing CO emissions. On the other hand, load fluctuations can alter the furnace temperature distribution and affect the NO formation mechanism—especially thermal NO, which is temperature-sensitive. Although the decrease in furnace temperature at low loads may inhibit its generation, changes in the number of operational burner layers may indirectly affect NO emissions by modifying oxygen distribution []. More critically, most existing studies have focused on full-load conditions, leaving a significant research gap in combustion characteristics and pollutant control under low or variable load conditions, which is insufficient to support the practical demands of deep peak regulation in coal-fired power plants [].
Numerous studies have been conducted by scholars focusing on the combustion characteristics and pollutant control of coal-fired boilers, with numerical simulation emerging as a core research method due to its low cost and high repeatability. In the field of coal-biomass co-combustion, Marisamy et al. [] found through thermogravimetric analysis that blending wood with Indian coal can reduce the ignition temperature of coal and improve combustion stability; Kakaras et al. [] pointed out that the thermochemical reactivity of biomass is higher than that of lignite, providing a theoretical basis for co-combustion technology. Regarding NO control, Zhang et al. [] verified via numerical simulation that air-staged combustion technology can reduce NO emissions from tangentially fired boilers by 20–30%, but this study did not involve variable load conditions; Karampinis et al. [] simulated biomass co-combustion in a 300 MW boiler and found that biomass particle size and blending ratio significantly affect combustion efficiency and NO emissions, without considering the interaction of burner arrangement modes. In the field of variable load research, Lu et al. []’s simulation on a 660 MW tangentially fired boiler showed that the decrease in furnace temperature under 75% THA load can reduce NO emissions by approximately 20%, but it did not combine the biomass co-combustion scenario; although Tu et al. [] studied the NO control effect of biomass co-combustion at different positions in a 300 MW boiler, the research was only conducted under full-load conditions. Overall, existing studies have three shortcomings: first, the lack of coupled research on variable load and biomass co-combustion; second, insufficient analysis of the impact of burner arrangement (such as different injection positions and operational layers) under variable load conditions; third, the failure to systematically reveal the synergistic mechanism of variable load, co-combustion ratio, and burner arrangement on NO emissions.
To address the aforementioned research gaps, this study focuses on a 660 MW coal-fired boiler with front-and-rear wall opposed-fired pulverized coal combustion technology in a power plant. Combined with CFD numerical simulation technology, an investigation into combustion characteristics and pollutant control under multiple operating conditions was conducted. The specific research contents are as follows: (1) Validating the reliability of the simulation model for pure coal combustion under the BMCR condition by comparing simulated values with on-site operational data; (2) Analyzing the variation laws of the in-furnace velocity field, temperature field, component fields (O2, CO, CO2), and NO emissions under different biomass co-combustion ratios (0%, 5%, 10%, 15%, and 20%); (3) Exploring the influence of different biomass injection positions (primary air nozzles of lower, middle, and upper burners) on the boiler combustion characteristics. The research results aim to provide theoretical references and technical support for the parameter optimization and safe operation of biomass co-combustion in 660 MW boilers.

2. Methodology

2.1. Basic Structure of the Boiler

The research object of this study is a 660 MW pulverized coal-fired boiler with front-and-rear wall opposed firing configuration, adopting the opposed arrangement of swirl burners. The core structural parameters and geometric characteristics are illustrated in Figure 1. The combustion system consists of 3 layers of main burners (3 layers on both the front and rear walls, 6 burners per layer, totaling 36) and 2 layers of over-fire air (OFA) nozzles (8 nozzles on both the front and rear walls, totaling 16). Each main burner is equipped with one central air nozzle, one primary air nozzle, one swirling inner secondary air nozzle, and one swirling outer secondary air nozzle, forming an air-powder mixing and combustion system featuring multiple nozzles integrated within a single furnace.
Figure 1. Overall structure of the furnace and arrangement of burners and over-fire air nozzles.
To ensure computational efficiency and convergence of the numerical simulation, the model was reasonably simplified based on the principle of prioritizing core components while eliminating redundant details. Specifically, the complex nozzle structure of the burner was simplified into rectangular nozzles with equivalent flow area to maintain consistency between the air-powder flow rate and actual operating conditions. The computational domain was defined as the region from the bottom of the cold ash hopper to the inlet of the horizontal flue, with heat exchange components in the tail flue ignored. Additionally, auxiliary structures such as small temperature and pressure measuring holes on the furnace wall were excluded to prevent degradation of grid quality.

2.2. Fuel Properties and Operating Condition Parameters

The properties of the pulverized coal and biomass fuels utilized in this study were determined via proximate analysis and ultimate analysis, with specific parameters presented in Table 1 and Table 2. The lower heating value was derived by converting the higher heating value with reference to the moisture and ash contents. This study took the boiler’s BMCR condition as the benchmark, and the air distribution mode of the experimental platform is detailed in Table 3.
Table 1. Parameters of pulverized coal fuel.
Table 2. Biomass fuel parameters.
Table 3. Air distribution modes of the test platform.
In the original working condition, the mass flow rate of pulverized coal was 70 kg/s. The primary air, secondary air, and over-fire air were all set as velocity inlets. The outlet adopted the boundary condition of a pressure outlet, and the outlet pressure was set at −100 Pa. The standard wall equation and no-slip boundary condition were applied to the furnace wall []. The temperature boundary condition was used for heat exchange. The wall temperature was set at 600 K, and the wall emissivity was set at 0.6 [].
The diameter of pulverized coal particles followed the Rosin-Rammler distribution. The minimum particle diameter was 10 μm, the maximum particle diameter was 250 μm, the average particle diameter was 56 μm, and the distribution coefficient was 1.5.

2.3. Selection of the Computational Model

The actual combustion process in the furnace was complex and changeable, involving a series of physical and chemical processes. In this chapter, Fluent was used to simulate and calculate the combustion process in the furnace. Appropriate calculation models need to be selected according to the actual situation when using them. The main calculation models involved in the combustion process of coal-fired boilers included: turbulence equations, gas–solid two-phase flow models, gas-phase combustion models, volatile release models, coke combustion models, radiation heat transfer models, and NOx formation models. The specific calculation models were shown in Table 4.
Table 4. Specific calculation model.

2.4. Mesh Generation and Independence Verification

Structured meshing was performed using ICEM 2023 software, and a differentiated meshing strategy was implemented based on the differences in flow and combustion characteristics across different furnace regions: (1) Mesh refinement was applied to the main burner zone and cold ash hopper zone, with the mesh size controlled between 5 and 10 mm to capture the mesoscopic flow field of air-powder mixing and local changes in combustion reactions; (2) The mesh size in the upper burnout zone of the furnace was relaxed to 15–20 mm, as the flow field in this region is relatively stable and does not require excessively high mesh density. To balance mesh quality and computational efficiency, meshes with 1.02 million, 1.27 million, and 1.40 million elements were selected for mesh independence verification, as illustrated in Figure 2a. The finally generated mesh consists of the cold ash hopper zone (approximately 250,000 elements), main burner zone (approximately 720,000 elements), and upper burnout zone (approximately 300,000 elements), totaling 1.27 million elements. All mesh quality meets the computational requirements of orthogonality > 0.8 and skewness < 0.2. The detailed mesh generation is shown in Figure 2b.
Figure 2. Grid independence verification and grid division, where (a) Grid independence verification; (b) Grid division of the central section of the boiler.

3. Results and Discussion

3.1. Analysis of Combustion Characteristics Under Pure Coal Combustion Conditions

To establish a benchmark for subsequent biomass co-combustion simulations and verify the reliability of the numerical model, a simulation of pure coal combustion was conducted at the BMCR load for a 660 MW pulverized coal-fired boiler with front-and-rear wall opposed firing configuration. The simulation adopted a computational strategy of “first cold-state then hot-state”: cold-state flow field calculation was performed using the first-order upwind scheme to ensure convergence, followed by hot-state simulation based on the cold-state results. Special focus was placed on analyzing the in-furnace velocity field, temperature field, and component distribution, with the model accuracy verified by comparing with the actual operating data from the power plant.

3.1.1. Distribution of In-Furnace Velocity Field

Figure 3 presents the velocity distribution contour maps of the furnace central section and burner cross-section under pure coal combustion conditions. As indicated in the figures, the flue gas velocity field at each layer exhibits a distinct symmetric distribution, which is a typical flow field characteristic of boilers with front-and-rear wall opposed firing. The velocity at the OFA outlet is the highest, reaching 70 m/s, which is consistent with the OFA velocity setting in Table 3. Driven by the −100 Pa negative pressure boundary condition at the furnace outlet, the opposed airflows from the front and rear walls show an upward flow trend and converge in the OFA region to form a central airflow. The velocity in this region is 15–20% higher than that in the main combustion zone, which is conducive to enhancing the mixing of unburned char with OFA and promoting complete combustion.
Figure 3. Velocity distribution contour maps of the central section of the boiler and the cross-section of the burner.
This velocity field pattern is consistent with the research conclusions of Yin et al. [], who pointed out that the symmetric velocity field in large-scale coal-fired boilers is a key factor in reducing the thermal deviation of water-cooled walls. It can also be observed from Figure 3 that there are no local backflows or dead zones in the cold ash hopper and main combustion zone, indicating that the boiler burner arrangement and air distribution design are reasonable, which can avoid the risk of incomplete combustion caused by fuel accumulation.

3.1.2. Distribution of In-Furnace Temperature Field

Figure 4 shows the temperature distribution contour maps of the furnace central section and burner cross-section. The temperature field exhibits a characteristic of “high in the center and low on both sides”, which is highly consistent with the velocity field distribution. The maximum temperature is located between the topmost burner and the OFA region, which conforms to the heat release law of pulverized coal combustion—intense volatile combustion and char combustion occur in the main combustion zone, while supplementary combustion of unburned char takes place in the OFA region.
Figure 4. Temperature distribution contour maps of the selected central cross-section of the furnace and the cross-section of the burner.
Along the furnace height direction, the temperature distribution can be sequentially divided into three key regions from bottom to top: The cold ash hopper region has the lowest temperature, ranging from 1250 K to 1300 K. This is attributed to the entrainment effect of the opposed airflows from the front and rear walls and the swirling secondary air, which reduces the amount of pulverized coal particles falling into the cold ash hopper and leads to insufficient heat release from combustion. This characteristic is consistent with the temperature law of the cold ash hopper in a 660 MW tangentially fired boiler studied by Lu et al. []; The main combustion zone extends from the lower burners to the upper burners, with the temperature gradually increasing from 1650 K to 1835 K, mainly resulting from the superposition of heat release from multiple layers of burners; After the injection of OFA, the temperature in the OFA region decreases significantly by approximately 200 K. This is partly due to the dilution of high-temperature flue gas by the low-temperature OFA (573 K) and partly because the heat release intensity from unburned char combustion is lower than that in the main combustion zone, ultimately forming a flow field with a balanced temperature distribution.
It is noteworthy that although the temperature at the burner inlet reaches 1350 K to 1400 K (higher than the ignition temperature of pulverized coal, 1173 K), no local ignition occurs. The reason is that the velocity of the secondary air at the outer ring of the burner is relatively high (35–50 m/s, see Table 2 and Table 3), which dilutes the pulverized coal concentration below the combustion threshold. This phenomenon is consistent with the burner inlet temperature characteristics verified by Fang et al. [] in the slagging analysis of coal-fired boilers.

3.1.3. Distribution of In-Furnace Components

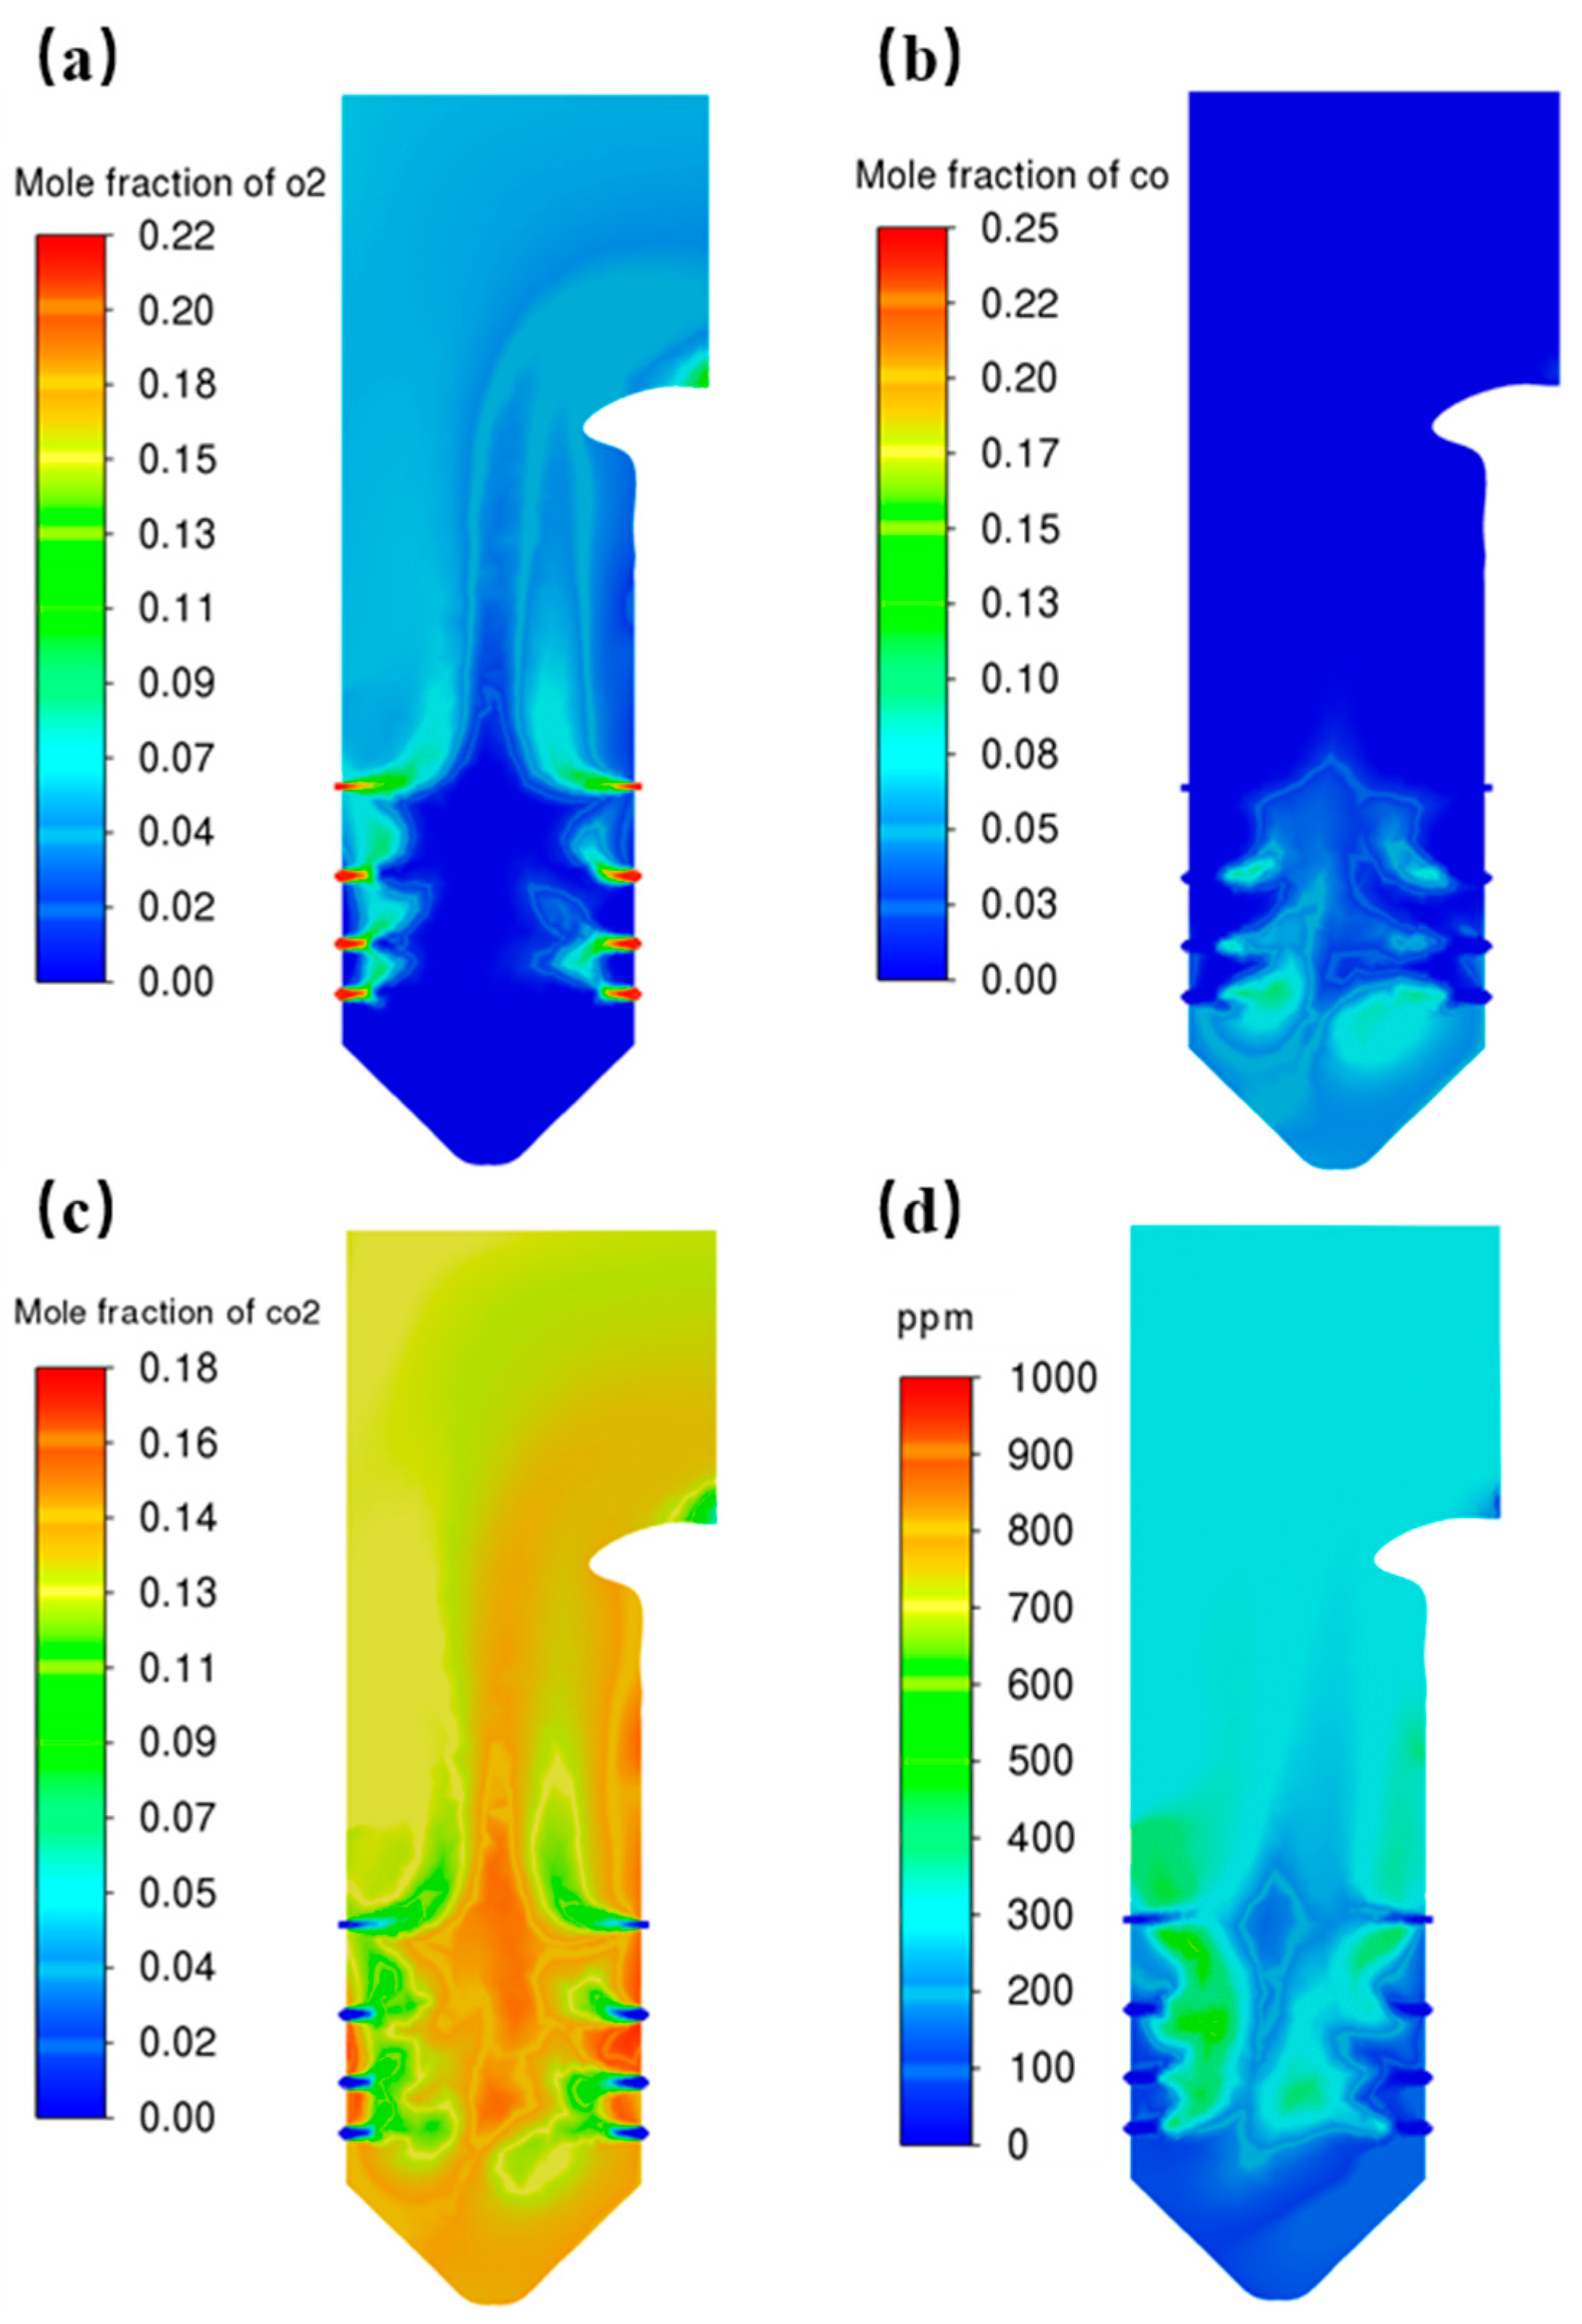
This section analyzes the distribution characteristics of the main components in the boiler flue gas. Figure 5 presents the mole fraction distribution contour maps of each component in the furnace central section. As shown in Figure 5a–c, the distributions of O2, CO, and CO2 are basically symmetric along the section center, with CO2 content being the highest. The cold ash hopper region has the lowest O2 content; near the burner inlets of the main combustion zone, O2 content is high and decreases gradually toward the furnace center, as this region is in an oxygen-lean and fuel-rich state. The burnout zone becomes the region with the highest O2 content in the furnace due to the large amount of air supplied by the injection of OFA, and O2 content decreases gradually with increasing height up to the furnace outlet. CO is generated in the main combustion zone (Figure 5b). Although the main combustion zone is the primary region for fuel combustion, insufficient O2 content leads to incomplete combustion of fuel, resulting in the formation of a large amount of CO []. After the injection of OFA, sufficient O2 oxidizes CO to CO2 []. The cold ash hopper and upper furnace regions have relatively high CO2 content (Figure 5c); in the main combustion zone, regions with higher O2 and CO contents correspond to lower CO2 content, which is attributed to incomplete combustion reactions and a strong reducing atmosphere that suppresses CO2 formation. Following OFA injection, complete fuel combustion in this region promotes more CO2 generation from char combustion, thus increasing CO2 content. As shown in Figure 5d, the cold ash hopper region appears light-colored with the lowest NO content. This is because the low O2 content and high CO content from incomplete combustion in this region form a reducing atmosphere, which inhibits NO generation. The main combustion zone appears dark-colored with high NO concentration; the injection of primary and secondary air increases O2 content, providing the necessary oxygen for pulverized coal combustion and facilitating the formation of fuel-bound NO []. The burnout zone also shows relatively high NO concentration due to increased O2 content from OFA injection, which promotes complete fuel combustion, enhances the oxidizing atmosphere, and thus maintains high NO levels. With increasing furnace height, NO concentration gradually decreases, and the final NO volume concentration at the furnace outlet is 289 ppm. To verify the reliability of the numerical model and the accuracy of the simulation results, a comparison was conducted between the simulated data and the actual operating data from the power plant. The simulated furnace outlet temperature was 1458.4 K, compared to the actual operating data of 1441.0 K, resulting in a relative error of 1.2%. The simulated NO volume concentration at the furnace outlet was 289.0 ppm, while the actual value was 294.6 ppm, corresponding to a relative error of 1.9%. Both errors are within 5%, indicating that the simulation results are sufficiently accurate and the selected model is applicable and reasonable for conducting subsequent numerical simulations of biomass co-combustion in pulverized coal boilers.
Figure 5. Contour plots of the molar fraction distributions of O2, CO, CO2, and NO at the central cross-section of the furnace, where (a) represents the O2 distribution, (b) the CO distribution, (c) the CO2 distribution, and (d) the NO distribution.

3.2. Effects of Different Biomass Co-Combustion Ratios on Boiler Combustion

Taking the pure coal combustion condition as the benchmark, and under the premise of maintaining the total input heat of the boiler and the distribution ratio of each air flow constant, biomass and pulverized coal were mixed in a coal mill and fed into the furnace with the primary air. Four operating conditions with biomass co-combustion ratios of 0%, 5%, 10%, 15%, and 20% were set up, and the influence laws of co-combustion ratios on the in-furnace temperature field and component distribution were analyzed through numerical simulation. The properties of the biomass fuel used are detailed in Table 2, and the definition of the co-combustion ratio and fuel consumption are presented in Table 5. This ensures that the only variable among all operating conditions is the biomass co-combustion ratio, eliminating interference from other factors.
Table 5. Coal and biomass usage at different blending ratios.

3.2.1. Variation Law of In-Furnace Temperature Field

Figure 6 shows the temperature distribution of the center section of the furnace under the conditions of pure coal combustion and different biomass mixing ratios. Figure 7 shows the distribution of the average temperature along the height direction of each horizontal section of the furnace chamber for pure coal combustion and different mixing ratios.
Figure 6. Temperature distribution in the center section of the furnace chamber under different mixing conditions.
Figure 7. Variation curves of the average temperature of the horizontal section of the furnace chamber along the height direction under different mixing conditions.
As can be seen from Figure 6, the high temperature region of the furnace chamber was located in the main combustion zone and the burnout zone. In the main combustion zone, the center of the chamber under mixed combustion conditions became lighter in color, and the darker areas were closer to the burner on both sides, which indicated that the combustion reaction at this time was also close to the burner nozzle, mainly because the biomass had a low temperature for ignition compared to pulverized coal, was easy to ignite, and the combustion path was short, so the biomass was burned quickly after it entered the furnace chamber. In the cold hopper area, the mixed combustion condition became lighter in color. This was because more fuel had been burned in the main combustion zone, less fuel entered the cold hopper area, and the temperature in the lower part of the boiler center decreased. Inside the burnout zone, the darker colored areas of the mixed-fuel condition were instead all darker than the pure coal-fired condition, and the range of darker colored areas increased as the proportion of mixed-fuel increased. Near the furnace exit area, with the increase in the proportion of mixed combustion, the color also gradually deepened, which indicated that the temperature of the combustion zone and the furnace exit area had increased, this was because the biomass was easier to burn compared with the pulverized coal, consuming the oxygen needed for the pulverized coal combustion, so that more pulverized coal was combusted in the combustion zone.

3.2.2. Variation Law of In-Furnace Component Distribution

Figure 8 presents the flue gas component distribution contour maps at the furnace central section under the pure coal combustion condition and different biomass co-combustion ratios. Figure 3 and Figure 4 show the variation curves of the average mole fractions of flue gas components (O2, CO, CO2) at each horizontal section along the furnace height under the pure coal combustion condition and different co-combustion ratios. The variation trends of O2, CO, and CO2 in the co-combustion conditions are not significantly different from those in the pure coal combustion condition. As indicated in Figure 8a, the O2 content is extremely low in the cold ash hopper region. In the main combustion zone and burnout zone, the O2 content gradually increases with the introduction of air, with the highest O2 content observed at the burner nozzles. The combustion reactions are relatively complete in the furnace central region, resulting in a lower O2 content. In the burnout zone, after the injection of OFA into the furnace, the O2 content in all co-combustion conditions decreases with the increase in biomass blending ratio and is lower than that in the pure coal combustion condition. As shown in Figure 9a, the O2 content curve becomes gentle and approaches a constant value in the furnace outlet region. A comparison of different co-combustion conditions reveals that with the increase in biomass blending ratio, the average mole fraction of O2 at the furnace outlet decreases progressively, reaching the minimum when the blending ratio is 20%.
Figure 8. Contour plots of the molar fraction distributions of O2, CO, CO2, and NO at the furnace central cross-section under different co-combustion conditions, where (a) denotes the O2 distribution, (b) the CO distribution, (c) the CO2 distribution, and (d) the NO distribution.
Figure 9. Curves showing the variations of O2, CO, CO2, and NO along the height direction in the furnace cross-section under different co-combustion conditions, where (a) corresponds to the O2 variation, (b) to the CO variation, (c) to the CO2 variation, and (d) to the NO variation.
As indicated in Figure 8b, the main combustion zone and cold ash hopper region appear dark, indicating a relatively high CO content, while the CO content is low in the burnout zone and furnace outlet region, and tends to a low constant value at the furnace outlet across all operating conditions. This is exactly opposite to the O2 distribution, because incomplete combustion reactions occur in regions with low O2 content, facilitating CO generation. As shown in Figure 9b, the variation trends of CO content are roughly consistent among different co-combustion conditions; however, in the main combustion zone and cold ash hopper region, the curve shifts upward with increasing biomass blending ratio, corresponding to higher CO contents. The CO content in all co-combustion conditions is higher than that in the pure coal combustion condition, and it increases progressively with the increase in biomass blending ratio, accompanied by an expanded reducing atmosphere. This phenomenon is attributed to the fact that biomass is more easily ignited and completely burned compared to pulverized coal. It preferentially consumes oxygen in the main combustion zone, leading to incomplete combustion of pulverized coal and thus an increase in CO concentration [].
As shown in Figure 8c, the main combustion zone appears light-colored (lower CO2 content), while the burnout zone appears dark-colored (higher CO2 content). A comparison between pure coal combustion and co-combustion conditions reveals that CO2 content increases in the burnout zone but decreases in the main combustion zone and cold ash hopper region, with the trend becoming more pronounced as the biomass blending ratio increases. After the injection of OFA into the furnace, the increased O2 content promotes complete fuel combustion, weakens the reducing atmosphere, and enhances char combustion to generate more CO2, resulting in a higher CO2 content. In the main combustion zone and cold ash hopper region, the CO2 content decreases with increasing biomass blending ratio. As illustrated in Figure 9c, the variation trends of CO2 content are similar between co-combustion and pure coal combustion conditions. Specifically, the CO2 content is lower in the main combustion zone and cold ash hopper region but higher in the burnout zone and furnace outlet region under co-combustion conditions, with the magnitude of change increasing gradually with the biomass blending ratio. Eventually, the highest CO2 content at the furnace outlet is achieved at a 20% biomass blending ratio, indicating that biomass co-combustion enhances the completeness of combustion in the furnace.
Figure 8d presents the NO volume fraction distribution contour maps at the furnace central section under the pure coal combustion condition and different biomass co-combustion ratios. Figure 9d shows the variation in NO volume fraction along the furnace height for pure pulverized coal combustion and different co-combustion conditions. It can be observed that the NO volume fraction distribution is roughly consistent across all operating conditions. In the main combustion zone, the high CO concentration creates a strong reducing atmosphere, resulting in a low NO content. After the injection of OFA, as the fuel is completely burned, the NO generation increases, leading to a rise in NO content, which eventually stabilizes. The NO content in co-combustion conditions is significantly lower than that in the pure coal combustion condition. This is because biomass contains much less nitrogen than pulverized coal, so replacing part of the pulverized coal with biomass reduces the formation of fuel-bound NO. Additionally, biomass has a low ignition point and high volatile content; the hydrocarbon volatiles released during biomass pyrolysis facilitate the NOx reduction reactions [], and a reducing atmosphere is easily formed in the early stage of combustion, which is more conducive to NOx reduction. The average NO volume fractions at the furnace outlet under the pure coal combustion condition and 5%, 10%, 15%, and 20% biomass co-combustion conditions are 289 ppm, 273 ppm, 266 ppm, 257 ppm, and 249 ppm, respectively.
The change in biomass blending ratio does not alter the variation trend of flue gas components in the furnace. With the increase in biomass blending ratio, the O2 content at the furnace outlet decreases, while the CO2 content increases. Based on the comprehensive analysis of the temperature field and component distribution, a 20% biomass co-combustion ratio is identified as the optimal choice that balances combustion efficiency and NO emission reduction.

3.3. Effects of Different Biomass Injection Positions on Boiler Combustion

Based on the optimal co-combustion ratio determined in Section 3.2, three operating conditions with biomass injected at the primary air nozzles of the lower, middle, and upper burners were simulated under the boiler full-load condition. The average particle size of biomass, mass flow rate, and air distribution mode were kept constant, with only the injection position varied to investigate its influence on the in-furnace temperature field and component distribution. The specific operating parameters are presented in Table 6, where the “original condition” refers to the pure coal combustion condition, serving as the baseline group for comparative analysis.
Table 6. Specific simulation working condition parameters.

3.3.1. Variation Law of In-Furnace Temperature Field

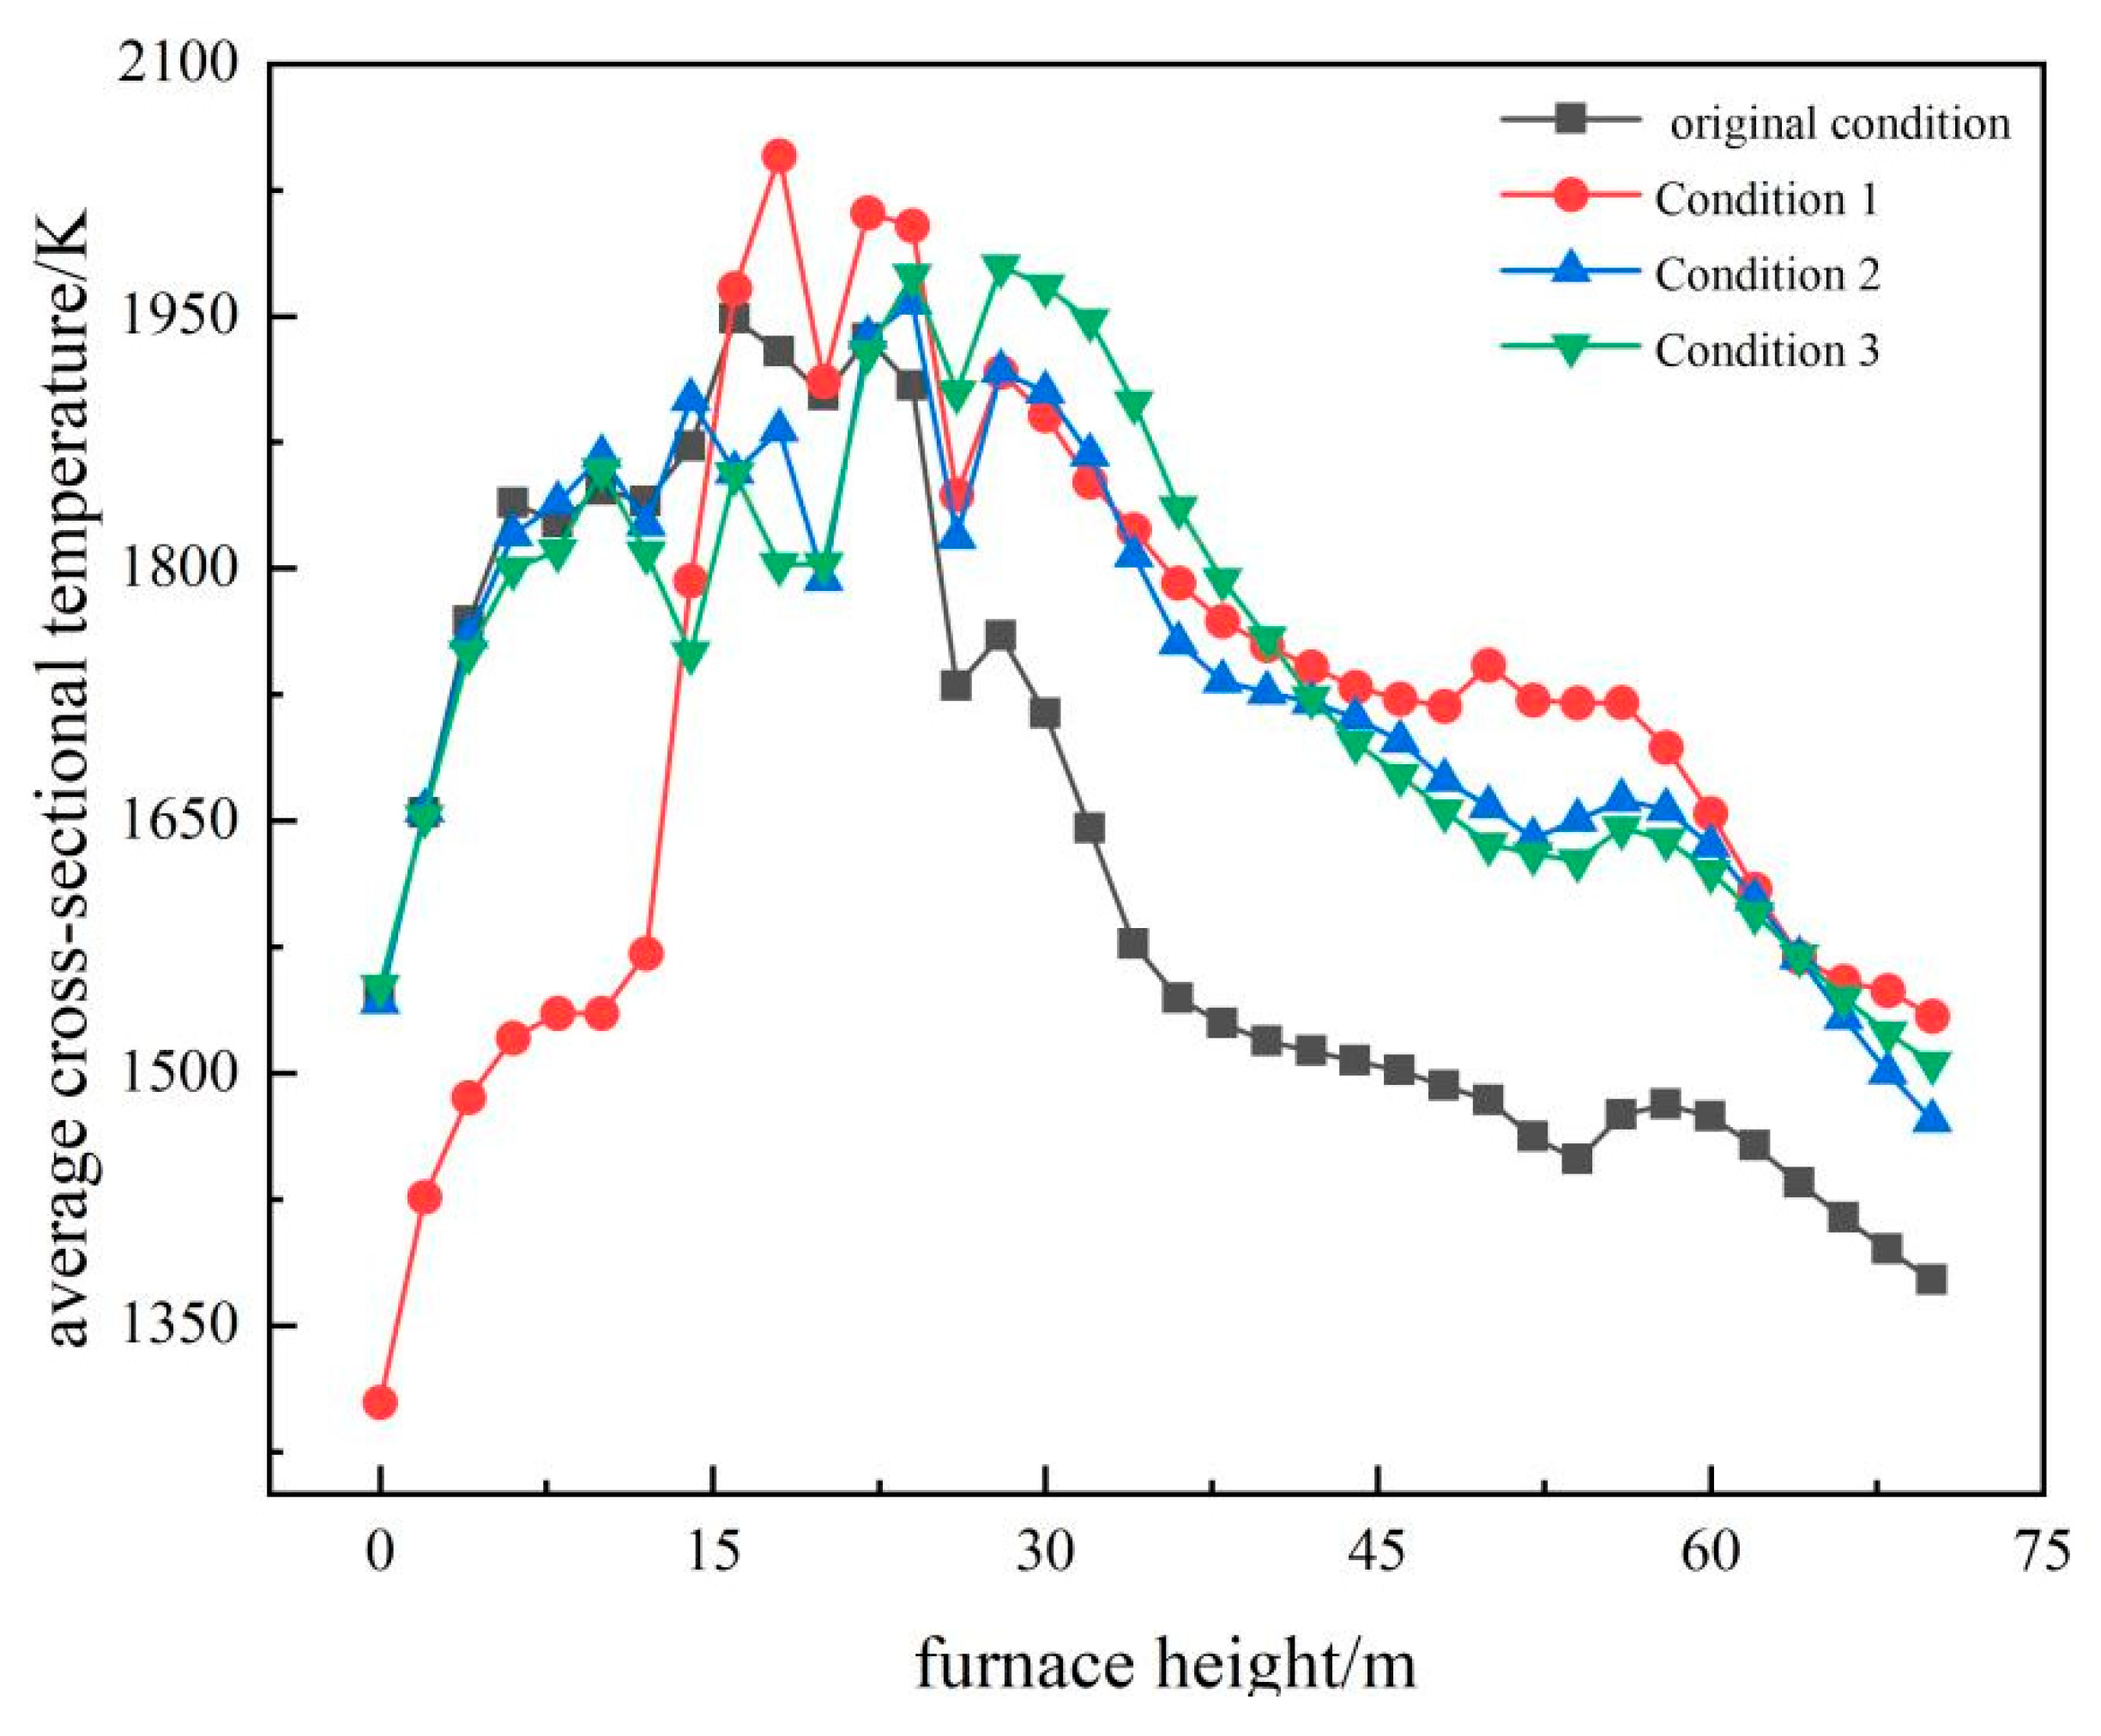
Figure 10 shows the temperature distribution in the center section of the furnace under the conditions of pulverized coal combustion alone and biomass with a particle size of 56 μm injected at different locations. Figure 11 shows the variation in the average temperature of each horizontal cross-section of the boiler along the height direction under the conditions of combustion of pulverized coal alone and biomass with a particle size of 56 μm.
Figure 10. Temperature distribution cloud of the center section of the hearth.
Figure 11. Change curve of the average temperature of each horizontal section of the furnace along the height direction.
From Figure 10, it can be seen that the temperature field of each working condition presented a symmetrical distribution, and in the main combustion zone, the fuel combustion released a large amount of heat, so the high-temperature zones were all gathered in the vicinity of the main burner. Comparing the original conditions with conditions one, two, and three, it could be found that after adding biomass, the high temperature zone of combustion in the main combustion zone was close to the burner nozzle, which was due to the lower temperature required for biomass to ignite, easy to burn out, and a short combustion path. Due to the lower calorific value of biomass compared to pulverized coal, it could be seen that when biomass was injected into the primary air nozzle at different layers, the temperature of the combustion zone at that layer would decrease, and the low-temperature zone in the center would increase, and the temperature would be generally lower compared to that at the burner nozzle without biomass injection.
As could be seen in Figure 11, the temperatures at the combustion zone and furnace exit temperature increased under mixed combustion conditions, which was due to the fact that biomass was easier to burn compared to pulverized coal, consuming the oxygen needed for pulverized coal combustion, making more pulverized coal burn fully in the combustion zone, which led to an increase in the temperature of the corresponding region. Specifically, the exit temperatures of the original conditions and conditions I, II, and III were 1458 K, 1625 K, 1663 K, and 1663 K. The temperatures at the primary air nozzle of the combustor without the injection of biomass were generally lower: 1625 K, 1663 K and 1599 K. When biomass was sprayed in the first layer, the temperature in the cold ash hopper area decreased, which was due to the fact that the density of biomass particles was smaller than that of pulverized coal, lighter in mass, easy to be carried by the primary air to the whole furnace chamber and easier to burn; the main combustion zone was in a reducing atmosphere, and more pulverized coal entered the combustion zone to be burned, and the fuel falling into the cold ash hopper area decreased. However, as the biomass injection position rose, there was more pulverized coal in the lower part of the boiler center, the heat generation increased, and the temperature in the cold ash hopper area rose.

3.3.2. Variation Law of In-Furnace Component Distribution

Figure 12 presents the mole fraction distribution maps of O2, CO, CO2, and NO in the flue gas at the furnace central cross-section under the conditions of pure pulverized coal combustion and biomass (with a particle size of 56 μm) injected at different positions. Figure 13 shows the variation curves of the mole fractions of O2, CO, CO2, and NO in the flue gas at each horizontal cross-section of the boiler along the furnace height under the conditions of pure pulverized coal combustion and biomass co-combustion (biomass particle size: 56 μm).
Figure 12. Contour plots of the mole fraction distributions of O2, CO, CO2, and NO at the furnace central cross-section under different operating conditions, where (a) corresponds to the O2 distribution, (b) to the CO distribution, (c) to the CO2 distribution, and (d) to the NO distribution.
Figure 13. Curves of the average mole fractions of O2, CO, CO2, and NO at each horizontal cross-section of the furnace varying along the height direction under different operating conditions, where (a) represents the O2 variation, (b) the CO variation, (c) the CO2 variation, and (d) the NO variation.
As observed in Figure 12a and Figure 13a, the O2 mole fraction distribution is roughly consistent across the four operating conditions and symmetrically distributed around the furnace center. The lighter color in the main combustion zone and cold ash hopper region indicates a lower O2 content, while the darker color in the burnout zone indicates a higher O2 content. With the increase in furnace height, the color gradually lightens, and the O2 content decreases progressively. A comparison of the operating conditions reveals that the O2 content decreases after biomass co-combustion. This is because biomass has a higher volatile content than pulverized coal and is more easily combusted, consuming relatively more oxygen. Therefore, after injecting biomass at the first layer, the average O2 mole fraction at the horizontal cross-section corresponding to the first-layer burner height is lower than that in the original condition. This variation law is consistent for other co-combustion conditions. After the injection of OFA into the furnace, the oxygen required for fuel combustion is supplemented, leading to an increase in O2 content. However, due to the more fuel that needs to be burned in the burnout zone under co-combustion conditions, the O2 content in all co-combustion conditions is lower than that in the pure coal combustion condition. A comparison of Conditions 1, 2, and 3 shows that the O2 content in the main combustion zone is the highest when biomass is injected at the third layer and the lowest when injected at the first layer. The O2 content at the furnace outlet is the highest when biomass is injected at the first layer and the lowest when injected at the third layer.
As indicated in Figure 12b and Figure 13b, across the four operating conditions, the main combustion zone and cold ash hopper region appear darker, while the burnout zone and furnace outlet region appear lighter. This indicates that CO is mainly concentrated in the main combustion zone and cold ash hopper region, with a lower CO content in the burnout zone that decreases further with increasing furnace height. Compared with the original condition, the darker-colored areas are more extensive in other conditions, indicating an increase in CO content after biomass co-combustion. When biomass is injected at the first layer, the horizontal cross-section corresponding to the first-layer burner height appears darker with a higher CO content, which is also true for other co-combustion conditions. This is because biomass is more easily oxidized and burned than coal, consuming the oxygen required for pulverized coal combustion, resulting in incomplete combustion of more pulverized coal in the biomass injection region and thus higher CO generation. A comparison of Conditions 1, 2, and 3 shows that the area with high CO content is the largest when biomass is injected at the first layer, and decreases as the injection position moves upward. However, the CO content in all co-combustion conditions is higher than that in the pure coal combustion condition. At the furnace outlet, the CO mole fraction approaches 0 for all operating conditions.
As shown in Figure 12c and Figure 13c, the distribution of CO2 mole fraction is opposite to that of O2. The CO2 content is higher in the cold ash hopper region, lower near the burner nozzles in the main combustion zone, and higher near the furnace center. In the burnout zone, with the injection of OFA, the incompletely burned fuel is fully combusted, leading to a gradual increase in CO2 content. Due to the higher CO generation in the early stage under co-combustion conditions, the CO2 mole fraction is lower than that in the original condition. After the injection of OFA, with the progress of reactions, the CO2 content in co-combustion conditions becomes higher than that in the original condition. This indicates that biomass co-combustion promotes combustion reactions in the furnace, resulting in more complete fuel combustion and higher CO2 content in the flue gas.
As observed in Figure 12d and Figure 13d, the cold ash hopper region appears lighter with a lower NO content, the main combustion zone and burnout zone appear darker with a higher NO content, and the furnace outlet region appears lighter with a lower NO content. Under the pure coal combustion condition, the NO content is low in the cold ash hopper region, while the low CO content in the main combustion zone results in a weak reducing atmosphere and high NO concentration. With the injection of OFA, the fuel is fully combusted, leading to increased NO generation and a subsequent stabilization of NO content. Under co-combustion conditions, the NO content is lower at the biomass injection position, and the distribution law in other regions is consistent with that of the pure coal combustion condition. However, when biomass is injected at the third-layer nozzle, the NO content in the cold ash hopper region increases slightly. The NO content in Conditions 1–3 is significantly lower than that in the original condition. This is because biomass contains much less nitrogen than pulverized coal, so replacing part of the pulverized coal with biomass reduces the formation of fuel-bound NOx. Additionally, biomass has a low ignition point and high volatile content; the hydrocarbon volatiles released during biomass pyrolysis facilitate the NOx reduction reactions []. When biomass is injected from the bottom primary air nozzle (Condition 1), CO is mainly distributed in the cold ash hopper region and the first-layer nozzle region, thus primarily reducing NO in this area. When injected at the second layer (Condition 2), CO is mainly distributed in the main combustion zone, forming a reducing atmosphere there. When injected at the third layer (Condition 3), CO is mainly concentrated in the area between the third-layer nozzle and the burnout zone. However, due to the large amount of oxygen supplemented by OFA injection in this region, the high O2 content inhibits the formation of a reducing atmosphere, resulting in relatively low CO generation. Overall, the NO volume fraction under co-combustion conditions is lower than that under the pure coal combustion condition. The NO volume fractions at the furnace outlet under the original condition, Condition 1, Condition 2, and Condition 3 are 289 ppm, 250 ppm, 225 ppm, and 240 ppm, respectively. Compared with the original condition, the NO volume fractions in Conditions 1, 2, and 3 decrease by 13.5%, 22%, and 16.9%, respectively. It is evident that biomass co-combustion is effective in reducing NO emissions, with the best performance achieved when biomass is injected at the second layer.

4. Conclusions

This study systematically investigates the combustion characteristics and pollutant emission rules of a 660 MW front-and-rear wall opposed-fired coal-fired boiler under different biomass co-combustion ratios and injection positions through CFD numerical simulation, yielding the following key conclusions:
  • The established numerical model exhibits high reliability. Under the BMCR condition, the relative errors between the simulated values of furnace outlet temperature and NO volume concentration and the actual operational data are 1.2% and 1.9%, respectively, which are within the acceptable range of engineering accuracy, confirming the model’s suitability for subsequent biomass co-combustion simulation studies.
  • The biomass co-combustion ratio has a significant impact on the in-furnace combustion process and pollutant emissions. With the increase in the co-combustion ratio, the O2 content at the furnace outlet decreases progressively, while the CO2 content increases, indicating enhanced combustion completeness. Meanwhile, the NO emission concentration continues to decrease due to the low nitrogen content in biomass and the promoting effect of volatile matter on NOx reduction reactions. A 20% biomass co-combustion ratio is determined as the optimal operating parameter, as it effectively balances combustion efficiency and NO emission control.
  • The biomass injection position directly affects the spatial distribution of the in-furnace flow field, temperature field, and component concentration. Among the three injection positions (lower, middle, upper burners), injecting biomass at the middle burner’s primary air nozzle results in the most significant NO reduction effect, with a 22% decrease compared to the pure coal combustion condition. This is because the middle injection position facilitates the formation of a stable reducing atmosphere in the main combustion zone, maximizing the NOx reduction potential of CO and volatile matter. In contrast, injection at the upper position is less effective due to the inhibition of reducing atmosphere formation by the high O2 content from over-fire air, while injection at the lower position leads to higher CO emissions in the cold ash hopper region.
  • Biomass co-combustion technology can effectively improve the combustion performance of coal-fired boilers and reduce pollutant emissions, which is of great significance for promoting the clean and low-carbon transformation of coal-fired power plants. Future research could focus on the coupled effects of variable load conditions and biomass co-combustion, as well as the optimization of burner structures to further enhance the synergistic effect of combustion efficiency improvement and pollutant control.

Author Contributions

The authors confirm contribution to the paper as follows: study conception and design: Z.D., M.H. and M.L.; data collection: L.L., M.L. and X.Z.; analysis and interpretation of results: Z.D., M.L., L.L. and Y.L.; draft manuscript preparation: J.G., X.R. and L.L.; critical revision of the manuscript for important intellectual content: Z.D., L.L., X.R. and X.Z. All authors have read and agreed to the published version of the manuscript.

Funding

This work was financially sponsored by the National Research and Development Plan of China (No. 2024YFE0111000) and the Science and Technology Project of China Huaneng Group (Contract NO.: HNKJ22-H150).

Data Availability Statement

The authors confirm that the data supporting the findings of this study are available within the article.

Acknowledgments

The authors would like to express their sincere gratitude to China Huaneng Group for the financial and technical support provided through the Science and Technology Project.

Conflicts of Interest

Authors Xiangyu Zhang and Yuhang Li were employed by the company Xi’an Thermal Power Research Institute Co., Ltd. Author Jiamin Gao was employed by the company Xi’an Yitong Thermal Engineering Technology Service Co., Ltd. The remaining authors declare that the research was conducted in the absence of any commercial or financial relationships that could be construed as a potential conflict of interest.

References

  1. Teng, X.; Liu, F.; Chiu, Y. The impact of coal and non-coal consumption on China’s energy performance improvement. Nat. Resour. Forum 2020, 44, 334–352. [Google Scholar] [CrossRef]
  2. Eguchi, S.; Takayabu, H.; Lin, C. Sources of inefficient power generation by coal-fired thermal power plants in China: A metafrontier DEA decomposition approach. Renew. Sustain. Energy Rev. 2021, 138, 110562. [Google Scholar] [CrossRef]
  3. Zhou, P.; Lv, Y.; Wen, W. The Low-Carbon Transition of Energy Systems: A Bibliometric Review from an Engineering Management Perspective. Engineering 2023, 29, 147–158. [Google Scholar] [CrossRef]
  4. Jiang, Y.; Lee, B.-H.; Oh, D.-H.; Jeon, C.-H. Optimization of operating conditions to achieve combustion stability and reduce NOx emission at half-load for a 550-MW tangentially fired pulverized coal boiler. Fuel 2021, 306, 121727. [Google Scholar] [CrossRef]
  5. Chang, J.; Zhou, Z.; Ma, X.; Liu, J. Computational investigation of hydrodynamics, coal combustion and NOx emissions in a tangentially fired pulverized coal boiler at various loads. Particuology 2022, 65, 105–116. [Google Scholar] [CrossRef]
  6. Muthuraman, M.; Namioka, T.; Yoshikawa, K. A comparison of co-combustion characteristics of coal with wood and hydrothermally treated municipal solid waste. Bioresour. Technol. 2010, 101, 2477–2482. [Google Scholar] [CrossRef]
  7. Vamvuka, D.; Kakaras, E.; Kastanaki, E.; Grammelis, P. Pyrolysis characteristics and kinetics of biomass residuals mixtures with lignite. Fuel 2003, 82, 1949–1960. [Google Scholar] [CrossRef]
  8. Zhang, X.; Zhou, J.; Sun, S.; Sun, R.; Qin, M. Numerical investigation of low NOx combustion strategies in tangentially-fired coal boilers. Fuel 2015, 142, 215–221. [Google Scholar] [CrossRef]
  9. Karampinis, E.; Nikolopoulos, N.; Nikolopoulos, A.; Grammelis, P.; Kakaras, E. Numerical investigation Greek lignite/cardoon co-firing in a tangentially fired furnace. Appl. Energy 2012, 97, 514–524. [Google Scholar] [CrossRef]
  10. Lu, H.; Huang, S.; Li, H.; Cheng, Z.; Chang, X.; Dong, L.; Kong, D.; Jing, X. Numerical simulation of combustion characteristics in a 660 MW tangentially fired pulverized coal boiler subjected to peak-load regulation. Case Stud. Therm. Eng. 2023, 49, 103168. [Google Scholar] [CrossRef]
  11. Tu, Y.; Li, J.; Chang, D.; Hu, B. Effect of biomass co-firing position on combustion and NOX emission in a 300-MWe coal-fired tangential boiler. Asia-Pac. J. Chem. Eng. 2021, 17, e2734. [Google Scholar] [CrossRef]
  12. Rad, S.D.; Ashrafizadeh, A.; Nickaeen, M. Numerical simulation of fluid flow and heat transfer in an industrial continuous furnace. Appl. Therm. Eng. 2017, 117, 263–274. [Google Scholar] [CrossRef]
  13. Ma, L.; Fang, Q.; Yin, C.; Wang, H.; Zhang, C.; Chen, G. A novel corner-fired boiler system of improved efficiency and coal flexibility and reduced NOx emissions. Appl. Energy 2019, 238, 453–465. [Google Scholar] [CrossRef]
  14. Yin, C.; Caillat, S.; Harion, J.-L.; Baudoin, B.; Perez, E. Investigation of the flow, combustion, heat-transfer and emissions from a 609 MW utility tangentially fired pulverized-coal boiler. Fuel 2002, 81, 997–1006. [Google Scholar] [CrossRef]
  15. Fang, Q.; Wang, H.; Wei, Y.; Lei, L.; Duan, X.; Zhou, H. Numerical simulations of the slagging characteristics in a down-fired, pulverized-coal boiler furnace. Fuel Process. Technol. 2010, 91, 88–96. [Google Scholar] [CrossRef]
  16. Gao, S.; Wang, B.; Yang, F.; Zhang, K.; Cheng, F. Effect of O2 concentration on combustion behavior and kinetics of coal gangue during oxy-fuel combustion and oxy-steam combustion. Asia-Pac. J. Chem. Eng. 2021, 16, e2713. [Google Scholar] [CrossRef]
  17. Siegmund, T.; Gollmer, C.; Scherzinger, M.; Kaltschmitt, M. A review of CO emissions during solid biofuel combustion—Formation mechanisms and fuel-related reduction measures. J. Energy Inst. 2024, 116, 101762. [Google Scholar] [CrossRef]
  18. Wu, X.; Song, Q.; Zhao, H.; Yao, Q. Synergetic effect of biomass volatiles on NO reduction and the influence of K/Na on it. Fuel 2015, 158, 634–640. [Google Scholar] [CrossRef]
  19. Liu, L.; Memon, M.Z.; Xie, Y.; Gao, S.; Guo, Y.; Dong, J.; Gao, Y.; Li, A.; Ji, G. Recent advances of research in coal and biomass co-firing for electricity and heat generation. Circ. Econ. 2023, 2, 100063. [Google Scholar] [CrossRef]
  20. Yuan, H.; Qiu, Q.; Sun, H.; Luo, S. Catalytic reduction behaviors of NOx and its use in biomass combustion. Therm. Sci. 2024, 28 Pt B, 4297–4306. [Google Scholar] [CrossRef]
  21. Shu, Y.; Zhang, F.; Wang, H.; Zhu, J.; Tian, G.; Zhang, C.; Cui, Y.; Huang, J. An experimental study of NO reduction by biomass reburning and the characterization of its pyrolysis gases. Fuel 2015, 139, 321–327. [Google Scholar] [CrossRef]
Disclaimer/Publisher’s Note: The statements, opinions and data contained in all publications are solely those of the individual author(s) and contributor(s) and not of MDPI and/or the editor(s). MDPI and/or the editor(s) disclaim responsibility for any injury to people or property resulting from any ideas, methods, instructions or products referred to in the content.

Article Metrics

Citations

Article Access Statistics

Article metric data becomes available approximately 24 hours after publication online.