Abstract
Experimental and theoretical techniques have been developed to quantify foamy oil behaviour of solvent-heavy oil systems at bubble level during a gas exsolution process. During constant composition expansion (CCE) tests, we artificially induced foamy oil dynamics for solvent-heavy oil systems by gradually reducing pressure and recorded the changed pressures and volumes in an isolated PVT setup at a given temperature. By discretizing gas bubbles on the basis of the classical nucleation theory, we theoretically integrated the population balance equation (PBE), Fick’s law, and the Peng–Robinson equation of state (PR EOS) to reproduce the experimental measurements. Pseudo-bubblepoint pressure for a given solvent-heavy oil system can be increased with either a lower pressure depletion rate or a higher temperature, during which gas bubble growth is facilitated with a reduction in viscosity and/or an increase in solvent concentration, but gas bubble nucleation and mitigation is hindered with an increase in solvent concentration. Compared to CO2, CH4 is found to yield stronger and more stable foamy oil, indicating that foamy oil is more stable with a larger amount of dispersed gas bubbles at lower temperatures. Using the PR EOS together with the modified alpha functions at Tr = 0.7 and Tr = 0.6, the absolute average relative deviation (AARD) is reduced from 4.58% to 2.24% with respect to the predicted pseudo-bubblepoint pressures.
1. Introduction
For huge heavy oil reserves, oil production can be boosted by inducing solution-gas drive associated with foamy oil (i.e., dispersed gas bubbles are partially or completely entrained in the oil phase) [1,2,3]. Physically, foamy oil is either naturally formed during the primary depletion of a heavy oil reservoir or artificially induced by injecting gaseous solvents (i.e., CO2, N2, air, and alkane solvents) into the depleted heavy oil reservoir, allowing us to maintain reservoir pressure and achieve higher oil recovery at a lower gas–oil ratio (GOR) [4,5,6,7]. To date, numerous efforts have been directed to evaluate the performance of solution-gas drives in a heavy oil reservoir, in which foamy oil phenomenon has been considered as the key factor that dominates heavy oil recovery [1,3,8,9,10]. During a gas-solution drive, heavy oil viscosity, pressure depletion rate, and dissolved gas concentration are found to affect gas exsolution behaviour and foamy oil stability, which describes the ability of heavy oil to resist the releasing of dispersed gas bubbles [11,12]. It is, therefore, necessary to quantify gas exsolution in heavy oil for the purpose of understanding the phase behaviour of foamy oil formed with the dispersed and nucleated gas bubbles, as well as evaluating and optimizing the solvent-assisted recovery methods in a heavy oil reservoir.
Once pressure is depleted below the pseudo-bubblepoint pressure in a heavy hydrocarbon reservoir, gas bubbles are induced in heavy oil, resulting from bubble nucleation and growth and their binary coalescence, all of which greatly affect the exsolution of dissolved gas(es) along with oil gravity, interfacial tension between heavy oil and dissolved gaseous solvents, and viscous forces [5,13,14]. In a polar coordinate, the isothermal gas bubble growth process has been quantified by applying Fick’s second law, assuming that gas bubbles are surrounded by a liquid shell, as shown in Figure 1 [15], while gas bubble growth patterns in porous media are disordered with an increasing size in cluster [16]. Alternatively, Li and Yortsos [17] found that the fractal dimension of 2.5 determined from the fractal theory can better characterize the gas bubble growth pattern in porous media; however, such a determined fractal dimension finds its limits incorporated into the existing reservoir simulators for improving their prediction performance. Recently, new kinetic models have been made possible for integration with reservoir simulators to simulate foamy oil behaviour at the field-scale under non-equilibrium conditions once the minimum deviations between the experimentally measured and theoretically calculated pressures and oil volumes are achieved [18,19]. In these studies, the gas phase is usually treated as dissolved gas, dispersed gas bubbles, or released free gas; however, few attempts have been made to quantify gas exsolution at bubble level as well as accurately describe the associated foamy oil dynamics.
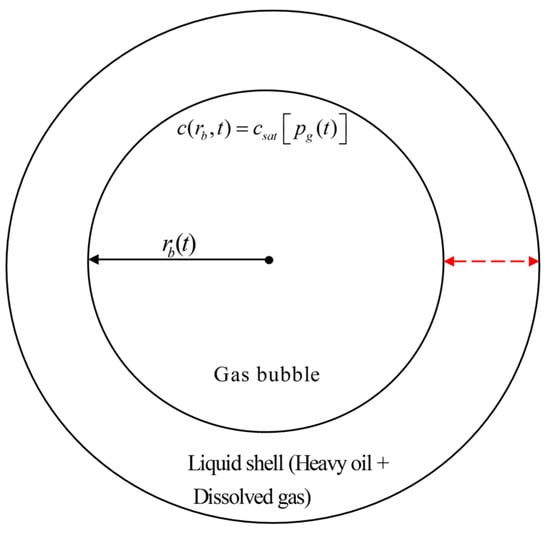
Figure 1.
Schematic diagram of gas bubble surrounded by liquid shell (modified from [15]). The black arrow represents the inner bubble radius () that changes with time, and the red dashed arrow denotes the thickness of the liquid shell.
Usually, the homogeneous and instantaneous nucleation (IN) is assumed for bubble nucleation in the bulk phase [18,20,21], while, in porous media, there exists a heterogeneous and progressive bubble nucleation process with consideration of cracks and rough areas that have poor wetting characteristics (i.e., the contact angle of a liquid on a solid surface is larger than 90°), during which gas bubbles tend to form at specific sites [18,22,23]. Gas bubbles with the same size are usually assumed under the IN condition; however, binary coalescence of gas bubbles, which generally results in a dynamic bubble size distribution, is significantly important during the gas bubble formation process. For progressive nucleation (PN), supersaturation pressure, which is the breakup probability that describes the likelihood of gas bubbles to be broken with a change in thermodynamic properties [24], and density distribution are utilized to determine the gas bubble growth pattern in porous media [17]. Also, they found an invasion percolation pattern of bubble growth with a single cluster resulted from small sizes, low capillary numbers, and low supersaturations. To date, the classical nucleation theory is extensively used to quantify such a PN process under both homogeneous and heterogeneous conditions [25,26]. Normally, gas bubble growth rate is dictated by molecular diffusion of a dissolved gas component and oil volume expansion due to the pressure depletion [27]. During foamy oil formation, gas bubble growth rate can be estimated with Fick’s law, provided that both gas dissolution and exsolution processes are accurately quantified [7,19]. For the binary coalescence dominated by buoyancy force, the PBE has seen its successful applications in accurately determining coalescence efficiency, mobilization of gas bubbles, and the appearance of a free gas phase, respectively [28,29,30,31].
On the basis of our previous work [32], in addition to collecting data for CO2/CH4-heavy oil systems from the public domain, we experimentally and theoretically quantified gas exsolution of gaseous CO2 from a bulk oil phase with a different heavy oil sample. Experimentally, the pseudo-bubblepoint pressure and dynamic volume change for CO2-heavy oil systems were measured with a series of CCE tests at different temperatures and pressure depletion rates. Theoretically, the PR EOS together with a modified α function at Tr = 0.7 and a new one redefined at Tr = 0.6 is used to calculate the molar concentration for each gas component at the CO2–oil interface for the aforementioned systems. Then, bubble nucleation and growth rate were predicted with the classical nucleation rate and Fick’s law, respectively, while bubble mobilization and binary coalescence were described with the PBEs which were discretized into partial differential equations with the fixed-pivot technique. Subsequently, total gas bubble number and bubble size distribution are quantified once the differences between the measured and calculated pseudo-bubblepoint pressures () and dynamic volume changes are minimized.
2. Experimental
2.1. Materials
As for the gas exsolution experiments, the clean stock-tank heavy oil sample applied in the CO2-heavy oil system is collected from the Lloydminster area and has a molecular weight of 482 g/mol and a viscosity of 8251 cP at atmospheric pressures of 101.325 kPa and 298.15 K, respectively. Table 1 tabulates the detailed compositional analyses of the heavy oil sample, which is also described in Figure 2. The measured oil viscosities at different conditions for the heavy oil sample can be found elsewhere [32,33]. The purities of gaseous CO2 applied in the tests are 99.998 mol%. The detailed test feeds together with the measured and calculated and , which can be found in Table 2.

Table 1.
Compositional analysis of the Lloydminster stock-tank heavy oil sample.
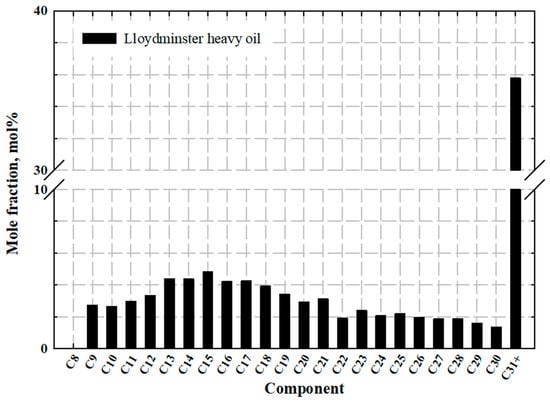
Figure 2.
Oil compositions of Lloydminster heavy oil.
2.2. Experimental Setup
In this work, a mercury-free PVT system (PVT-0150-100-200-316-155, DBR) was used for all the CCE tests. As shown in the schematic diagram of the PVT apparatus (i.e., Figure 3), a visual glass tube is fitted in the PVT cell. The detailed description of this PVT setup can be found elsewhere [19,32,34,35,36,37]. The sample fluids and hydraulic oil are contained in the glass tube and separated by a floating piston. The maximum operating temperature and pressure are 473.15 K and 69,000 kPa, respectively. A high-pressure syringe pump (500HP, ISCO Inc., Lincoln, NE, USA) is connected to the PVT system to control the cell pressure with an uncertainty of ±4.0 kPa. During each test, the liquid volume is quantified by tracking the position of the piston, which is monitored by a video-based cathetometer with a measurement precision of 0.002 cm. The experimental temperature is maintained by the air-bath system that has an accuracy of ±0.1 K.
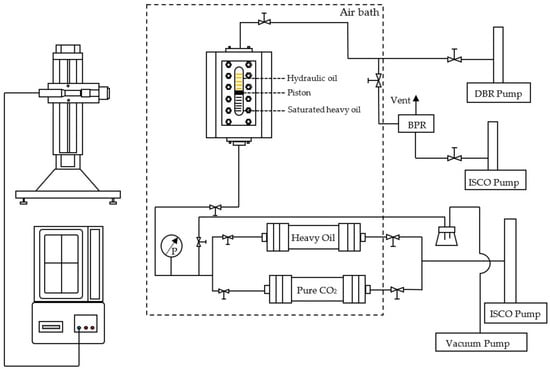
Figure 3.
Schematic diagram of PVT setup.
2.3. Experimental Procedures
For the CO2-heavy oil systems, we inject a small amount of the oil sample and gaseous CO2 into the PVT cell separately and allow the mixture to reach its equilibrium prior to the CCE experiments. Detailed procedures are briefly described as follows:
- (1)
- Firstly, gas and dead heavy oil sample are prepared in the transfer cylinder, respectively.
- (2)
- Prior to the experiments, leakage tests have been conducted to ensure no leakage of the PVT apparatus and the connecting tubes, which are then cleaned thoroughly with kerosene, flushed with air, and evacuated with a vacuum pump. Subsequently, transfer cylinders that contain the prepared gas and oil samples are connected to the PVT cell. The gaseous CO2 is introduced into the PVT apparatus followed by the injection of Lloydminster heavy oil.
- (3)
- After the samples are injected into the PVT glass tube, we close the inlet valve immediately. Then, the temperature is set to its prespecified value and maintained constant throughout the test. The initial experimental pressure is set to the designed value that is higher than the bubblepoint pressure () to initiate the CCE experiments from the single liquid phase.
- (4)
- After we completed injecting CO2 and the heavy oil sample, the CO2-heavy oil mixture is agitated with the equipped mixer for more than 24 h to achieve its homogeneity.
- (5)
- Once the temperature and pressure of the PVT system are stabilized, the volume change rate of the hydraulic oil in the syringe pump is applied to determine whether the homogenized state of the injected sample has been reached. When the volume change rate is less than 0.001 mL/min, the homogenized state is achieved for CO2-heavy oil systems at the designed pressure and temperature. Then, the mixer is turned off, and the CCE test with a constant pressure depletion rate is initiated.
During the CCE test, the dynamic pressure of the system on the sample side and the corresponding liquid volume is continuously tracked and recorded with time. To make the theoretical work more solid and conclusive, extra experimental data, i.e., Tests #6–7 [38], Tests #8–11 [35], and Tests #12–13 [38], are collected from the literature and the details pertaining to physical properties of heavy oil and the experiments can be found elsewhere [35,38,39,40].
Table 2.
Detailed experimental design together with the measured and calculated and for the CH4/CO2-heavy oil systems.
Table 2.
Detailed experimental design together with the measured and calculated and for the CH4/CO2-heavy oil systems.
| Feed | Composition, mol% | Test No. | Temperature, K | dp/dt, kPa/min | Measured | Calculated with Equation (24a) | AARD, % | Calculated with Equation (24b) | AARD, % | Source | ||||
|---|---|---|---|---|---|---|---|---|---|---|---|---|---|---|
| Oil | Gas | , kPa | , kPa | , kPa | , kPa | , kPa | , kPa | |||||||
| CO2-heavy oil | 87.64 | 12.36 | 1 | 303.15 | 20 | 914 | 888 | 2.84 | 890 | 2.63 | This study | |||
| 2 | 30 | 904 | 974 | 7.74 | 958 | 5.97 | ||||||||
| 3 | 323.15 | 1075 | 1108 | 3.07 | 1079 | 0.37 | ||||||||
| 4 | 333.15 | 10 | 1124 | 1146 | 1.96 | 1137 | 1.16 | |||||||
| 5 | 20 | 1035 | 1052 | 1.64 | 1025 | 0.97 | ||||||||
| 80.25 | 19.75 | 6 | 294.15 | 20 | 2000 | 2156 | 7.80 | 2073 | 3.65 | [38] | ||||
| 61.32 | 38.68 | 7 | 4600 | 4796 | 4.26 | 4594 | 0.13 | |||||||
| CH4-heavy oil | 88.60 | 11.40 | 8 | 348.15 | 15 | 2343 | 2503 | 6.83 | 2480 | 5.85 | [35] | |||
| 9 | 288.15 | 1065 | 1125 | 5.63 | 1075 | 0.94 | ||||||||
| 10 | 348.15 | 0.65 | 2686 | 2852 | 6.18 | 2698 | 0.45 | |||||||
| 11 | 288.15 | 1852 | 2019 | 9.02 | 1950 | 5.29 | ||||||||
| 79.49 | 20.51 | 12 | 294.15 | 20 | 5800 | 5798 | 0.03 | 5797 | 0.05 | [38] | ||||
| 59.62 | 40.38 | 13 | 15,100 | 15,489 | 2.58 | 15,354 | 1.68 | |||||||
| Overall | 4.58 | 2.24 | ||||||||||||
3. Mathematical Formulations
3.1. Assumptions
The following assumptions have been applied while performing the gas exsolution calculations:
- (1)
- The PVT cell is considered isolated, and the gas exsolution process is isothermal as the experimental temperature is maintained constant;
- (2)
- Gas components are assumed to be homogeneous in the liquid phase, and oil compressibility is neglected;
- (3)
- Molecular diffusion is the only mechanism considered for gas exsolution;
- (4)
- Gas bubble nucleation is homogeneous and finished at the beginning of each time step with each bubble having a spherical geometry;
- (5)
- Binary collision of the bubbles is assumed; and
- (6)
- Coalescence time between a gas bubble and the free gas phase is set to be 0.
3.2. Classical Nucleation Theory
In this study, the bubble nucleation rate is calculated with the classical nucleation theory that can be expressed as follows [14,41]:
where factors A and B are considered as kinetic and thermodynamic constants and can be determined according to the experimental measurements [14,41,42]. For the homogeneous bubble nucleation rate, it can be described by the following equation [25]:
where A is the kinetic parameter, and ΔG represents the change in Gibbs free energy involved in the nucleation process. Considering the homogeneous bubble nucleation rate in the bulk phase, the nucleation rate can be described as [25,41]:
and the factor F is determined based on the following equation with the consideration of and [43]:
For nucleation on a smooth rigid surface, the classical nucleation theory can be expressed as follows [25]:
where λ is the correction factor for the effect of the surface on the bubble nucleation rate, which can be obtained by experimental measurements [25]. Since the PVT cell is cylindrical, the nucleation on the surface is also taken into consideration. Then, the total nucleation rate is determined as follows [25]:
where factors , , , and can be considered as constants. As the PVT cell is cylindrical, S denotes the surface area per unit volume and equals to . At a given thermodynamic condition, the parameters , , , and have their specific forms. For a solvent-heavy oil system, the solution of different parameters is considered to be unique at a given thermodynamic condition [41].
3.3. Gas Bubble Growth Rate
To reduce the computational expenses of the theoretical framework, the fixed-pivot technique was employed to discretize gas bubble radius [44]:
where is the gas bubble radius at the ith interval and initial time. The adjustable geometric size interval (i.e., ) is set to 1.2 [30,44].
During the experiments, the molecular diffusion of gas components from oil phase to gas bubble makes the bubble radius continuously increase. On the basis of Fick’s law, Epstein and Plesset [45] derived the mass transfer rate of a bubble surrounded by a spherical heavy oil shell:
where and represent the molar concentration of the gas component in the liquid and gas phases, respectively, D denotes the molecular diffusivity of the dissolved solvent, m represents the mass transfer rate, r denotes the radius of gas bubbles, and t is time.
For CO2-heavy oil systems, CO2 molecular diffusivity can be calculated based on the following equation [46]:
while a, b, c, and e denote the coefficients specific to the heavy oil sample, and are the reduced pressure and reduced temperature of the heavy oil, respectively. For the CH4-heavy oil system, CH4 diffusivity is determined based on the previous works [47,48], during which dead and diluted heavy oil viscosities are determined on the basis of the specific viscosity correlation proposed by Yarranton et al. [49]:
where and are constants that are unique to the ith component in the heavy oil, and denote the viscosibility factor for the ith component and heavy oil sample that represents the effect of pressure on viscosity, respectively, and represents the heavy oil viscosity at a pressure of 101.325 kPa and temperature T.
Despite molecular diffusion, the expansion of discretized gas bubbles also results from pressure depletion, which is illustrated by changing the value of nodes and determined by the following equation:
where represents the gas compressibility factor at time t.
After discretization, a new gas bubble radius for each time step is redistributed to the corresponding adjacent gas bubble radius according to the following contribution function [30]:
where denotes the gas bubble radius at the pivot of ith interval and .
As such, the updated number density can be expressed as follows:
where z denotes the column height of the liquid phase.
3.4. Population Balance Equations (PBEs)
The PBEs are utilized to describe gas bubble coalescence and migration. In this study, the time (t) and column height (z) are considered as external coordinates originating from the bottom of the PVT cell, while the gas bubble radius (r) is considered as an internal coordinate, as shown in Figure 4. The PBE is expressed as the following equation [30,50]:
where denotes the molecular diffusivity of the gas bubble, is the gas bubble birth rate, represents the gas bubble death rate due to binary coalescence, and represents the gas bubble rising velocity. The gas bubble birth and death rates (i.e., and ) can be determined based on the following equations [30,51]:
where , , and represent different sizes of the gas bubbles, respectively.
Figure 4.
Schematic diagram of internal and external coordinates for the PBEs.
Binary coalescence is determined with collision frequency as a result of the Brownian motion and mobility velocity difference, which can be calculated as follows [30]:
where represents the collision efficiency that is related to density, viscosity, and interfacial tension [52], while and represent the collision frequency as a result of Brownian motion and mobility velocity difference, respectively. and represent the rising velocities of gas bubbles with different sizes. In this study, gas exsolved from heavy oil is theoretically estimated to be around 2 mol% of the total amount of gas dissolved in the heavy oil, which tends to induce a minor influence on the aforementioned parameters [52]. As such, the collision efficiency () is assumed to be constant at 0.025 [51]. Furthermore, interfacial coalescence is not considered since only a limited amount of free gas phase is formed during the experiments [30].
The rising velocity of a gas bubble in the oil phase can be predicted according to the following equations [53]:
where g denotes gravitational acceleration, and and represent gas density and liquid density, respectively. By applying the minimum value of the calculated velocities from Equation (18a–c), the shape of each bubble can be identified automatically with the determined rising velocity [53], which extensively reduces computational cost.
3.5. Initial and Boundary Conditions
At beginning of an experiment (), CO2 and CH4 are completely dissolved in the oil. The number density of gas bubbles equals to zero, i.e.,
Also, in the beginning of each time step, it is assumed that new gas bubbles nucleate instantaneously, as illustrated in Assumption #4. The number density of gas bubbles can be calculated based on the following equation:
where is selected on the basis of the required accuracy and computational costs.
3.6. Peng–Robinson Equation of State (PR EOS)
As one of the most popular equations of state with its simplicity and accuracy, PR EOS is utilized to predict the equilibrium pressure, saturation gas concentration, and the composition of both gas and oil phase for the mixtures [15,19], which is written as follows [56]:
where and represent the critical pressure and critical temperature, respectively, denotes the universal gas constant, represents the molar volume, and denotes the acentric factor.
For the CO2/CH4-heavy oil systems, an improvement in prediction accuracy has been achieved with the modified alpha function by Li and Yang [57] that can be expressed as follows [37,40,58]:
Recently, by evaluating different solvent-heavy oil systems, Chen and Yang [59] proposed a new alpha function redefined at Tr = 0.6, which demonstrated superior performance compared to the existing alpha function for predicting saturation pressure [60] as well as solubility and density [61]. Such a new alpha function is listed in Equation (24b), while the redefined acentric factor at Tr = 0.6 can be determined with Equation (25a–c) [59,62]:
where represents the atmospheric pressure.
Since heavy oil samples have been characterized as multiple pseudocomponents (PCs), the van der Waals mixing rule is applied to determine the parameters a and b that can be found elsewhere [19,34,36]. The binary interaction parameters (BIPs) are determined with the following correlation proposed by Chueh and Prausnitz [63]:
where represents the critical volume. The exponent is determined by matching the calculated with the measured ones, and its detailed procedure can be found elsewhere [60,61,64].
3.7. Numerical Solution
As shown in Figure 5, both the gas bubble number density and trapped gas volume can be calculated with the proposed flowchart which can be detailed as follows:
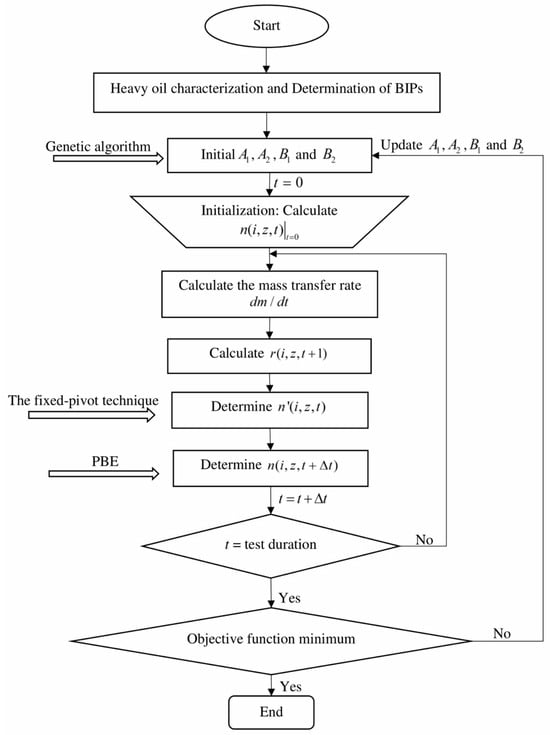
Figure 5.
Flowchart for quantifying the gas exsolution.
- (1)
- For each heavy oil sample, it is characterized into multiple PCs. For the CO2-heavy oil system, the Lloydminster heavy oil sample is divided into four PCs, while the Sparky heavy oil is characterized into five PCs. For each solvent (i.e., CO2 and CH4), it is treated as a single component.
- (2)
- Determine the BIPs for each gas-heavy oil system by reproducing its experimentally measured .
- (3)
- Initial values of , , , and in Equation (6) are, respectively, assumed.
- (4)
- Calculate the gas bubble number density with the classical nucleation theory and its new gas bubble radius at .
- (5)
- Update the new gas bubble distribution with the PBEs by taking gas bubble migration and coalescence into consideration.
- (6)
- Repeat Steps #4 to 5 until the experimental duration has been reached.
- (7)
- The AARD between the measured and calculated parameters is calculated by the following objective function when time reaches the experimental duration:
The four coefficients in Equation (6) can be determined simultaneously once the AARD between the measured and calculated parameters has been reduced less than 0.01. With the determined coefficients, the total gas bubble number and the change in gas bubble radius can be calculated.
4. Results and Discussion
4.1. Heavy Oil Characterization
In this work, both heavy oil samples applied in the experiments have been divided into multiple PCs with the consideration of accuracy and computational costs. The Lloydminster oil sample used in the CO2-heavy oil systems is divided into four PCs, the physical and critical properties of which are determined according to Hong’s mixing rule with weight fraction average [64,67] and tabulated in Table 3, while the BIPs between CO2 and each PC are calculated based on Equation (26) [64] and stated in Table 4. Good performance has been achieved by combining the van der Waals mixing rule with the optimized BIPs (i.e., Table 4), indicating the reliability of the proposed framework [64]. The detailed physical and critical properties of the Sparky oil sample applied in the CH4-heavy oil systems can be found elsewhere [35,40].
Table 3.
Physical and critical properties of pseudocomponents (PCs) for Lloydminster heavy oil.
Table 4.
BIPs between any two components for CO2-Lloyminster heavy oil systems.
4.2. and Gas Volume
As tabulated in Table 2, for the CO2/CH4-heavy oil systems at the same pressure depletion rate, the is measured to be larger at a higher experimental temperature. This is because, at a higher temperature, solubility of the gaseous solvent in the heavy oil is lower, resulting in an earlier release of gas molecules from the oil phase, that is a higher or [35,68,69]. Additionally, the increasing kinetic energy of solvent molecules at a higher temperature, which can be estimated with the kinetic theory of gases that describes the relationship between kinetic energy and temperature, results in a stronger mass transfer in the CO2/CH4-heavy oil systems [25,47]. At the same temperature with a slower pressure depletion rate, the measured is higher. This finding is consistent with those reported elsewhere [68,70]; nevertheless, the measured is found to be higher with a higher solvent concentration at the same temperature with the same pressure depletion rate, indicating that a higher solvent concentration leads to more gas bubbles forming in the oil phase [38]. In addition, as illustrated in Table 2, the AARD between the measured and calculated is 4.58%, indicating the reliability of the calculated results.
During the CCE tests, the liquid volume was monitored and recorded continuously, while its change can be determined for each time step. Figure 6a,b present the measured and calculated liquid volume change for CO2-heavy oil systems (i.e., Tests #1–7), while others (i.e., Figure 6c–e) show the measured and calculated liquid volume change for CH4-heavy oil systems (i.e., Tests #8–13). As illustrated, volume change (i.e., ) at the early period is not obvious since pressure is higher than the of the gas-saturated heavy oil, implying that bubble nucleation has not been initiated in the oil phase, i.e., a single liquid phase is formed with the complete dissolution of solvents in the heavy oil. Once pressure is reduced below , the volume change sees a sharp increase, indicating that gas bubble nucleation and coalescence is initiated and a free gas phase is formed as well. Physically, a formed free gas phase is triggered right below the to initiate bubble nucleation, and gas bubbles grow stably once pressure declines below the [38,55].
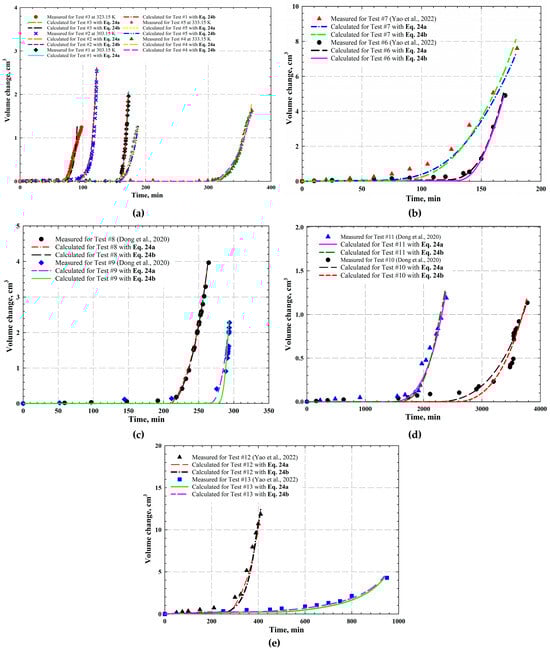
Figure 6.
Measured and calculated volume change for (a) CO2-saturated heavy oil at 303.15 K and 20 kPa/min (i.e., Test #1), 303.15 K and 30 kPa/min (i.e., Test #2), 323.15 K and 30 kPa/min (i.e., Test #3), 333.15 K and 10 kPa/min (i.e., Test #4), and 333.15 K and 20 kPa/min (i.e., Test #5); (b) CO2-saturated heavy oil at 294.15 K and 20 kPa/min with CO2 concentration of 19.75 mol% (i.e., Test #6) and 38.68 mol% (i.e., Test #7); (c) CH4-saturated heavy oil at 348.15 K and 15 kPa/min (i.e., Test #8) and 288.15 K and 15 kPa/min (i.e., Test #9); (d) CH4-saturated heavy oil at 348.15 K and 0.65 kPa/min (i.e., Test #10) and 288.15 K and 0.65 kPa/min (i.e., Test #11); and (e) CH4-saturated heavy oil at 294.15 K and 20 kPa/min with CH4 concentration of 20.51 mol% (i.e., Test #12) and 40.38 mol% (i.e., Test #13) [35,38].
The calculated volume change in each experiment is also presented in Figure 6a–e. As observed, the calculated volume change in each test agrees well with the measured one, showing an overall AARD of 5.94%. The calculated liquid volume changes, however, are slightly different from the measured ones during the early period, which is considered as the expansion of the oil phase with a reduced pressure. Although such an expansion is not included in the calculation, it can be quantified with oil compressibility as defined as follows [55,67]:
where is oil compressibility, and and denote the oil volume and pressure, respectively. As indicated in the definition, the oil volume gradually increases with a reduction in pressure as it is higher than the . As pressure is reduced to the of the oil phase, gas bubble nucleation and coalescence are then initiated. More gas bubbles are nucleated as pressure continuously decreases, and their sizes keep increasing with the consideration of the binary coalescence and diffusion process of gas molecules from oil phase to gas bubbles. As such, volume change increases rapidly, provided that the system pressure is decreased to the or below.
As aforementioned, both modified α function at Tr = 0.7 (i.e., Equation (24a)) and the new one redefined at Tr = 0.6 (i.e., Equation (24b)) have been integrated with PR EOS to calculate and oil volume change. Compared with the modified α function at Tr = 0.7, the new one redefined at Tr = 0.6 reduces the AARD of the calculated from 4.58% to 2.24%, as shown in Table 2. In addition, the calculated volume change in each test with Equation (24a) is also plotted in Figure 6a–e. As depicted in the figure, there exists a good agreement between the calculated and measured parameters with an overall AARD of 5.56%.
4.3. Gas Bubble Number
With the application of general nucleation theory and PBEs, the entrained and released gas bubble numbers are determined with the consideration of bubble nucleation, mobilization, and binary coalescence. The change in bubble number for each test is shown in Table 5. Numerous gas bubbles are found to be trapped in the oil at end of the test for both CO2- and CH4-heavy oil systems, indicating that foamy oil has been formed. In addition, a small quantity of gas bubbles has been released from each heavy oil, whereas free gas phase starts to form with the released gas bubbles. The frequency distributions of gas bubbles for CO2-heavy oil systems and CH4-heavy oil systems are illustrated in Figure 7a and Figure 7b, respectively. Also, the number of entrained and released gas bubbles at each time step is plotted in Figure 8 (i.e., CO2-heavy oil systems) and Figure 9 (i.e., CH4-heavy oil systems), respectively.
Table 5.
Calculated gas bubble number and size for each test.
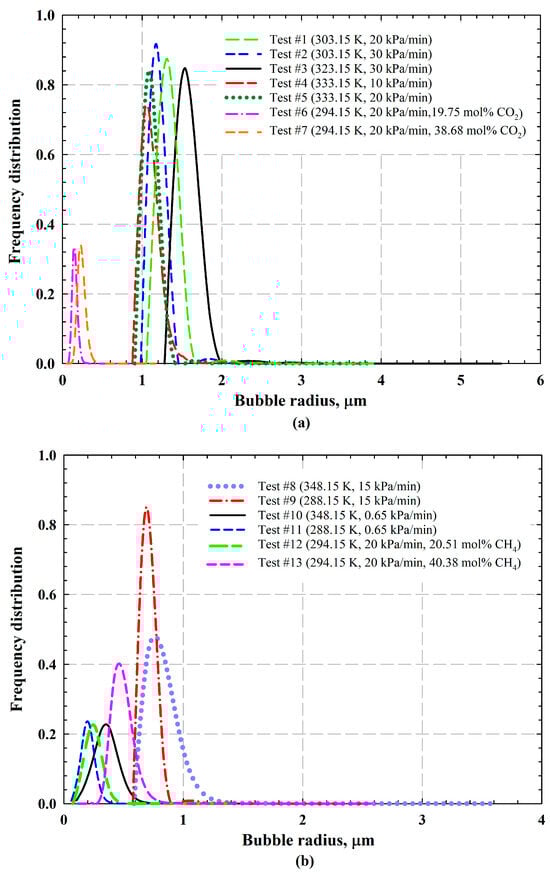
Figure 7.
Frequency distribution of gas bubbles for (a) CO2-heavy oil systems (i.e., Tests #1-#7) and (b) CH4-heavy oil systems (i.e., Tests #8-#13 [35]).
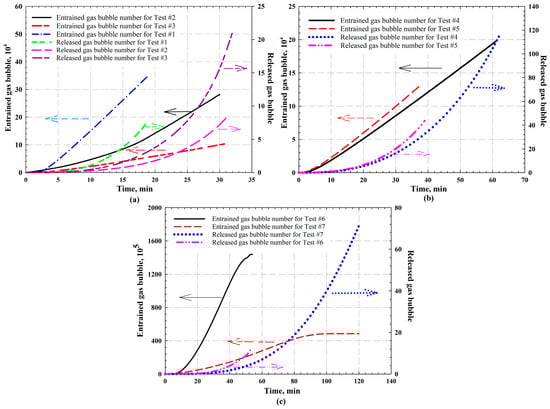
Figure 8.
The calculated entrained and released gas bubbles for CO2-heavy oil system for (a) Tests #1–3 (i.e., Test #1 at 303.15 K and 20 kPa/min, Test #2 at 303.15 K and 30 kPa/min, and Test #3 at 323.15 K and 30 kPa/min); (b) Tests #4–5 (i.e., Test #4 at temperature of 333.15 K with 10 kPa/min and Test #5 at 333.15 K with 20 kPa/min); and (c) Tests #6–7 (i.e., Test #6 with 19.75 mol% CO2 and Test #7 with 38.68 mol% CO2 at 294.15 K with 20 kPa/min). The arrows in the figures indicate the y-axis corresponding to each curve.
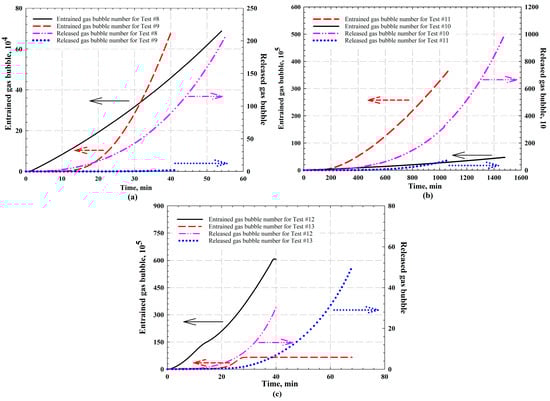
Figure 9.
The calculated entrained and released gas bubbles for CH4-heavy oil system at different temperatures with pressure depletion rate of (a) 15 kPa/min (i.e., Test #8 at 348.15 K and Test #9 at 288.15 K); (b) 0.65 kPa/min (i.e., Test #10 at temperature of 348.15 K and Test #11 at temperature of 288.15 K); and (c) CH4 concentration (i.e., Test #12 with 20.51 mol% CH4 and Test #13 with 40.38 mol% CH4) at 294.15 K with pressure depletion rate of 20 kPa/min. The arrows in the figures indicate the y-axis corresponding to each curve.
4.3.1. CO2-Heavy Oil Systems
By comparing the gas bubble number at the same temperature of 303.15 K with different pressure depletion rates (i.e., 20 kPa/min for Test #1 and 30 kPa/min for Test #2), more gas bubbles were found to be formed with a lower pressure depletion rate (i.e., Test #1 with 20 kPa/min). At a higher temperature of 333.15 K (i.e., 10 kPa/min for Test #4 and 20 kPa/min for Test #5), more gas bubbles were formed in Test #5 that was conducted at a higher pressure depletion rate. It is considered that there exists an optimum depressurization rate that leads to the strongest foamy oil behaviour. By conducting different experiments with depressurization rates varying from 6 L/min to 36 L/min, Sheng et al. [69] concluded that, below 18 L/min, the foamy oil behaviour is stronger with an increase in depressurization rate due to stronger supersaturation; however, once the depletion rate is higher than 18 L/min, the foamability and foam stability reduces with the rate, which is attributed to the fact that solvent solubility decreases rapidly so that solvent molecules release quickly from the oil phase before nucleation. Similarly, with a faster pressure depletion of 30 kPa/min above the optimum one, the bubble number formed in Test #2 was less than that of Test #1. For Tests #4 and #5, once the depressurization rate is lower than the optimum one, a higher depletion rate tends to attain a stronger supersaturation, which is considered as the mechanism of forming a later free gas phase [7,41,71].
The number of trapped and released gas bubbles at each time step is plotted in Figure 8. It is worthwhile to mention that the timeline of these figures starts from the one at which gas bubbles are initiated to nucleate. It is shown in Figure 8a that, for Test #1, more gas bubbles are found to be trapped in the heavy oil. As aforementioned, due to the rapid pressure reduction, CO2 molecules release from the oil phase quickly before nucleation and form the free gas phase, which is plotted as released gas bubble number. As shown in the figure, a larger free gas phase is formed for Test #1 in a shorter time compared with Test #2. The entrained and released gas bubbles for Tests #4 and #5 are plotted in Figure 8b. Since the experimental duration of the two tests are different, more gas bubbles are released in Test #4 than Test #5 at end of the test as shown in the figure.
As illustrated in Figure 8a, by comparing the gas bubble number at different temperatures with the same pressure depletion rate of 30 kPa/min (i.e., 303.15 K for Test #2 and 323.15 K for Test #3), heavy oil tends to entrain more gas bubbles at a lower temperature, indicating a more stable foamy oil has been generated in Test #2. This is because resistance of the bubble coalescence is weaker at a higher temperature with a lower viscosity of heavy oil [72]. In addition, the released gas bubbles that tend to generate the free gas phase are determined with the PBEs while considering bubble mobilization. Comparing the number of released gas bubbles at the end of Tests #2 and #3, as indicated in Table 5, more gas bubbles are released for Test #3 (i.e., a total of seven gas bubbles of different sizes for Test #2 and twenty-two bubbles for Test #3) since the latter was conducted at a higher temperature which leads to a lower heavy oil viscosity and a higher bubble rising velocity.
For Tests #6 and #7, the experiments were designed with different solvent concentrations (Test #6 was conducted with 19.75 mol% CO2 and Test #7 was conducted with 38.68 mol% CO2) [38]. The calculated trapped and released gas bubbles are illustrated in Figure 8c. The total entrained gas bubble number calculated for Test #6 was found to be constant after a certain time (see Figure 8c). Since the experiments with a higher solvent concentration was conducted at a higher pressure, the entrained gas bubbles tend to be more stable with a smaller bubble volume, and it is more difficult for them to be released from the heavy oil to generate the free gas phase. This finding is also reflected in the released gas bubble number as shown in Figure 8c [38]. In addition, the growth and coalescence of the nucleated gas bubbles will be impeded at a higher experimental pressure [73,74].
4.3.2. CH4-Saturated Heavy Oil Systems
As aforementioned, the gaseous CH4 has been combined and mixed well with the heavy oil prior to its introducing into the PVT cell; that is, the live oil sample has been used for CCE experiments. The entrained and released gas bubble numbers have been calculated for each test, the results of which are tabulated in Table 5. For Tests #8 and #9 conducted with a pressure depletion rate of 15 kPa/min at different temperatures (i.e., 348.15 K for Test #8 and 288.15 K for Test #9), during the early period of the bubble nucleation process, the number of entrained gas bubbles increased with the experimental temperature (see Figure 9a). This is because both nucleation and coalescence of gas bubbles are considered faster with a weaker viscous force as temperature increases [21,72]. With a continuous decrease in pressure, more gas bubbles are nucleated and coalesced to form bubbles with a larger size. Due to a higher viscosity at a lower temperature, however, the resistance of binary coalescence is stronger, resulting in more gas bubbles of smaller size isolated and dispersed in the heavy oil, as illustrated in Figure 9a. Eventually, an increasing number of gas bubbles was contained in the oil sample for Test #9, compared with that of Test #8. As illustrated in Figure 9a, at end of the experiments, only few bubbles were exsolved from foamy oil to form a free gas phase for Test #9.
Similarly, for Tests #10 and #11 conducted with a pressure depletion rate of 0.65 kPa/min at different temperatures (i.e., 348.15 K for Test #10 and 288.15 K for Test #11), the number of entrained and released gas bubbles at each time step are depicted in Figure 9b. The experimental durations were longer compared to the previous tests since the pressure depletion rate was relatively small for these two tests. As presented in Figure 9b, the trend of entrained gas bubble number change is similar to those of Tests #7 and #8. In this case, the viscous force has an obvious effect on both gas nucleation and binary coalescence, while gas bubble mobilization is also affected by the oil viscosity (see Equation (18)). The rising velocity of gas bubbles is reduced with a higher heavy oil viscosity. As presented in Table 5 and Figure 9b, the number of released gas bubbles for Test #11 is estimated to be around 25 times less than that of Test #10.
Tests #12 and #13 were conducted at the same temperature of 294.15 K and pressure depletion rate of 20 kPa/min with different solvent concentrations (i.e., 20.51 mol% CH4 for Test #12 and 40.38 mol% CH4 for Test #13). The entrained and released gas bubble number is illustrated in Figure 9c. Similarly, the trend of the entrained CH4 bubbles for Test #13 with a higher solvent concentration also turns flat during the late period of the experiment (i.e., Figure 9c), due to the higher pressure applied in the test. It is also revealed in the number of released gas bubbles that a larger free gas phase was formed with more released gas bubbles for Test #12, which was conducted at a lower pressure, as illustrated in Figure 9c.
4.4. Gas Bubble Radius
Table 5 summarizes gas bubble growth rate and gas bubble radius for each test. For CO2-heavy oil systems, the difference between the initial gas bubble radii at different temperatures and pressure depletion rates is relatively small. During an experiment, pressure continuously decreases so the gas bubbles are expanded gradually. For a newly nucleated bubble, its minimum radius increases with time as tabulated in Table 5. Despite gas bubble expansion due to the reduced pressure, binary coalescence leads to the generation of larger gas bubbles. Compared the maximum gas bubble radius at end of each test, the effect of temperature on binary coalescence is found to be more obvious than that of the pressure depletion rate, which tends to prevent gas bubble mobilization and coalescence, becoming weaker at a higher temperature [14]. Therefore, a stronger binary coalescence of gas bubbles occurs at a higher temperature to form gas bubbles with a larger size.
For CH4-heavy oil systems, the effect of pressure depletion rate on the bubble size is more obvious since the difference between the depletion rates is relatively large (i.e., 15.00 kPa/min and 0.65 kPa/min). The gas bubble size increased with the pressure depletion rate mainly due to supersaturation [55]. At the end of the CCE tests for a CH4-heavy oil system, the maximum gas bubble size is found to be larger at a higher temperature that is similar to that of a CO2-heavy oil system.
In addition to temperature and pressure depletion rate, mass transfer rate is considered as another important factor that affects gas bubble growth rate. In this work, it is assumed that molecular diffusion is the only mechanism for gas exsolution from the oil phase due to the concentration difference in solvent between the gas bubbles and the oil phase. Previously, it was reported that the diffusivity of CO2/CH4 increases with temperature [7,47]. As such, more gas molecules transferred from the oil phase to the gas bubbles, leading to the fact that the gas bubble size is larger at a higher experimental temperature and continuously increases during the experiments.
4.5. Gas Bubble Distribution
Figure 10 and Figure 11 represent two groups of typical gas bubble distribution along the oil phase for CO2-heavy oil systems (i.e., Test #3 at a temperature of 333.15 K with a pressure depletion rate of 10.00 kPa/min) and CH4-heavy oil systems (i.e., Test #9 at temperature of 348.15 K with a pressure depletion rate of 0.65 kPa/min) at different times, respectively. As observed in these two figures for both solvent-heavy oil systems, there exists a growth in the number of dispersed gas bubbles in the heavy oil. Also, the gas bubble radius increases with time as gas molecules transfer from the oil phase to gas bubbles continuously. Comparing the gas bubble distribution in the heavy oil for the two systems, it can be concluded that more gas bubbles are trapped and dispersed for the CH4-heavy oil systems, indicating the difficulty of liberation of the CH4 bubbles from the oil phase after its bubbles are nucleated [75]. In this case, CH4 has a superior capability over CO2 in terms of introducing a more stable foamy oil. In addition to the number of gas bubbles dispersed in the oil phase, the radius of CO2 bubbles is larger than that of CH4 bubbles. This is because CO2 diffuses faster than CH4 (i.e., diffusion coefficient of 7.61 × 10⁻⁹ m2/s for CO2 in Test #3 and 7.58 × 10⁻¹⁰ m2/s for CH4 in Test #9). Furthermore, as illustrated in Figure 11b,c, during the later period for the CH4-heavy oil system, more intermediate gas bubbles were formed through binary coalescence and dispersed in the heavy oil. This is attributed to the quantity of tiny CH4 bubbles that has accumulated in the oil phase due to the difficulty of releasing CH4 bubbles, which stimulates the binary coalescence of small bubbles in forming new gas bubbles of larger radii.
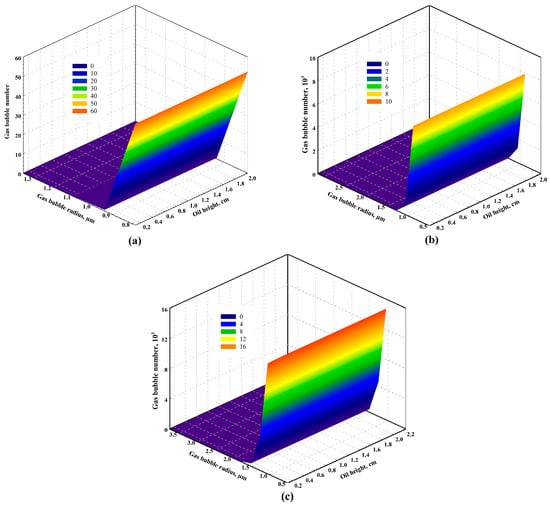
Figure 10.
Calculated gas bubble distribution in the CO2-heavy oil system at (a) t = 2 min, (b) t = 32 min, and (c) the end of the experiment for Test #4 conducted at a temperature pf 333.15 K with a pressure depletion rate of 10 kPa/min.
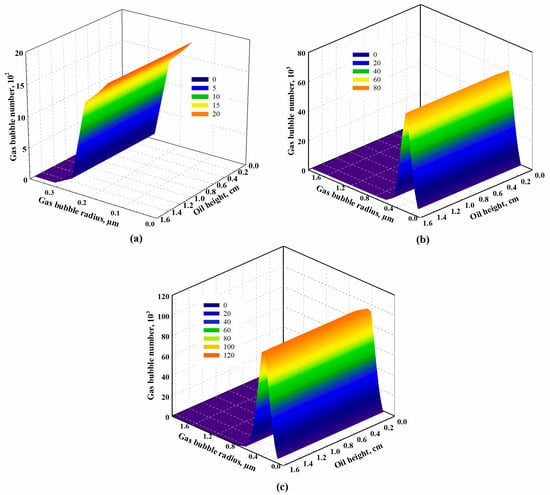
Figure 11.
Calculated gas bubble distribution in the CH4-heavy oil system at (a) t = 30 min, (b) t = 1000 min, and (c) the end of the experiment for Test #10 conducted at a temperature of 348.15 K with a pressure depletion rate of 0.65 kPa/min.
5. Conclusions
In addition to providing new experimental measurements, in this work, we developed a unified, consistent, and robust framework to quantify the exsolution dynamics of a gaseous solvent from a saturated heavy oil phase. Such a robust and pragmatic technique can be seamlessly integrated with any reservoir simulators to accurately characterize foamy oil behaviour at the bubble level and evaluate oil recovery in a hydrocarbon reservoir.
Experimentally, a sealed and isolated PVT system has been employed to conduct CCE tests for gas-heavy oil systems at a constant temperature and various pressure depletion rates. The pseudo-bubblepoint pressures of the solvent-heavy oil systems have been measured, while the dynamic volume change has been monitored and recorded for each experiment. Theoretically, gas bubble nucleation and growth rate have been determined for the first time by combining the classical nucleation theory and the PBEs, considering bubble mobilization and binary coalescence. By minimizing the deviations between the calculated pseudo-bubblepoint pressure and dynamic volume change and the measured ones, gas bubble number and bubble size can be determined with the PBEs. Bubble number and bubble size calculated as such can quantitatively reflect the foamy oil behaviour for a given solvent-heavy oil/bitumen system, allowing us to have better understanding of the foamy oil behaviour.
It has been found that temperature and mass transfer have a great effect on both the growth rate and size of gas bubbles. At a lower temperature, more gas bubbles tend to be trapped and dispersed in heavy oil due to a higher viscosity, resulting in a more obvious foamy oil behaviour. For both CO2- and CH4-heavy oil systems with a higher solvent concentration, a higher initial pressure is set for the experiment which hinders bubble nucleation and mitigation. Not only is gas bubble radius found to be larger with an increasing pressure depletion rate due to supersaturation, but it also increases with temperature due to more gas molecules transferring to gas bubbles from the oil phase. Compared with that of CO2, the number of CH4 bubbles dispersed in heavy oil is greater, which induces stronger and more stable foamy oil. Using the newly proposed α function redefined at Tr = 0.6 leads to a smaller AARD of 2.24% compared to 4.58% obtained from the modified alpha function at Tr = 0.7.
Author Contributions
Conceptualization, D.Y.; Methodology, X.D., D.Y. and Z.Z.; Validation, X.D.; Formal analysis, X.D., D.Y. and Z.Z.; Investigation, X.D., D.Y. and Z.Z.; Resources, X.D. and D.Y.; Data curation, X.D. and Z.Z.; Writing—original draft, X.D.; Writing—review & editing, D.Y.; Visualization, X.D.; Supervision, D.Y.; Project administration, D.Y.; Funding acquisition, D.Y. All authors have read and agreed to the published version of the manuscript.
Funding
This research was funded by the Discovery Development Grant, Discovery Grant, and Collaborative Research and Development (CRD) Grant from the Natural Sciences and Engineering Research Council of Canada (NSERC) as well as the Innovation Fund from the EHR Enhanced Hydrocarbon Recovery Inc. and Thermal Recovery Technologies Inc.
Data Availability Statement
The original contributions presented in this study are included in the article. Further inquiries can be directed to the corresponding author.
Conflicts of Interest
The authors declare no conflict of interest.
Nomenclature
| Notations | |
| A | Kinetic parameter, m−3s−1 |
| B | Thermodynamic parameter, Pa2 |
| Molar concentration of the gas component in the gas phase, mol/cm3 | |
| Molar concentration of the gas component in the liquid phase, mol/cm3 | |
| Oil compressibility, kPa−1 | |
| D | Molecular diffusion coefficient in the crude oil, m2/s |
| Db | Diffusion coefficient of the gas bubble, m2/s |
| g | Gravitational acceleration, m/s2 |
| ΔG | Gibbs free energy change in the nucleation process, J |
| J | Bubble nucleation rate, number/min |
| k | Boltzmann constant, 1.38 × 10⁻²³ J/K |
| Collision frequency | |
| M | Molecular weight, g/mol |
| n | Number density of gas bubbles, number/cm3 |
| N | Number density of points |
| p | Experimental pressure, kPa |
| Critical pressure, kPa | |
| Liquid pressure, kPa | |
| Vapour pressure, kPa | |
| Pressure difference between the experimental and atmospheric pressure, kPa | |
| q | Adjustable geometric size interval |
| Gas bubble radius at the ith internal and initial time, m | |
| Gas bubble radius at the ith interval and time t, cm | |
| PVT cell radius, m | |
| R | Universal gas constant, 8.3145 J/(K·mol) |
| S | Surface area per unit volume, m−1 |
| T | Temperature, K |
| Critical temperature, K | |
| Reduced temperature, dimensionless | |
| u | Gas bubble rising velocity, cm/min |
| Calculated liquid volume, cm3 | |
| Measured liquid volume, cm3 | |
| Oil volume, cm3 | |
| V | Molar volume, m3/mol |
| z | Liquid column height in the PVT cell, cm |
| Gas compressibility factor at time t, kPa−1 | |
| Greek symbols | |
| Viscosibility factor for the ith component in the oil phase | |
| Viscosibility factor for the heavy oil sample | |
| Alpha function in the PR EOS | |
| BIP between the ith and jth component | |
| Binary coalescence frequency | |
| Contribution function | |
| Correction factor for the surface effect | |
| Heavy oil viscosity, cP | |
| Heavy oil viscosity at atmospheric pressure and temperature T, cP | |
| Gas density, g/cm3 | |
| Liquid density, g/cm3 | |
| Interfacial tension between the gas bubble and heavy oil, dyne/cm | |
| Acentric factor | |
| Acronyms | |
| AARD | Average absolute relative deviation |
| BIP | Binary interaction parameter |
| CCE | Constant composition expansion |
| IN | Instantaneous nucleation |
| PBE | Population balance equation |
| PC | Pseudocomponent |
| PN | Progressive nucleation |
| PR EOS | Peng–Robinson equation of state |
| PVT | Pressure–volume–temperature |
References
- Huerta, M.; Otero, C.; Rico, A.; Jimenez, I.; de Mirabal, M.; Rojas, G. Understanding foamy oil mechanisms for heavy oil reservoirs during primary production, paper SPE-36749-MS. In Proceedings of the SPE Annual Technical Conference and Exhibition, Denver, CO, USA, 6–9 October 1996. [Google Scholar]
- Sheng, J.J. Foamy Oil Flow in Porous Media. Ph.D. Dissertation, University of Alberta, Edmonton, AB, Canada, 1997. [Google Scholar]
- Raupov, I.; Rogachev, M.; Sytnik, J. Overview of modern methods and technologies for the well production of high- and extra-high-viscous oil. Energies 2025, 18, 1498. [Google Scholar] [CrossRef]
- Maini, B.B.; Busahmin, B. Foamy oil flow and its role in heavy oil production. AIP Conf. Proc. 2010, 1254, 103–108. [Google Scholar]
- Jamaloei, B.Y.; Dong, M.; Yang, P.; Yang, D.; Mahinpey, N. Impact of solvent type and injection sequence on enhanced cyclic solvent process (ECSP) for thin heavy oil reservoirs. J. Pet. Sci. Eng. 2013, 110, 169–183. [Google Scholar] [CrossRef]
- Busahmin, B.; Maini, B.; Karri, R.R.; Sabet, M. Studies on the stability of the foamy oil in developing heavy oil reservoirs. Defect Diffus. Forum 2016, 371, 111–116. [Google Scholar] [CrossRef]
- Shi, Y.; Zhao, W.; Li, S.; Yang, D. Quantification of gas exsolution and preferential diffusion for alkane solvent(s)–CO2–heavy oil systems under nonequilibrium conditions. J. Pet. Sci. Eng. 2022, 208, 109283. [Google Scholar] [CrossRef]
- Bora, R. Cold Production of Heavy Oil: An Experimental Investigation of Foamy Oil Flow in Porous Media. Ph.D. Dissertation, University of Calgary, Calgary, AB, Canada, 1998. [Google Scholar]
- Sahni, A.; Gadelle, F.; Kumar, M.; Kovscek, A.R.; Tomutsa, L. Experiments and analysis of heavy oil solution gas drive. Paper SPE-71498-MS. In Proceedings of the SPE Annual Technical Conference, New Orleans, LA, USA, 30 September–3 October 2001. [Google Scholar]
- Meakh, S.; Sugai, Y.; Esaki, T.; Tambaria, T.N. Experimental study on the expansion of foamy bitumen for CO2 huff-n-puff process. Unconv. Resour. 2026, 9, 100265. [Google Scholar] [CrossRef]
- Kumar, R.; Pooladi-Darvish, M.O. Effect of viscosity and diffusion coefficient on the kinetics of bubble growth in solution-gas drive in heavy oil. J. Can. Pet. Technol. 2001, 40, 30–37. [Google Scholar] [CrossRef]
- Li, X.; Shi, X.; Wu, Y.; Chen, H.; Sun, X. Flow visualization of foamy oil recreation process for extra heavy oil recovery using glass micromodel. In Proceedings of the International Field Exploration and Development Conference 2021, Qingdao, China, 20–22 October 2021; Lin, J., Ed.; Springer Nature: Singapore, 2021; pp. 2740–2749. [Google Scholar]
- Firoozabadi, A.; Ottesen, B.; Mikkelsen, M. Measurements of supersaturation and critical gas saturation. SPE Form. Eval. 1992, 7, 337–344. [Google Scholar] [CrossRef]
- Sheng, J.J.; Maini, B.B.; Hayes, R.E.; Tortike, W.S. Critical review of foamy oil flow. Transp. Porous Media 1999, 35, 157–187. [Google Scholar] [CrossRef]
- Arefmanesh, A.; Advani, S.G.; Michaelides, E.E. An accurate numerical solution for mass diffusion-induced bubble growth in viscous liquids containing limited dissolved gas. Int. J. Heat Mass Transf. 1992, 35, 1711–1722. [Google Scholar] [CrossRef]
- Satik, C.; Li, X.; Yortsos, Y.C. Scaling of single-bubble growth in a porous medium. Phys. Rev. E 1995, 51, 3286. [Google Scholar] [CrossRef]
- Li, X.; Yortsos, Y.C. Theory of multiple bubble growth in porous media by solute diffusion. Chem. Eng. Sci. 1995, 50, 1247–1271. [Google Scholar] [CrossRef]
- Oskouei, S.J.P.; Zadeh, A.B.; Gates, I.D. A new kinetic model for non-equilibrium dissolved gas ex-solution from static heavy oil. Fuel 2017, 204, 12–22. [Google Scholar] [CrossRef]
- Zhao, Z.; Shi, Y.; Yang, D.; Jia, N. Quantification of gas exsolution of alkane solvents-CO2 mixture in heavy oil with consideration of individual interfacial resistance under nonequilibrium conditions. J. Pet. Sci. Eng. 2019, 180, 1112–1123. [Google Scholar] [CrossRef]
- Kamath, J.; Boyer, R.E. Critical gas saturation and supersaturation in low-permeability rocks. SPE Form. Eval. 1995, 10, 247–253. [Google Scholar] [CrossRef]
- Lillico, D.A.; Babchin, A.J.; Jossy, W.E.; Sawatzky, R.P.; Yuan, J.Y. Gas bubble nucleation kinetics in a live heavy oil. Colloids Surf. A Physicochem. Eng. Asp. 2001, 192, 25–38. [Google Scholar] [CrossRef]
- Bora, R.; Maini, B.B.; Chakma, A. Flow visualization studies of solution gas drive process in heavy oil reservoirs with a glass micromodel. SPE Reserv. Eval. Eng. 2000, 3, 224–229. [Google Scholar] [CrossRef]
- Sun, X.; Zhang, Y.; Gai, Z.; Zhao, H.; Chen, G.; Song, Z. Comprehensive experimental study of the interfacial stability of foamy oil and identification of the characteristic responsible for foamy oil formation. Fuel 2019, 238, 514–525. [Google Scholar] [CrossRef]
- Chu, P.; Finch, J.; Bournival, G.; Ata, S.; Hamlett, C.; Pugh, R.J. A review of bubble break-up. Adv. Colloid Interface Sci. 2019, 270, 108–122. [Google Scholar] [CrossRef]
- Vehkamäki, H. Classical Nucleation Theory in Multicomponent Systems; Springer Science & Business Media: Berlin/Heidelberg, Germany, 2006. [Google Scholar]
- Kalikmanov, V.I. Classical nucleation theory. In Nucleation Theory; Springer Science & Business Media: Dordrecht, The Netherlands, 2013; pp. 17–41. [Google Scholar]
- Du, C.; Yortsos, Y.C. A numerical study of the critical gas saturation in a porous medium. Transp. Porous Media 1999, 35, 205–225. [Google Scholar] [CrossRef]
- Patzek, T.W. Description of foam flow in porous media by the population balance approach. In Surfactant-Based Mobility Control (ACS Symposium Series); American Chemical Society: Washington, DC, USA, 1988; Volume 373, pp. 326–341. [Google Scholar]
- Kam, S.I.; Nguyen, Q.P.; Li, Q.; Rossen, W.R. Dynamic simulations with an improved model for foam generation. Paper SPE 90938. In Proceedings of the SPE Annual Technical Conference and Exhibition, Houston, TX, USA, 26–29 September 2004. [Google Scholar]
- Cunha, R.E.P.; Fortuny, M.; Dariva, C.; Santos, A.F. Mathematical modeling of the destabilization of crude oil emulsions using population balance equation. Ind. Eng. Chem. Res. 2008, 47, 7094–7103. [Google Scholar] [CrossRef]
- Lotfollahi, M.; Farajzadeh, R.; Delshad, M.; Varavei, A.; Rossen, W.R. Comparison of implicit-texture and population-balance foam models. Paper SPE-179808-MS. In Proceedings of the SPE EOR Conference at Oil and Gas West Asia, Muscat, Oman, 21–23 March 2016. [Google Scholar]
- Dong, X. Quantification of Dissolution and Exsolution Dynamics of Gaseous Solvents-Crude Oil Systems Under Reservoir Conditions. Ph.D. Dissertation, University of Regina, Regina, SK, Canada, 2024. [Google Scholar]
- Li, H.; Zheng, S.; Yang, D. Enhanced swelling effect and viscosity reduction of solvent(s)/CO2/heavy-oil systems. SPE J. 2013, 18, 695–707. [Google Scholar] [CrossRef]
- Dong, X.; Shi, Y.; Yang, D. Quantification of mutual mass transfer of CO2/N2-light oil systems under reservoir conditions. Ind. Chem. Eng. Res. 2018, 57, 16495–16507. [Google Scholar] [CrossRef]
- Dong, X.; Xi, Z.; Badamchi Zadeh, A.; Jia, N.; Gates, I.D. A novel experimental method CCEC and modelling of methane dissolution and exsolution in heavy oil. Paper SPE-199942-MS. In Proceedings of the SPE Canada Heavy Oil Conference, Virtual, 29 September–1 October 2020. [Google Scholar]
- Dong, X.; Shi, Y.; Huang, D.; Yang, D. Quantification of preferential and mutual mass transfer of gases-light oil systems at high pressures and elevated temperatures by dynamic volume analysis. Int. J. Heat Mass Transf. 2022, 195, 123188. [Google Scholar] [CrossRef]
- Dong, X.; Li, Y.; Li, S.; Yang, D. Determination of mutual diffusivity of CO2/C3H8-Heavy oil systems with consideration of natural convection under reservoir conditions. Fuel 2023, 341, 127562. [Google Scholar] [CrossRef]
- Yao, J.; Zou, W.; Gu, Y. Solvent effects on the measured bubble-point pressures and pseudo bubble-point pressures of different heavy crude oil-solvent systems. Petroleum 2022, 8, 577–586. [Google Scholar] [CrossRef]
- Ma, H.; Huang, D.; Yu, G.; She, Y.; Gu, Y. Combined cyclic solvent injection and waterflooding in the post-cold heavy oil production with sand reservoirs. Energy Fuels 2017, 31, 418–428. [Google Scholar] [CrossRef]
- Dong, X.; Zhao, Z.; Yang, D.; Jia, N. Quantification of gas exsolution dynamics for CO2/CH4-heavy oil systems with population balance equations. Paper SPE-218070-MS. In Proceedings of the SPE Canadian Energy Technology Conference and Exhibition, Calgary, AB, Canada, 13–14 March 2024. [Google Scholar]
- Kashchiev, D.; Firoozabadi, A. Kinetics of the initial stage of isothermal gas phase formation. J. Chem. Phys. 1993, 98, 4690–4699. [Google Scholar] [CrossRef]
- Moulu, J.C. Solution-gas drive: Experiments and simulation. J. Pet. Sci. Eng. 1989, 2, 379–386. [Google Scholar] [CrossRef]
- Blander, M.; Katz, J.L. Bubble nucleation in liquids. AIChE J. 1975, 21, 833–848. [Google Scholar] [CrossRef]
- Kumar, S.; Ramkrishna, D. On the solution of population balance equations by discretization-I. A fixed pivot technique. Chem. Eng. Sci. 1996, 51, 1311–1332. [Google Scholar] [CrossRef]
- Epstein, P.S.; Plesset, M.S. On the stability of gas bubbles in liquid-gas solutions. J. Chem. Phys. 1950, 18, 1505–1509. [Google Scholar] [CrossRef]
- Jang, H.W.; Yang, D.; Li, H. A power-law mixing rule for predicting apparent diffusion coefficients of binary gas mixtures in heavy oil. J. Energy Resour. Technol. 2018, 140, 052904. [Google Scholar] [CrossRef]
- Upreti, S.R.; Mehrotra, A.K. Diffusivity of CO2, CH4, C2H6 and N2 in Athabasca bitumen. Can. J. Chem. Eng. 2002, 80, 116–125. [Google Scholar] [CrossRef]
- Shi, Y.; Zheng, S.; Yang, D. Determination of individual diffusion coefficients of alkane solvent(s)–CO2–heavy oil systems with consideration of natural convection induced by swelling effect. Int. J. Heat Mass Transf. 2017, 107, 572–585. [Google Scholar] [CrossRef]
- Yarranton, H.; van Dorp, J.; Verlaan, M.; Lastovka, V. Wanted dead or live: Crude-cocktail viscosity-A pseudocomponent method to predict the viscosity of dead oils, live oils, and mixtures. J. Can. Pet. Technol. 2013, 52, 176–191. [Google Scholar] [CrossRef]
- Attarakih, M.M.; Bart, H.J.; Faqir, N.M. Numerical solution of the spatially distributed population balance equation describing the hydrodynamics of interacting liquid–liquid dispersions. Chem. Eng. Sci. 2004, 59, 2567–2592. [Google Scholar] [CrossRef]
- Ramkrishna, D. Population Balances: Theory and Applications to Particulate Systems in Engineering; Academic Press: San Diego, CA, USA, 2000. [Google Scholar]
- Grimes, B.A. Population balance model for batch gravity separation of crude oil and water emulsions. Part I: Model formulation. J. Dispers. Sci. Technol. 2012, 33, 578–590. [Google Scholar] [CrossRef]
- Park, S.H.; Park, C.; Lee, J.; Lee, B. A simple parameterization for the rising velocity of bubbles in a liquid pool. Nucl. Eng. Technol. 2017, 49, 692–699. [Google Scholar] [CrossRef]
- Tharanivasan, A.K.; Yang, C.; Gu, Y. Comparison of three different interface mass transfer models used in the experimental measurement of solvent diffusivity in heavy oil. J. Pet. Sci. Eng. 2004, 44, 269–282. [Google Scholar] [CrossRef]
- Shi, Y.; Yang, D. Quantification of a single gas bubble growth in solvent(s)-CO2-heavy oil systems with consideration of multicomponent diffusion under nonequilibrium conditions. J. Energy Resour. Technol. 2017, 139, 022908. [Google Scholar] [CrossRef]
- Peng, D.Y.; Robinson, D.B. A new two-constant equation of state. Ind. Eng. Chem. Fundam. 1976, 15, 59–64. [Google Scholar] [CrossRef]
- Li, H.; Yang, D. Modified α function for the Peng−Robinson equation of state to improve the vapor pressure prediction of non-hydrocarbon and hydrocarbon compounds. Energy Fuels 2011, 25, 215–223. [Google Scholar] [CrossRef]
- Dong, X.; Lu, Y.; Li, Y.; Yang, D. Quantification of mutual mass transfer coupled with heat transfer for CO2/C3H8-heavy oil systems under reservoir conditions. SPE J. 2025, 30, 1432–1448. [Google Scholar] [CrossRef]
- Chen, Z.; Yang, D. Optimization of the reduced temperature associated with Peng–Robinson equation of state and Soave–Redlich–Kwong equation of state to improve vapor pressure prediction for heavy hydrocarbon compounds. J. Chem. Eng. Data 2017, 62, 3488–3500. [Google Scholar] [CrossRef]
- Atonge, E.A.; Yang, D. Comparative evaluation of α functions for Soave-Redlich-Kwong equation of state (EOS) and Peng-Robinson EOS to predict saturation pressures for gas(es)-heavy oil/bitumen-water systems. SPE Reserv. Eval. Eng. 2023, 26, 1323–1343. [Google Scholar] [CrossRef]
- Atonge, E.A.; Yang, D. Comparative evaluation of α functions and volume-translation strategies to predict densities for gas(es)-heavy oil/bitumen systems. SPE J. 2024, 29, 1635–1654. [Google Scholar] [CrossRef]
- Chen, Z.; Yang, D. Quantification of phase behaviour of solvents-heavy oil/bitumen systems in the presence of water at high pressures and elevated temperatures. Fuel 2018, 232, 803–816. [Google Scholar] [CrossRef]
- Chueh, P.L.; Prausnitz, J.M. Vapor-liquid equilibria at high pressures: Calculation of partial molar volumes in nonpolar liquid mixtures. AIChE J. 1967, 13, 1099–1107. [Google Scholar] [CrossRef]
- Li, X.; Li, H.; Yang, D. Determination of multiphase boundaries and swelling factors of solvent(s)–CO2–heavy oil systems at high pressures and elevated temperatures. Energy Fuels 2013, 27, 1293–1306. [Google Scholar] [CrossRef]
- Guo, C.; Huang, L.; Tian, K. Combinatorial optimization for UAV swarm path planning and task assignment in multi-obstacle battlefield environments. Appl. Soft Comput. J. 2025, 171, 112773. [Google Scholar] [CrossRef]
- Lu, Y.; Zhang, M.; Chen, Y.; Ju, J.; Chen, F.; Bai, K.; Wang, X. A newly developed multi-strategy optimization algorithm framework based on the adaptive switching approach coupled with grey wolf optimizer. Knowl. Inf. Syst. 2025, 67, 5571–5617. [Google Scholar] [CrossRef]
- Whitson, C.H.; Brulé, M.R. Phase Behavior; Society of Petroleum Engineers: Richardson, TX, USA, 2000. [Google Scholar]
- Modaresghazani, J.; Moore, R.G.; Mehta, S.A.; Anderson, M.; Badamchi-Zadeh, A. A novel method (CCE&C) to study transient phase behaviour in heavy oil and ethane. Fuel 2019, 257, 115946. [Google Scholar] [CrossRef]
- Zhang, Y.; Yuan, L.; Liu, S.; Zhang, J.; Yang, M.; Song, Y. Molecular dynamics simulation of bubble nucleation and growth during CO2 huff-n-puff process in a CO2-heavy oil system. Geoenergy Sci. Eng. 2023, 227, 211852. [Google Scholar] [CrossRef]
- Kumar, R.; Pooladi-Darvish, M.; Okazawa, T. Effect of depletion rate on gas mobility and solution gas drive in heavy oil. SPE J. 2002, 7, 213–220. [Google Scholar] [CrossRef]
- Sheng, F.; Zhang, J.; Sun, G.; Li, C.; Yang, F.; Yao, B.; Jiang, X.; Zhou, Y. Effects of pressure and depressurization rate of dissolved CO2 on the foaming characteristics of crude oil. Energy Fuels 2023, 37, 6479–6489. [Google Scholar] [CrossRef]
- Wang, J.; Yuan, Y.; Zhang, L.; Wang, R. The influence of viscosity on stability of foamy oil in the process of heavy oil solution gas drive. J. Pet. Sci. Eng. 2009, 66, 69–74. [Google Scholar] [CrossRef]
- Qiu, C.; Zhang, H. Effects of system pressure and heat flux on bubble nucleation and growth. Chin. J. Mech. Eng. 2015, 28, 964–970. [Google Scholar] [CrossRef]
- Yang, G.; Guo, K.; Wang, T. Numerical simulation of the bubble column at elevated pressure with a CFD-PBM coupled model. Chem. Eng. Sci. 2017, 170, 251–262. [Google Scholar] [CrossRef]
- Yao, J.; Zou, W.; Gu, Y. Experimental and theoretical studies of solvent bubble nucleation and liberation processes in different heavy crude oil-solvent systems. J. Pet. Sci. Eng. 2022, 217, 110949. [Google Scholar] [CrossRef]
Disclaimer/Publisher’s Note: The statements, opinions and data contained in all publications are solely those of the individual author(s) and contributor(s) and not of MDPI and/or the editor(s). MDPI and/or the editor(s) disclaim responsibility for any injury to people or property resulting from any ideas, methods, instructions or products referred to in the content. |
© 2025 by the authors. Licensee MDPI, Basel, Switzerland. This article is an open access article distributed under the terms and conditions of the Creative Commons Attribution (CC BY) license (https://creativecommons.org/licenses/by/4.0/).