Article

Experimental Investigation of Equivalent Friction Coefficient Between Rope–Drum Mechanism and Pulley Transmission Loss for High-Altitude Wind Power Generation Systems

School of Mechanotronics & Vehicle Engineering, Chongqing Jiaotong University, No. 66 Xuefu Street, Nan’an District, Chongqing 400074, China
*
Author to whom correspondence should be addressed.
Energies 2025, 18(23), 6079; https://doi.org/10.3390/en18236079 (registering DOI)
Submission received: 21 October 2025 / Revised: 13 November 2025 / Accepted: 18 November 2025 / Published: 21 November 2025
(This article belongs to the Section A3: Wind, Wave and Tidal Energy)

Abstract

This paper presents the design and experimental investigation of a multifunctional friction test bench, aiming to characterize the frictional and transmission efficiency of rope–drum systems in high-altitude wind power generation. The study addresses a critical gap in the experimental validation of key components for this demanding application. The test bench, comprising loading, power, test, and data acquisition modules, was designed to measure the equivalent friction coefficient (a comprehensive macro-parameter, not the traditional material friction coefficient) between an ultra-high-molecular-weight polyethylene (UHMWPE) fiber rope and a drum, as well as the transmission efficiency of pulleys. Key parameters, including contact angle, gasket material (steel vs. polyamide (PA)), groove type (U vs. V), and rotational speed, were systematically tested using tension and speed and torque sensors for data acquisition. Experimental results show that the equivalent friction coefficient initially increased and then decreased with the contact angle, reaching a maximum of approximately 0.15 at 100°. The coefficient was positively correlated with rotational speed, increasing by about 40% for steel and 10% for PA linings as speed rose from 25 to 100 rpm. Steel linings exhibited a significantly higher equivalent friction coefficient (0.14–0.17) than PA linings (0.10–0.13). Similarly, in transmission tests, steel pulleys demonstrated superior efficiency compared to PA pulleys, while V-grooves slightly reduced efficiency compared to U-grooves. Furthermore, pulley misalignment was found to decrease transmission efficiency. This work provides essential experimental data and a robust testing platform, laying a foundation for optimizing the efficiency and reliability of high-altitude wind energy systems.

1. Introduction

High-altitude wind energy is a kind of renewable and clean energy with abundant reserves and wide distribution. Compared with offshore and onshore wind energy, it has great potential for energy development and utilization because of the advantages of high power density and stable wind direction [1]. The key to the effective utilization of high-altitude wind energy is the wind power generation system. Its main principle is that the tethered vehicle is used to capture high-altitude wind energy, and the kinetic energy of the wind is converted into mechanical energy, and then it is converted into electrical energy according to the ground power generation device [2,3,4].
As shown in Figure 1, the rope, as the key transmission component, not only establishes the connection between the aerial ladder components and the ground power generation device, but also plays an important role in energy transfer. The friction and wear characteristics of the rope directly affect the transmission efficiency of the power generation device. Studies concerning the function and transmission characteristics of the ropes have been carried out.
Chen et al. [5] investigated the mechanical behavior of large-diameter ultra-high-molecular-weight polyethylene fiber ropes under quasi-static tension using a uniaxial tensile testing system, and proposed a pre-tensioning treatment process to improve stress uniformity. Ye et al. [6,7] systematically investigated the mechanical behavior of high-modulus polyethylene (HMPE) ocean loading and unloading ropes and revealed that the improved size-stable rope had a better load capacity compared to coreless ropes. Xu et al. [8] studied the nonlinear mechanical properties of nylon, polyester, and high-modulus polyethylene fiber ropes through static tensile and cyclic load tests. Han et al. [9] investigated the relationship between the mechanical properties and structural characteristics of ultra-high-molecular-weight polyethylene (UHMWPE) fiber ropes and established a correlation formula between Young’s modulus and the torsion angle. A positive correlation between fracture strength and diameter was provided. Zhou et al. [10] proposed the use of flexible fiber-reinforced polymer (FRP) twisted ropes to replace traditional steel wire ropes and synthetic ropes. The tensile and bending properties of IFB were optimized through resin-toughening modification. Schumann et al. [11] discussed the power-law friction law by presenting a validated model of a double-layer belt-winding winch. Mao et al. [12] proposed an improved model combining a physical model and a data model to reduce the deviation of the physical model from the actual model. Kim et al. [13] investigated the effects of contact area and friction material on the speed-dependent coefficient of friction and friction instability using brake friction materials as experimental subjects.
Although these theoretical studies and review analyses have laid a significant foundation for understanding the role and general characteristics of the ropes, the accuracy of theoretical models, the reliability of design parameters, and the prediction of service performance still rely on experimental validation and data support. Particularly in the demanding application of high-altitude wind energy, which involves dynamic loads, coupled environmental factors, and key characteristics of the rope materials and structures, the results must be revealed and quantified through systematic experimental research. Many scholars have conducted extensive experimental investigations to thoroughly explore the transmission performance and service behavior.
Li et al. [14] studied the fatigue characteristics of high-modulus polyethylene (HMPE) marine loading and unloading ropes under cyclic bending of pulleys through a full-scale experimental system. Charry et al. [15] proposed an experimental test rig for evaluating the performance of low- and medium-power pulley drive systems, which was utilized to estimate the friction performance in the gearbox. Preliminary results show that the friction in the transmission was mainly determined by the friction characteristics of the bearings. Hrabovský et al. [16,17] designed a laboratory device for detecting the tension in ropes and the coefficient of friction in the grooves of rope pulleys and for determining the magnitude of the force acting on both sides of the cables in the V-grooves of the cable reels. Chang et al. [18,19] studied the tribological behavior of transmission ropes by means of a homemade rope sheave sliding friction and wear test rig, and the results show that the coefficient of friction was affected by the structure of the rope, the contact angle, and the sliding speed. The coefficient of friction decreased with an increase in the sliding speed. Nakazawa et al. [20] derived a tension evaluation model by including the rope slip behavior and then evaluated the effect of rope tension due to groove wear. Zhao et al. [21] proposed an analytical method of a rope-driven multibody system with a pulley. This method could be used to establish the complete dynamic equations of a rope-driven system containing a pulley block and solve them efficiently. Bukvić et al. [22] systematically outlined the production techniques of polymer composites and their application prospects in the engineering field.
The aforementioned studies have contributed to understanding the rope characteristics, transmission properties, and related experimental research, while less investigation specifically targeting rope properties for high-altitude wind energy applications has been carried out. This paper focuses on the rope used in high-altitude wind energy generation systems and explores their fundamental frictional characteristics and transmission loss behavior, employing an experimental method. The structural design and fundamental operating principles of the test bench are introduced in Section 2. The constituent components of the test bench and stress verification are performed in Section 3. Friction coefficient and transmission loss tests are conducted under various conditions. Relevant data analysis and conclusions are obtained in Section 4.

2. Structural Design and Working Principle of Test Bench

2.1. Structural Module Design

As shown in Figure 2, the design framework of the experimental test bench consists of four modules: the loading module, power module, test module, and data acquisition module.
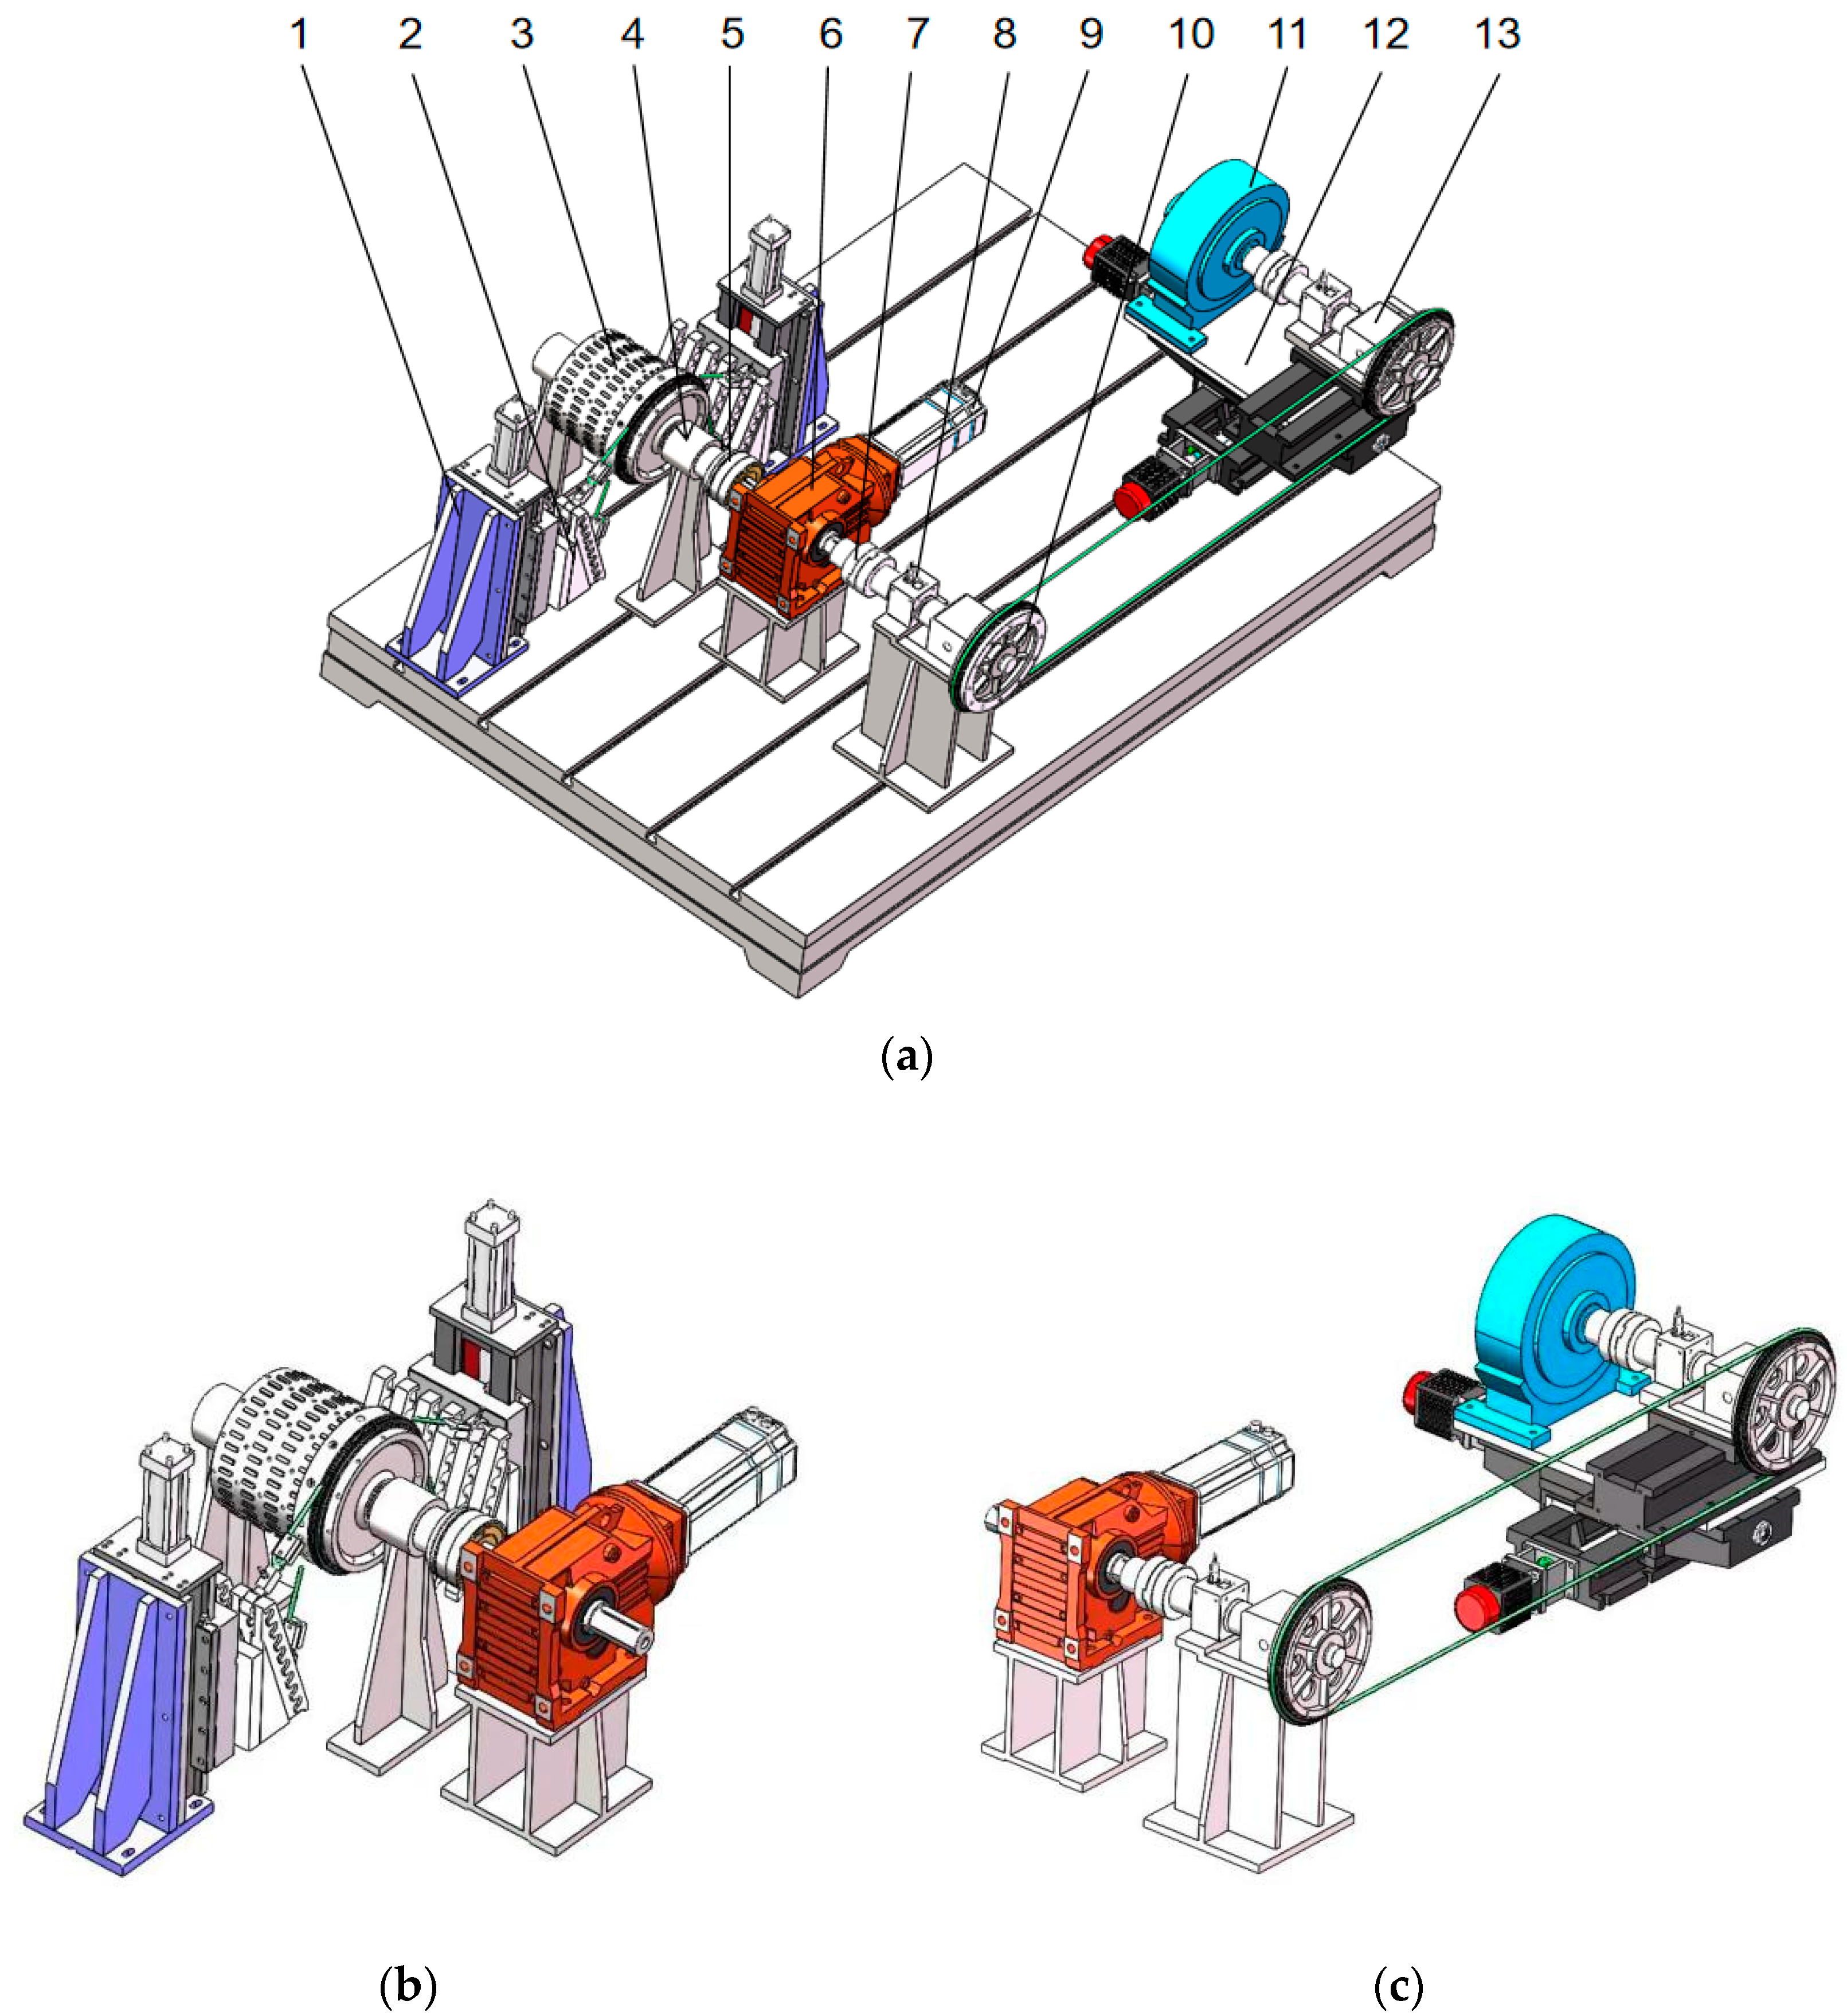
As shown in Figure 3, this is the overall structural diagram of the test bench.
As shown in Table 1, the following table lists the characteristic parameters of the transmission system.
(1)
Loading module
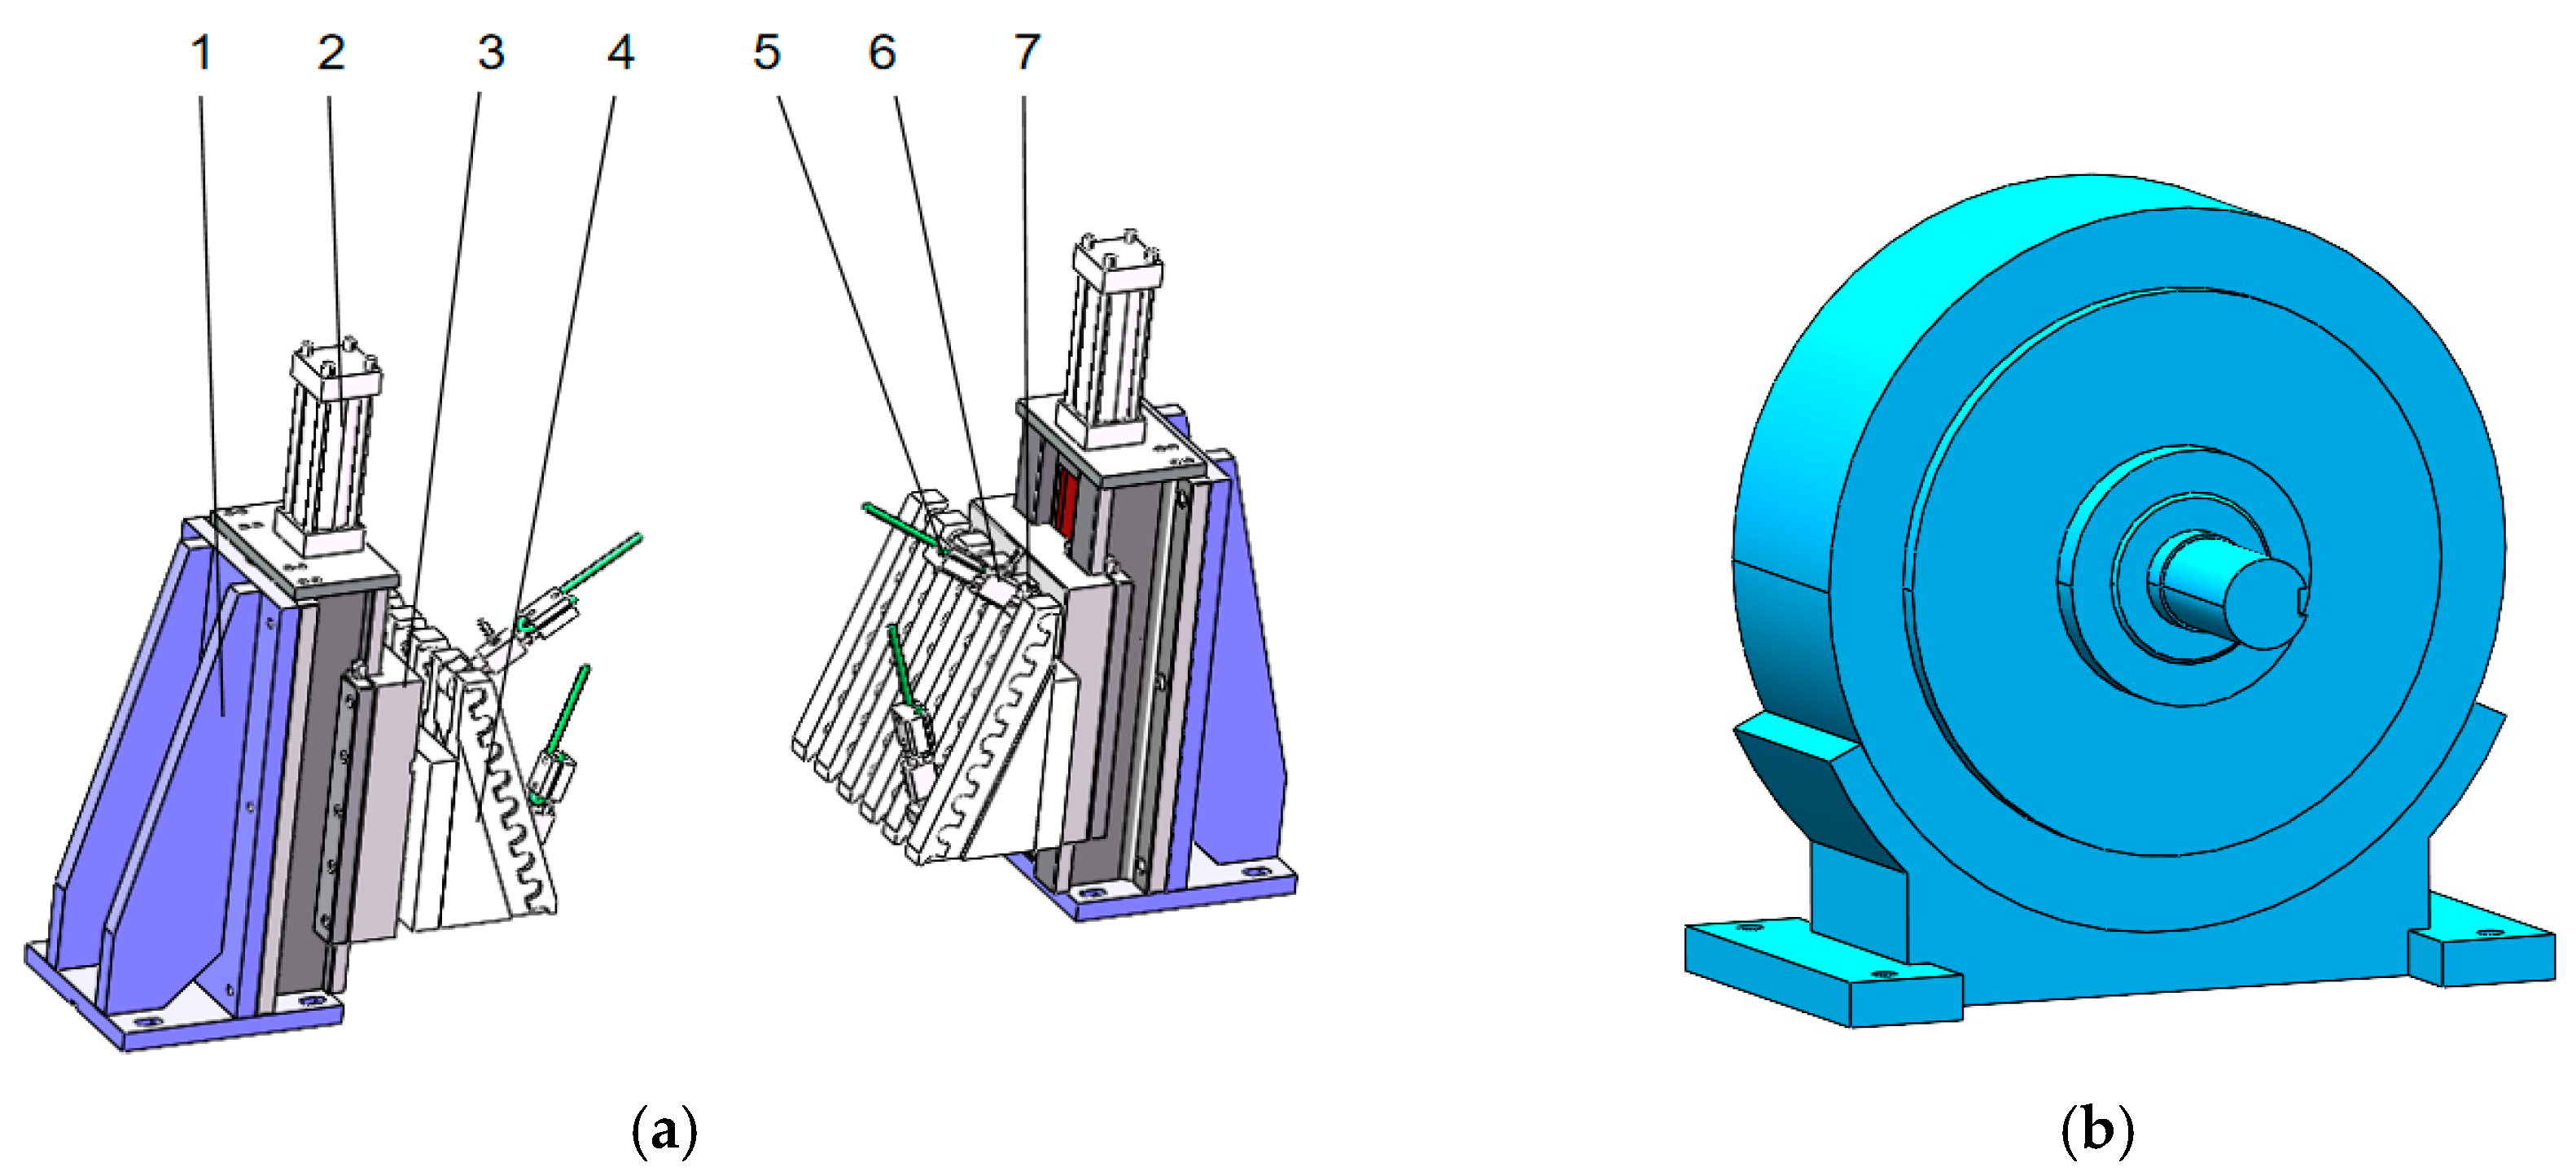
The hydraulic loading system is considered for a fundamental frictional characteristics test. The structure model is established in Figure 4a. The rope is fixed in the pressure block. The pressure block and tension sensor are connected and fixed to the contact angle adjuster through the snap. The vertical up and down movement can be realized by the moving slide. Contact arc length is adjusted by the fixed position of the snap on the contact angle adjuster. The downward pressure provided by the hydraulic loading system is utilized to apply a preset tension to the rope on the reel, which can be measured by triangulating the value of the pressure transducer on the loading device with the known wrap angle. The magnetic particle brake, which is located on the side of the pulley, can be used to apply loads to simulate the loading condition. The magnetic particle brake is shown in Figure 4b.
(2)
Power module
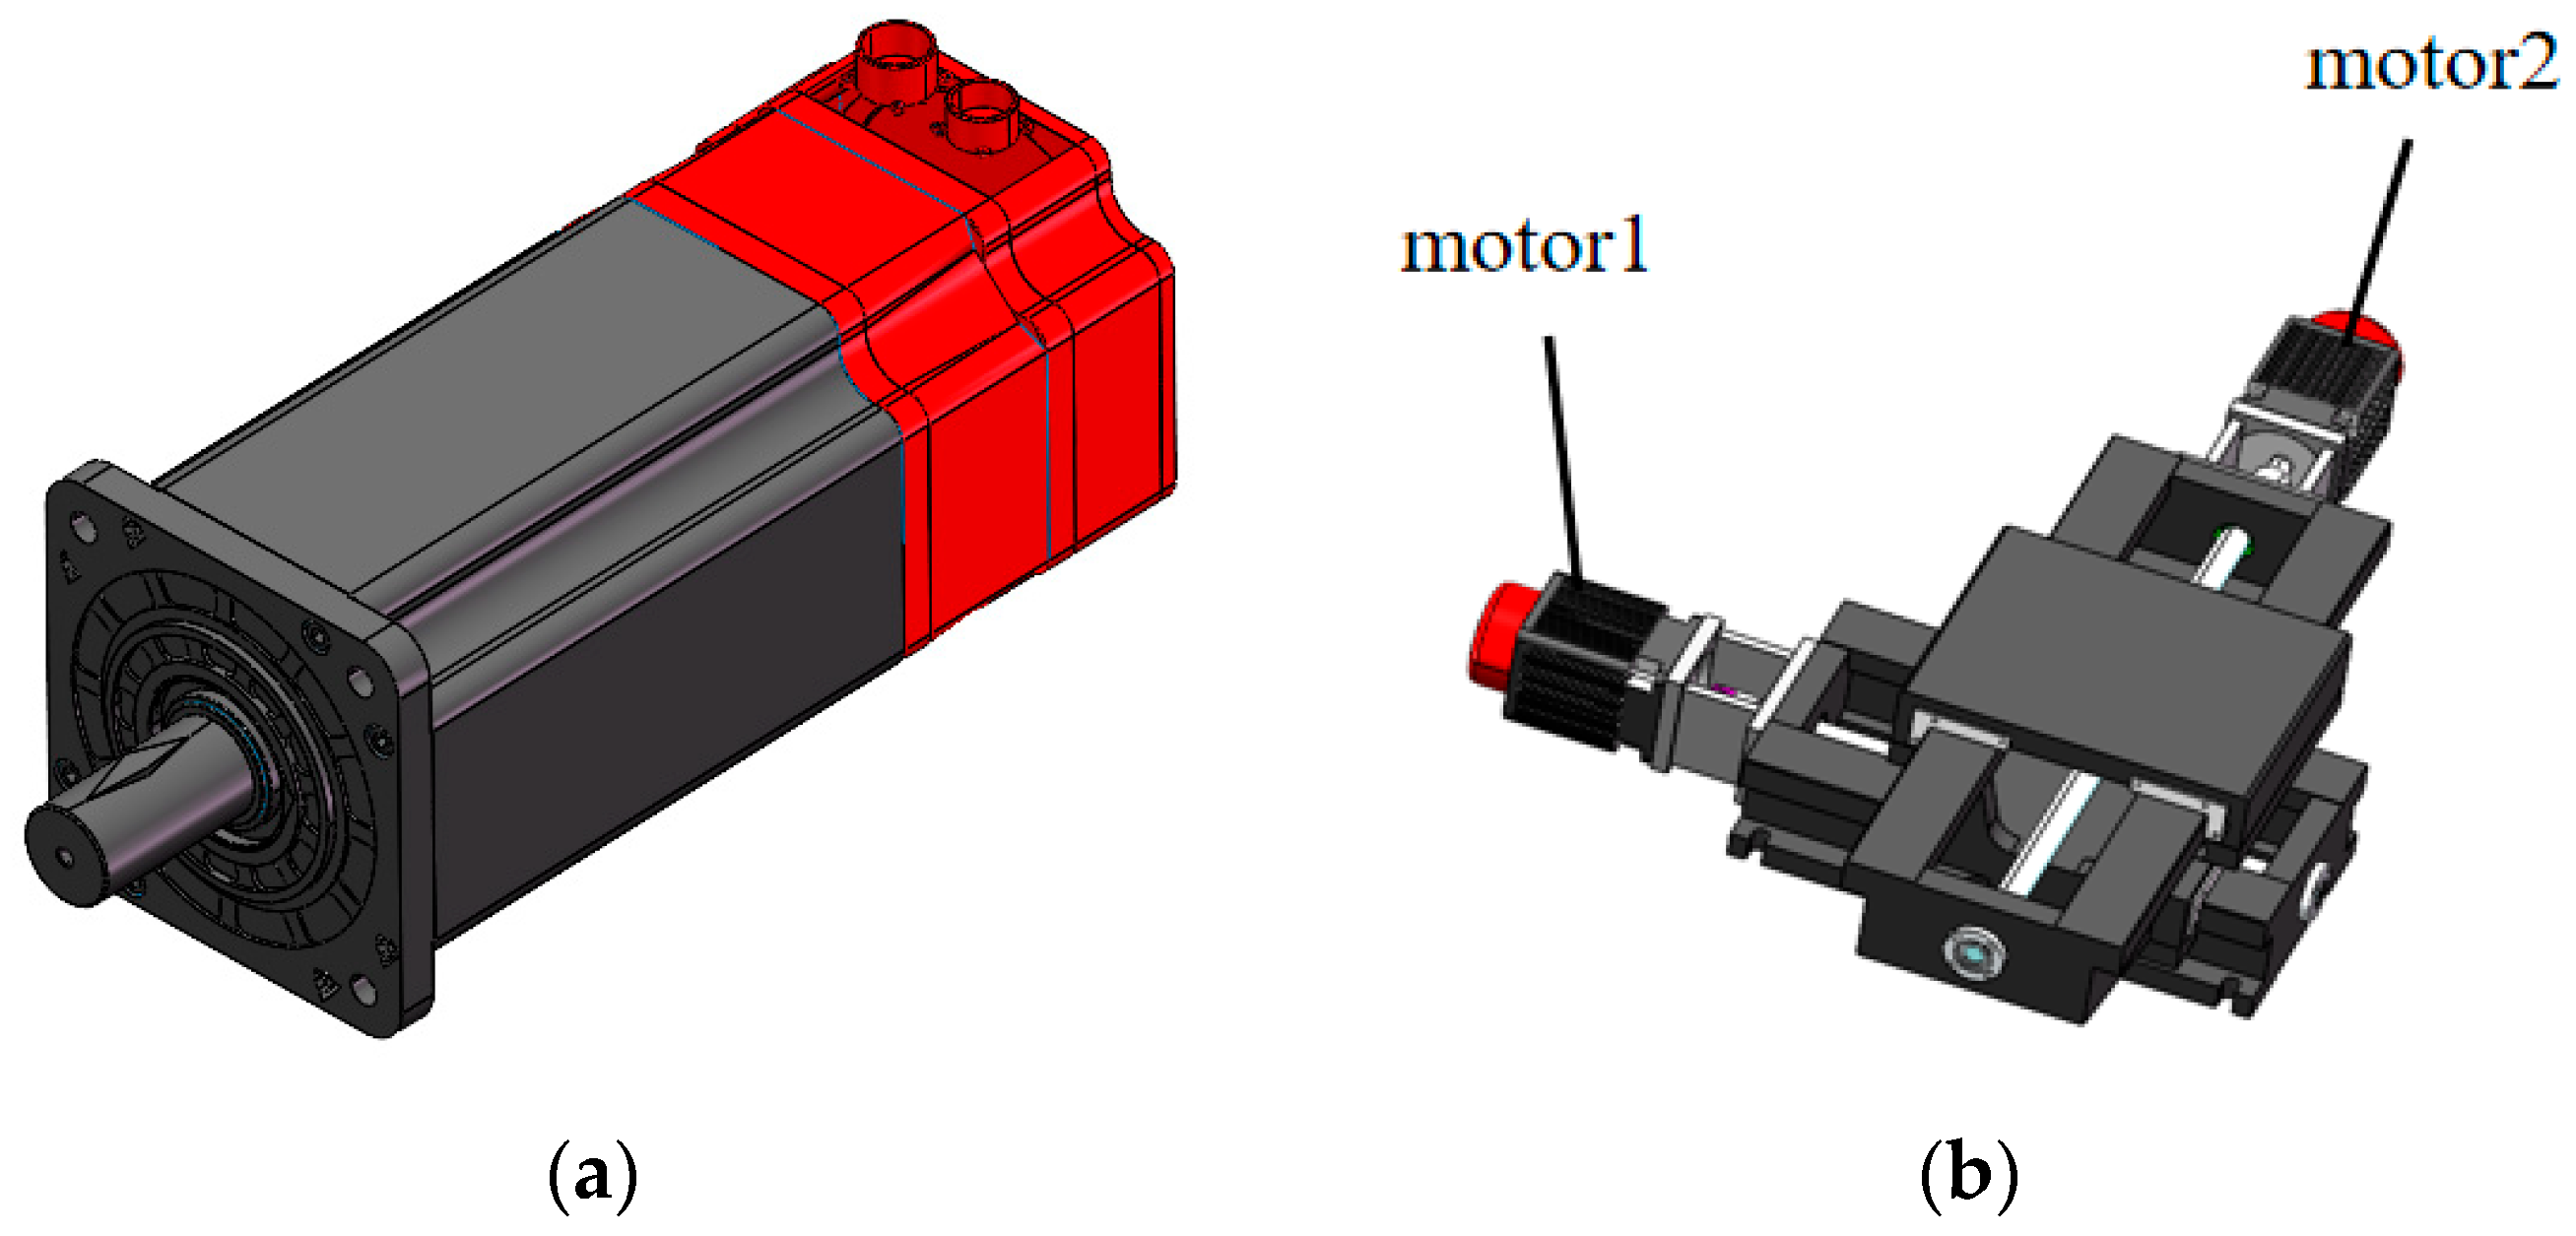
As shown in Figure 5, the main servo motor provides the power source for the test bench. Motor 1, connecting the cross slide, controls the axial movement, and motor 2 controls the radial movement.
(3)
Test module
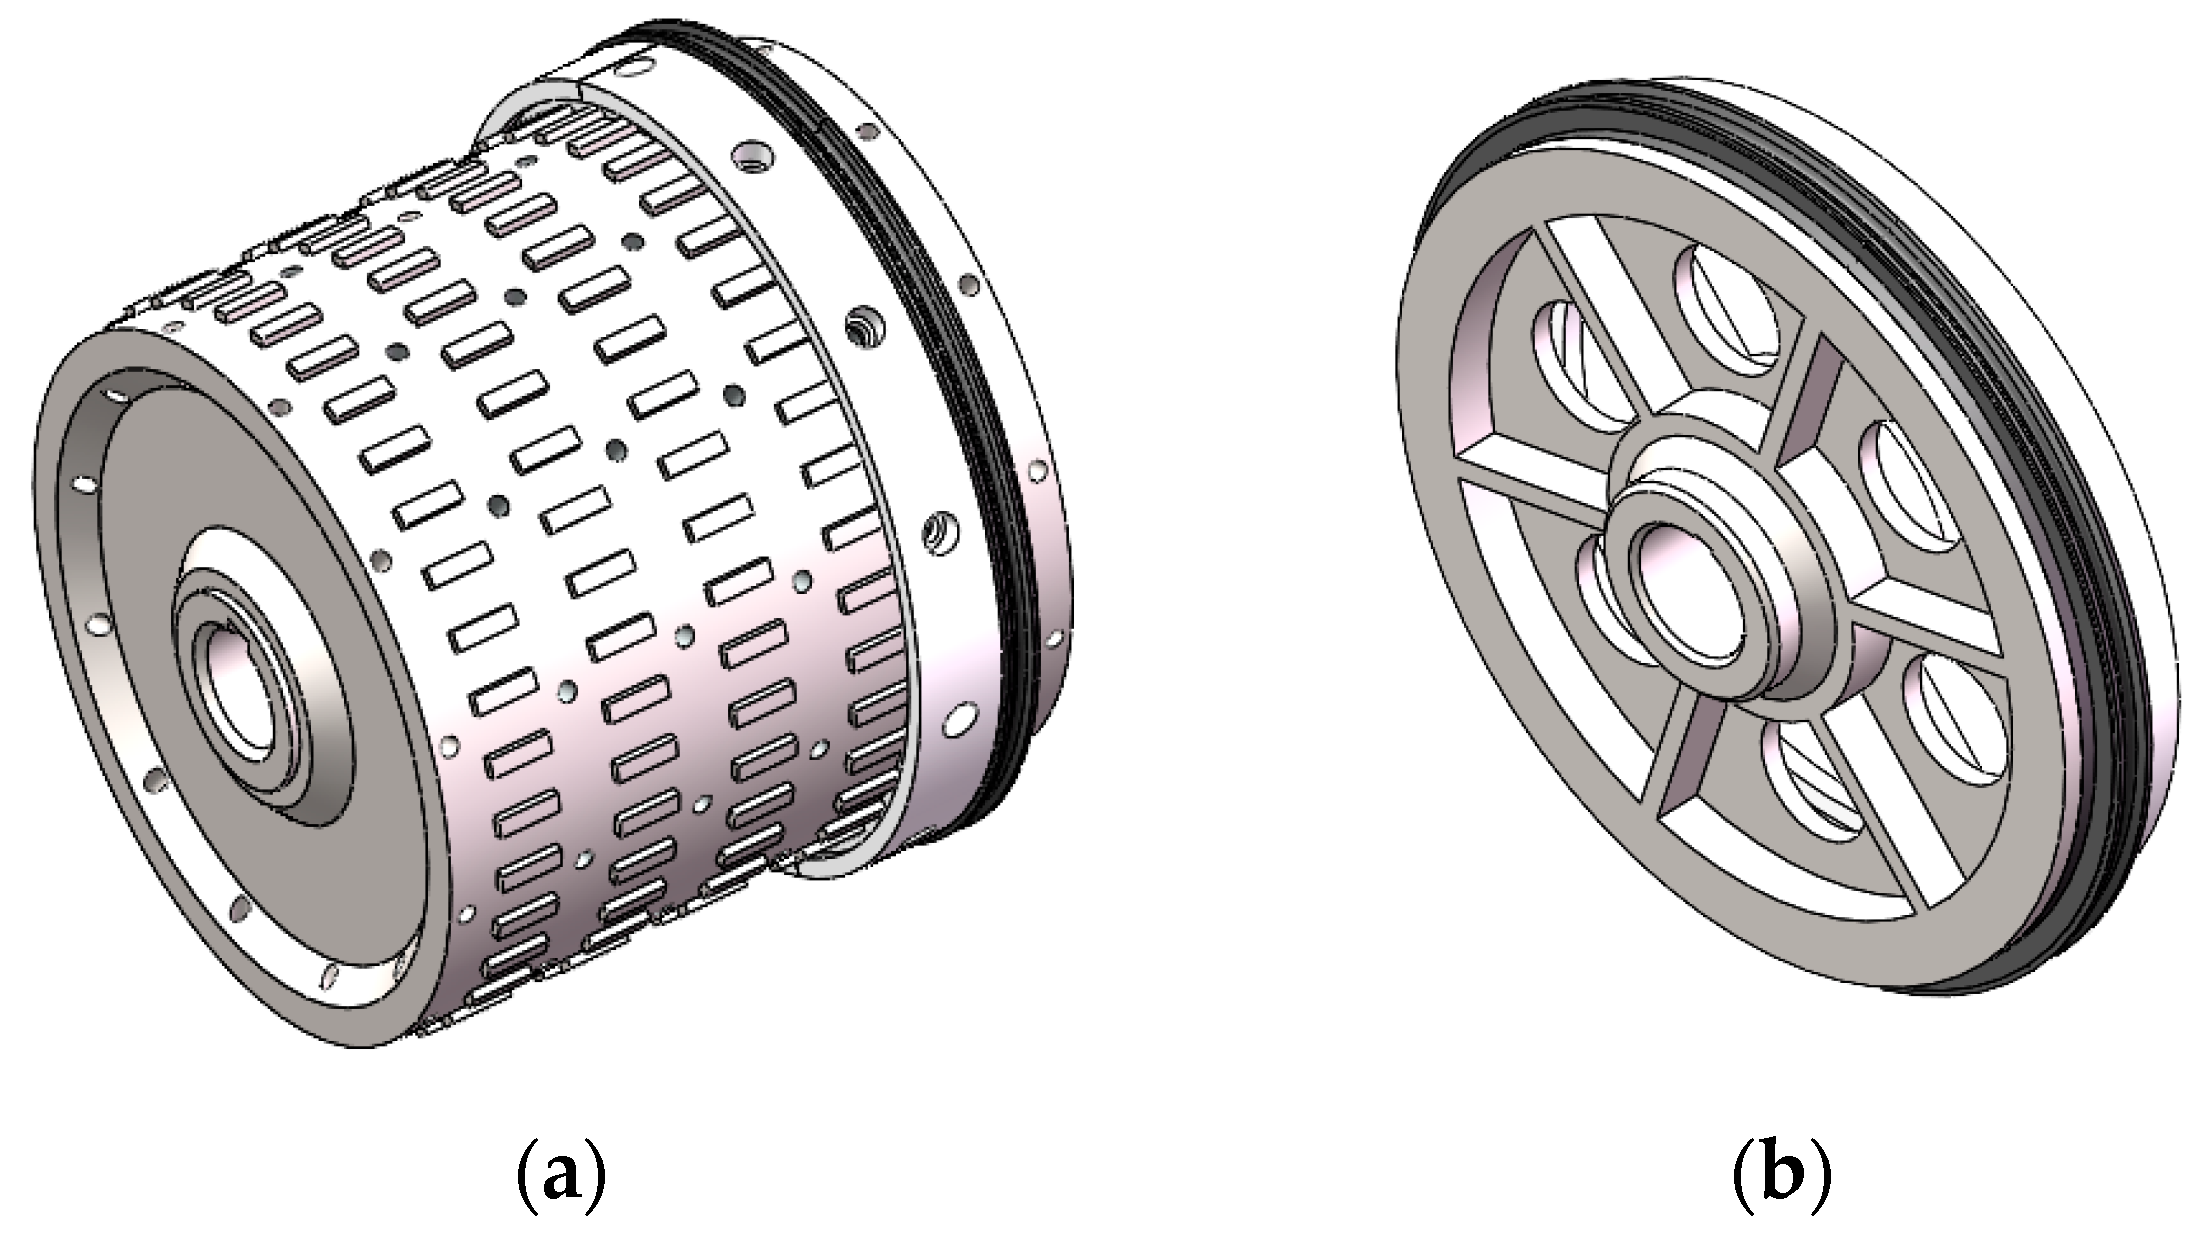
As shown in Figure 6, the drum and pulley are both made of metal–carbon steel with a diameter of 400 mm, and the replaceable gasket materials are polyamide (PA) and metal (PA material gasket properties meet experimental conditions).
The testing plan of the test bench is shown in Table 2.
The test rope is twelve strands of ultra-high-molecular-weight polyethylene fiber braided rope (UHMWPE). The UHMWPE material properties are shown in Table 3.
(4)
Data Acquisition module
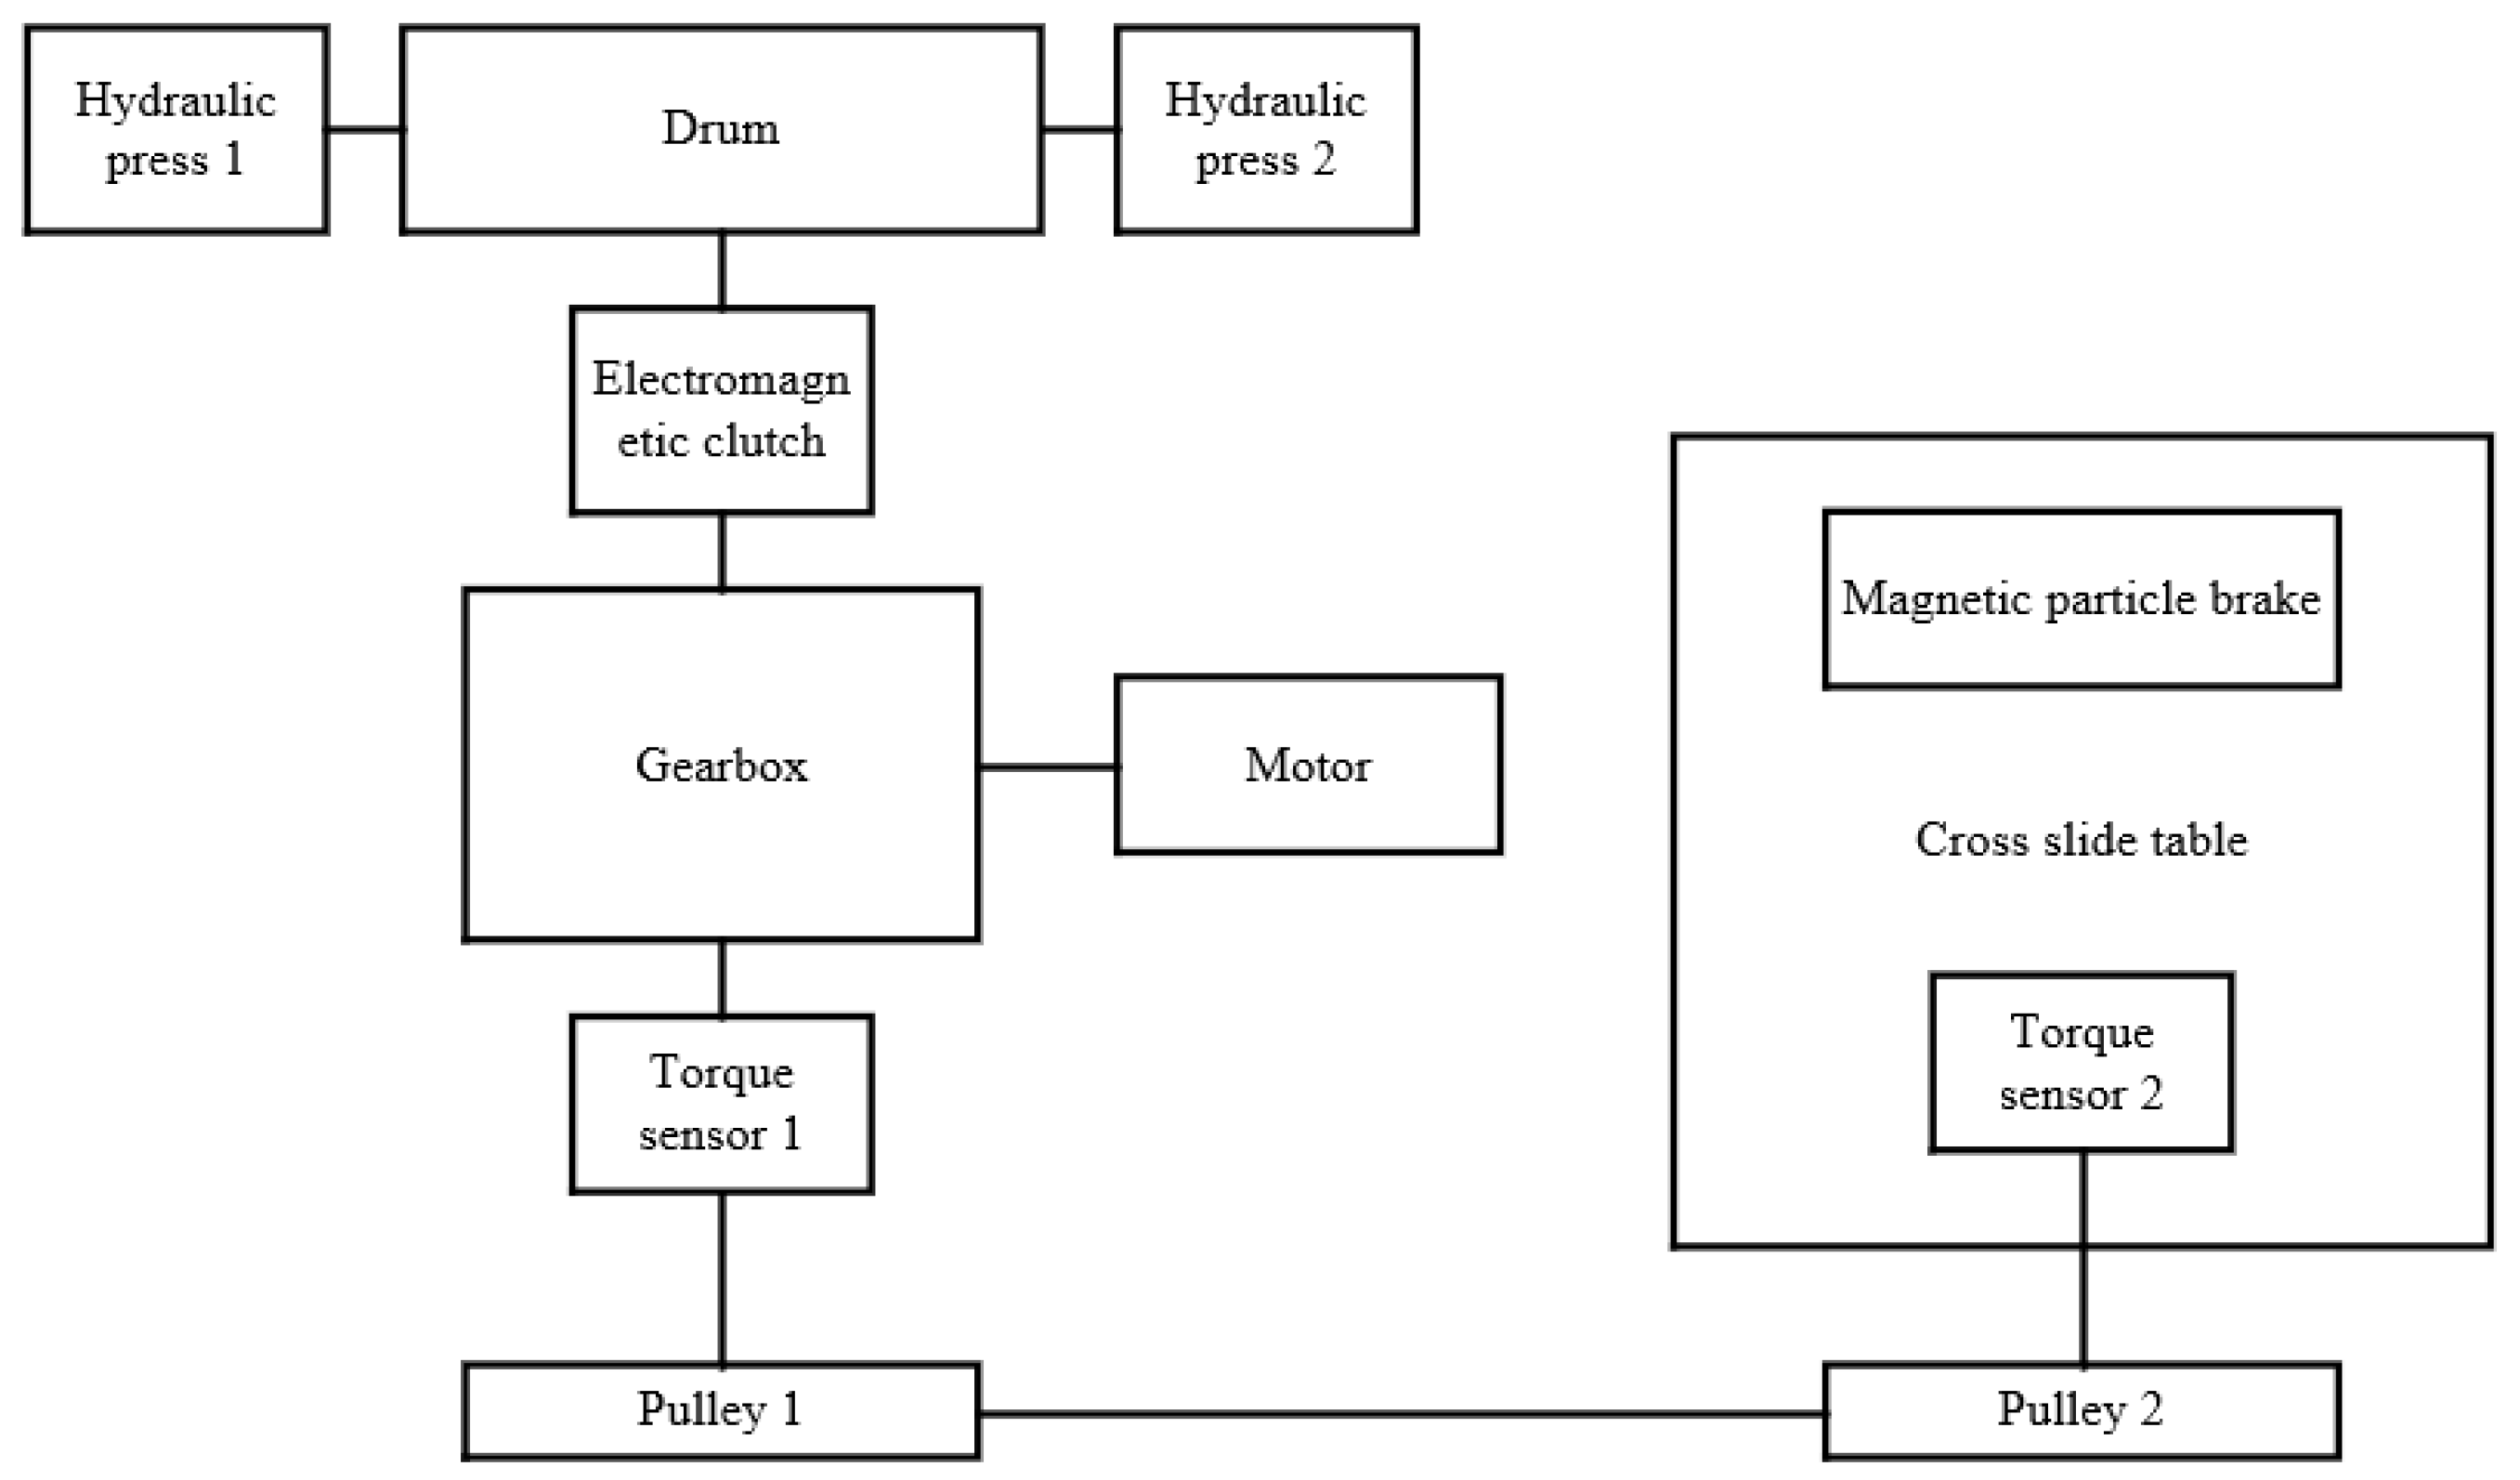
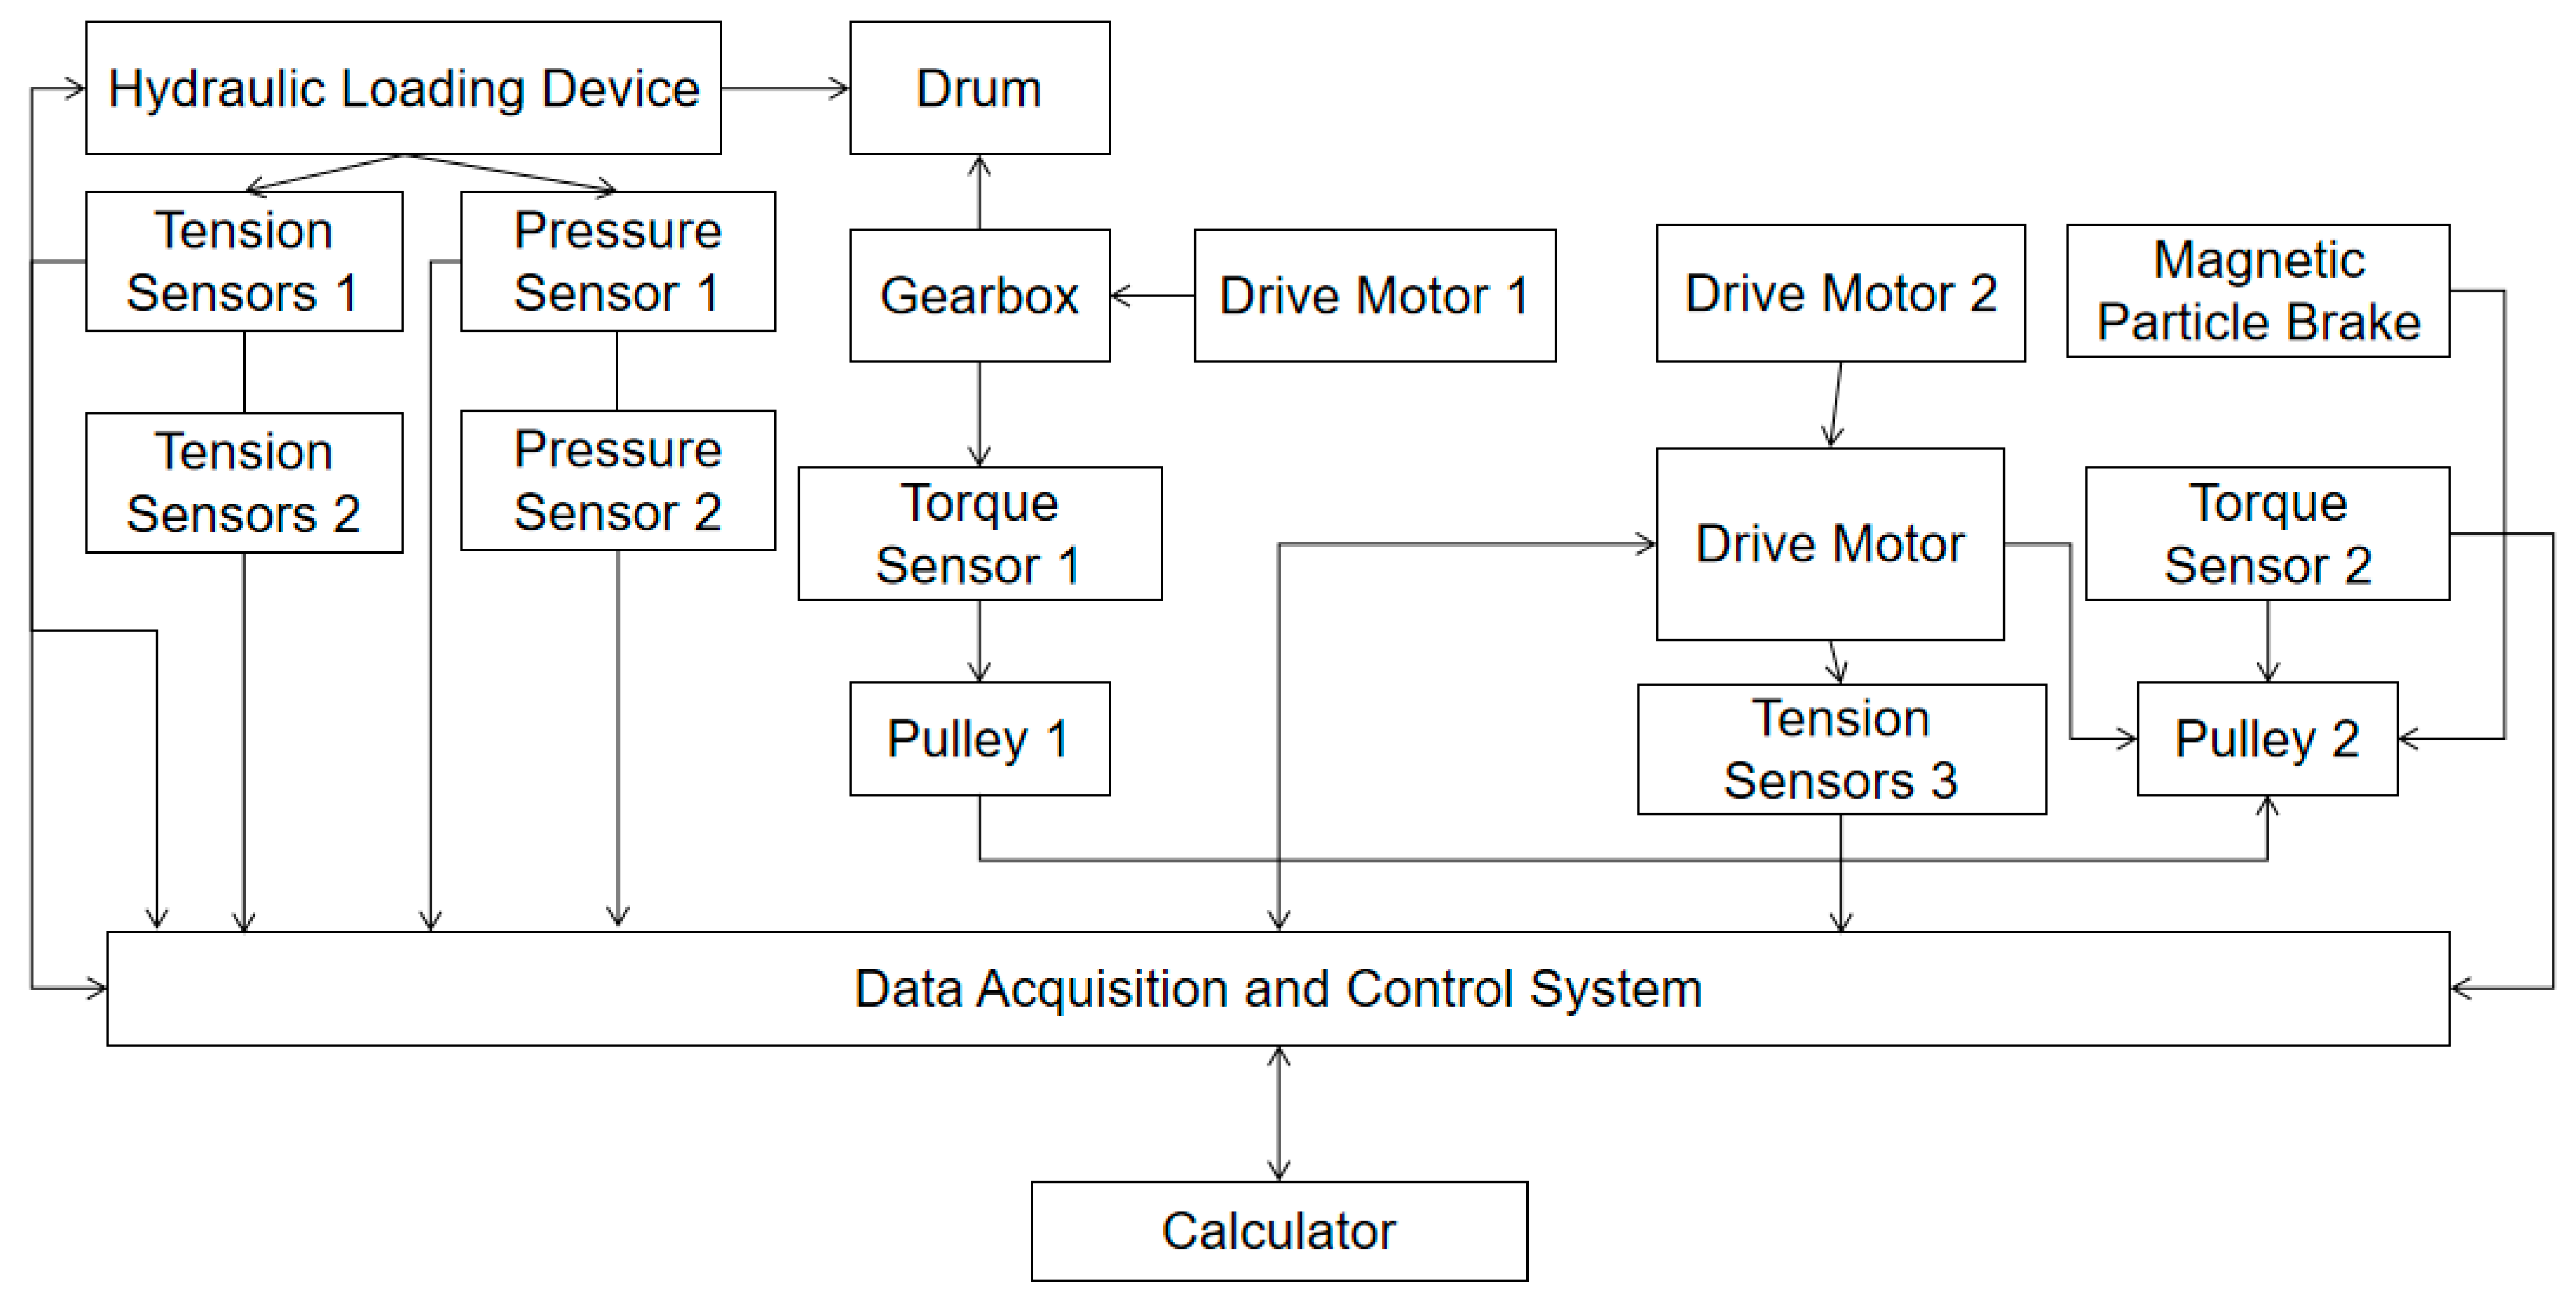
The data acquisition module consists of a variety of high-precision sensors, such as a tension sensor, torque sensor, and pressure sensor. The tension sensor is used to measure the change in rope tension during the equivalent friction coefficient test and the change in tension force during the pulley transmission loss test. The torque sensor monitors the torque and rotational speed of the driving and driven parts. And the pressure sensor measures the downward pressure of the hydraulic cylinder. All sensor signals are processed by a high-speed data acquisition system to ensure the reliability of the experimental data. The schematic diagram of the test bench system is shown in Figure 7.
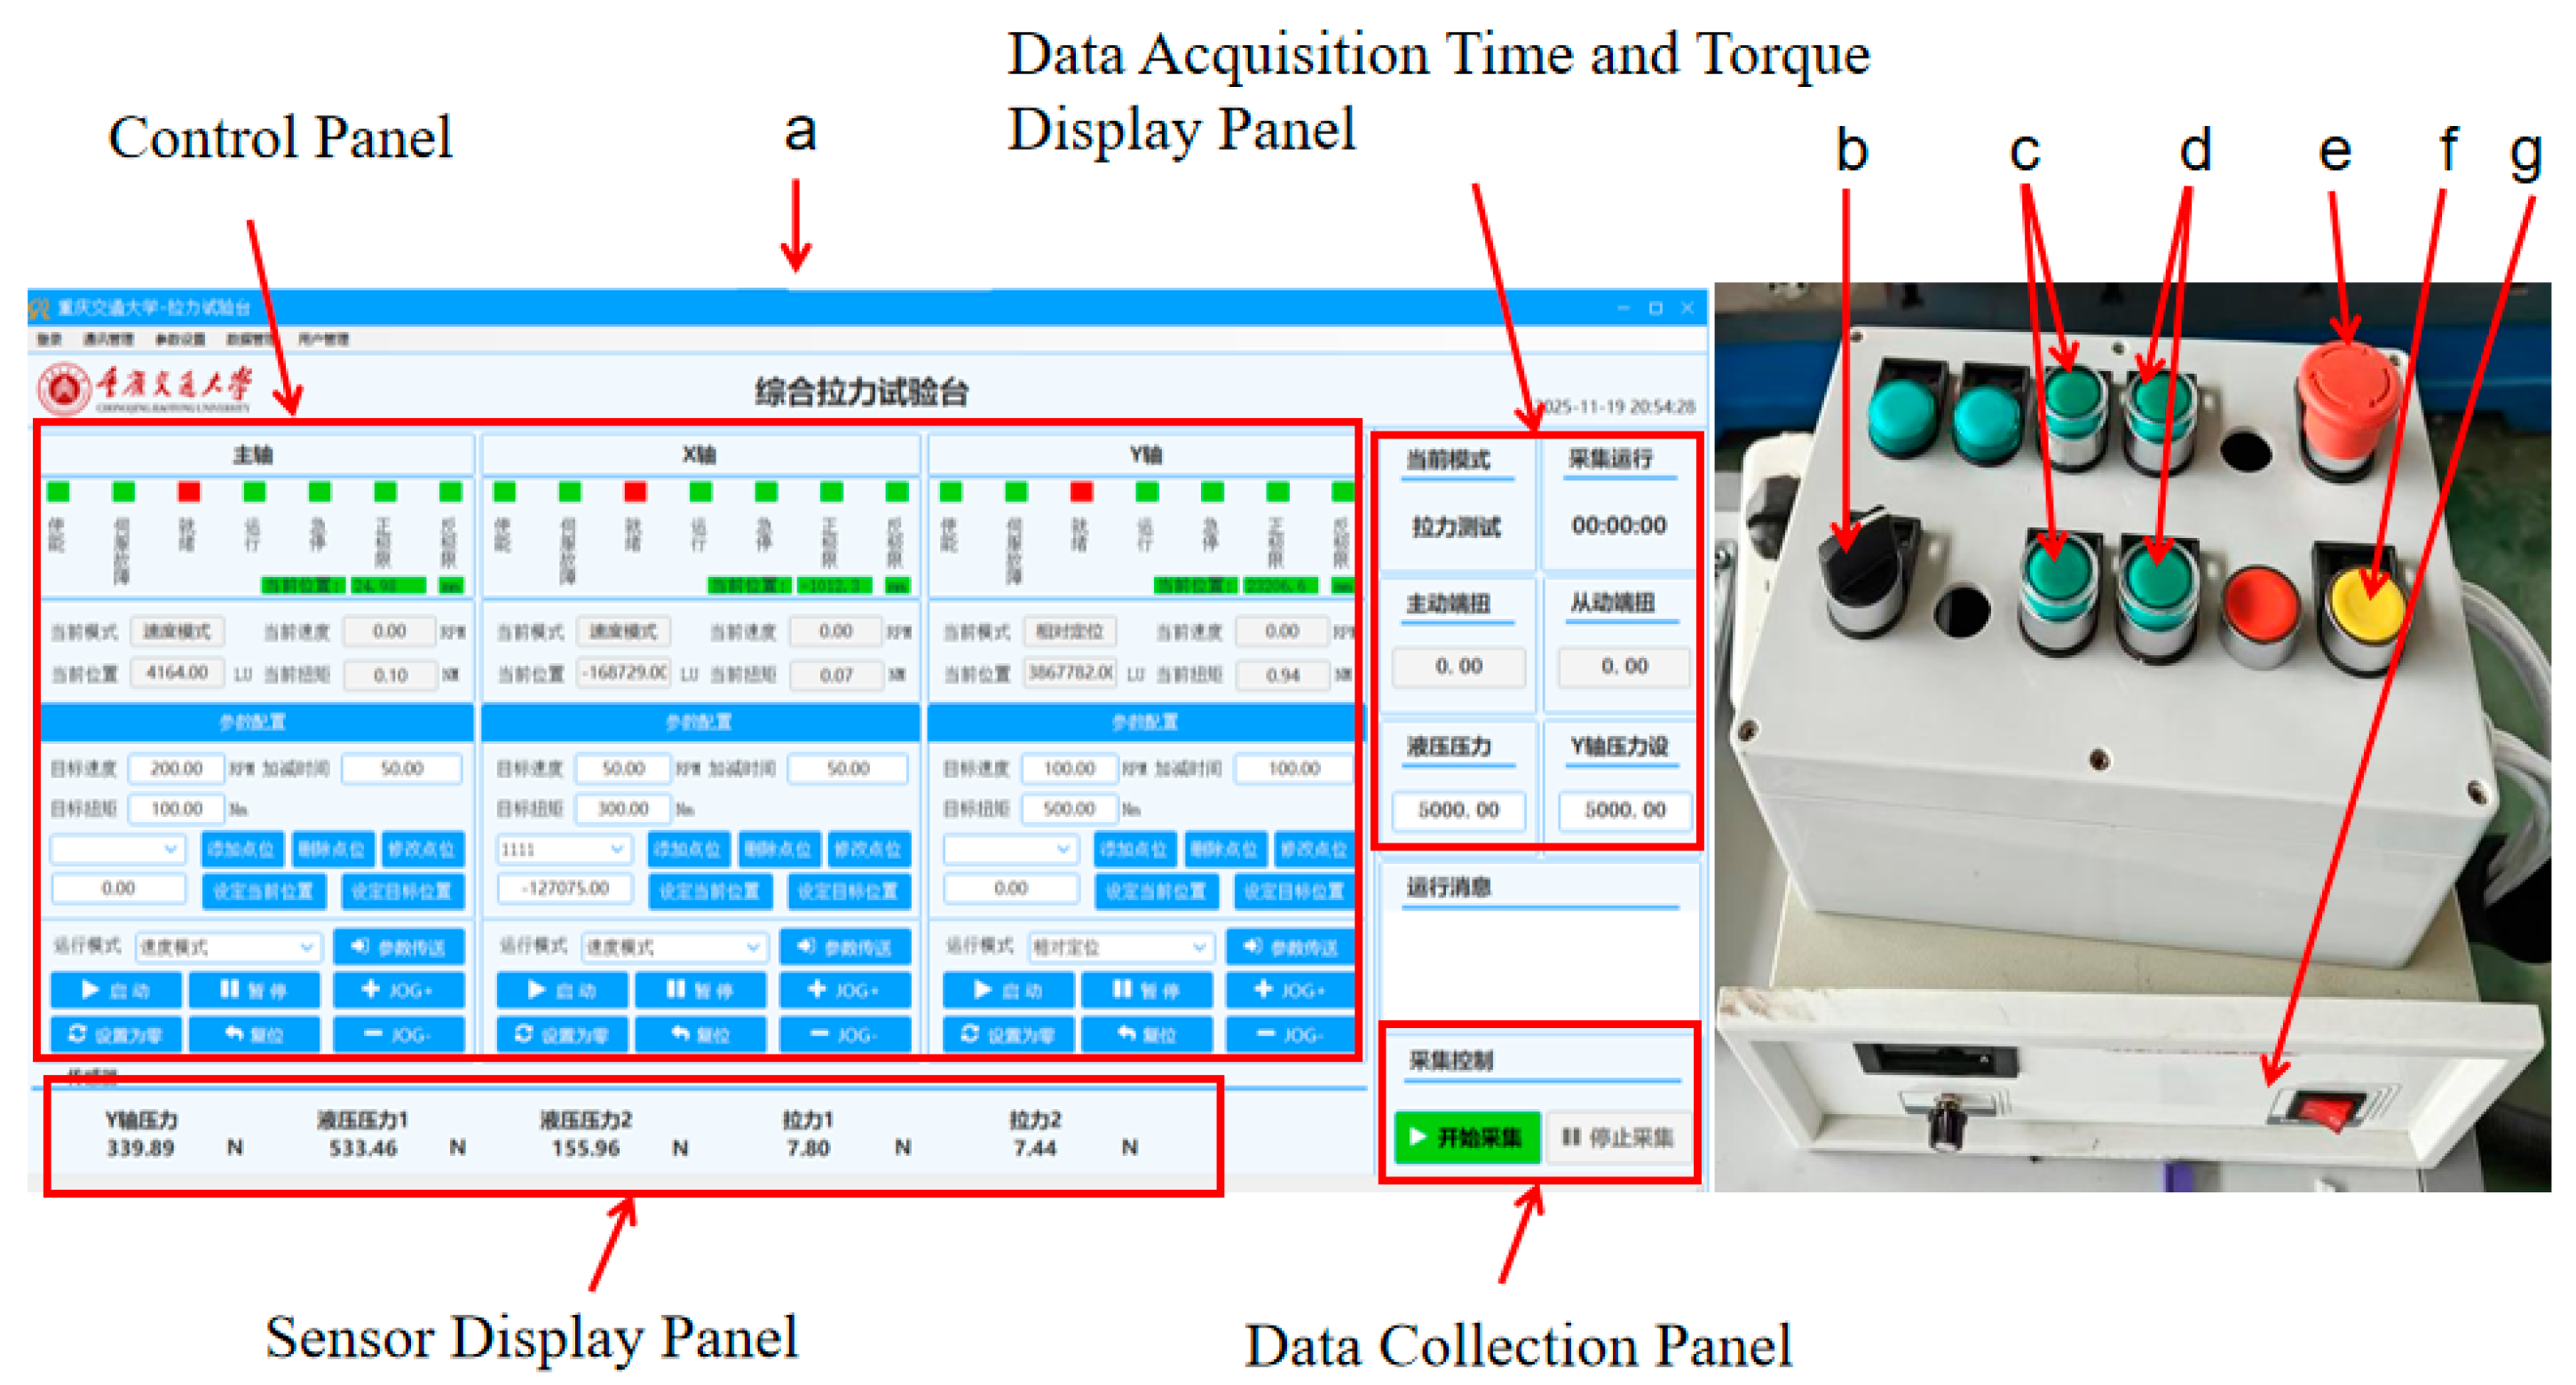
As shown in Figure 8, the control system of the test bench mainly controls the start or stop and rotational speed of the servo motor, the radial and axial displacement of the cross slide, the downward pressure of the hydraulic system, and the opening or closing of the electromagnetic clutch. The hydraulic press regulates the tension of the two ends of the rope. The deflection angle and tension of the rope can be adjusted by the cross slide. The electromagnetic clutch is used to control the connection between the output of the servo motor and the shaft-end of the reel. The operation of the hydraulic machine and electromagnetic clutch adopts a PLC control system.
(5)
Main load components analysis
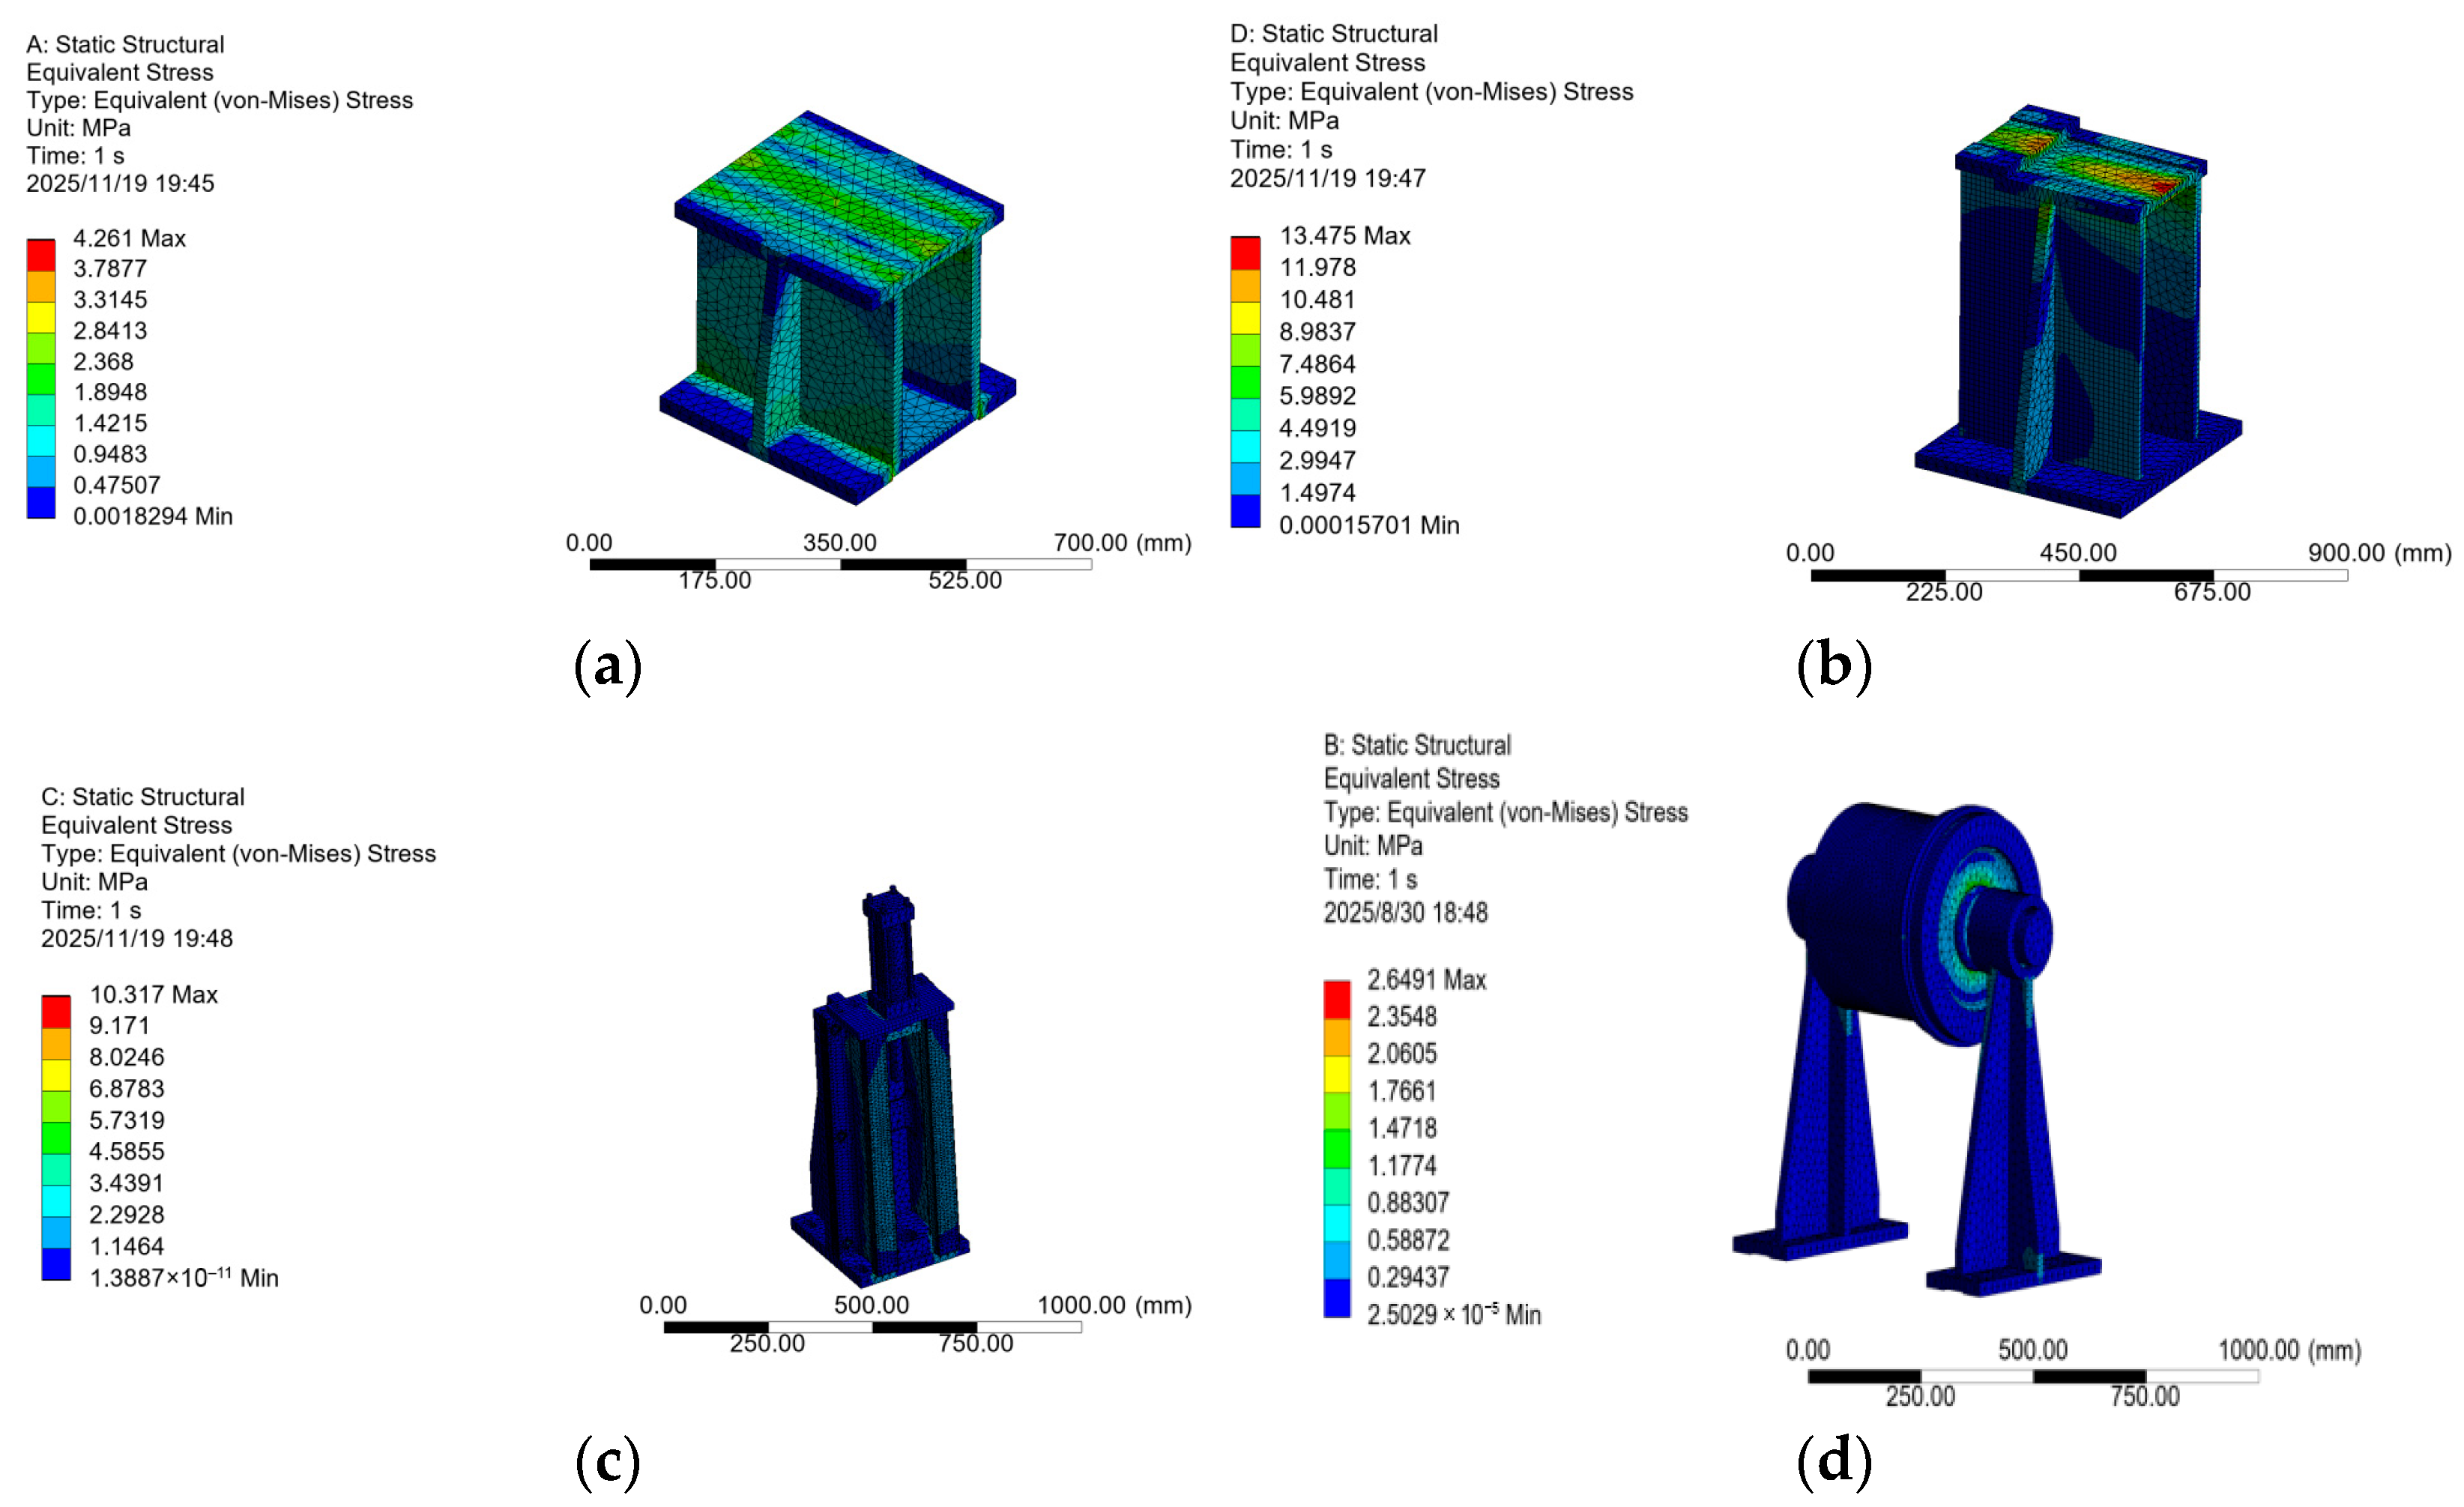
Further stress analysis was needed on the main supporting components of the test bench to verify that they met the strength requirements. The main supporting components of the test bench include the gearbox bracket, torque sensor bracket, hydraulic column, and drum bracket. The loading parts are made of Q235 structural steel. The material properties are shown in Table 4.
The static strength analysis of the main supporting components was carried out, and the stress distribution of each component was obtained by establishing a finite element model. The corresponding boundary conditions and 2-ton load constraints were applied. The computer hardware configuration used for analysis includes an Intel Core i7-12700H processor and 32 GB of memory. The analysis software employed is ANSYS Workbench 2022 R1, and the finite element model utilizes a 3D solid model created with SolidWorks 2024 software. The analysis results are shown in Figure 9. From the calculation results, it can be seen that the maximum equivalent stress of each component does not exceed the permissible stress of Q235 material, which meets the strength design requirements of the test bench.

2.2. Working Principle

The overall structural model of the test bench is shown in Figure 9. During the friction coefficient testing experiment, servo motor 9 is initiated while the electromagnetic clutch 5 remains engaged. The magnetic particle brake 12 operates under no-load conditions. The output end is connected to drum 3, and a predetermined normal load is applied via the hydraulic loading device 1 to ensure tight contact between the rope and the drum surface. The servo motor is set to drive the drum at a constant rotational speed, with sensors recording the tension values at both ends of the rope during sliding. The equivalent friction coefficient between the rope and drum is calculated using Euler’s Formula (1), incorporating the tension sensor parameters from both ends of the rope and the known contact angle.
e μ θ = F 1 F 2
where μ is the coefficient of friction, θ is the contact angle, F1 is the tight-side tension, and F2 is the loose-side tension.
During the transmission loss testing experiment, servo motor 9 is activated while electromagnetic clutch 5 remains disengaged to ensure separation between the hydraulic loading device and the transmission system, with drum 3 maintained in a stationary state. The cross slide table 11 and radial displacement device 13 are adjusted via the control system to regulate the radial and axial positions of the driven pulley, thereby simulating test conditions with varying tension forces and misalignment angles. The magnetic particle brake 12 can be switched between no-load and load modes according to experimental requirements. Torque sensors monitor the shaft torque at both pulleys in real time, and the pulley transmission efficiency loss is derived based on the efficiency, as in Formula (2).
η = T 1 T 2
where η is the transmission efficiency, T1 is the input torque, and T2 is the output torque.

3. Equivalent Friction Coefficient Experiment

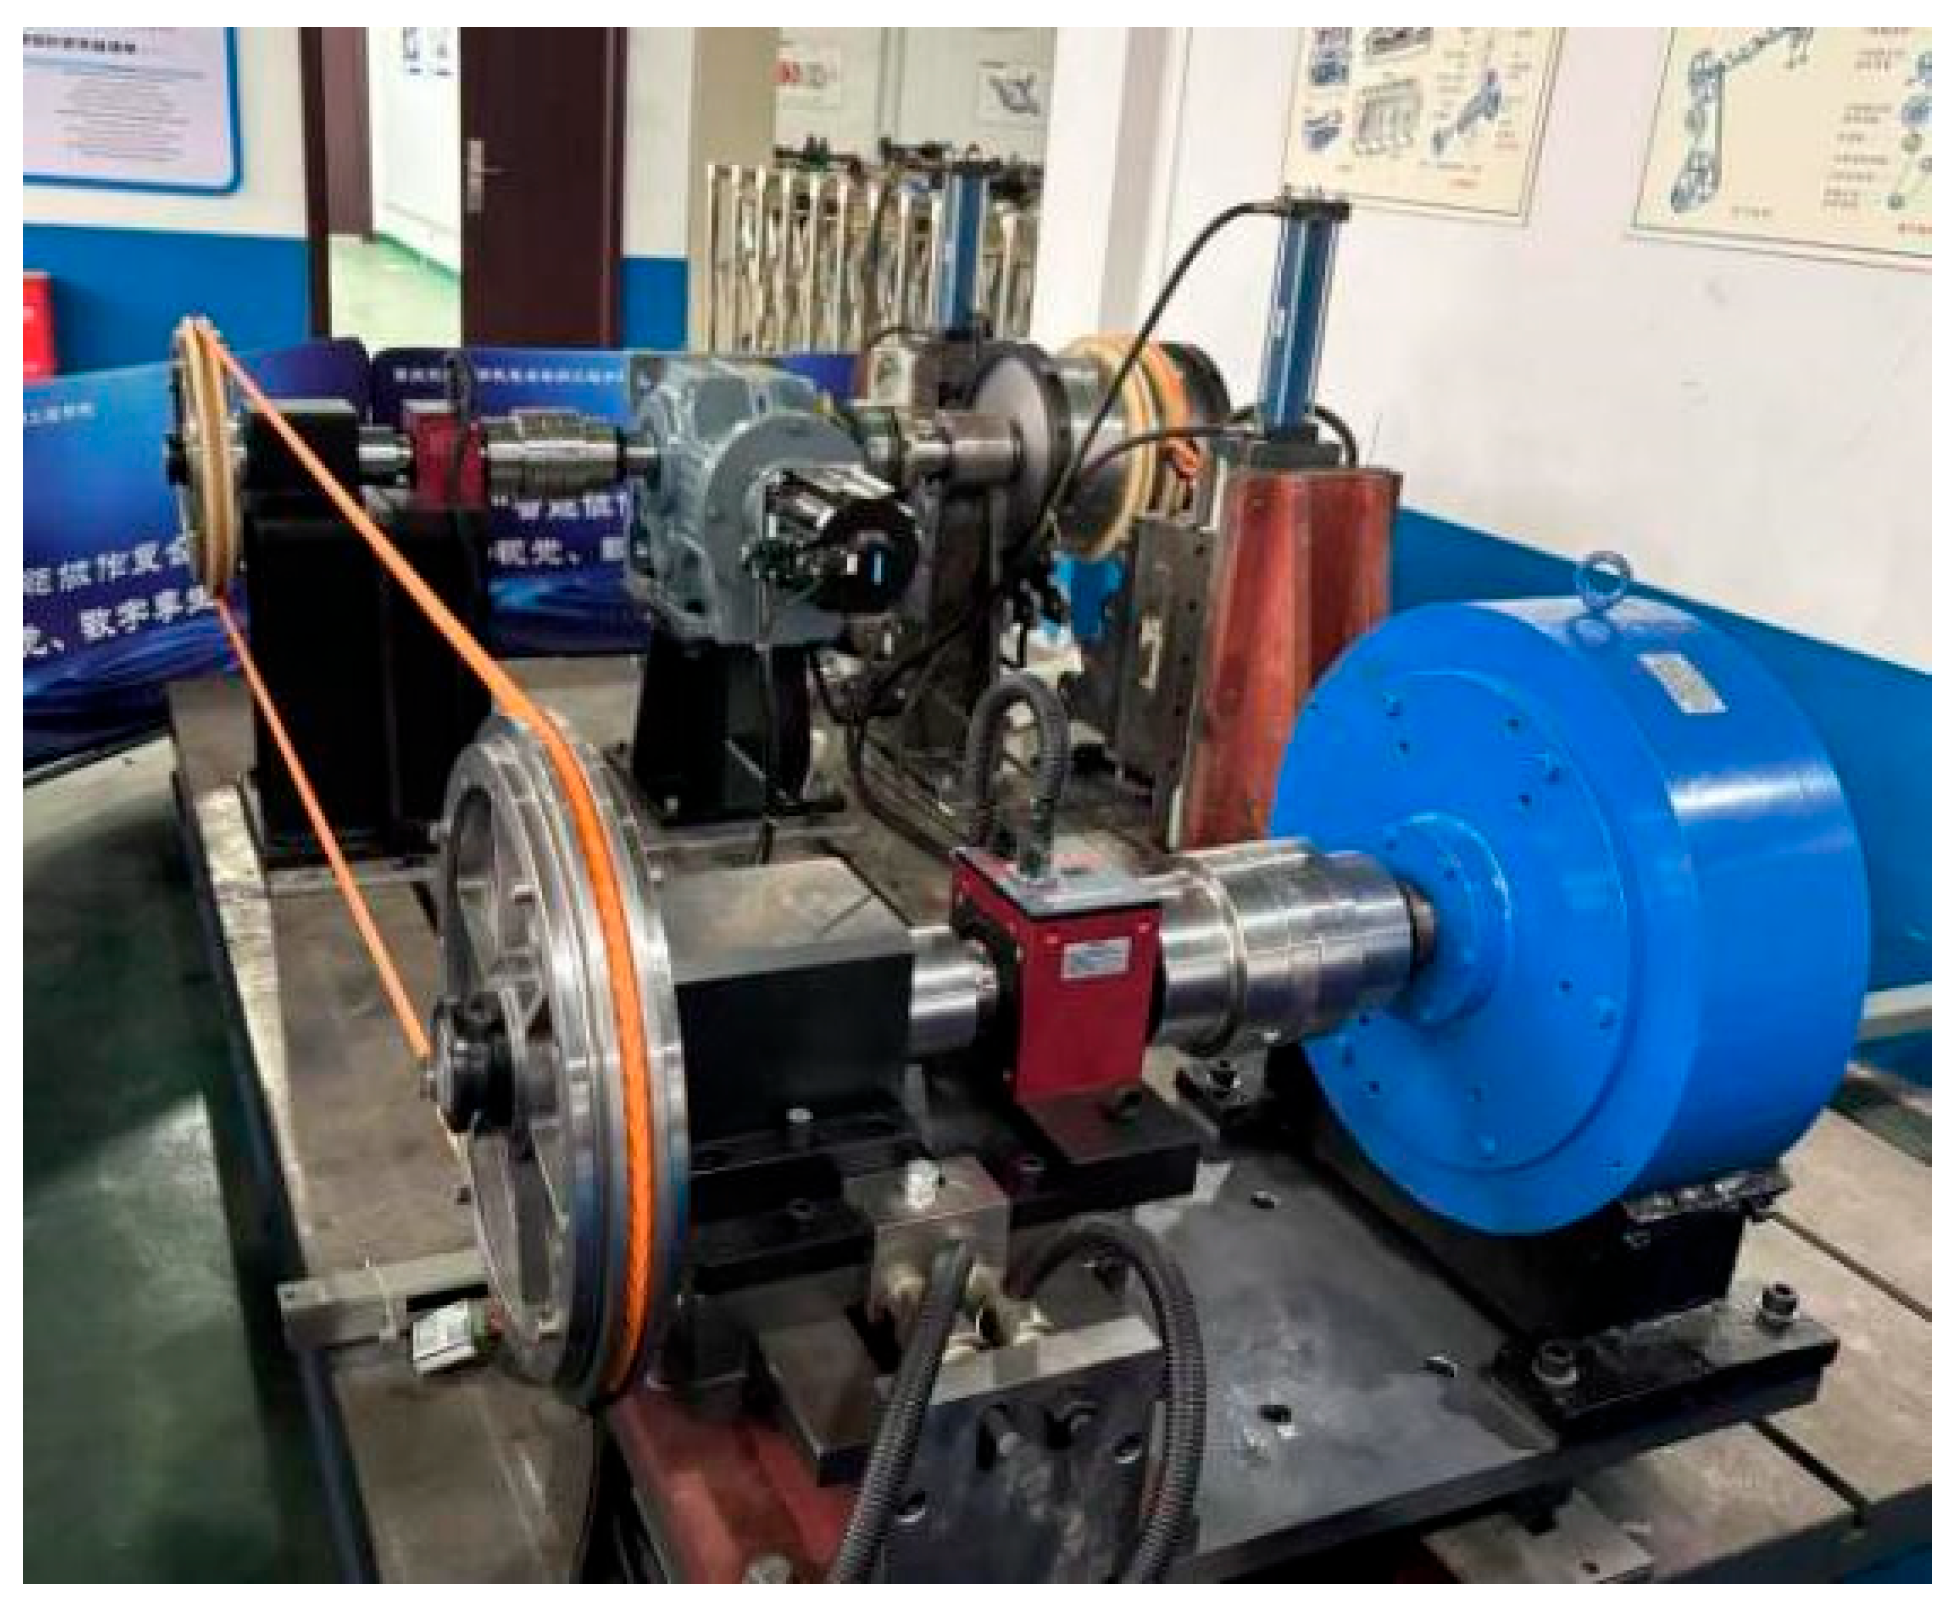
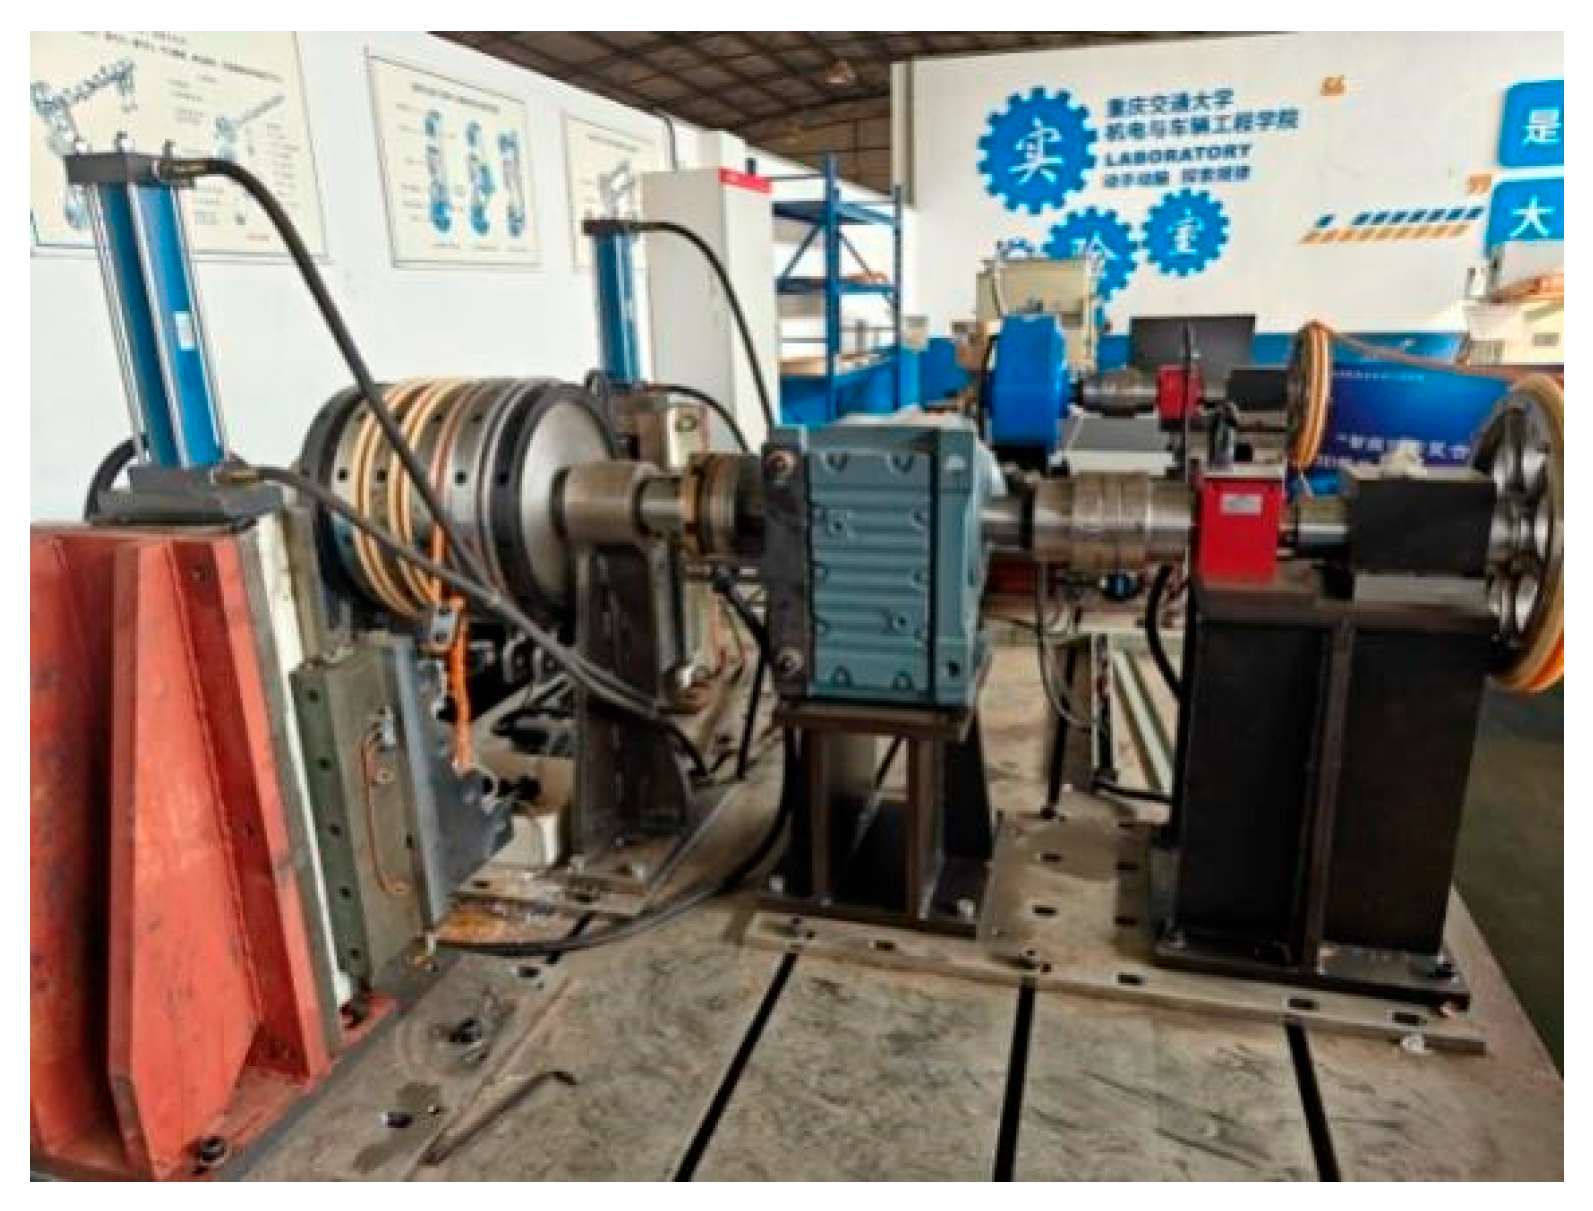
Each experimental condition was repeated twice, and the data reported in the text represent the average of two independent measurements. Figure 10 shows the test bench after completing the trial production.

3.1. Influence of Contact Angle on Equivalent Friction Coefficient

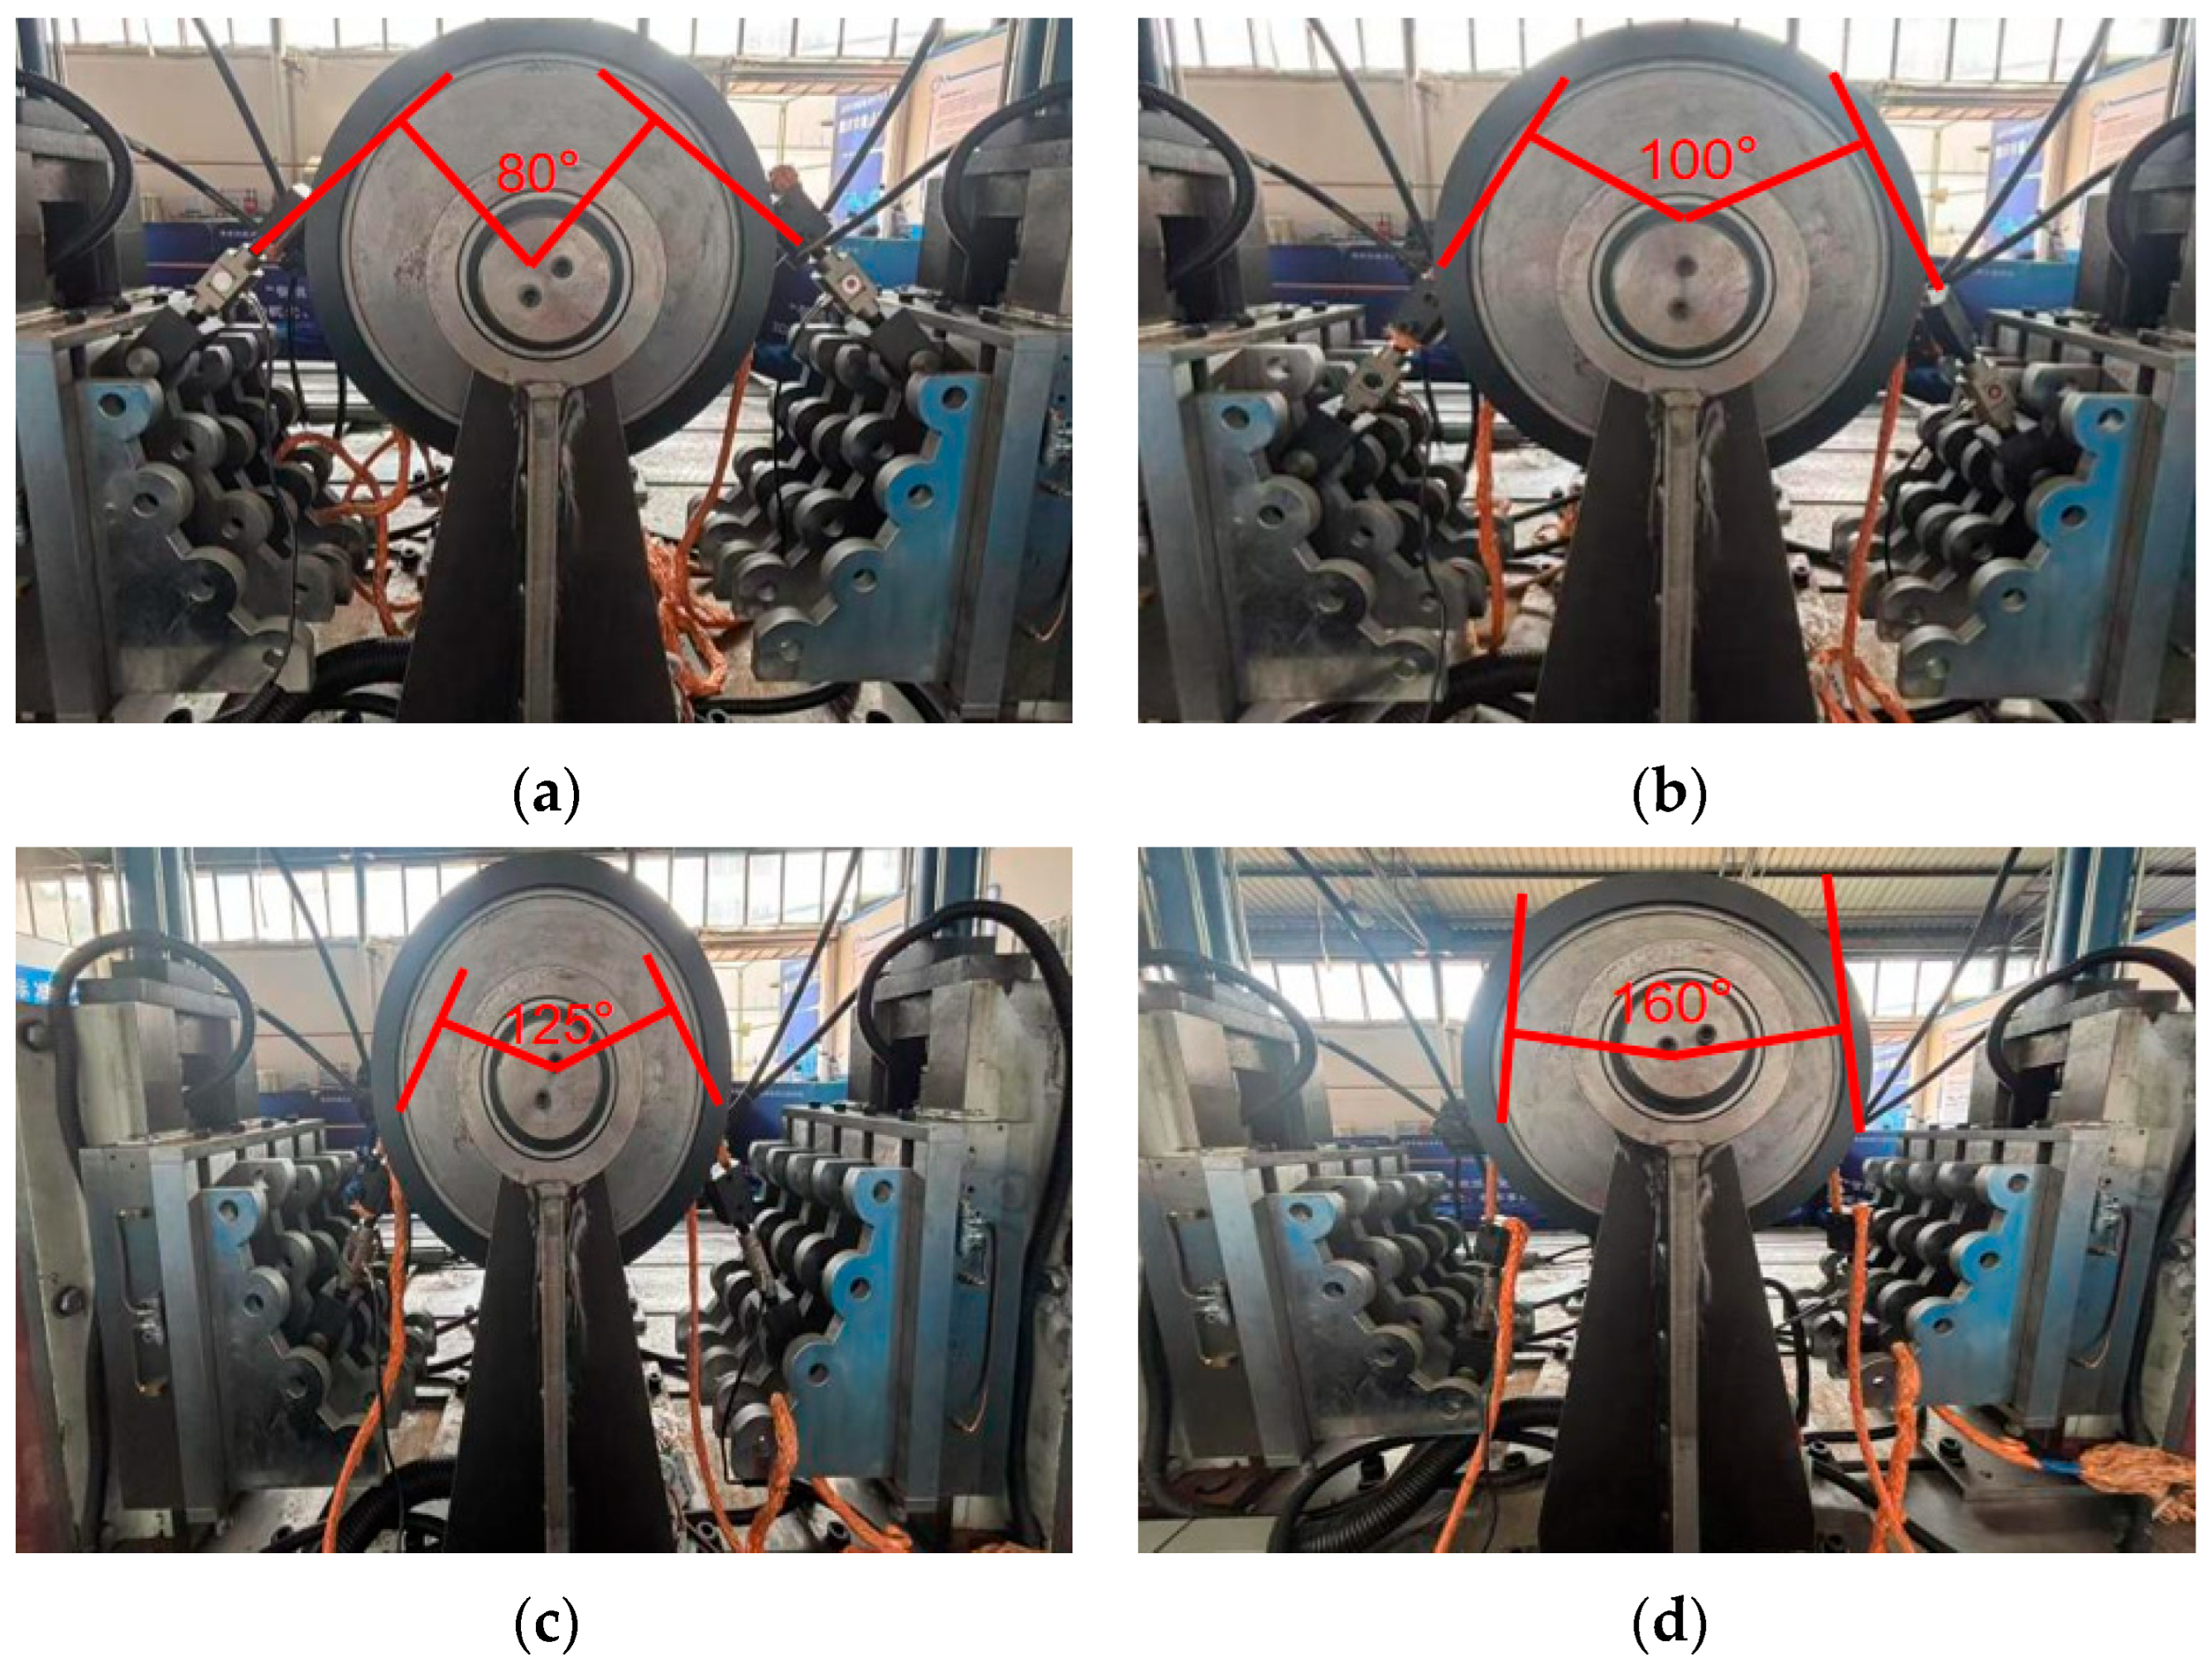
This experiment primarily employs a four-step adjustable angle design: 80°, 100°, 125°, and 160°, as shown in Figure 11. Different contact angles are achieved by selecting the corresponding positions of the wrap angle adjuster. Each position is equipped with a locking and positioning mechanism to ensure the angular accuracy is maintained within a specified range. Different angle settings can significantly alter the contact arc length and pressure distribution between the rope and the drum. A contact angle of 80° results in a contact arc length of approximately one-quarter of the circumference, while a 160° contact angle enables a contact arc approaching half the circumference. This design facilitates the investigation of frictional performance under various operating conditions.
As shown in Figure 12a, the equivalent friction coefficient between the rope and the drum is approximately 0.11 when the contact angle is 80°. As the angle increases to 100°, the equivalent friction coefficient reaches about 0.15. With further increase in the contact angle, the equivalent friction coefficient decreases from 0.15 at 100° to 0.13, and further to 0.12 at 160°. The experimental results indicate that a smaller contact angle can reduce the contact area between the rope and the drum surface, resulting in lower friction. Within a certain range of contact angles, the increase in the contact angle will lead to greater friction and a higher equivalent friction coefficient. However, at larger contact angles, the contact area between the rope and the drum surface gradually saturates. The value exhibits an initial increase followed by a decreasing trend, using Euler’s formula to calculate the equivalent friction coefficient, as illustrated in Figure 12b.

3.2. Influence of Gasket Material and Groove Type on Equivalent Friction Coefficient

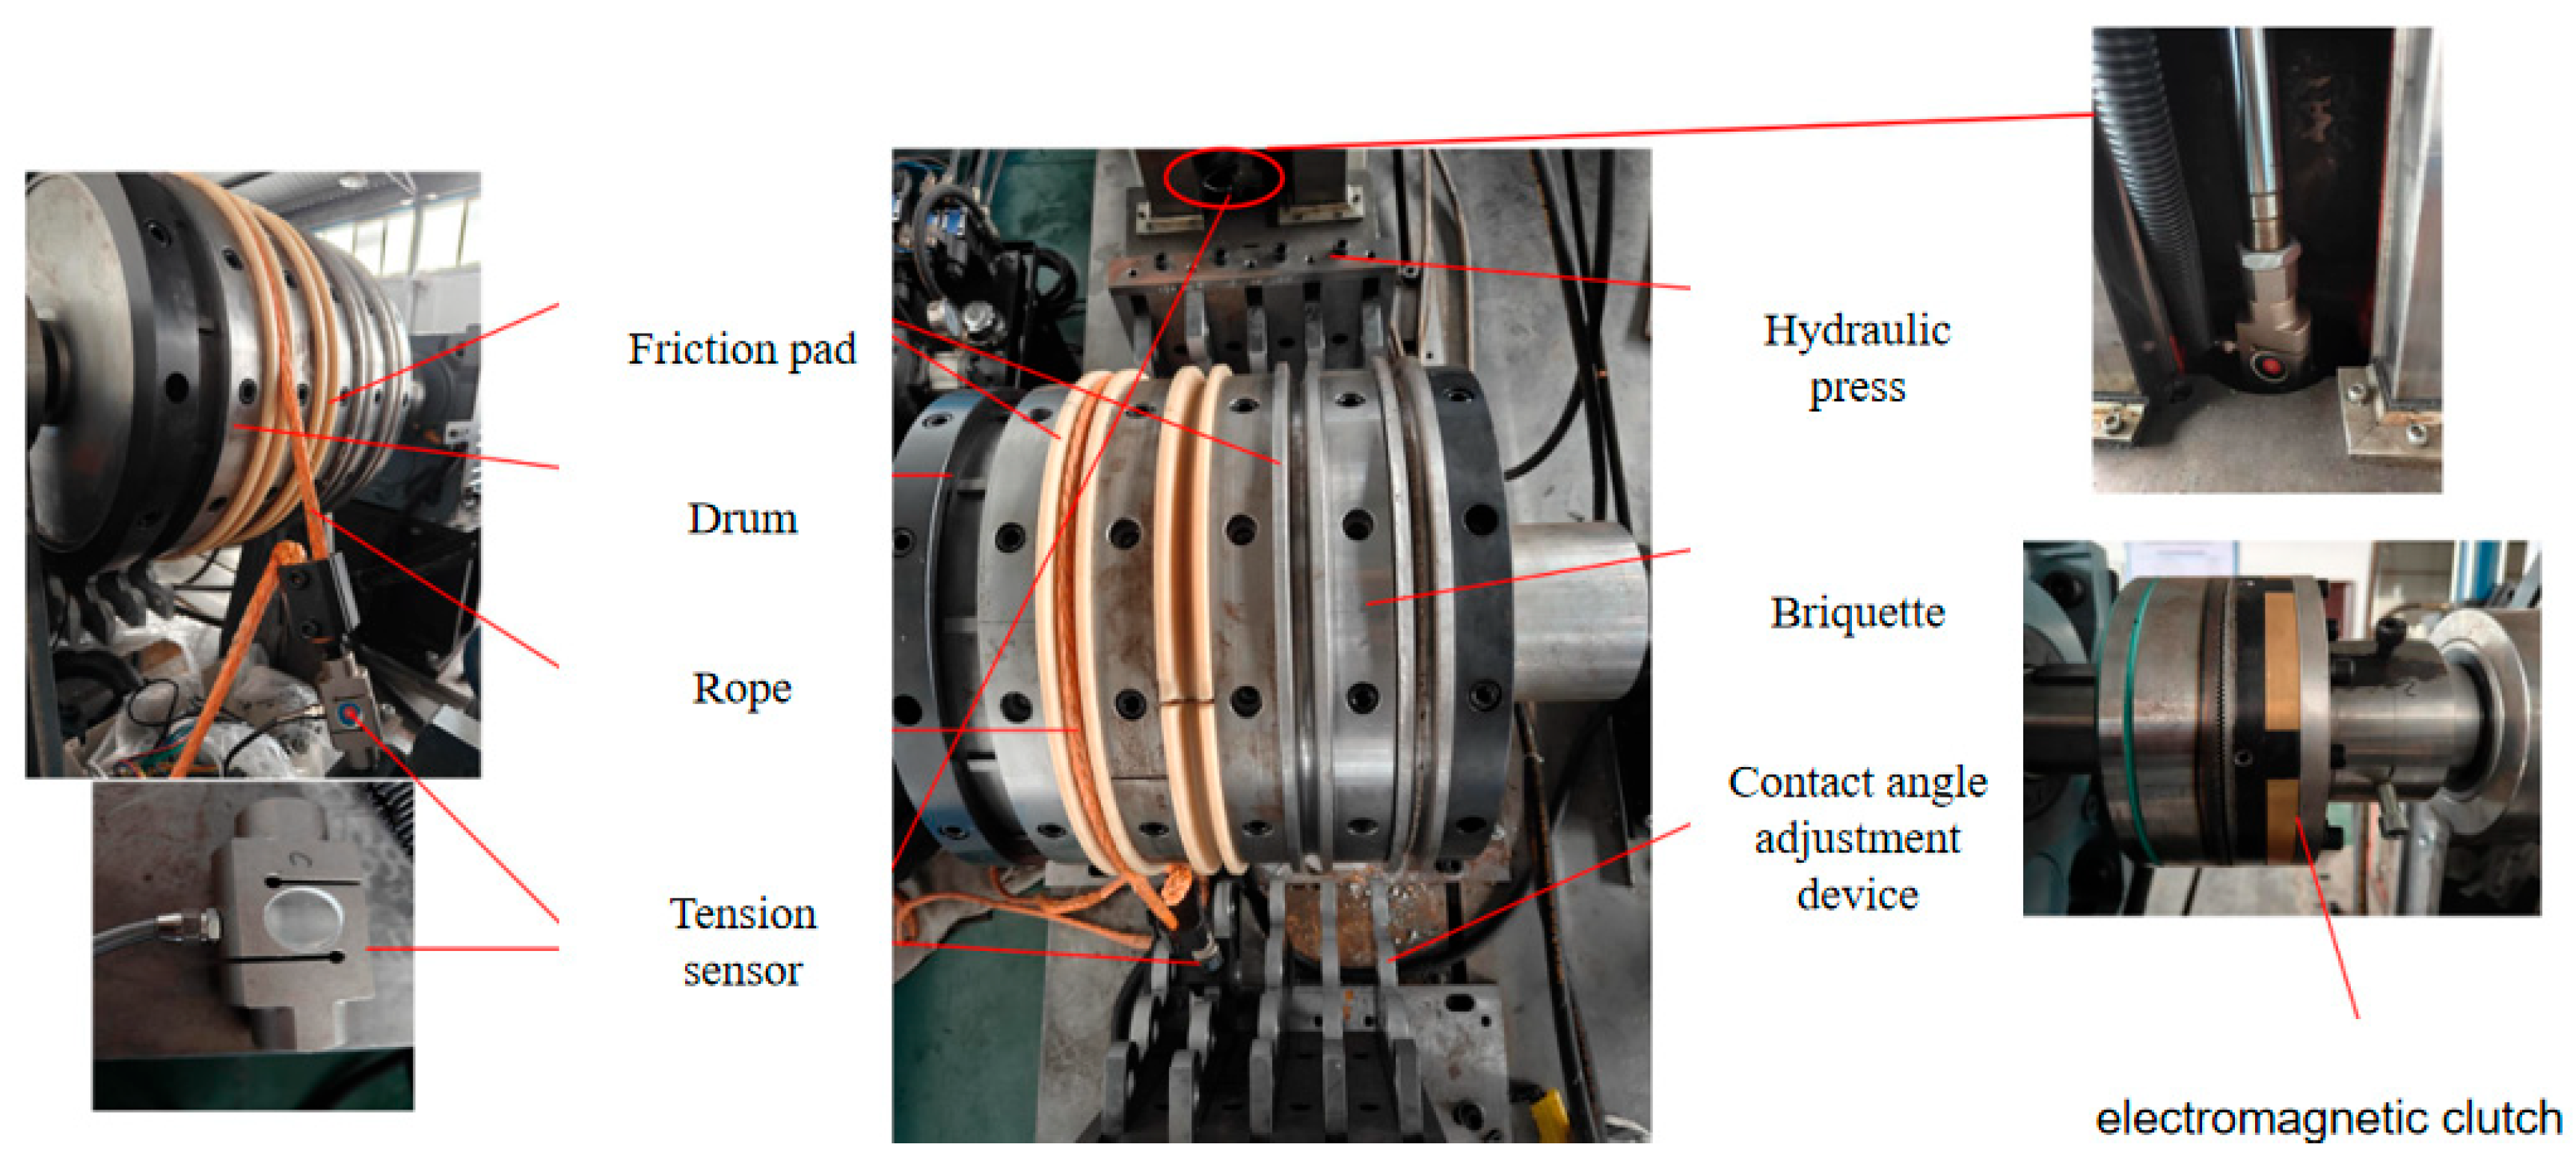
The overall physical diagram of the hydraulic system is shown in Figure 13.
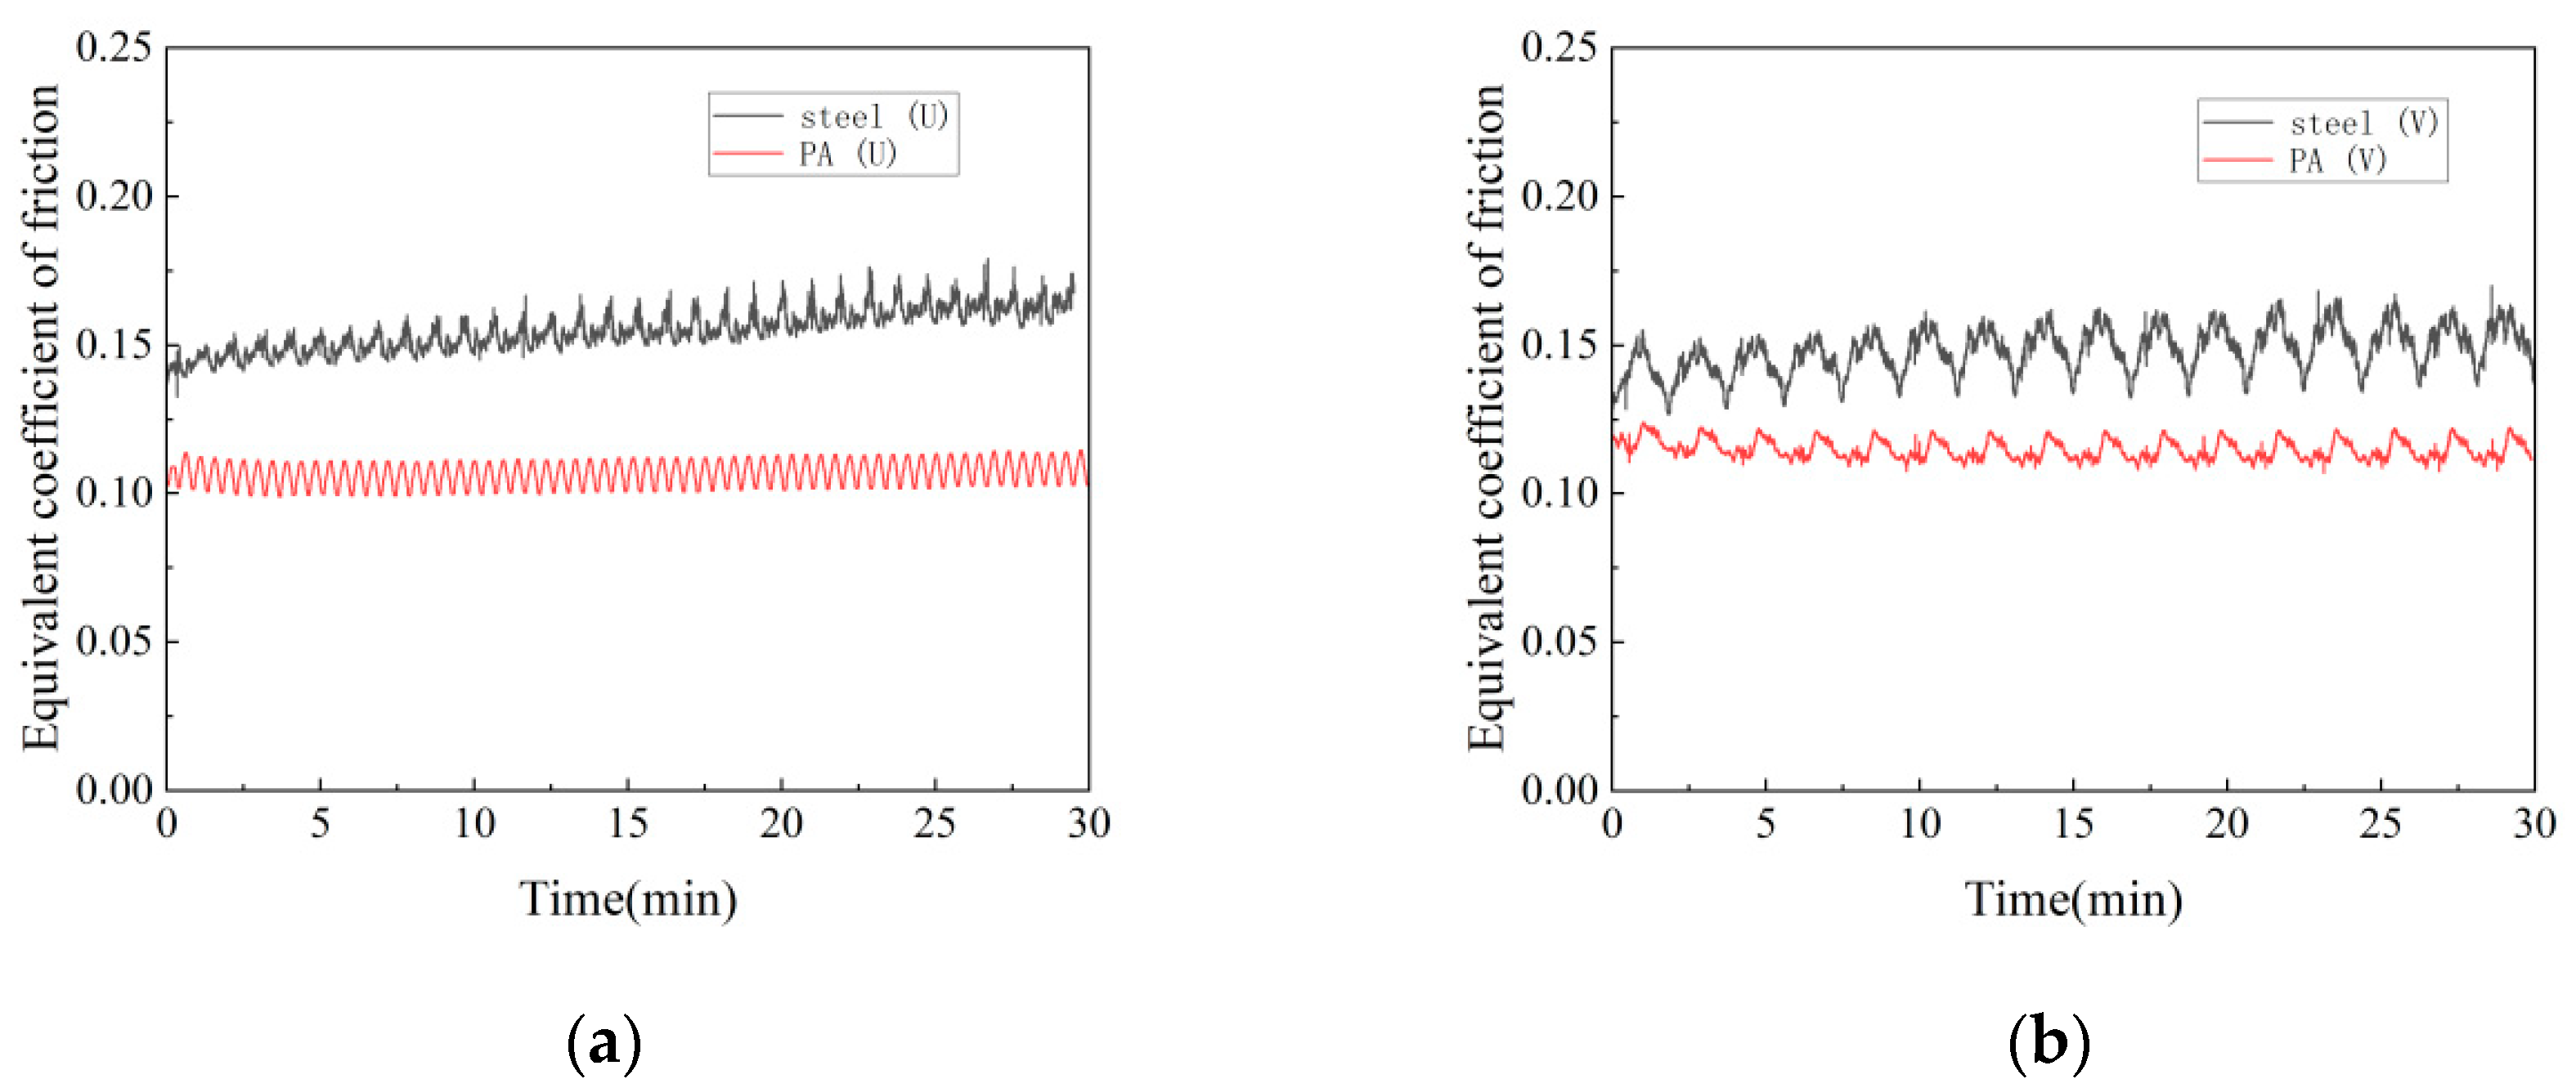
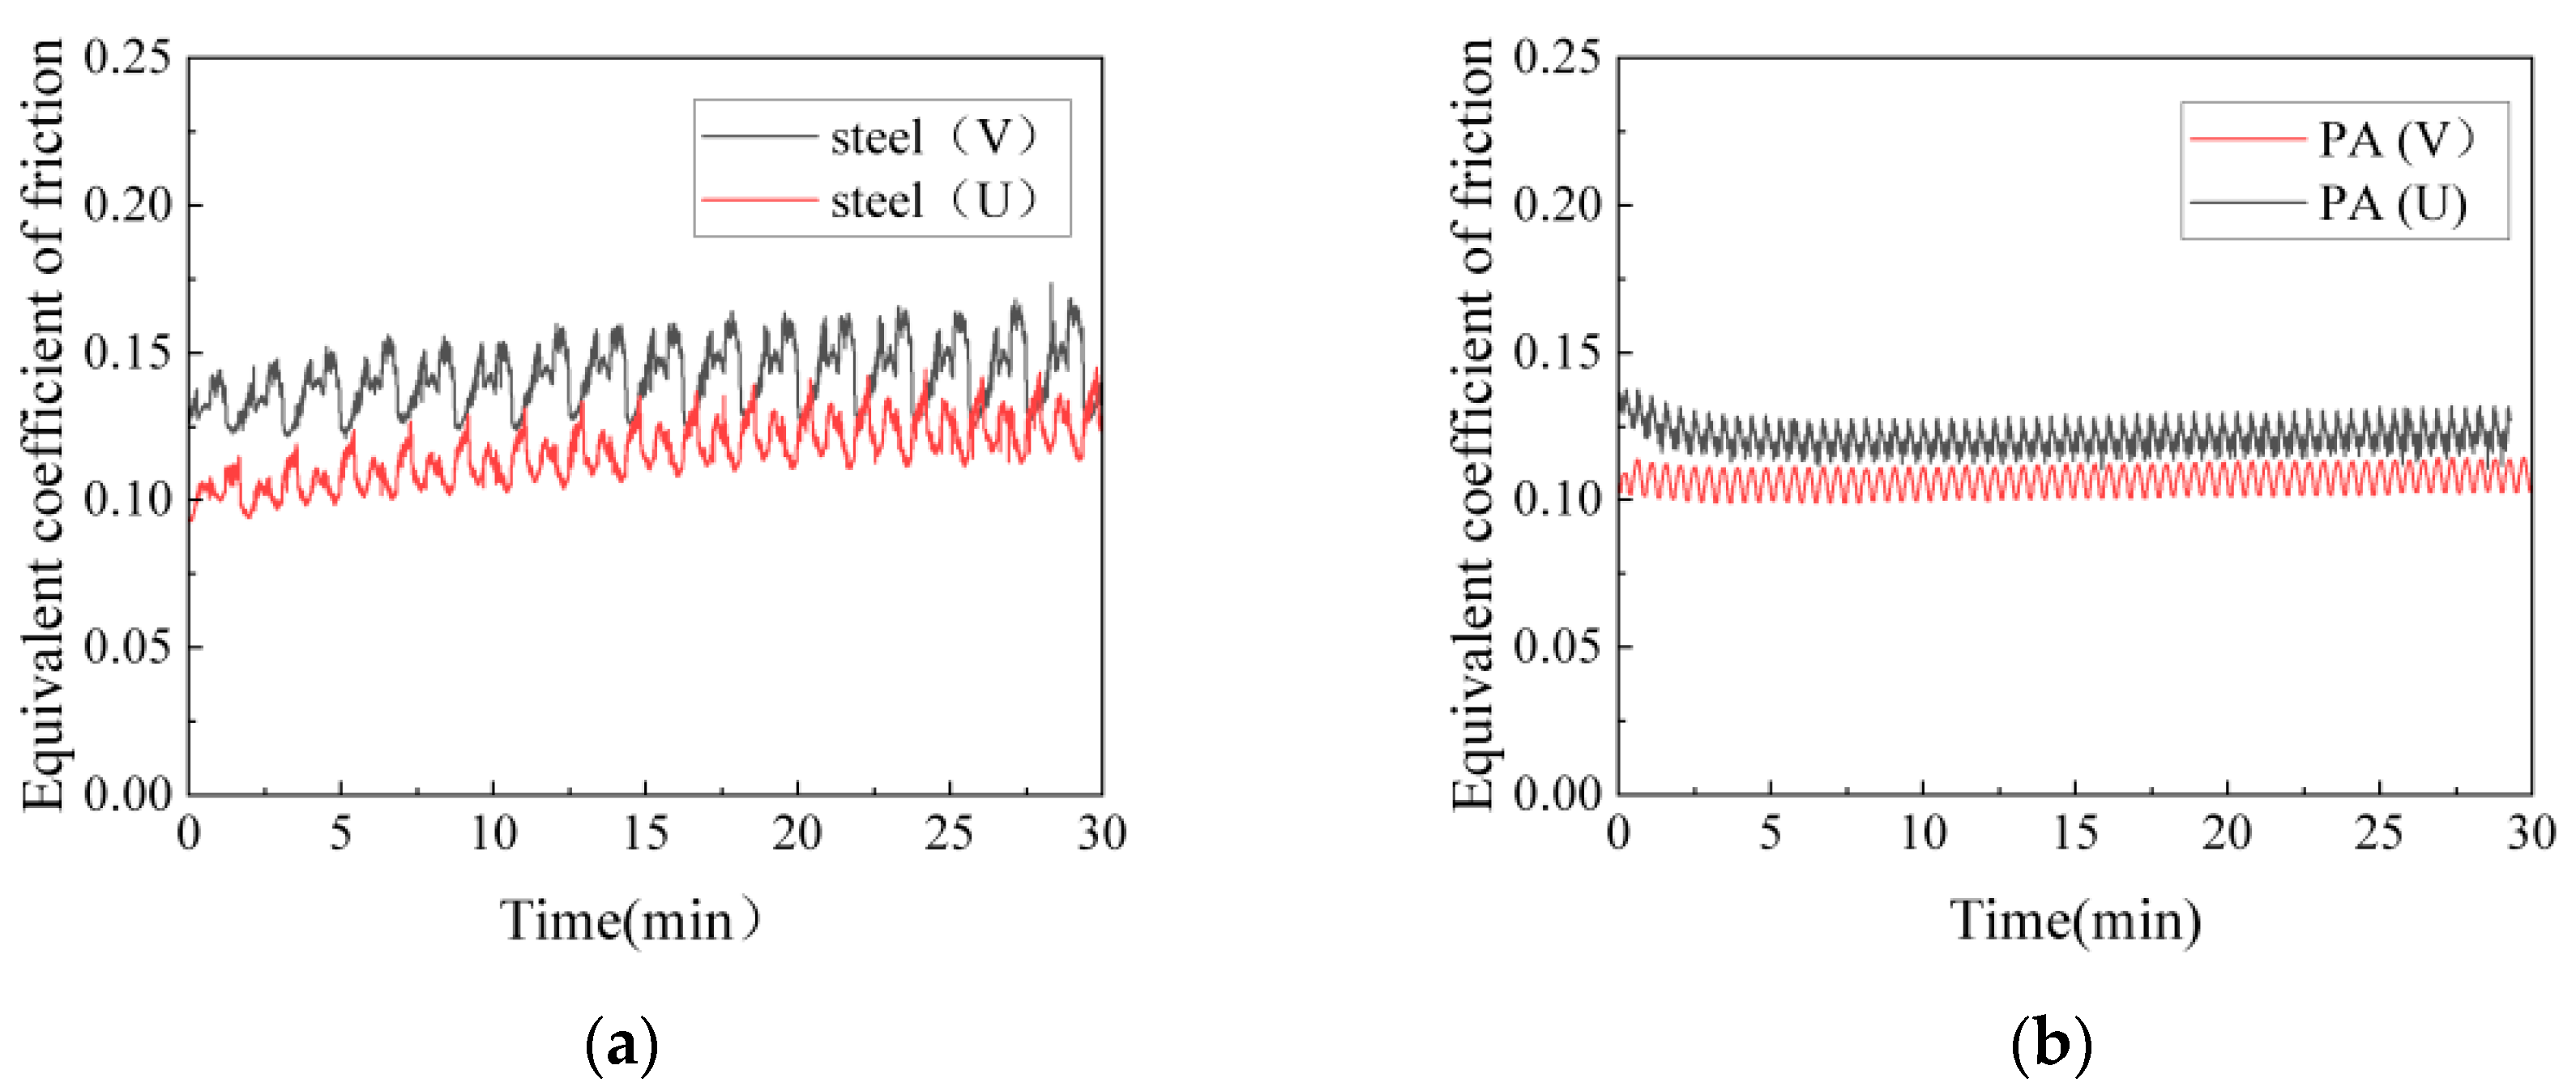
Under the same conditions of drum speed and contact angle, the influence of different gasket materials and groove types on the equivalent friction coefficient were investigated. As shown in Figure 14a, the equivalent friction coefficient of steel (U-groove) fluctuates between 0.14 and 0.17, while that of PA (U-groove) ranges from 0.10 to 0.11. From Figure 14b, the equivalent friction coefficient of steel (V-groove) varies between 0.13 and 0.16, and that of PA (V-groove) ranges from 0.11 to 0.13. The higher equivalent friction coefficient of steel compared to PA can be attributed to its greater hardness, higher surface roughness, and stronger adhesion, as shown in Table 5. (the exceptional mechanical interlocking effect generated on the surface of high-hardness steel, combined with its significantly increased actual contact area due to high surface energy, jointly promotes stronger adhesion between steel and ultra-high-molecular-weight polyethylene).
As shown in Figure 15a, the equivalent friction coefficient of the steel (V-groove) fluctuates within the range of 0.12–0.15, while that of the steel (U-groove) varies between 0.10 and 0.13. From Figure 15b, the equivalent friction coefficient of the PA (V-groove) ranges from 0.11 to 0.12, and that of the PA (U-groove) fluctuates between 0.10 and 0.11. The equivalent friction coefficient of the V-groove is slightly higher than that of the U-groove for both materials, which can be attributed to the greater contact pressure between the rope and the drum surface in the V-groove compared to that in the U-groove.

3.3. Influence of Rotational Speed on Equivalent Friction Coefficient

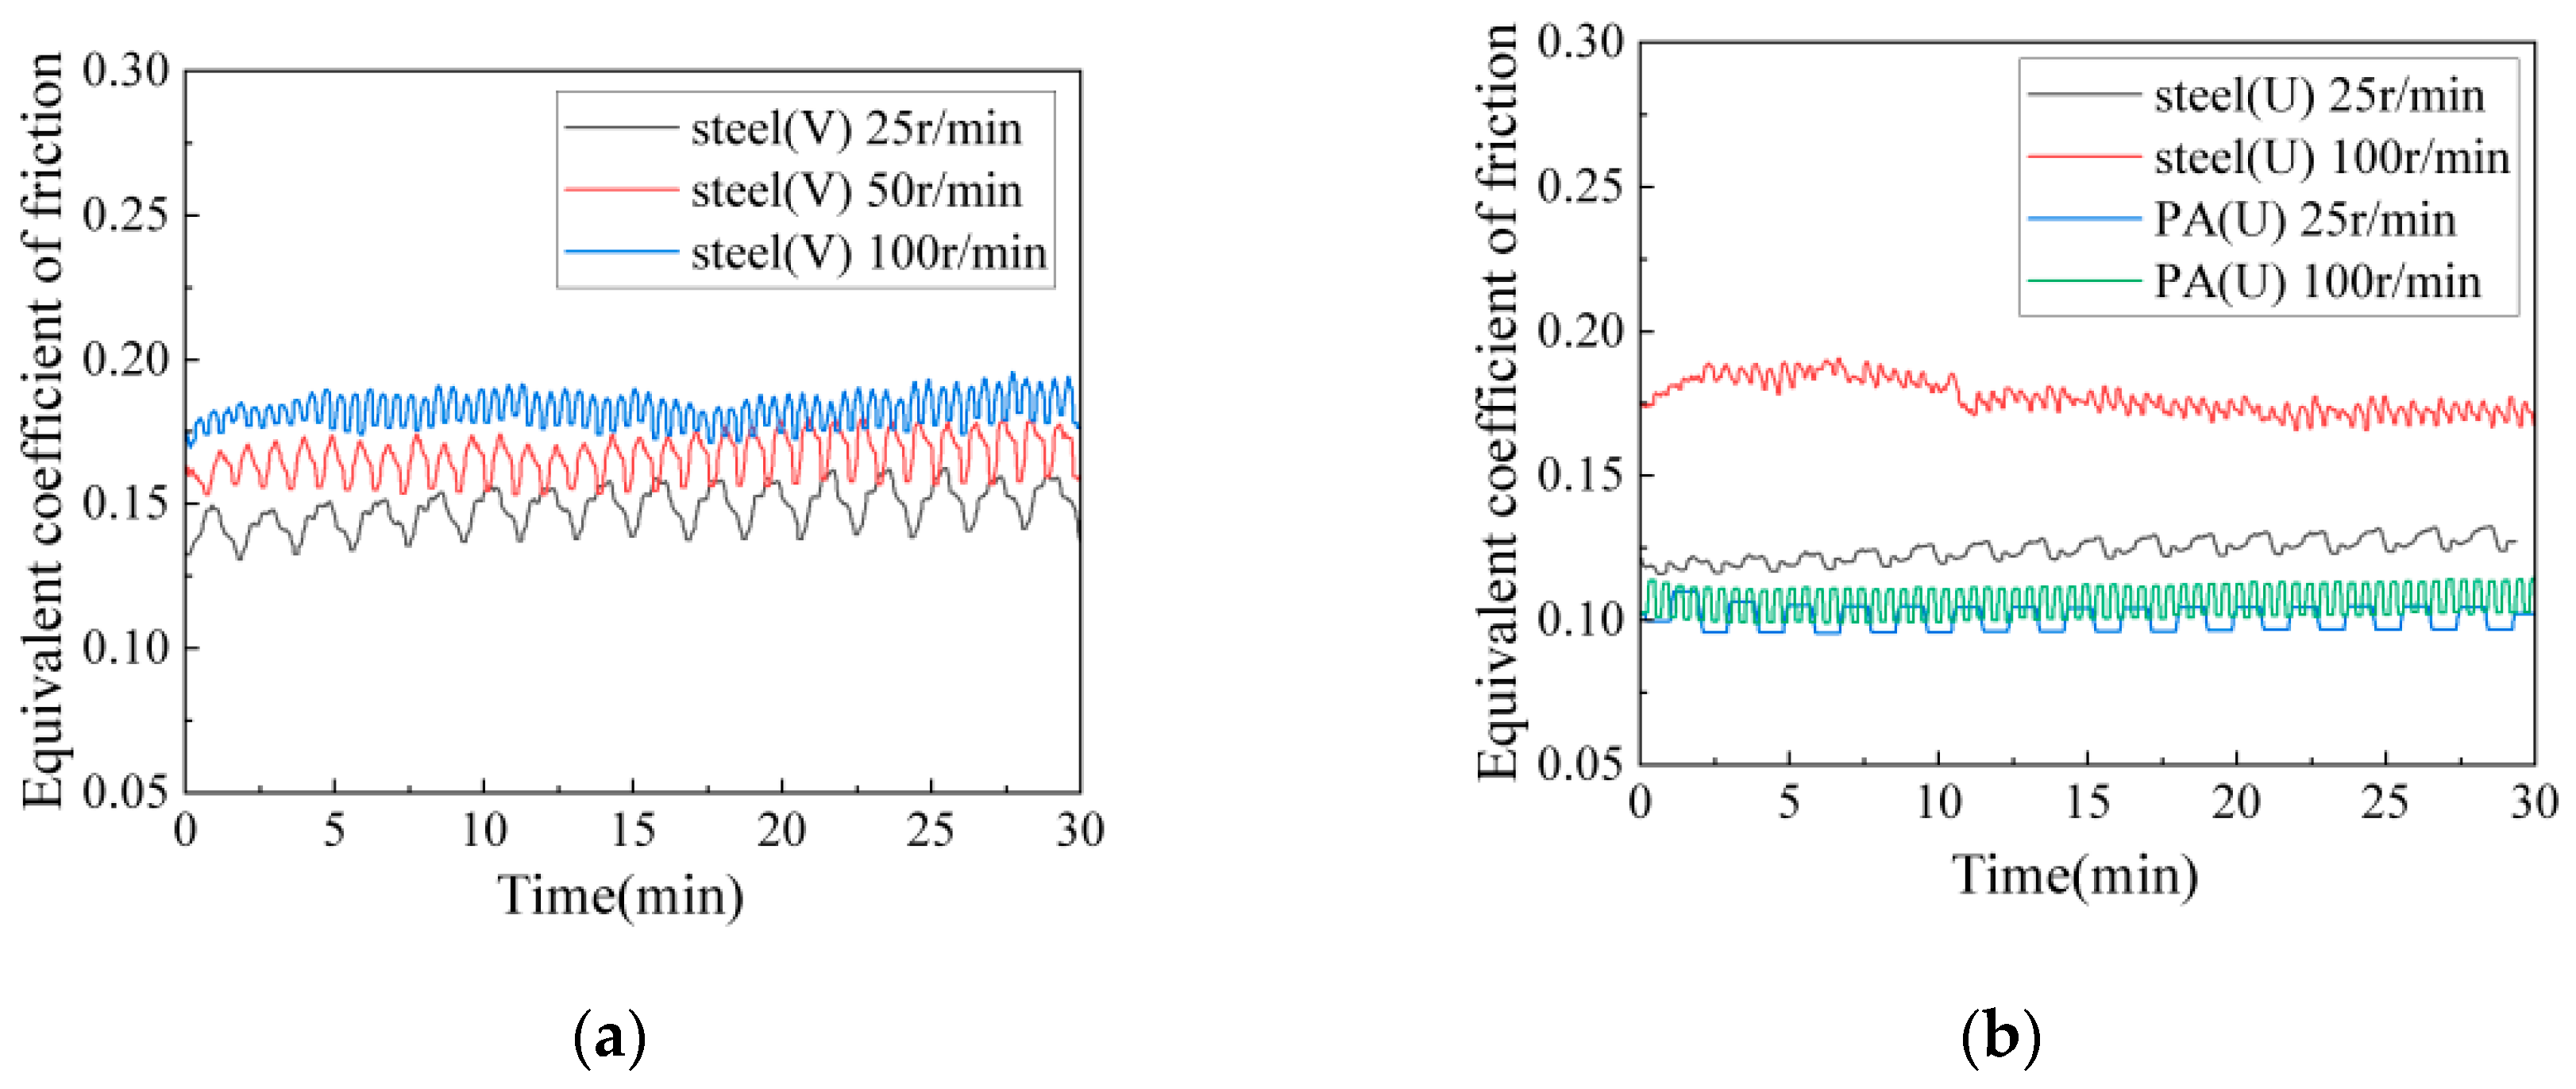
The variation in the equivalent coefficient of friction for the steel (V-groove) at different rotational speeds is discussed. And the results for both steel (U-groove) and PA (U-groove) materials at different rotational speeds are also shown. As shown in Figure 16a, during the testing time from 0 to 30 min, the equivalent friction coefficient of the steel (V-groove) fluctuated within a certain range under three rotational speed conditions. The equivalent friction coefficient fluctuated approximately around 0.14, 0.16, and 0.18 when the rotational speed was 25, 50, and 100 rpm, respectively. The results indicate that the equivalent friction coefficient increases with rotational speed. Figure 16b demonstrates a consistent trend. However, the increase in the equivalent friction coefficient was approximately 10% for the PA and about 40% for the steel.

3.4. Static Friction Coefficient

The static friction coefficient test site are shown in Figure 17.
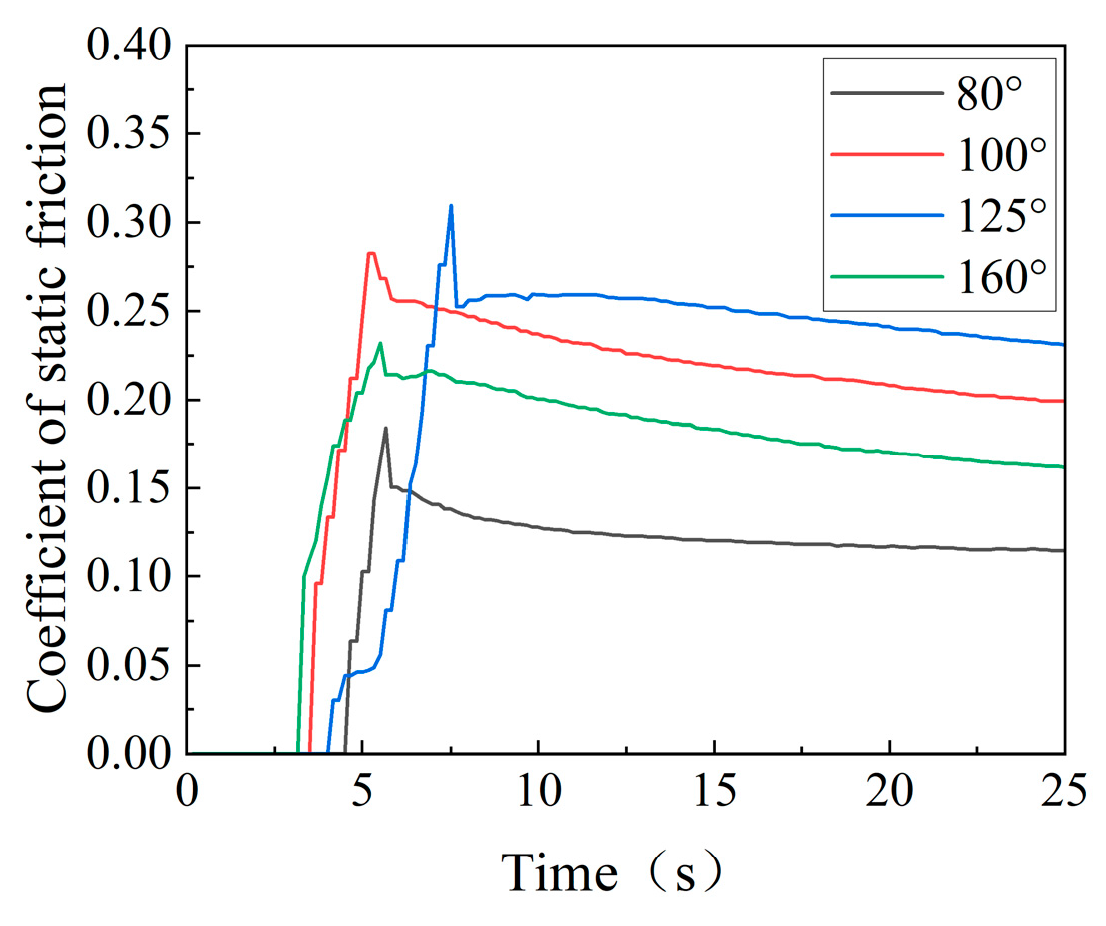
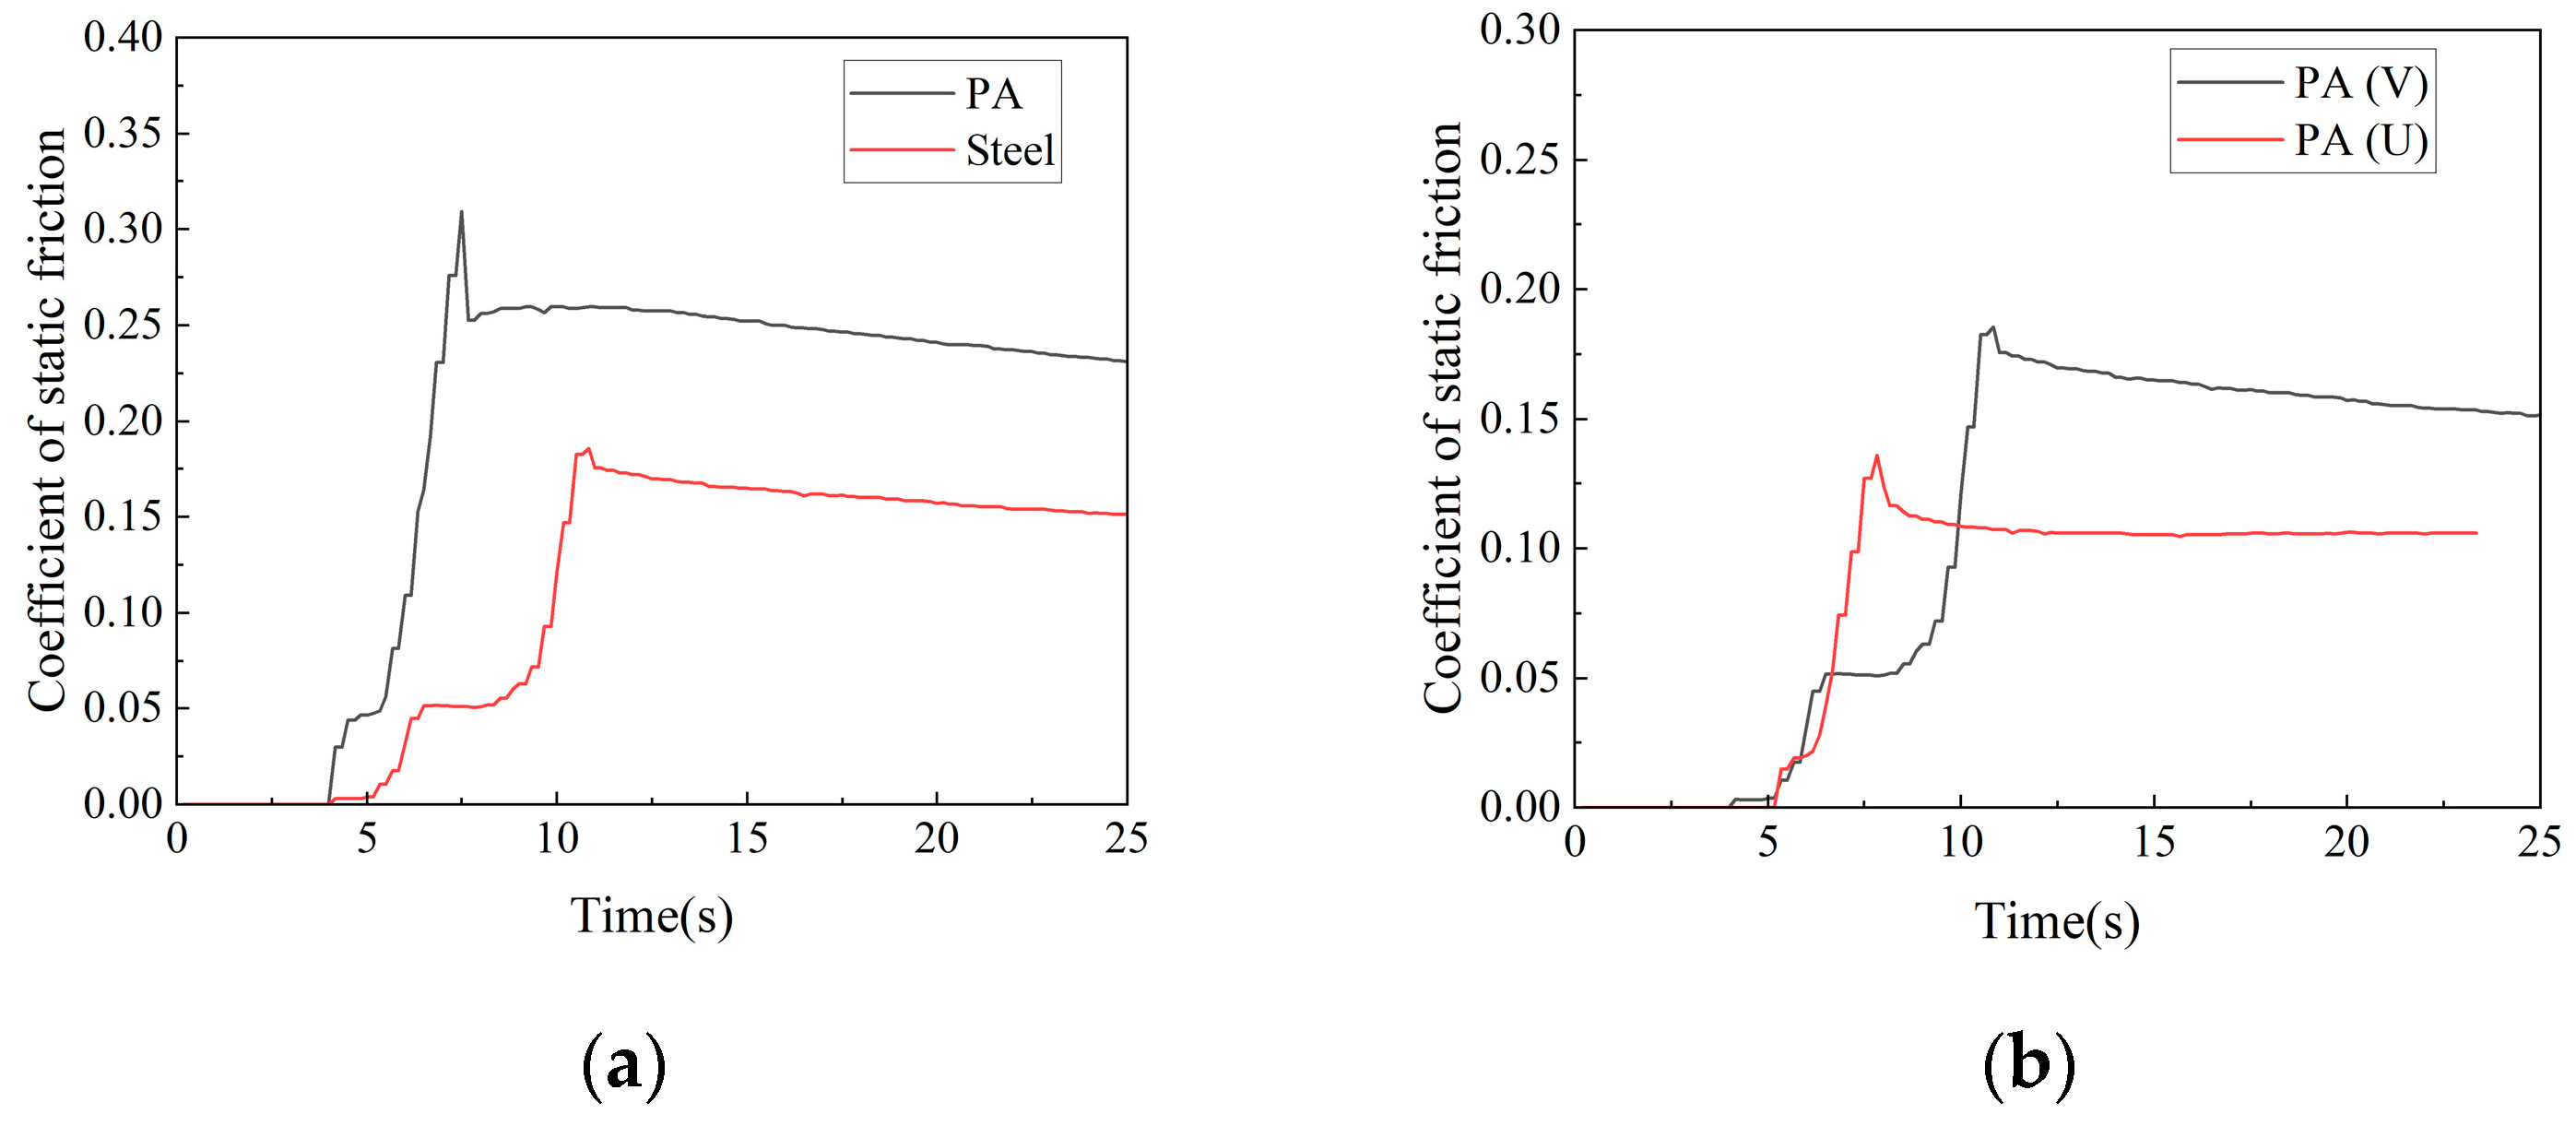
During static friction testing, after applying torque to the drum, static friction will happen between the contact surfaces of the drum and the rope. There is a trend toward relative motion between the drum and the rope, but no relative motion has occurred yet. The static friction coefficients of the PA material and steel material were calculated under different groove types and contact angles. The results are shown in Figure 18.
As shown in Figure 19, the static friction coefficient of PA material is higher than that of steel material, which roughly reflects the adhesion between materials. It should be noted that the static friction coefficient measurement here was conducted under ideal conditions, where interfacial contact dominates, highlighting the adhesion arising from close contact between polymers. In contrast, the equivalent friction coefficient test for the rope-pulley system described earlier exhibits a different trend, as the total friction force in that system is primarily determined by deformation forces influenced by material hardness and geometry.

4. Pulley Transmission Loss Experiment

To investigate the effects of different experimental conditions on the transmission efficiency of pulleys, a laser level was used to adjust the misalignment angle between the pulleys, and a magnetic particle brake was employed to apply load to the driven side to simulate variations in operational load. Through the coordinated operation of the aforementioned experimental setup, the independent adjustment of three parameters, pulley misalignment angle, load, and tension, can be achieved. The tension range of 1000–7000 N employed in the experiment constitutes a parameter interval established through proportional scaling to uncover universal principles. Each experimental condition was repeated twice, and the data reported in the text represent the average of two independent measurements. The experimental site is shown in Figure 20.
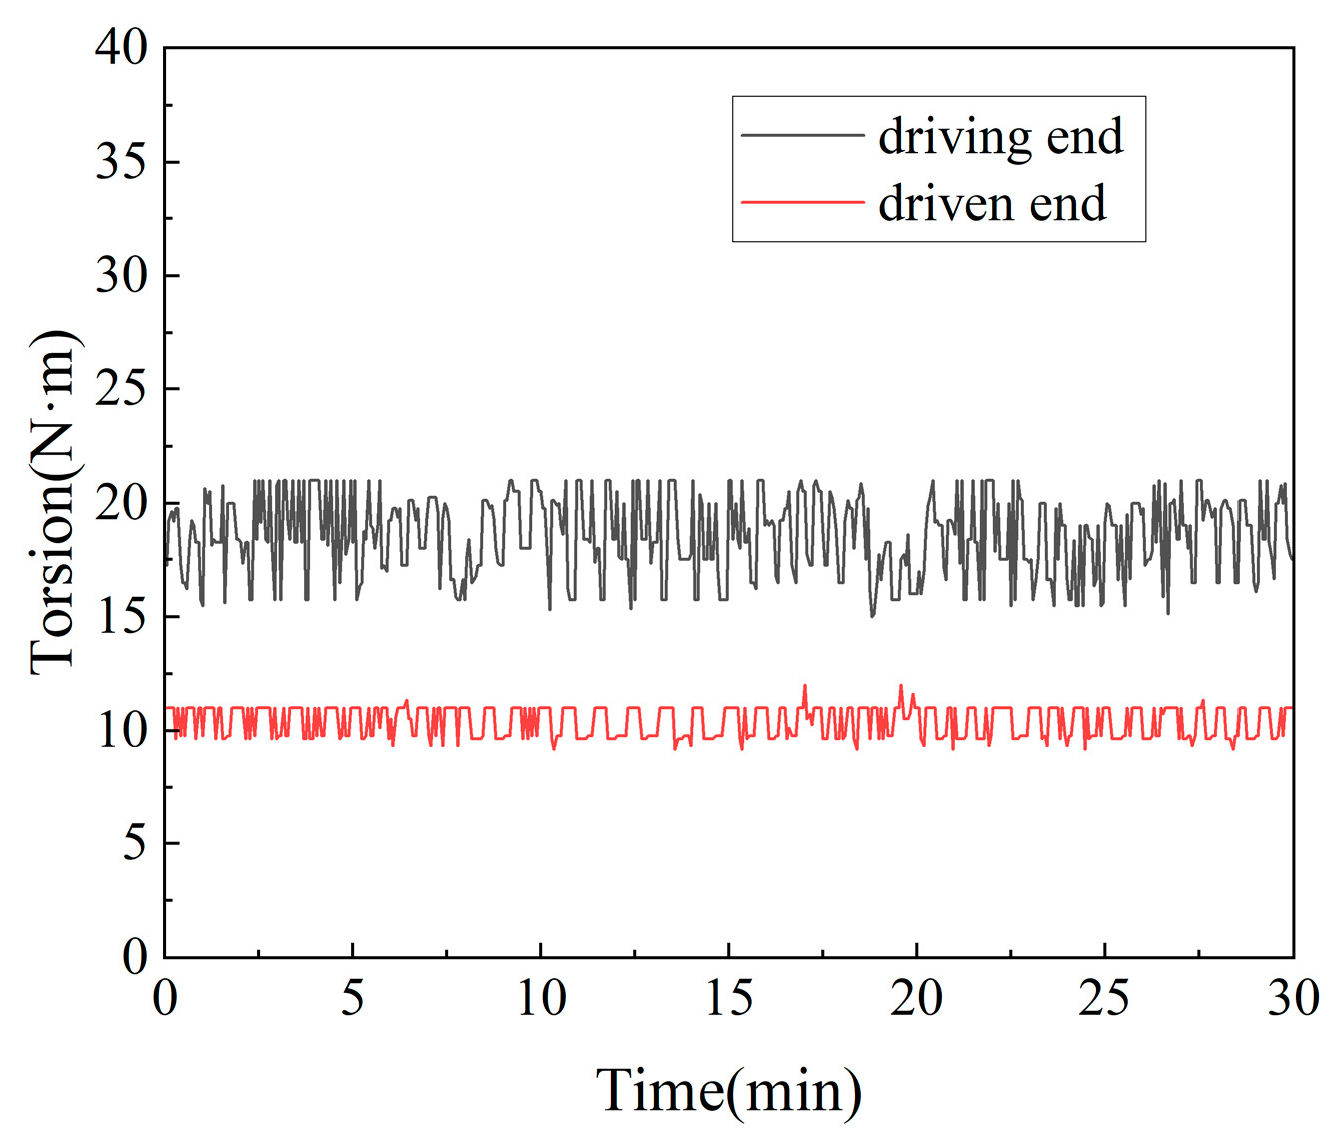
Torque sensors were utilized to collect real-time torque data from both the driving and driven ends of the pulley under various operating conditions. The mean values of the measured torque are substituted into the calculation formula to determine the transmission efficiency of the pulley. The torque results are shown in Figure 21.
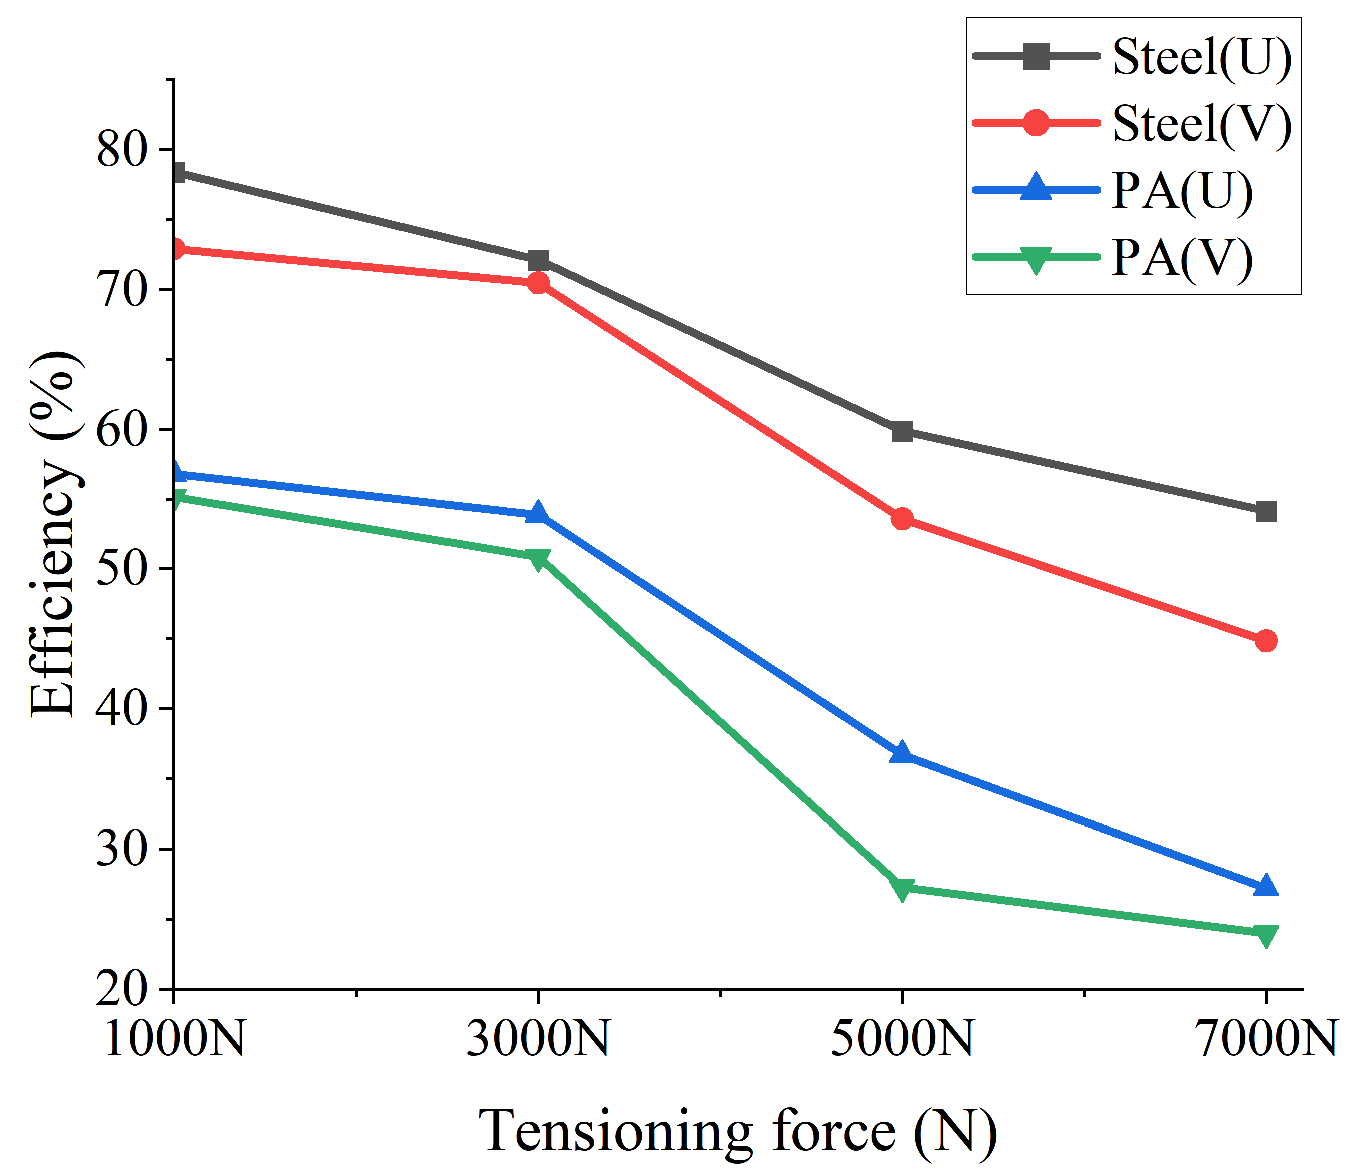
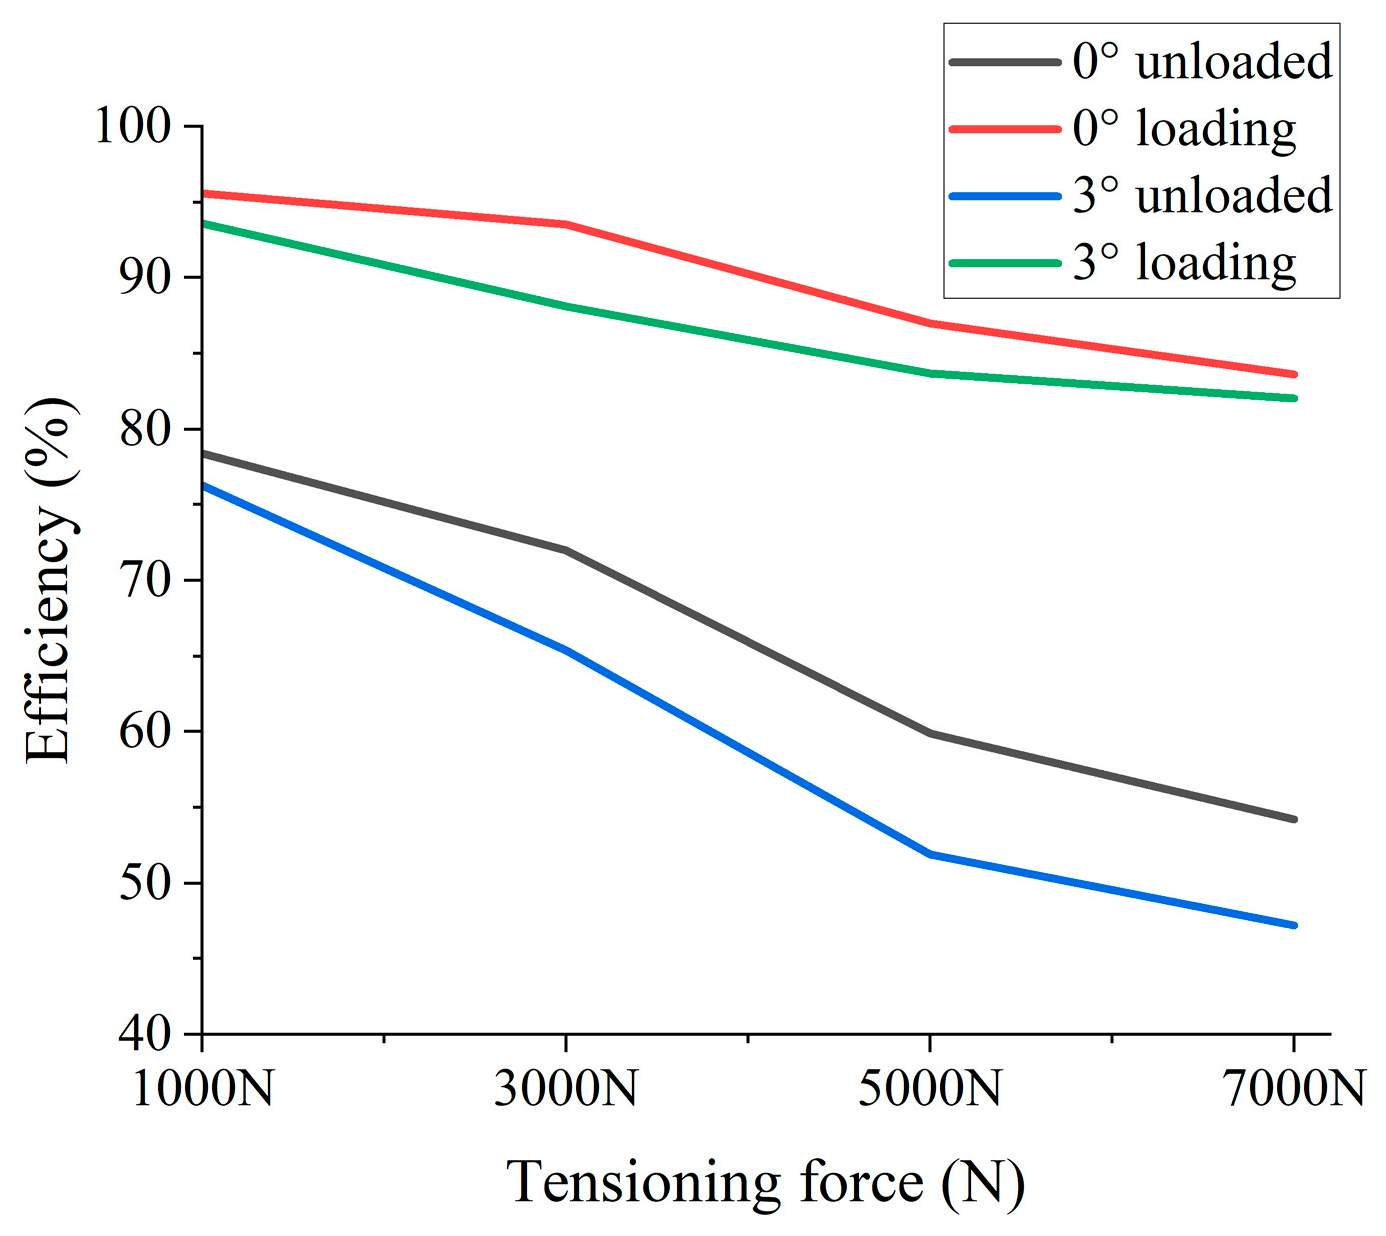
Table 6 and Table 7 show the transmission efficiency for different conditions. “Tension force” is the system’s basic setting force (1000–7000 N), used to establish contact between the rope and pulley; “Load/No-Load” refers to the additional load applied by the magnetic powder brake.
Figure 22 and Figure 23 show that the transmission efficiency of pulleys decreases with increasing tension under different operating conditions for various gasket materials and groove types. As shown in Figure 22, under the same load, deflection, and groove conditions, the transmission efficiency of steel material is about 35% higher than that of PA material when the tension increases from 1000 N to 7000 N. Under the same gasket material conditions, the transmission efficiency of U-shaped grooves is higher than that of V-shaped grooves. From Figure 23, the deflection angle will reduce the transmission efficiency of the pulley because of the force transmission path changes, and additional frictional losses or mechanical imbalances happen. An increase in load condition will significantly improve transmission efficiency.

5. Discussion

Regarding the non-monotonic trend of the coefficient of friction with contact angle: We now attribute the initial increase to the expansion of the actual contact area between the rope and pulley. However, beyond this optimum value, further increasing the contact angle may lead to excessive bending and tensile cycles in the rope, resulting in energy loss. Regarding the significant difference between steel and PA linings: Steel’s higher equivalent friction coefficient stems from its combination of high hardness and high surface energy. In contrast, PA material’s low hardness and smooth surface mitigate these effects. Additionally, the friction coefficient correlates positively with rotational speed, with steel exhibiting a higher actual rotational speed variation rate than PA material. This arises because the friction contact surface of the steel heats up more rapidly, causing surface softening and enhanced adhesion.
Regarding pulley transmission efficiency: We provide a mechanism explaining why steel exhibits lower energy loss than PA material due to its high rigidity and low internal friction characteristics. As load increases, the proportion of constant losses relative to effective output power decreases, leading to improved overall efficiency of the belt drive system. An increased deflection angle causes lateral friction losses to rise, thereby reducing transmission efficiency.
Subsequent research will focus on evaluating wear performance: developing a life testing protocol to simulate actual operating conditions, using component wear as the criterion for determining service life, comparing the durability of steel and PA materials, and analyzing the wear characteristics of ultra-high-molecular-weight polyethylene ropes. Final test data will be processed using artificial intelligence and machine learning methods.

6. Conclusions

This paper mainly introduces a design process and experimental study on a multifunctional friction test bench, which is used to determine the friction coefficient and pulley transmission efficiency of the rope–drum system for high-altitude wind power generation systems. The structure design and working principle of the test bench are provided. Static simulation analysis of the test bench is also completed, the results of which meet the strength standards.
As the contact angle increases, the friction coefficient shows a trend of first increasing and then decreasing. And the results will gradually decrease after exceeding a specific contact angle. The friction coefficient of steel is higher than that of PA material. The contact pressure of V-shaped grooves is higher than that of U-shaped grooves, and the equivalent friction coefficient is also slightly higher. In addition, the friction coefficient is positively correlated with the rotational speed, and the actual rate of change in rotational speed of steel is higher than that of PA material.
The test results of pulley transmission efficiency show that the energy loss of steel is lower than that of PA material. The transmission efficiency of U-shaped grooves is better than that of V-shaped grooves. An increase in deflection angle will lead to increased lateral friction loss, thereby reducing transmission efficiency. The increase in load can improve the transmission efficiency of the pulley system.
Equivalent friction coefficient experiments and pulley transmission loss tests demonstrate that steel U-groove gaskets represent the optimal choice—combining high traction with low energy loss for ideal performance.

Author Contributions

Conceptualization, D.L. and W.S.; methodology, D.L., W.S., H.J., X.X. and J.L.; software, W.S. and A.S.; validation, D.L., W.S. and A.S.; formal analysis, D.L., W.S. and A.S.; investigation, D.L., W.S. and A.S.; resources, D.L., H.J. and J.L.; data curation, D.L. and W.S.; writing—original draft preparation, D.L., W.S. and A.S.; writing—review and editing, D.L. and X.X.; visualization, D.L.; supervision, D.L.; project administration, D.L. and X.X.; funding acquisition, D.L. and X.X. All authors have read and agreed to the published version of the manuscript.

Funding

The work was funded by the National Natural Science Foundation of China (Grant No. 52575053), Science and Technology Research Program of Chongqing Municipal Education Commission (Grant No. KJZD-M202400705), Natural Science Foundation Innovation and Development Joint Fund (Municipal Education Commission) Project of Chongqing City (Grant No. CSTB2023NSCQ-LZX0127).

Data Availability Statement

The original contributions presented in this study are included in the article. Further inquiries can be directed to the corresponding author.

Conflicts of Interest

The authors declare no conflicts of interest.

References

  1. Archer, C.L.; Caldeira, K. Global assessment of high-altitude wind power. Energies 2009, 2, 307–319. [Google Scholar] [CrossRef]
  2. Kheiri, M.; Victor, S.; Rangriz, S.; Karakouzian, M.M.; Bourgault, F. Aerodynamic performance and wake flow of crosswind kite power systems. Energies 2022, 15, 2449. [Google Scholar] [CrossRef]
  3. Ren, G.; Liu, J.; Wan, J.; Guo, Y.; Yu, D. Overview of wind power intermittency: Impacts, measurements, and mitigation solutions. Appl. Energy 2017, 204, 47–65. [Google Scholar] [CrossRef]
  4. Ali, Q.S.; Kim, M.H. Design and performance analysis of an airborne wind turbine for high-altitude energy harvesting. Energy 2021, 230, 120829. [Google Scholar] [CrossRef]
  5. Chen, S.; Zhang, K.; Chen, Z.; Xu, H.; Shi, H. Mechanical characterization of large diameter UHMWPE ropes under quasi-static tensile loading: An experimental study. Structures 2024, 69, 107447. [Google Scholar] [CrossRef]
  6. Ye, H.; Li, W.; Lin, S.; Ge, Y.; Han, F.; Sun, Y. Experimental investigation of spooling test on the multilayer oceanographic winch with high-performance synthetic fibre rope. Ocean. Eng. 2021, 241, 110037. [Google Scholar] [CrossRef]
  7. Ye, H.; Li, W.; Zhang, H.; Lin, S.; Zhang, D.; Ge, Y.; Li, Z. Experimental evaluation of dimension-stable synthetic fibre rope under investigation of spooling test on the multilayer winch drum. Ocean. Eng. 2023, 279, 114585. [Google Scholar] [CrossRef]
  8. Xu, S.; Wang, S.; Liu, H.; Zhang, Y.; Li, L.; Soares, C.G. Experimental evaluation of the dynamic stiffness of synthetic fibre mooring ropes. Appl. Ocean. Res. 2021, 112, 102709. [Google Scholar] [CrossRef]
  9. Han, G.; Tao, X.; Li, X.; Jiang, W.; Zuo, W. Study of the mechanical properties of ultra-high molecular weight polyethylene fiber rope. J. Eng. Fibers Fabr. 2016, 11, 155892501601100103. [Google Scholar] [CrossRef]
  10. Zhou, J.; Wang, X.; Xie, J.; Wu, R.; Huang, H.; He, W.; Wu, Z. A novel fiber-reinforced polymer rope: Concept design and experimental evaluation. Eng. Struct. 2024, 305, 117775. [Google Scholar] [CrossRef]
  11. Schumann, P.; Zöllner, R.; Schmidt, T. A new model and alternative solutions for the description of double layered flexible elements wrapped around a cylinder. Mech. Mach. Theory 2022, 172, 104823. [Google Scholar] [CrossRef]
  12. Mao, S.; Tao, J.; Xie, J.; Xu, S.; Chen, L.; Yu, H.; Liu, C. A data-driven approach for modifying the rope dynamics model of the flexible hoisting system. J. Low Freq. Noise Vib. Act. Control. 2023, 42, 1055–1070. [Google Scholar] [CrossRef]
  13. Kim, J.W.; Joo, B.S.; Jang, H. The effect of contact area on velocity weakening of the friction coefficient and friction instability: A case study on brake friction materials. Tribol. Int. 2019, 135, 38–45. [Google Scholar] [CrossRef]
  14. Li, G.; Li, W.; Ye, H.; Li, H.; Ge, Y.; Lin, S. Experimental study on cyclic-bend-over-sheave (CBOS) characteristics of an HMPE fibre rope under dynamic loading. Appl. Ocean. Res. 2023, 138, 103642. [Google Scholar] [CrossRef]
  15. Torres Charry, G.; Gómez Mendoza, J.B. An experimental test bench for cable-driven transmission. Machines 2021, 9, 83. [Google Scholar] [CrossRef]
  16. Hrabovský, L.; Učeň, O.; Kudrna, L.; Čepica, D.; Frydrýšek, K. Laboratory device detecting tensile forces in the rope and coefficient of friction in the rope sheave groove. Machines 2022, 10, 590. [Google Scholar] [CrossRef]
  17. Hrabovský, L.; Fries, J.; Kudrna, L.; Gaszek, J. Determination of the Coefficient of Friction in a Pulley Groove by the Indirect Method. Coatings 2022, 12, 606. [Google Scholar] [CrossRef]
  18. Chang, X.; Peng, Y.; Zhu, Z.; Cheng, D.Q.; Lu, H.; Tang, W.; Chen, G.A. Tribological behavior and mechanical properties of transmission wire rope bending over sheaves under different sliding conditions. Wear 2023, 514, 204582. [Google Scholar] [CrossRef]
  19. Chang, X.; Peng, Y.; Zhu, Z.; Lu, H.; Tang, W.; Zhang, X. Sliding friction and wear characteristics of wire rope contact with sheave under long-distance transmission conditions. Materials 2022, 15, 7092. [Google Scholar] [CrossRef]
  20. Nakazawa, D.; Watanabe, S.; Fukui, D.; Fujii, A.; Miyakawa, K. Elevator Rope Tension Analysis with Uneven Groove Wear of Sheave. J. Phys. Conf. Ser. 2018, 1048, 012006. [Google Scholar] [CrossRef]
  21. Zhao, T.; Qi, Z.; Wang, G.; Wang, T.; Xu, J. An analysis method for rope-driven multibody systems with pulley blocks. J. Mech. Sci. Technol. 2024, 38, 6471–6487. [Google Scholar] [CrossRef]
  22. Bukvić, M.; Milojević, S.; Gajević, S.; Đorđević, M.; Stojanović, B. Production Technologies and Application of Polymer Composites in Engineering: A Review. Polymers 2025, 17, 2187. [Google Scholar] [CrossRef] [PubMed]
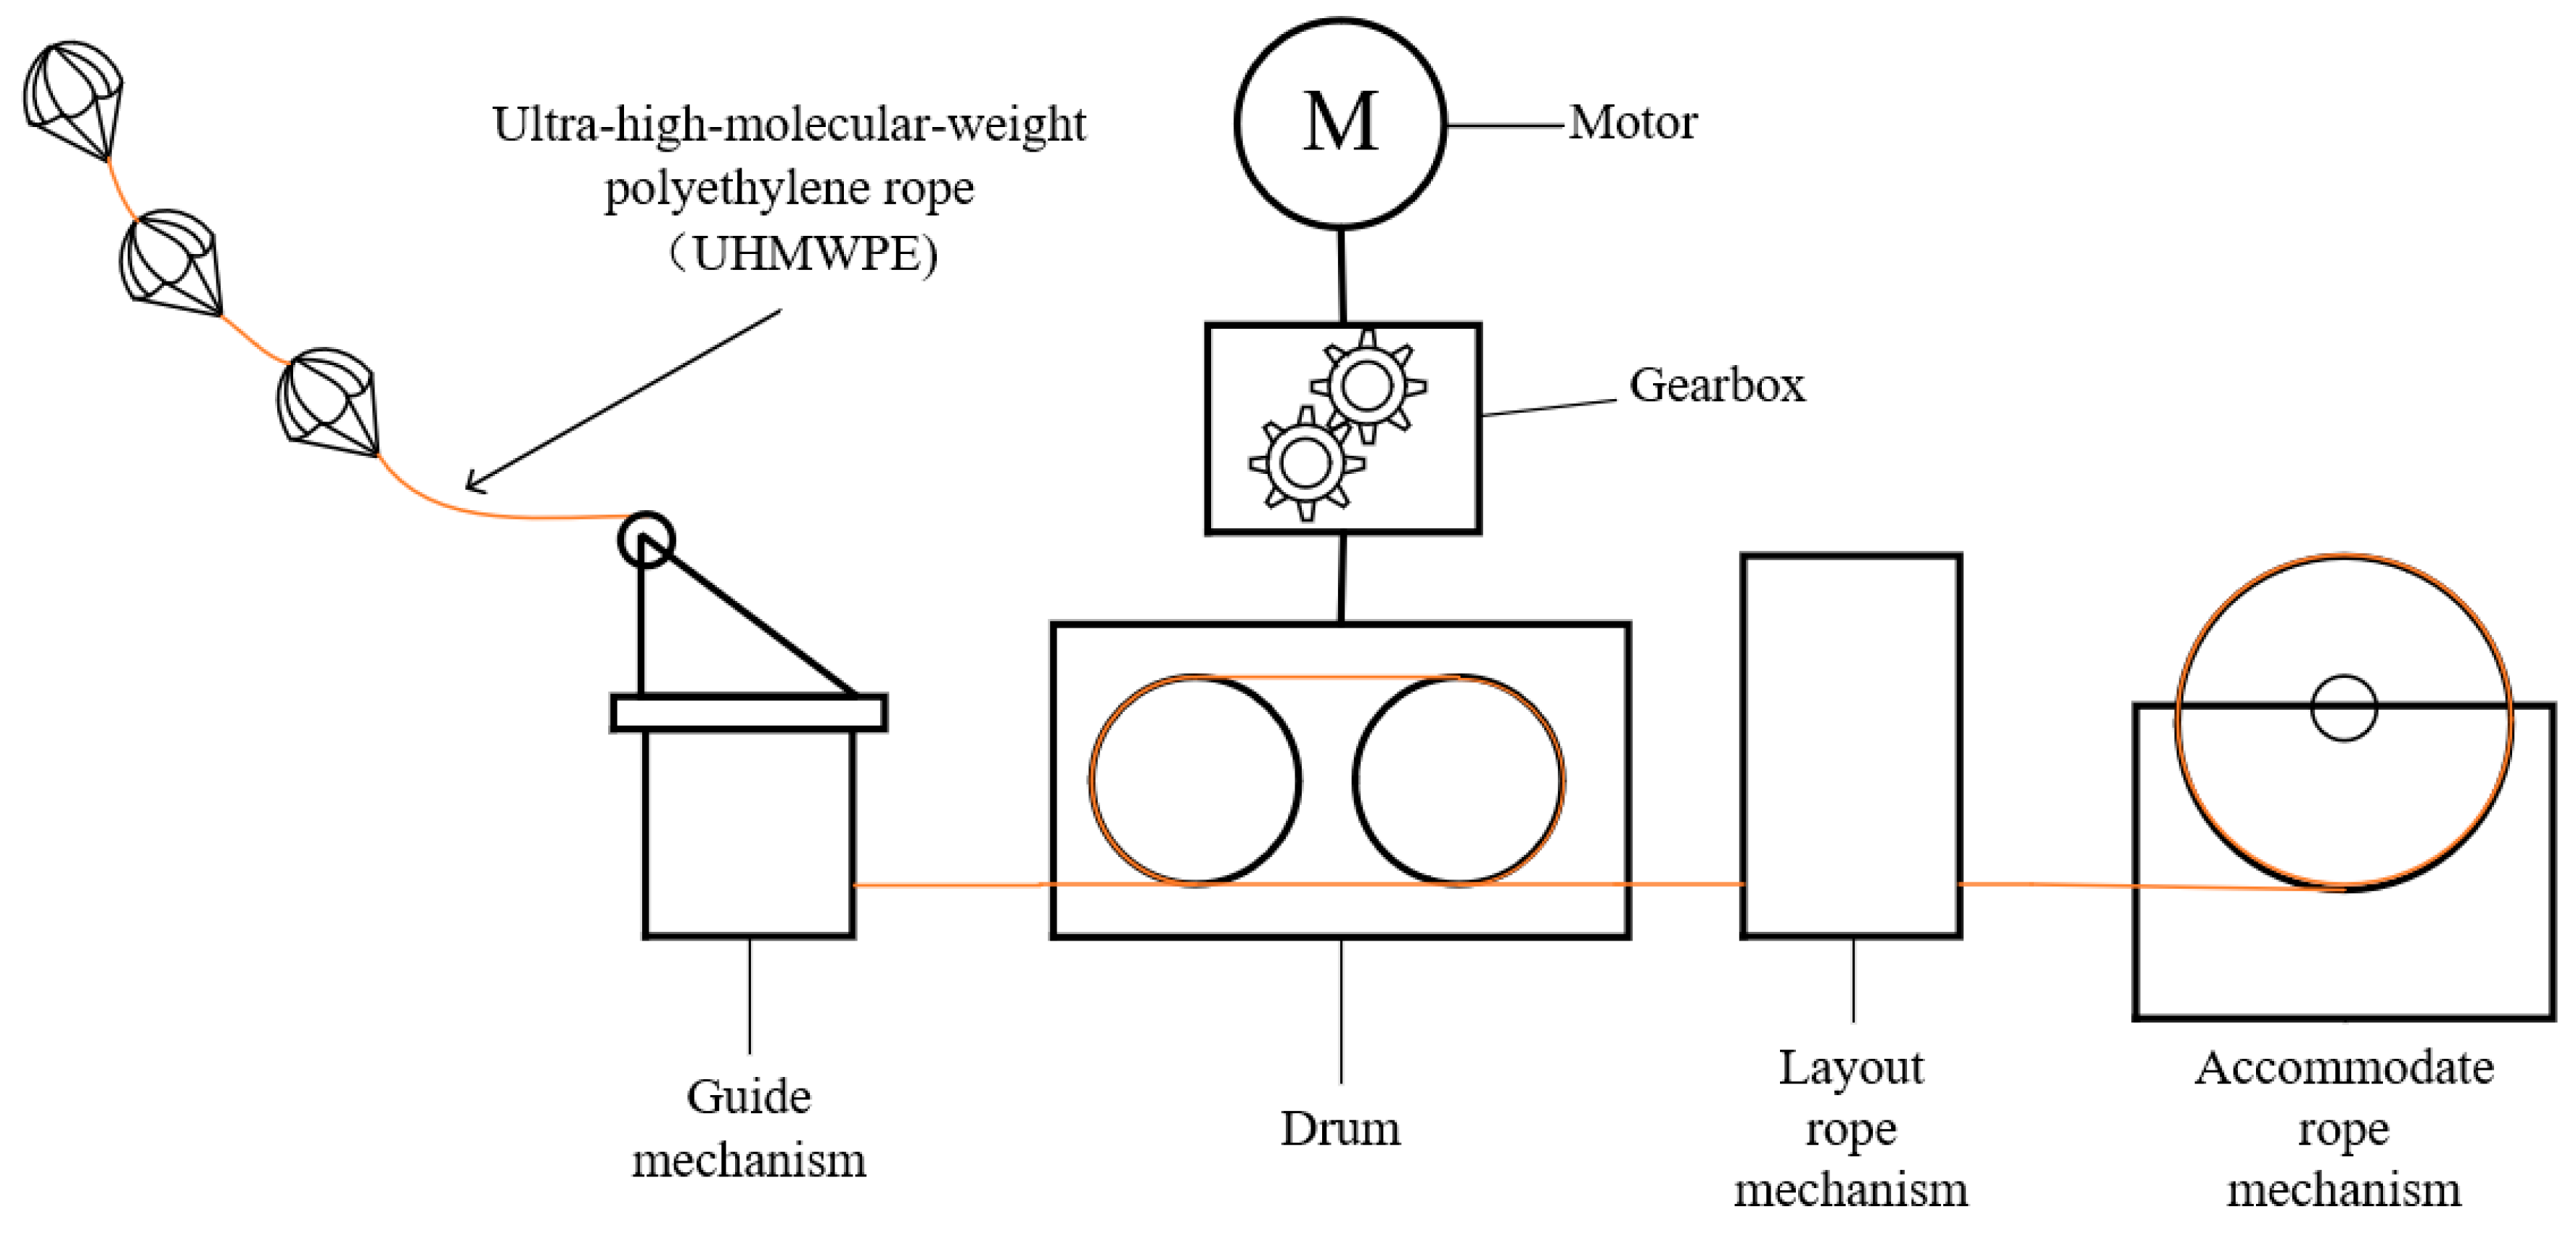
Figure 1. Ground equipment systems for high-altitude wind power generation.
Energies 18 06079 g001
Figure 2. Design framework for experimental testing platform.
Energies 18 06079 g002
Figure 3. Overall structural model of test bench: (a) 1—hydraulic loading device; 2—package angle adjustment device; 3—reel; 4—reel frame; 5—electromagnetic clutch; 6—gearbox; 7—coupling; 8—torque sensor; 9—servomotor; 10—pulley; 11—cross sliding table; 12—magnetic powder brake; 13—radial displacement device. (b) Friction coefficient measurement test. (c) Transmission loss test.
Energies 18 06079 g003
Figure 4. Loading devices. (a) Hydraulic loading system: 1—support bracket; 2—hydraulic cylinder; 3—moving slide; 4—contact angle adjuster; 5—pressure block; 6—tension sensor; 7—snap. (b) Magnetic particle brake.
Energies 18 06079 g004
Figure 5. Power module: (a) Servo motor, (b) cross slide power motor.
Energies 18 06079 g005
Figure 6. Test module: (a) Drum, (b) pulley.
Energies 18 06079 g006
Figure 7. Schematic diagram of test system.
Energies 18 06079 g007
Figure 8. Control module: (a) PC control system, (b) electromagnetic clutch control button, (c) left hydraulic cylinder control button, (d) right hydraulic cylinder control button, (e) hydraulic machine emergency stop button, (f) reset button, (g) magnetic particle brake control cabinet.
Energies 18 06079 g008
Figure 9. Equivalent stress results of static strength analysis: (a) Gearbox seat, (b) torque transducer seat, (c) column, (d) drum seat.
Energies 18 06079 g009
Figure 10. Physical image of the test bench.
Energies 18 06079 g010
Figure 11. Different contact angle settings for (a) 80°, (b) 100°, (c) 125°, (d) 160°.
Energies 18 06079 g011
Figure 12. Influence of contact angle on equivalent friction coefficient: (a) under four different contact angles, (b) interpolation of the equivalent friction coefficient.
Energies 18 06079 g012
Figure 13. Groove type and lining material situation.
Energies 18 06079 g013
Figure 14. Influence of gasket material on equivalent friction coefficient: (a) different grooves in steel material, (b) different grooves in PA material.
Energies 18 06079 g014
Figure 15. Influence of groove type on equivalent friction coefficient: (a) U-groove, (b) V-groove.
Energies 18 06079 g015
Figure 16. Influence of rotational speed on equivalent friction coefficient: (a) different rotational speeds, (b) different speeds for gasket materials.
Energies 18 06079 g016
Figure 17. Static friction coefficient testing site.
Energies 18 06079 g017
Figure 18. Static friction coefficient result.
Energies 18 06079 g018
Figure 19. Static friction coefficient: (a) Different gasket materials, (b) different groove types.
Energies 18 06079 g019
Figure 20. Experimental site of transmission efficiency of pulleys: (a) Test bench pulley end, (b) deviation angle at both ends of the pulley.
Energies 18 06079 g020
Figure 21. Torque values at diving and driven ends.
Energies 18 06079 g021
Figure 22. Influence of different factors on the loss of pulley transmission: material and groove type.
Energies 18 06079 g022
Figure 23. Influence of different factors on pulley transmission loss: load and deflection.
Energies 18 06079 g023
Table 1. Transmission system characteristic parameters.
Equipment NameModelTechnical Specifications/Parameters
Servo Motor
(Innovance Technology Co., Ltd., Suzhou, China)
MS1H3-55C15CDRated power: 5.5 kW; Rated speed: 1500 rpm;
Gearbox
(LinoDa Transmission Technology Co., Ltd. Hangzhou, China)
K97-47.93Gear ratio: 47.93; Transmission efficiency: >95%
Speed and Torque Sensor
(Bengbu Dayang Sensing System Engineering Co., Ltd., Bengbu, China)
DYN-200Range: ±1000 N·m Accuracy: 0.1% of full scale
Tension Sensor
(Bengbu Dayang Sensing System Engineering Co., Ltd., Bengbu, China)
DYLY-101Range: ±10,000 N; Accuracy: 0.03% of full scale
Magnetic Powder Brake
(Haibo Hua Technology Co., Ltd., Beijing, China)
CZ-100Rated torque: 1000 N·m; Slip power: 18 kW
Electromagnetic Clutch
(Jietai Transmission Machinery Manufacturing Co., Ltd., Tianjin, China)
DLY0-100AOperating voltage: 24 V; Transmission torque: 1000 N·m
Table 2. Experimental Test Conditions.
Test ProjectControlled/Varied Parameters Levels/Range
Friction coefficient measurement testGasket materialSteel, Polyamide (PA)
Groove typeU-groove, V-groove
Rotational speed25, 50, 100 r/min
Contact angle80°, 100°, 125°, 160°
Transmission loss testGasket materialSteel, Polyamide (PA)
Groove typeU-groove, V-groove
Rotational speed100, 150, 200 r/min
Tension force 1000, 3000, 5000, 7000 N
Load conditionNo-load, Load
Deviation angle0°, 3°
Table 3. Material properties of UHMWPE rope.
ParameterValue
Diameter/mm10
Density/(g/cm3)0.97
Tensile strength/kN60
Modulus of elasticity/GPa110
Table 4. Q235 material properties.
ItemValue
Tensile strength of materials (MPa)460
Yield strength of material (MPa)250
Density (kg/m−3)7850
Modulus of elasticity (MPa)2 × 10⁵
Pine-to-cedar ratio0.3
Table 5. Comparison of properties between steel and PA materials.
CharacteristicsSteel MaterialsPA Material
HardnessHRC 45–60~100 R Scale
Surface roughnessRa 0.4–1.6 μmRa 0.2–0.8 μm
Table 6. Transmission efficiency for different tensions, gasket materials and groove types.
Tensioning Force [N]Gasket MaterialGroove TypeEfficiency
1000SteelU78.4%
300072.0%
500059.9%
700054.2%
1000V72.9%
300070.5%
500053.6%
700044.9%
1000PAU56.8%
300053.5%
500036.7%
700027.2%
1000V55.2%
300050.9%
500027.3%
700024.0%
Table 7. Transmission efficiency for different deviation angles and load conditions.
Tensioning Force [N]No Deviation Angle/Deviation AngleNo-Load/LoadEfficiency
1000No-load78.4%
300072.0%
500059.9%
700054.2%
1000Load95.6%
300093.5%
500087.0%
700083.6%
1000No-load76.3%
300065.4%
500051.9%
700047.2%
1000Load93.6%
300088.1%
500083.7%
700082.0%
Disclaimer/Publisher’s Note: The statements, opinions and data contained in all publications are solely those of the individual author(s) and contributor(s) and not of MDPI and/or the editor(s). MDPI and/or the editor(s) disclaim responsibility for any injury to people or property resulting from any ideas, methods, instructions or products referred to in the content.