Abstract
Defending power systems against a high-altitude electromagnetic pulse (HEMP) requires accurately assessing its impact on critical equipment. This paper presents a method integrating theoretical analysis, deep neural networks (DNNs), critical thresholds for primary equipment, and the minimum path method to quantitatively assess the failure probabilities of critical equipment and their effects on a 10 kV distribution network. The analysis of HEMP impact on power distribution networks can be completed within several tens of seconds. Results indicate that the failure probabilities of unreinforced transformers and insulators can reach up to 96% and 12.7%, respectively. These failures can cause typical 10 kV overhead line distribution networks to experience power outages over distances exceeding a thousand kilometers. The maximum power interruption probability reaches 41.6%, with a maximum load loss ratio of 48.6%, even with the proportion of unreinforced transformers of 5%. The spatial distribution of power interruption probability and load loss ratio exhibits an “eye” shape. The results also identify insulator failure as the primary cause of system failures, and corresponding protective suggestions are provided.
1. Introduction
A high-altitude nuclear electromagnetic pulse (HEMP) can potentially damage power systems over thousands of kilometers. Based on the generation time and mechanism, HEMP is divided into three components: early-time E1, intermediate-time E2, and late-time E3 [,]. The E1 component can damage distribution transformers or cause insulator flashovers by interacting with overhead lines [], and it can also harm relay protection devices and other secondary equipment through control lines, communication lines, or power cords []. The E3 component can generate significant geomagnetically induced currents (GIC) via long grounding transmission lines, potentially damaging large transformers [].
Early experiments have demonstrated that HEMP can cause significant damage to extensive areas of power systems []. Numerous simulation tests indicate that the initial damage or flashover voltages for insulators and unprotected distribution transformers are in the range of hundreds of kilovolts [,,,], while the initial damage voltages for relays and other secondary equipment range from several to tens of kilovolts [,,]. Assessing HEMP damage to power systems has garnered significant attention [,,,]. Research by Metatech reveals that E3 can lead to extensive power outages due to the failure of numerous transformers []. An impact analysis of South Korea’s power system, utilizing published E3 electric field data, demonstrates that the system’s stability is compromised under E3 conditions []. Most of these evaluations focus on the effects of the late-time E3 component on the power network. However, E1 is critically important because the impact of E3 can be negligible when the detonation altitude is low. The flashover vulnerability of transmission and distribution lines induced by E1 has been studied in [], revealing that a 12 kV line of infinite length is vulnerable to E1-induced flashover, with vulnerability ranging from 9% to 15% over the illuminated area for an E1 field of 50 kV/m. Metatech has conducted E1 coupling analysis on overhead lines and control lines, analyzing the vulnerability of sensitive equipment such as insulators []. In recent years, various studies have been conducted on the coupling and damage related to E1 for both primary and secondary devices [,,]. The coupled voltage on overhead lines over a large range generated by HEMP can be quickly obtained using methods based on artificial neural networks (ANNs) [,]. Quantitative grading of insulation damage to distribution transformers has been studied in []. However, the vulnerabilities of distribution primary devices within the HEMP-illuminated area and their effect on power outages have not yet been studied in depth.
This study integrates theoretical analysis, deep neural networks (DNNs), the threshold voltages of primary devices in critical distribution networks, and the minimum path method to quantitatively assess the spatial distribution of failure probabilities for critical devices and their effects on a 10 kV distribution network. The approach requires only several tens of seconds. Findings indicate that the failure probability of 10 kV unreinforced transformers and insulators, caused by the voltage generated from E1 coupling with overhead lines, can reach up to 96% and 12.7% in the most severely affected area, respectively. The results also show that the failure of unreinforced transformers, even with a proportion as low as 5%, and insulators can cause typical 10 kV overhead line distribution networks to experience power outages over distances exceeding a thousand kilometers. The maximum power interruption probability and load loss ratio in the most severe area reach 41.6% and 48.6%, respectively. The probability distribution of these outages resembles an “eye” shape, primarily due to insulator flashover. This research is highly valuable for the defense of power systems.
The remainder of the paper is organized as follows. Section 2 introduces the approach to analyze E1 impact on distribution network. Section 3 introduces the threshold voltage of typical primary devices and the parameters of a typical 10 kV distribution network. Results and discussions are presented in Section 4. Finally, the conclusions and suggestions are provided in Section 5.
2. Approach to Analyze E1 Impact on Distribution Network
The general approach for assessing the effects of E1 on the power distribution network is illustrated in Figure 1. First, the cumulative probability distribution (CPD) of the coupled voltage at the ends of critical devices, such as transformers and insulators, caused by E1 is determined using a technique that integrates two DNNs with theoretical analysis []. This method can provide the spatial distribution of the E1-induced coupled voltage within tens of seconds. Second, the failure probabilities of 10 kV transformers and insulators are calculated using the CPD of the coupled voltage in conjunction with the devices’ threshold voltages. Finally, the effect of device failure on a 10 kV power distribution network is evaluated using a theoretical method.
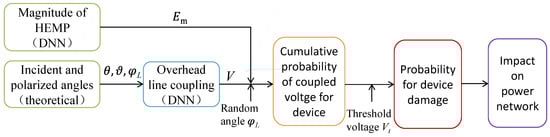
Figure 1.
Overall approach to analyze E1 impact on power distribution network.
2.1. CDF of Coupled Voltage for Critical Device
The CDF of the coupled voltage for the critical primary device is computed by the method of combining two DNNs with theoretical equations []. One 5-hidden-layer feed-forward DNN is applied to predict the E1 magnitudes at observation points. The input parameters of the DNN are the explosion height Hb (in km), explosion yield Qf (in kt), geomagnetic intensity Bm (in μT), angle θp (in degree) between the geomagnetic field and the line of sight, and distance R (in km) from the observation point to the projection point. The output parameter of the DNN is the magnitude of the E1. The DNN is trained by the numerical results of the E1 and has been validated against the numerical results, with the relative difference generally remaining below 5% [,].
The incident elevation angle θ, azimuthal angle φ, and polarized angle of the E1 are solved by using the theoretical equations [,]. With the azimuthal angle φ of the E1 and the direction of the overhead line, the angle φL between the E1 incident surface and the horizontal overhead line direction can be computed, which is defined in Figure 2.
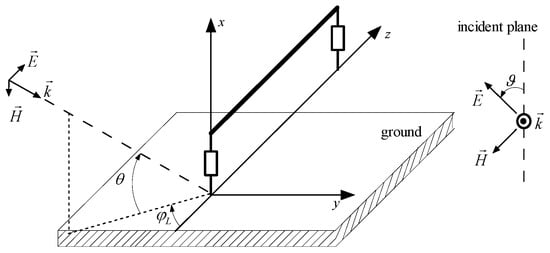
Figure 2.
E1 coupling with an overhead line.
Direct analysis of E1 coupling with large-scale overhead line networks is highly complex and nearly impossible. Based on the effective coupling length (ECL) theory [], the analysis of E1 coupling with an overhead network can be decomposed into the analysis of E1 coupling with independent overhead lines. The study in [] shows that the voltage response of an overhead line is almost independent of the presence of other nearby lines. Thus, E1 coupling with overhead lines can be modeled as a plane wave coupling with a single line over the ground, as shown in Figure 2. A second 5-hidden-layer feed-forward DNN is employed to predict the coupled voltage at the end of the overhead line illuminated by E1 with a specific magnitude but different incidence and polarization angles. The input parameters for this DNN are the elevation angle θ, the polarization angle ϑ, and the angle φL between the incident plane of the E1 and the direction of the overhead line. The output parameter is the magnitude of the coupled voltage. The coupled voltage is considered as the open-circuit voltage for the transformers and the matched load voltage for the insulators. This DNN is trained and validated using numerical results of overhead line coupling, with most relative differences being less than 5% [].
Due to the diversity of overhead line directions, the direction is assumed to be random uniformly. Thus, the angle φL is uniformly distributed in [0, 2π]. The coupled voltages at each observation point are arranged in ascending order in a vector , where N is the sample number of the angle φL. Then the CDF for the coupled voltage being larger than or equal to , can be written as
2.2. Failure Probability of Critical Device
The coupled voltage can cause failure to 10 kV primary devices, such as transformers and insulators. The device will fail when the coupled voltage V is larger than or equal to its threshold voltage Vt. Thus, the failure probability P of the device can be given by
The coupled voltages vary at different locations; consequently, the failure probabilities of the same device also vary spatially. It is worth noting that failures of different devices are considered independent in the simulation.
2.3. Method to Analyze E1 Effect on Distribution Network
Transformer breakdown or insulator flashover can cause power distribution network blackouts. Due to the wide coverage of E1 and the small variation in the E1 environment within tens of kilometers, the failure probability of the same type of transformer or insulator within one district can be considered uniform.
The failure probability of a pole tower is equivalent to the failure probability of its insulator. In urban distribution networks, the distance between 10 kV overhead line poles and towers is about 50 m. A line remains operational only if all poles and towers on it are functional; therefore, the line failure probability can be calculated from the failure probabilities of its constituent poles and towers. The failure of a transformer is equivalent to the failure of a load node. Based on the failure probabilities of the lines and load nodes, the impact of E1 on power distribution networks is evaluated using the minimum path method, which considers the impact of both minimum and non-minimum path components on load point failure indexes [,]. The steps of the minimum path method are as follows: First, input the distribution network data. Second, use the path set search method to find the set of minimum path and non-minimum path components for each load node. Third, discount the impact of non-minimum path component failures to the minimum path nodes according to the network topology. Fourth, calculate the load node failure index, considering only the components and nodes on the minimum path. Finally, compute the system failure indexes. The method considers the effects of branch line protection, disconnect switches, sectionalizing circuit breakers, and planned maintenance, and can account for the presence or absence of a backup power source. The flowchart of the minimum path method is shown in Figure 3.
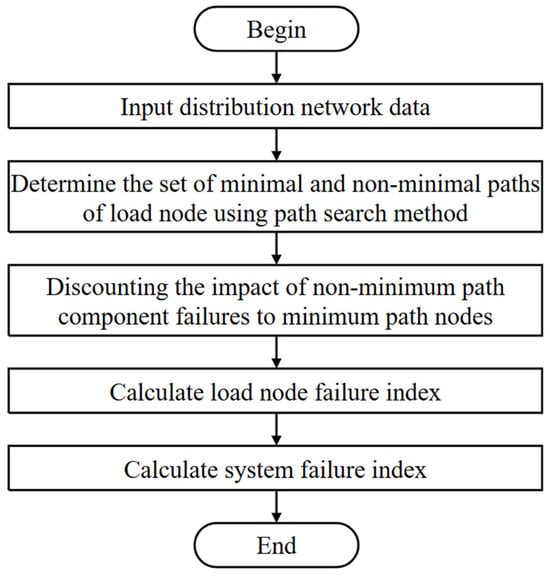
Figure 3.
Flowchart of minimum path method.
Two failure indexes are defined to describe the impact of E1 on the power network system: the System Average Interruption Probability Index (SAIPI) and the System Loss Load Proportion Index (SLLPI). SAIPI represents the average power failure probability for all users in the system and is defined as:
where Pk and Nk are the power loss probability and the number of users of the kth load node in the system, respectively. SLLPI means the proportion of the loss load to the total load in the system and is defined as:
where Lk is the load power of the kth node in the system.
3. Threshold Voltages of Primary Devices and Parameters of Typical 10 kV Distribution Network
3.1. Failure Threshold of 10 kV-Distribution Primary Device
10 kV grade transformers primarily consist of dry-type and oil-immersed transformers. Several simulated experiments on unprotected 10 kV/220 V transformers have been reported [,,]. According to the experimental results in [], damage occurs in 10 kV/220 V dry-type and oil-immersed transformers when the average loading open-circuit voltage reaches 280 kV and 216 kV, respectively. The internal insulating material of the tested transformer breaks down, causing failure. Thus, the threshold voltages for the dry-type and oil-immersed transformers are set to 280 kV and 216 kV, respectively, as shown in Table 1.

Table 1.
Threshold voltage of 10 kV unprotected transformers obtained by simulated experiments.
10 kV grade insulators primarily consist of porcelain, composite, and glass insulators. Experimental results in [] show that some 10 kV pin-type porcelain insulators experience flashover when subjected to a voltage of approximately 220 kV with a pulse width of 500 to 550 ns. Research in [] indicates that when the voltage pulse width is less than 100 ns, the flashover threshold voltage changes little, while the threshold at a pulse width of 100 ns is about 1.5 times that at 500 ns. Because the pulse width of the coupled voltage is typically less than 100 ns [], the threshold voltage is adjusted to 330 kV by applying a factor of 1.5 to account for the pulse width effect. No flashover or other effect phenomena were observed for composite and glass insulators due to the limitations of the experimental platform. Therefore, the threshold voltages for composite and glass insulators are taken from the experimental results obtained by Parfenov et al. for a 10 kV power line []. The threshold voltages for composite and glass insulators are approximately 334 kV and 380 kV, respectively, when subjected to a short pulse with a duration of less than 150 ns. The experiments also show that the electrical parameters of insulators can degrade after flashover when the insulator is subjected to the power line voltage (power ON), and some insulators can be destroyed after the third flashover []. The threshold voltages for different types of 10 kV insulators are given in Table 2.
Table 2.
Threshold voltage of 10 kV insulators obtained by simulated experiments.
3.2. Configurations and Parameters of Tpical 10 kV Distribution Network
The coverage of E1 can extend over thousands of kilometers. However, obtaining the exact configurations of power distribution networks over such a large area is nearly impossible. Therefore, a 10 kV distribution network from a city district, as shown in Figure 4, is treated as a typical network representative of a large area. The green lines denote 10 kV overhead lines, while the purple lines represent underground cables. The coupling of E1 with underground cables is ignored here, as it is much weaker than the coupling with overhead lines.
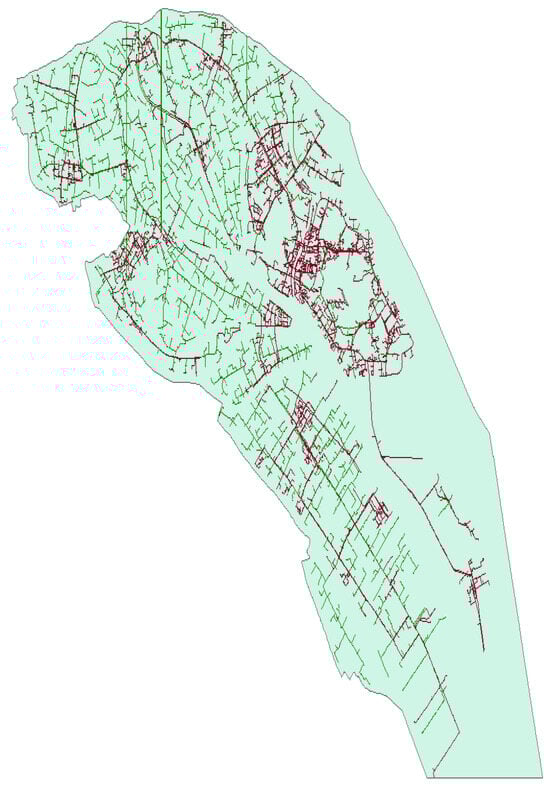
Figure 4.
Typical 10 kV distribution network for a district in a city, where green lines represent 10 kV overhead lines and purple lines represent 10 kV underground cable.
For the calculation of coupled voltages, the height of the overhead lines is set to 10 m. Because the effective coupling length (ECL) for a 10 m high overhead line is no more than 2 km [], the length of the overhead line is set to 2 km. Although the distance between line poles is set to 50 m (less than 2 km), the ECL for an overhead line illuminated by the horizontally polarized E1 (which is dominant) is less than 50 m in most cases according to []. Thus, using a 2 km line length may overestimate the coupled voltage for insulators, but not significantly. Table 1 and Table 2 show that the threshold voltages of 10 kV insulators are generally higher than those of unprotected 10 kV transformers. This implies that an unprotected transformer is more likely to be damaged by E1 than an insulator on the same line. The distribution line length for a 10 kV transformer is typically 6–20 km, which is longer than 2 km. Therefore, the 2 km overhead line length does not overestimate the coupled voltage for the transformers.
The voltage induced by HEMP can cause transformer damage or insulator flashover. The loads of the power line are modeled as matched loads for insulator analysis and as open circuits for transformer analysis. In the simulation, the line loads are set to match. According to transmission line theory, the voltage magnitude for an open circuit is twice that for a matched load. The effect of the ground on line coupling is small when the line is elevated []; thus, the ground conductivity and relative dielectric constant are set to fixed values of 0.001 S/m and 4, respectively. The study in [] also shows that the line radius has little effect on the coupled voltage. Therefore, the line radius r is set to a fixed value of 6 mm.
4. Results and Discussion
4.1. Spatial Distribution of E1 and Coupled Voltage
The proposed method takes about 20 s on a notebook computer to obtain the magnitudes of E1 and its coupled voltage. Figure 5 shows the spatial distribution of the E1 magnitude, and the maximum coupled open-circuit voltage on the overhead line, assuming a high-altitude blast (180 km) with large equivalent yield. The results show that the coupled open-circuit voltage can be as large as 1540 kV, which is much larger than the threshold voltages of unprotected transformers (see Table 1). This implies that the coupled voltage on the insulators can reach up to 770 kV, also significantly exceeding the flashover threshold voltages of the insulators.
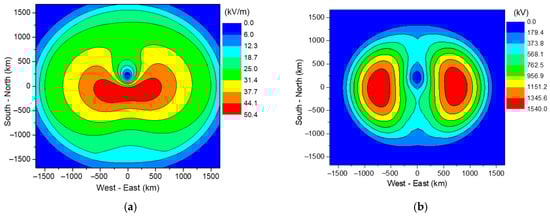
Figure 5.
Spatial distribution of E1 magnitude and its coupled open-circuit voltage on overhead line. (a) Magnitude of E1. (b) Maximum of coupled open-circuit voltage.
4.2. Failure Pobabilities of 10 kV-Distribution Primary Devices
Figure 6 shows the failure probability distribution for the unprotected oil-immersed transformer and the unprotected dry-type transformer. The failure probabilities can be as high as 96% and 83.4%, respectively. Since most transformers are protected and the exact proportion of unprotected ones is difficult to obtain, the analysis assumes that unprotected transformers account for 5%, 10%, 15%, and 20% of the total. The proportions of dry-type and oil-immersed transformers may vary by location; here, they are assumed to be equal (1/2) everywhere. Figure 7 shows the spatial distribution of the comprehensive failure probability for transformers when the unprotected proportions are 5%, 10%, 15%, and 20%, with maximum failure probabilities of 4.5%, 9.0%, 13.4%, and 17.9%, respectively.
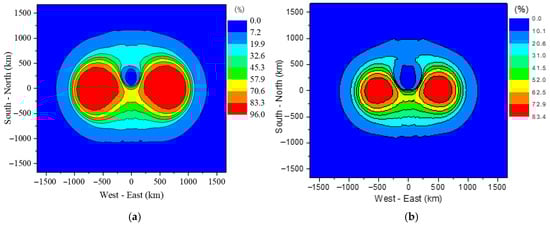
Figure 6.
Failure probability of typical 10 kV transformers. (a) Unprotected oil transformers. (b) Unprotected dry-type transformer.
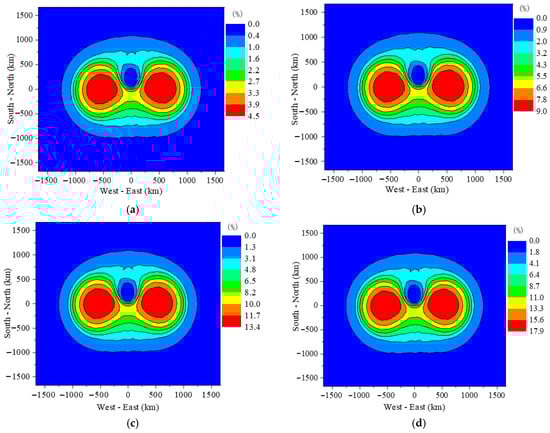
Figure 7.
Comprehensive failure probabilities of the transformers when unprotected transformers account for (a) 5% (b) 10% (c) 15% (d) 20%.
Figure 8 shows the failure probability distributions for the three types of 10 kV grade insulators. The results indicate that the failure probabilities for porcelain, composite, and glass insulators can reach up to 12.7%, 12.7%, and 10.6%, respectively. Assuming equal proportions (1/3 each) of the three insulator types in the overall 10 kV insulator population, the comprehensive failure probability is calculated and shown in Figure 8d. The result shows that the comprehensive failure probability of 10 kV-grade insulators can be up to 11.9%.
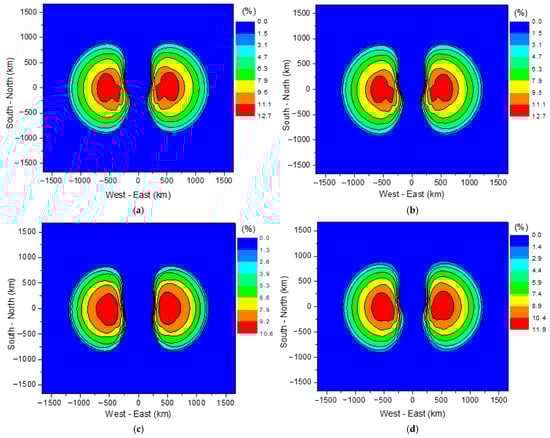
Figure 8.
Failure probability of typical 10 kV insulators. (a) Porcelain insulator. (b) Composite insulator. (c) Glass insulator. (d) Comprehensive probability.
4.3. Effect on 10 kV Distribution Network
The failure of transformers and insulators can cause power system interruptions. Figure 9 and Figure 10 show the SAIPI and SLLPI, respectively, for the typical power distribution network shown in Figure 4, caused by the failure of transformers and insulators. The results demonstrate that E1 can cause power distribution network interruptions over a range of more than a thousand kilometers. The maximum SAIPI values are 41.6%, 44.2%, 47.0%, and 49.6% when the unprotected transformers account for 5%, 10%, 15%, and 20%, respectively. The maximum SLLPI values for these four cases are 48.6%, 51.0%, 53.4%, and 55.6%. When the proportion of unprotected transformers increases from 5% to 20%, the maximum SLLPI increases from 48.6% to 55.6%. This increase is much smaller than the increase in the comprehensive failure probability of transformers (from 4.5% to 17.9%), indicating that transformer failure is only one of the reasons for power outages in the distribution network.
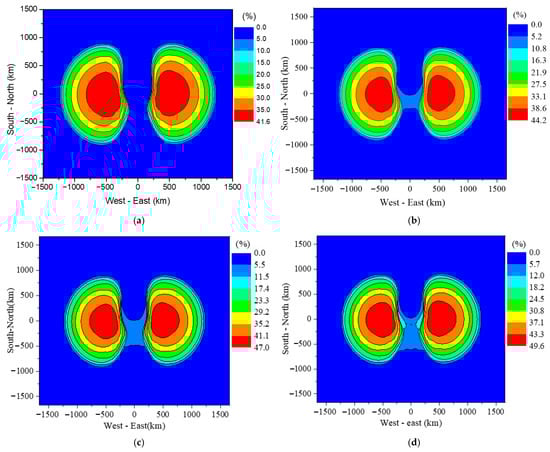
Figure 9.
SAIPI of typical power distribution network when unprotected transformers account for (a) 5% (b) 10% (c) 15% (d) 20%.
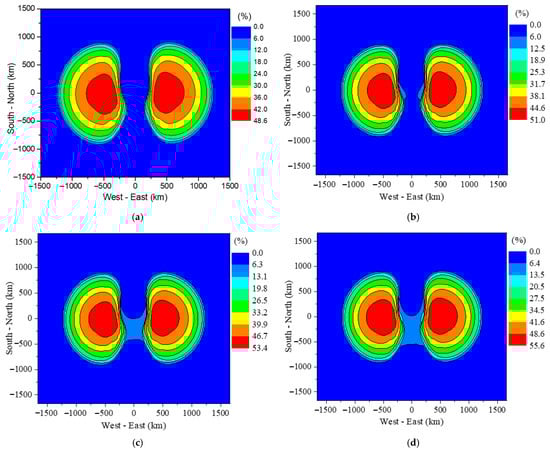
Figure 10.
SLLPI of typical power distribution network when unprotected transformers account for (a) 5% (b) 10% (c) 15% (d) 20%.
The results also imply that even with only 5% unprotected transformers, the area with SAIPI over 30% reaches approximately 1.26 × 10⁶ square kilometers, while the area with SLLPI over 30% is approximately 1.68 × 10⁶ square kilometers. The shape of the interruption distribution resembles an “eye”. This is because the vertically polarized E1 component can couple larger voltages than the horizontally polarized component, and the former dominates in the east and west directions []. Although the 2 km length used in the simulation is larger than the actual branch line length, considering the most severe situation is reasonable from a defense perspective. It is also important to note that the analysis only considers the damage to transformers and insulators induced by E1, excluding potential damage to loads and other devices. Furthermore, cascading effects of large-scale insulator flashover, such as equipment damage from short-circuit currents induced by flashing or the impact of large-scale power outages on the main grid, have not been considered. Including these effects would likely lead to more severe results.
4.4. Sensitivity Analysis of Primary Equipment Failure
Figure 11 shows how SAIPI and SLLPI change with the failure probability of either the transformer or the insulator alone. The results indicate that the SAIPI and SLLPI caused by insulator failure are larger than those induced by transformer failure. This suggests that insulators are more likely to cause distribution network interruptions, possibly due to their larger quantity in the network. The results also show that SAIPI and SLLPI increase linearly with the probability of transformer failure, while for insulator failure, they increase rapidly initially and then tend to saturate.
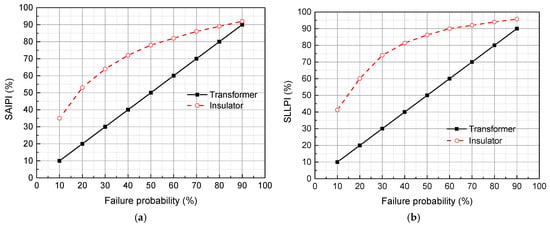
Figure 11.
Failure indexes changing with failure probabilities of the transformer and the insulator. (a) SAIPI; (b) SLLPI.
Figure 12a,b show the SAIPIs caused by the failure of transformers or insulators alone, with maximum values of 4.5% and 38.8%, respectively, assuming 5% unprotected transformers. The results confirm that the probability of power interruption caused by insulator failure is higher, primarily because the comprehensive failure probability of 10 kV transformers is lower than that of insulators. The SAIPI caused by transformer failure reaches 17.9% when the unprotected proportion is 20%, consistent with the linear relationship between SAIPI and transformer failure probability.
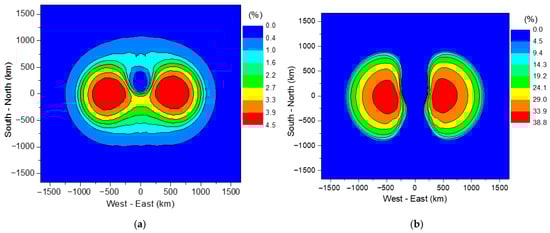
Figure 12.
SAIPIs of typical power distribution network caused by failure of certain device. (a) Transformer; (b) Insulator.
5. Conclusions and Suggestion
This paper studied the failure probability of typical 10 kV primary equipment and the resulting power failure and load loss ratios in a typical distribution network, based on a method combining ECL theory, the minimum path method, and DNNs. This method can analyze the impact of E1 on power distribution networks in tens of seconds. The spatial distribution of the primary equipment failure probability and its impact on a typical distribution network were presented. Results show that the failure probabilities of unreinforced transformers and insulators can reach up to 96% and 12.7% in the most severely affected area, respectively. The results also indicate that E1 can lead to power interruptions in overhead line distribution networks over distances exceeding a thousand kilometers. The maximum power interruption probability reaches 41.6%, with a maximum load loss ratio of 48.6% in the most severe area, assuming the proportion of unprotected transformers is as low as 5%. The spatial distribution of power interruption probability and load loss ratio exhibits an “eye” shape. Additionally, the results highlight that insulator failure is the primary cause of system failures.
Based on this study, several measures should be taken to protect the distribution power network against HEMP E1:
Adopt higher-grade insulators or provide surge protection for critical line insulators. Insulator flashover can form conductive channels, causing phase-to-phase or ground short circuits, triggering protective device tripping, leading to widespread outages, and potentially initiating cascading faults. Short-circuit currents may also burn insulators, switchgear, and other equipment.
Because distribution transformers without surge protection are highly vulnerable to damage from E1, surge protection for transformers should be implemented.
Author Contributions
Conceptualization, H.X. and Y.L. (Yong Li); methodology, H.X., Y.L. (Yong Li), D.Z. and G.L.; software, H.X., Y.L. (Yu Liu), D.Z., H.Q., Y.L. (Yong Li) and S.H.; validation, H.X., H.Q. and D.Z.; formal analysis, H.X. and D.Z.; investigation, H.X., Y.L. (Yong Li) and D.Z.; resources, H.X., C.Y. and T.D.; data curation, Y.L. (Yong Li), C.Y. and Y.L. (Yu Liu); writing—original draft preparation, H.X., Y.L. (Yong Li) and D.Z.; writing—review and editing, H.X.; visualization, H.X. and H.Q.; supervision, H.X. and G.L.; project administration, H.X.; funding acquisition, T.D. All authors have read and agreed to the published version of the manuscript.
Funding
This research received no external funding.
Data Availability Statement
The original contributions presented in this study are included in the article. Further inquiries can be directed to the corresponding author.
Conflicts of Interest
The authors declare no conflicts of interest.
References
- IEC 61000-2-9; IEC Electromagnetic Compatibility EMC-Part 2 Environment-Section 9 Description of HEMP Environment-Radiated Disturbance Basic EMC Publication First Edition. IEC: Geneva, Switzerland, 1996.
- Li, Y.; Liu, L.; Wang, J.; Zuo, Y.; Zhu, J.; Niu, S.; Ouyang, X. Numerical simulation of the intermediate-time high-altitude electromagnetic pulse. IEEE Trans. Electromagn. Compat. 2022, 64, 1423–1430. [Google Scholar] [CrossRef]
- Xie, H.; Du, T.; Zhang, M.; Li, Y.; Qiao, H.; Yang, J.; Shi, Y.; Wang, J. Theoretical and experimental study of effective coupling length for transmission lines illuminated by HEMP. IEEE Trans. Electromagn. Compat. 2015, 57, 1529–1538. [Google Scholar] [CrossRef]
- Wu, F.; Li, J.; Huang, Q.; Li, S.; Yang, T.; Zhou, X.; Wang, Y. Radiated and conducted research on damage characteristics of digital protective relays in substations under high-altitude electromagnetic pulse environment. Rev. Sci. Instrum. 2024, 95, 114710. [Google Scholar] [CrossRef]
- Weiss, M.; Weiss, M. An assessment of threats to the American power grid. Energy Sustain. Soc. 2019, 9, 18. [Google Scholar] [CrossRef]
- IEC 61000-1-3; Electromagnetic Compatibility (EMC)—Part 1–3: General—The Effects of High-Altitude EMP (HEMP) on Civil Equipment and Systems. IEC: Geneva, Switzerland, 2002.
- Savage, E.; Gibert, J.; Radasky, W. The Early-Time (E1) High-Altitude Electromagnetic Pulse (HEMP) and Its Impact on the U.S. Power Grid; Meta-R-320; Stanford University: Stanford, CA, USA, 2010. [Google Scholar]
- Miller, D.; Lux, A.; Grzybowski, S.; Barnes, P. The effect of steep-front, short-duration impulses on power distribution components. IEEE Trans. Power Deliv. 1990, 5, 708–715. [Google Scholar] [CrossRef]
- Parfenov, Y.V.; Zdoukhov, L.N.; Shurupov, A.V.; Kozlov, A.V. Research of flashover of power line insulators due to high-voltage pulses with power on and power off. IEEE Trans. Electromagn. Compat. 2013, 55, 467–474. [Google Scholar] [CrossRef]
- Chen, Y.; Xie, Y.; Zhang, D.; Zhou, Y.; Ren, D.-C.; Gou, M.-Y.; Dong, N. 10-kV transmission line experimental platform for HEMP immunity test of electrical equipment in operation. IEEE Trans. Power Deliv. 2021, 36, 1034–1040. [Google Scholar] [CrossRef]
- Thotakura, N.L.; Wu, Y.; Mignardot, D.; Zhang, L.; Qiu, W.; Markel, L.C.; Liao, D.; McConnell, B.W.; Liu, Y. Mignardot Impact analysis of high-altitude electromagnetic pulse coupling effects on power grid protection relays. Electronics 2024, 13, 1336. [Google Scholar] [CrossRef]
- Jin, L.; Zhou, Z.; Zhou, H.; Su, Y.; Meng, J. Analysis of immunity of relay protection equipment under high-altitude electromagnetic pulse. IEEE Trans. Plasma Sci. 2024, 52, 824–835. [Google Scholar] [CrossRef]
- Foster, J.S.; Gjelde, E.; Graham, W.R.; Hermann, R.G. Report of the Commission to Assess the Threat to the United States from Electromagnetic Pulse (EMP) Attack: Critical National Infrastructures; EMP Commission: Philadelphia, PA, USA, 2008. [Google Scholar]
- NERC. High-Impact, Low-Frequency Event Risk to the North American Bulk Power System; North American Electric Reliability Corporation (NERC): Atlanta, GA, USA, 2010. [Google Scholar]
- Gilbert, J.; Kappenman, J.; Radasky, W. The Late-Time (E3) High-Altitude Electromagnetic Pulse (HEMP) and Its Impact on the U.S. Power Grid; Meta-R-321; Metatech Corporation: Mumbai, India, 2010. [Google Scholar]
- Kim, S.; Jeong, I. Vulnerability assessment of Korean electric power systems to late-time (E3) high-altitude electromagnetic pulses. Energies 2019, 12, 3335. [Google Scholar] [CrossRef]
- Kruse, V.; Tesche, F.; Liu, T.; Barnes, P. Flashover vulnerability of transmission and distribution lines to high-altitude electromagnetic pulse (HEMP). IEEE Trans. Power Deliv. 1990, 5, 1164–1169. [Google Scholar] [CrossRef]
- Xie, H.; Liu, Y.; Li, Y.; Qiao, H. A prediction model based on artificial neural network for E1 HEMP coupling with distribution power lines. IEEE Trans. Power Deliv. 2022, 37, 5337–5344. [Google Scholar] [CrossRef]
- Xie, H.; Qiao, H.; Liu, Y.; Li, Y.; Du, T.; Huang, S. Numerical study of HEMP coupling with overhead lines in large range by using deep neural networks. IEEE Trans. Nucl. Sci. 2025, 72, 3551–3560. [Google Scholar] [CrossRef]
- Qin, F.; Li, S.; Chen, W.; Yang, Y.; Nie, X.; Wu, W. Quantitative grading of insulation damage to distribution transformers caused by high-altitude electromagnetic pulse based on partial discharge detection. High Volt. 2024, 10, 1032–1042. [Google Scholar] [CrossRef]
- Qiao, H.; Xie, H.; Liu, Y. A fast prediction model for HEMP-E1 environment based on artificial neural network. Mod. Appl. Phys. 2025, 16, 011318. (In Chinese) [Google Scholar]
- Ianoz, M.; Nicoara, B.I.C.; Radasky, W.A. Modeling of an EMP conducted environment. IEEE Trans. Electromagn. Compat. 1996, 38, 400–413. [Google Scholar] [CrossRef]
- Xie, H.; Li, Y.; Qiao, H.; Wang, J. Empirical formula of effective coupling length for transmission lines illuminated by E1 HEMP. IEEE Trans. Electromagn. Compat. 2016, 58, 581–587. [Google Scholar] [CrossRef]
- Tesche, F.M.; Barnes, P.R. A multiconductor model for determining the response of power transmission and distribution lines to a high altitude electromagnetic pulse (HEMP). IEEE Power Eng. Rev. 1989, 9, 82. [Google Scholar] [CrossRef]
- Bie, C.; Wang, X. Reliability analysis of distribution networks. Electr. Power 1997, 30, 10–13. (In Chinese) [Google Scholar]
- Bie, Z.; Zhang, P.; Li, G.; Hua, B.; Meehan, M.; Wang, X. Reliability evaluation of active distribution systems including microgrids. IEEE Trans. Power Syst. 2012, 27, 2342–2350. [Google Scholar] [CrossRef]
- Qin, F.; Wang, X.; Chen, W.; Nie, X.; Cui, Z.; Mao, C. Transient response and failure mechanism of distribution transformer under high-altitude electromagnetic pulse. Proc. CSEE 2023, 43, 6924–6932. (In Chinese) [Google Scholar]
- Chen, Y.; Wang, Z.; Wang, Y.; Zhou, Y.; Jing, L.; Xie, Y. Effect Experiments of 10 kV Distribution Transformer Excited by High-altitude Electromagnetic Pulse. High Volt. Eng. 2023, 49, 3119–3124. (In Chinese) [Google Scholar]
Disclaimer/Publisher’s Note: The statements, opinions and data contained in all publications are solely those of the individual author(s) and contributor(s) and not of MDPI and/or the editor(s). MDPI and/or the editor(s) disclaim responsibility for any injury to people or property resulting from any ideas, methods, instructions or products referred to in the content. |
© 2025 by the authors. Licensee MDPI, Basel, Switzerland. This article is an open access article distributed under the terms and conditions of the Creative Commons Attribution (CC BY) license (https://creativecommons.org/licenses/by/4.0/).