Abstract
Direct methanol fuel cells (DMFCs) offer advantages such as high energy density and ease of storage and transportation. However, carbon dioxide bubbles generated in the anode flow channels are one factor affecting cell performance. To investigate the multi-bubble coalescence phenomenon of CO2 bubbles in DMFC flow channels, a three-dimensional anode channel dual-pore model of DMFC is established using the software COMSOL Multiphysics. Through numerical simulation, a systematic study is conducted on the kinetic mechanisms governing the growth, detachment, and coalescence behavior of CO2 bubbles in the DMFC anode flow channel. The study reveals that bubbles readily coalesce to form large-scale plug flow with low-methanol velocity, whereas high-flow velocity inhibits coalescence and promotes rapid bubble discharge. Pore size significantly influences the aggregation and detachment of CO2 bubbles, due to the increase in surface tension with the increasing pore diameter, which prevents bubbles from detaching and makes neighboring bubbles more prone to coalescence. Pore spacing directly influences the frequency and intensity of aggregation behavior; increasing pore spacing helps suppress bubble aggregation. The contact angle indirectly affects bubble coalescence and distribution uniformity by regulating bubble detachment rates, and hydrophilic wall surfaces inhibit bubble coalescence.
1. Introduction
Direct methanol fuel cells (DMFCs) offer high energy density and ease of storage and transportation, making them promising portable power sources for electronic devices, electric vehicles, and military applications [,]. The main issues hindering DMFC commercialization include methanol blockage in the anode channel by carbon dioxide (CO2), methanol permeation to the cathode causing parasitic current, and anode catalyst poisoning by carbon monoxide (CO), resulting in slow anodic oxidation. Among these, bubble behavior and the resulting two-phase flow have a significant impact on mass transfer and performance in DMFCs []. CO2 gas forms within the catalytic layer and diffuses as a gas from the diffusion layer into the flow channels []. Within the catalytic layer, bubbles reduce the active electrochemical surface area, lowering current density [,]. For proton exchange membranes, the presence of bubbles also alters the membrane’s water content, thereby decreasing conductivity and inducing ohmic losses []. Within the flow channel, the formation of slug flow can impair methanol mass transfer efficiency []. In addition, the retention and accumulation of bubbles can compromise cell stability. Therefore, gaining a thorough understanding of CO2 bubble generation, migration, and aggregation behavior within the anode flow field is crucial for optimizing cell structure design and enhancing operational efficiency [].
Numerous scholars have conducted simulation studies on the two-phase flow behavior of bubbles in DMFCs. Kang et al. [] employed the VOF method to simulate two-phase flow in micro-serpentine channels. This method, used to track the gas–liquid interface, is suitable for simulating bubble generation and transport processes within channels. The results indicate that the surface tension force and liquid viscosity are key factors influencing bubble behavior. Zheng et al. [] developed a two-dimensional multiphase flow model to analyze the flow mechanism of a single bubble. They found that at low power levels, the thickness of the diffusion layer affects bubble size. As power output increased, the porosity of the diffusion layer and the contact angle between the diffusion layer and carbon dioxide played crucial roles in determining the size of CO2 bubbles. Zhou et al. [] developed a mechanical model for single bubbles in shear flow and systematically analyzed the combined effects of drag force, buoyancy, and surface tension force on bubble detachment. They employed the Hele-Shaw model to investigate the mechanisms of liquid film rupture and gas expulsion in superhydrophobic channels. Yuan et al. [] developed a two-dimensional nine-velocity lattice Boltzmann model to simulate bubble dynamics in right-angled and rounded serpentine flow fields. Results demonstrated that rounded corners reduced local bubble resistance, enabling faster movement and thereby enhancing cell performance. In their subsequent study [], a two-dimensional n-inlet n-outlet (NINO) anode flow field was developed. Results demonstrated that the micro-structured NINO flow field improved methanol solution transport efficiency and facilitated the removal of accumulated carbon dioxide bubbles compared to conventional parallel flow fields. However, this study did not directly simulate bubble distribution; instead, it provided indirect validation through measurements of current density and stability. Su et al. [] developed a two-dimensional sinusoidal single-channel flow field. Results demonstrated that, through optimal design of amplitude and angular frequency, vortices within the corrugated channel disturbance structure uniformly transported reactants and detached bubbles from channel walls. Falcao et al. [] applied the VOF phase field method to the serpentine flow field of a Micro-DMFC, analyzing the effects of inlet velocity and temperature on CO2 distribution throughout the flow channel.
Regarding the behavior of bubble coalescence, several mechanistic studies have been conducted, although few have been performed within the context of DMFC fuel cells. Jain et al. [] employed a discrete bubble model to address bubble–fluid interactions and proposed using the critical Weber number to predict bubble rupture behavior. Colin et al. [] conducted in-pipe two-phase flow experiments under microgravity conditions to investigate the effects of turbulence and shear motion on bubble coalescence. Wen et al. [] experimentally and theoretically analyzed the influence of gas flow rate, pore count, and solution composition on bubble coalescence efficiency, providing theoretical support for the design of bubble columns in practical applications. Yonemoto et al. [] developed a novel gas–liquid interface model based on phase-field theory and multiscale concepts. This model assumes that the interface possesses finite thickness, analogous to a fluid membrane, and incorporates the free energy at the interface. It simulated the interaction and coalescence behavior of two microbubbles under varying electrostatic potential conditions.
Most existing studies focus on factors influencing the formation and detachment of individual bubbles or investigate the distribution of carbon dioxide gas within flow channels [], while analyses of bubble–bubble interactions remain rare. Visualization experiments [,] reveal that large bubbles formed through coalescence are more easily trapped in slug flow. This paper simulates the coalescence behavior of two bubbles simultaneously entering the flow channel from the GDL’s pore structure by establishing a three-dimensional dual-pore model. This study examines the impact of GDL pore size, methanol solution flow velocity, and contact angle on the coalescence and detachment behaviour of the two bubbles.
Existing research on gas–liquid two-phase flow models for DMFCs has focused on two distinct areas. One strand of work examines individual bubbles, investigating factors that influence their growth and detachment, or performing force analyses on them [,,,,]. Another strand primarily studies the effect of flow channels on gas bubble distribution [,,]. However, due to computational complexity, most studies are confined to single-channel systems. Visualization experiments [,] demonstrate that large bubbles formed through coalescence are more readily entrained in slug flow. Consequently, investigating the behavior of bubble aggregation is essential. While bubble aggregation is commonly observed in applications such as bubble columns [], simulations of bubble coalescence within the context of DMFCs remain scarce to our knowledge. This study simulates the coalescence behavior of two bubbles simultaneously entering the flow channel from the GDL’s pore structure by establishing a three-dimensional dual-pore model. The investigation explores the effects of methanol solution flow velocity, GDL pore size, pore spacing, and contact angle on the coalescence and separation behavior of the two bubbles.
2. Mathematical Modeling Theory
2.1. Model Computational Domain and Assumptions
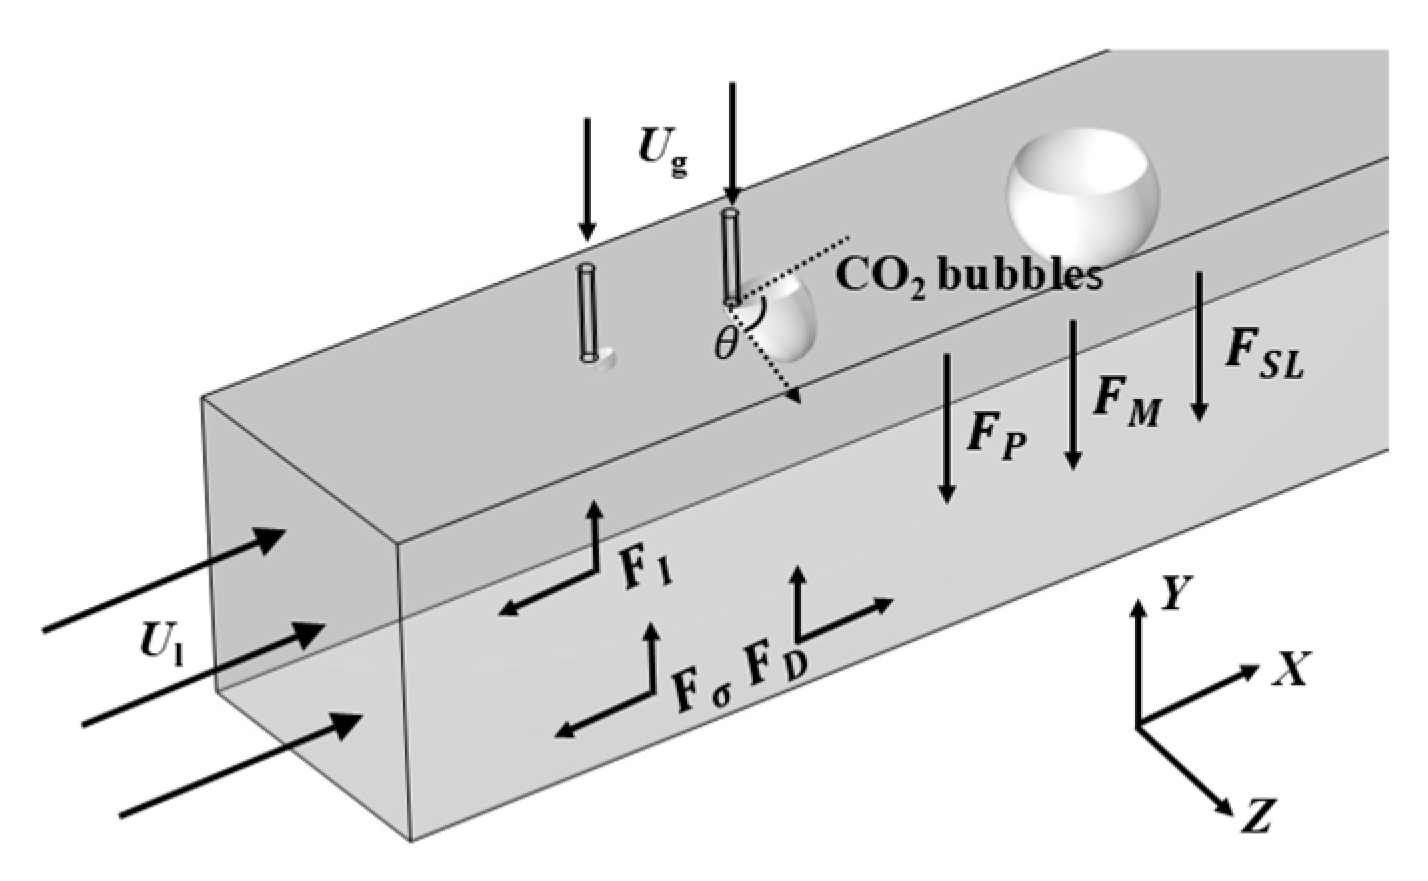
The established three-dimensional DMFC anode channel dual-pore model is shown in Figure 1. The anode channel size is 1 mm × 1 mm × 10 mm. Regarding boundary conditions, a velocity boundary condition is set at the left inlet with a flow velocity of 0.1 m/s for a 1 mol/L methanol solution. The right outlet employs a pressure boundary condition with zero relative pressure. CO2 gas enters through two upper orifices, which are compared to the adjacent pores in the diffusion layer, with diameters of 0.05 mm and a height of 0.3 mm, spaced 0.5 mm apart. Other physical parameters are referenced in Table 1. The simulation is solved using the built-in “Two-Phase Flow, Phase Field” multiphysics module in COMSOL 5.6. The model runs transiently with a time step of 10−4 s. The mesh, shown in Figure 1, consists of hexahedral elements. The minimum element quality is 0.2, the average element quality is 0.9715, and the total number of elements is 243,484. The assumptions in this work are as follows:
Figure 1.
Three-dimensional anode channel dual-pore model.
- Based on Re < 1055, the methanol–water solution is in laminar flow;
- Based on Bond number [] calculation < 0.1, the influence of gravity is neglected;
- No-slip conditions are assumed for the walls;
- The solution is in a CO2-saturated state; any CO2 gas introduced during the calculation process does not dissolve in the solution.
Table 1.
Physical parameters at 333.15 K. Reproduced with permission from Tong et al., Journal of Power Sources published by Elsevier 2025 [].
Table 1.
Physical parameters at 333.15 K. Reproduced with permission from Tong et al., Journal of Power Sources published by Elsevier 2025 [].
| Pore Size dN (μm) Parameters | Values |
|---|---|
| methanol solution density (kg/m3) | 970.86 |
| CO2 density (kg/m3) | 1.5729 |
| methanol solution dynamic viscosity (Pa/s) | 4.6 × 10⁻⁴ |
| CO2 dynamic viscosity (Pa/s) | 1.63 × 10⁻⁵ |
| Surface tension coefficient (N/m) | 0.06548 |
2.2. Control Equations
This study employs the commercial finite element software COMSOL Multiphysics for numerical simulation. Using the phase-field method, combined with the mass conservation equation, the Navier–Stokes equations, and the Cahn–Hilliard equation, the work numerically simulates the gas–liquid two-phase flow within a three-dimensional dual-pore model to investigate the processes of bubble growth and detachment. By analyzing bubble detachment time, detachment diameter, and forces acting on bubbles during detachment, factors and mechanisms influencing bubble detachment and coalescence were summarized.
In this model, the mass conservation equations of the two phases are described by the continuity equation, and the momentum conservation equations are described by the Navier–Stokes equation. It is specified as follows:
where and are listed in Table 1, and denote the methanol solution and CO2 velocity. S and represent the mass and momentum source term, respectively. is the pressure, and I is the impulse. The density can be calculated by Equation (4):
where is fluid volume fraction, as expressed in Equation (5):
The Cahn–Hilliard equation governs the evolution of the phase interface in multiphase flow systems, which can be expressed as follows:
Here, ∅ is a normalized variable for the phase boundary interface. By assigning different values to the gas and liquid phases (gas corresponds to ∅ = −1, liquid corresponds to ∅ = 1), it expresses the distribution of the two phases within the fluid. The variable makes a smooth transition near the interface, forming a diffusion interface. is the mobility coefficient, typically set as follows:
where represents the interface thickness between the two phases, denotes the mixing density function defined by Equation (8), and λ is the mixing energy density calculated using Equation (9):
where represents the surface tension coefficient.
2.3. Force Analysis
During bubble growth and detachment, multiple forces collectively govern the behavior of bubbles. Figure 2 illustrates the primary forces acting on the bubble under liquid disturbance, with calculation methods referenced in the literature [,]. Here, θ represents the contact angle at the surface of the diffusion layer. Gas is injected into the methanol–water solution through the diffusion layer channels at an inlet velocity Ug. Driven by the pressure difference between the gas phase (pg) and the liquid phase (pl), the bubble gradually forms and adheres to the orifice. At this stage, surface tension force (Fσ) maintains the bubble’s stable morphology, preventing easy detachment []. As the methanol solution flows, the fluid exerts shear force on the bubble surface. The shear-lift force (FSL), generated by the velocity difference between the gas and liquid phases, pushes the bubble to move along the flow channel direction. Before bubble detachment, continuous gas injection at high velocity causes the bubble to grow and expand. Meanwhile, the gas momentum force (FM) promotes bubble separation. Relative motion between the bubble and the surrounding liquid generates the drag force (FD), while the bubble’s own acceleration induces the inertial force (FI). When the total detachment force exceeds the adhesive force, the bubble detaches from the surface.
Figure 2.
Force analysis of bubbles disturbed by liquid.
The force equilibrium equations in the x-direction and y-direction are as follows:
FIx = Fσx − FDx,
FIy = Fp+ FSL+ FM − FDy − Fσy,
Among all the forces involved above, Fσ, FSL, and FD are the most significant. Pressure force Fp and momentum force FM are relatively minor due to the low pressure and gas flow velocity and can be neglected. These forces are calculated as follows []:
where and are the diameter of the bubble and the pore, is the relative velocity between the two phases, and characterizes the extent of bubble deformation resulting from the action of liquid turbulence. and are the coefficients of the drag force and the shear-lift force, which can be calculated using Equations (18) and (19), respectively.
where is the Reynolds number, defined as follows:
2.4. Model Validation and Mesh Independence Validation
To validate the model’s accuracy, this study employs comparative verification using the visualization experimental results from S.V. Gnyloskurenko et al. [] and Zhang [] experimental findings. The experiment involved introducing gas at a constant flow rate of 120 mm3/s into a square water container through a 1 mm diameter orifice at the bottom, where the contact angle was 110°. Numerical simulations employ identical conditions. The comparison results in Figure 3a demonstrate that bubble morphology and bubble growth time are largely consistent with experimental findings. The bubble separation diameter calculation method in this paper originates from the second experiment; therefore, the verification of the separation diameter is compared with it. In the experiment, the methanol solution flowed through a horizontal square channel measuring 1 mm × 2 mm × 160 mm. CO2 gas was injected from above at a velocity of 6.25 cm/s through square holes measuring 0.2 mm × 0.2 mm × 30 mm. The contact angle was 40°. By varying the methanol flow velocity under these conditions, Figure 3b shows that the error in the separation diameter is below 14%, validating the reliability of the model.
Figure 3.
(a) Comparison of bubble separation time and morphology between numerical simulation results and experimental results; (b) comparison of bubble separation time and morphology between numerical simulation results and experimental results.
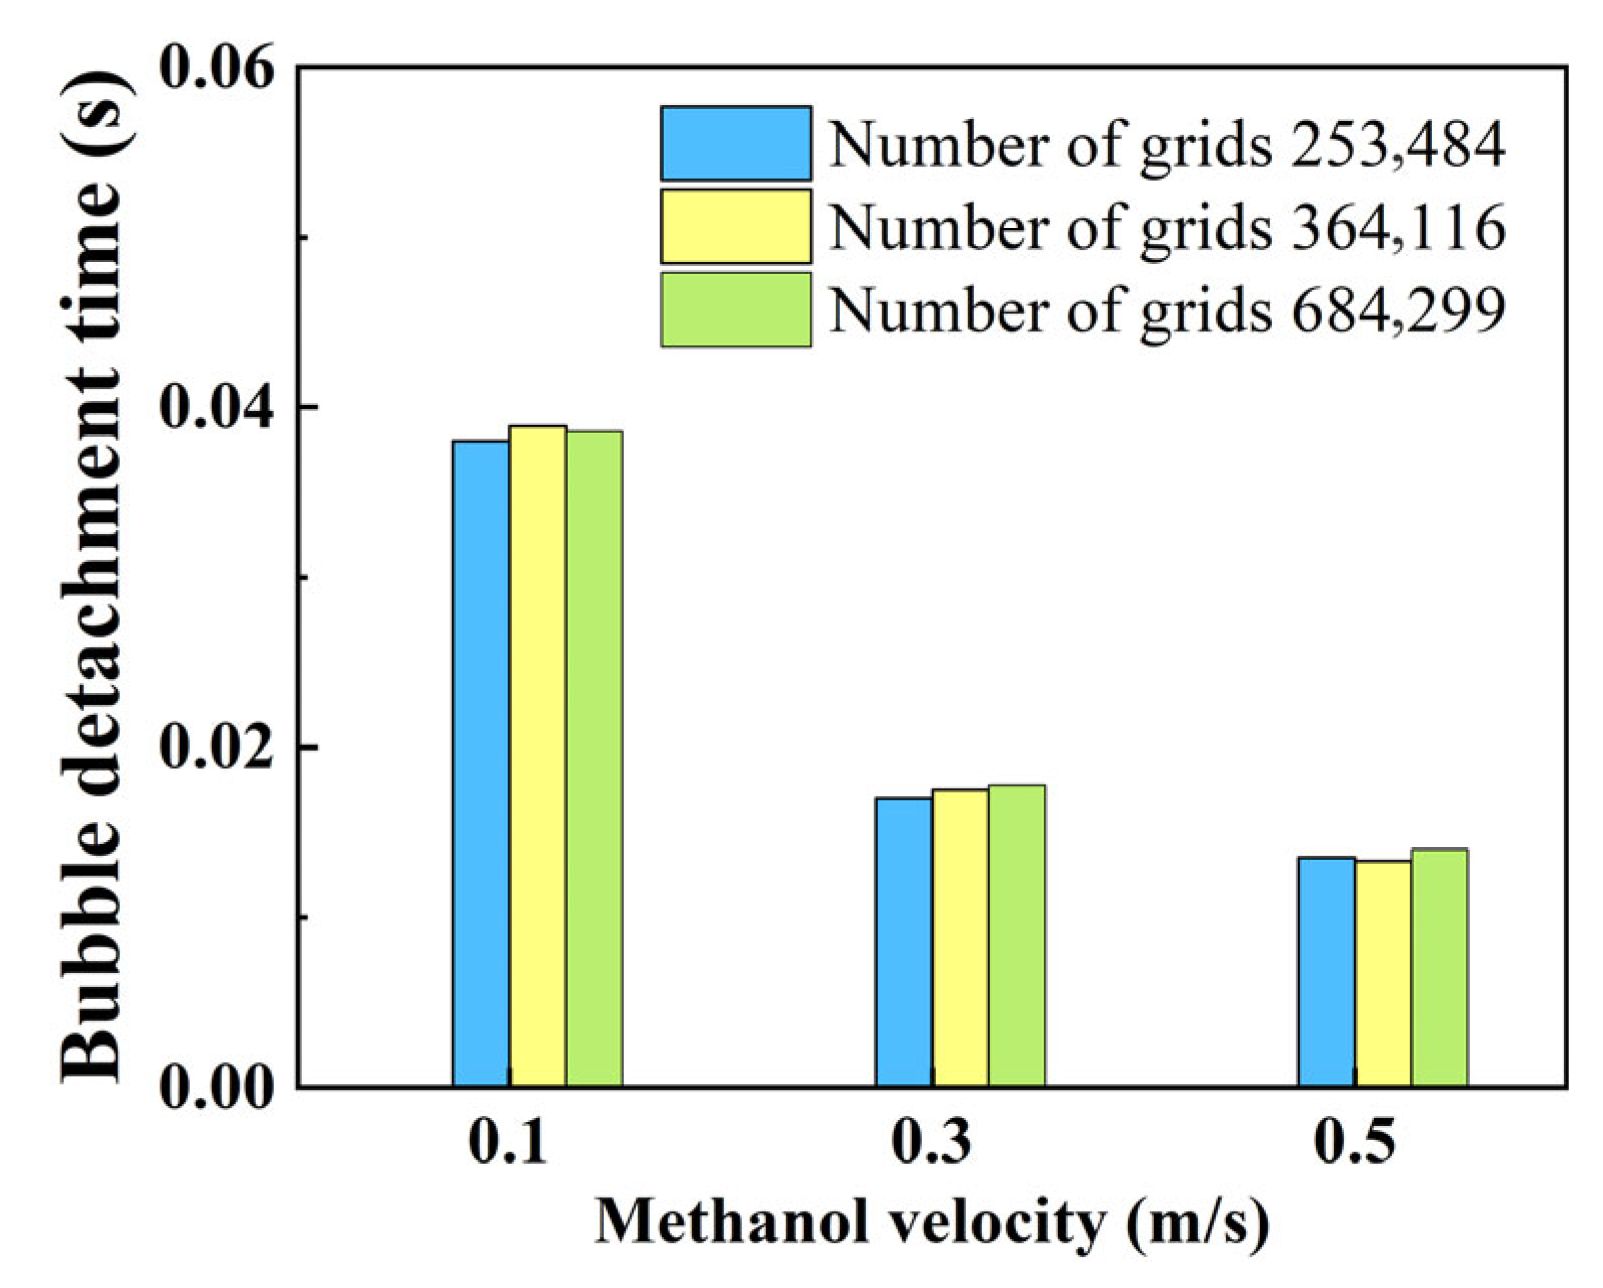
Figure 4 demonstrates the mesh independence verification of the three-dimensional model. The interface thickness control parameter in the phase field is half of the maximum cell size, which changes with the degree of grid refinement. By refining the mesh count from 253,484 to 364,116 and 684,299, the variation in bubble separation time across different mesh resolutions was compared to validate mesh independence. With an inlet velocity of 0.1 m/s, the bubble separation time was compared at different methanol inlet velocities. Under identical operating conditions, the variation in bubble separation time across different mesh sizes was negligible. This indicates that at 253,484 cells, the computational results are independent of mesh size, satisfying the principle of mesh independence. To reduce computation time while maintaining accuracy, this study employs a mesh size of 253,484 for computations.
Figure 4.
Bubble detachment time under different numbers of grids.
3. Results and Discussion
Due to the high porosity of the DMFC diffusion layer, bubbles tend to coalesce after formation, leading to increased bubble volume and subsequent channel blockage. Therefore, investigating the CO2 coalescence and detachment behavior on the diffusion layer wall is crucial. This study examines multiple factors influencing bubble coalescence, including methanol inlet flow velocity, pore size and pore spacing of the diffusion layer, and the diffusion layer contact angle, to observe and analyze bubble detachment and coalescence behavior. To facilitate subsequent discussion, the bubble detachment diameter must be defined. This diameter is determined by calculating the effective volume of a non-circular bubble at the instant of detachment [], then determining the diameter of a circle with equivalent volume. The time recorded at this moment is defined as the bubble detachment time.
3.1. Analysis of Bubble Coalescence Behavior
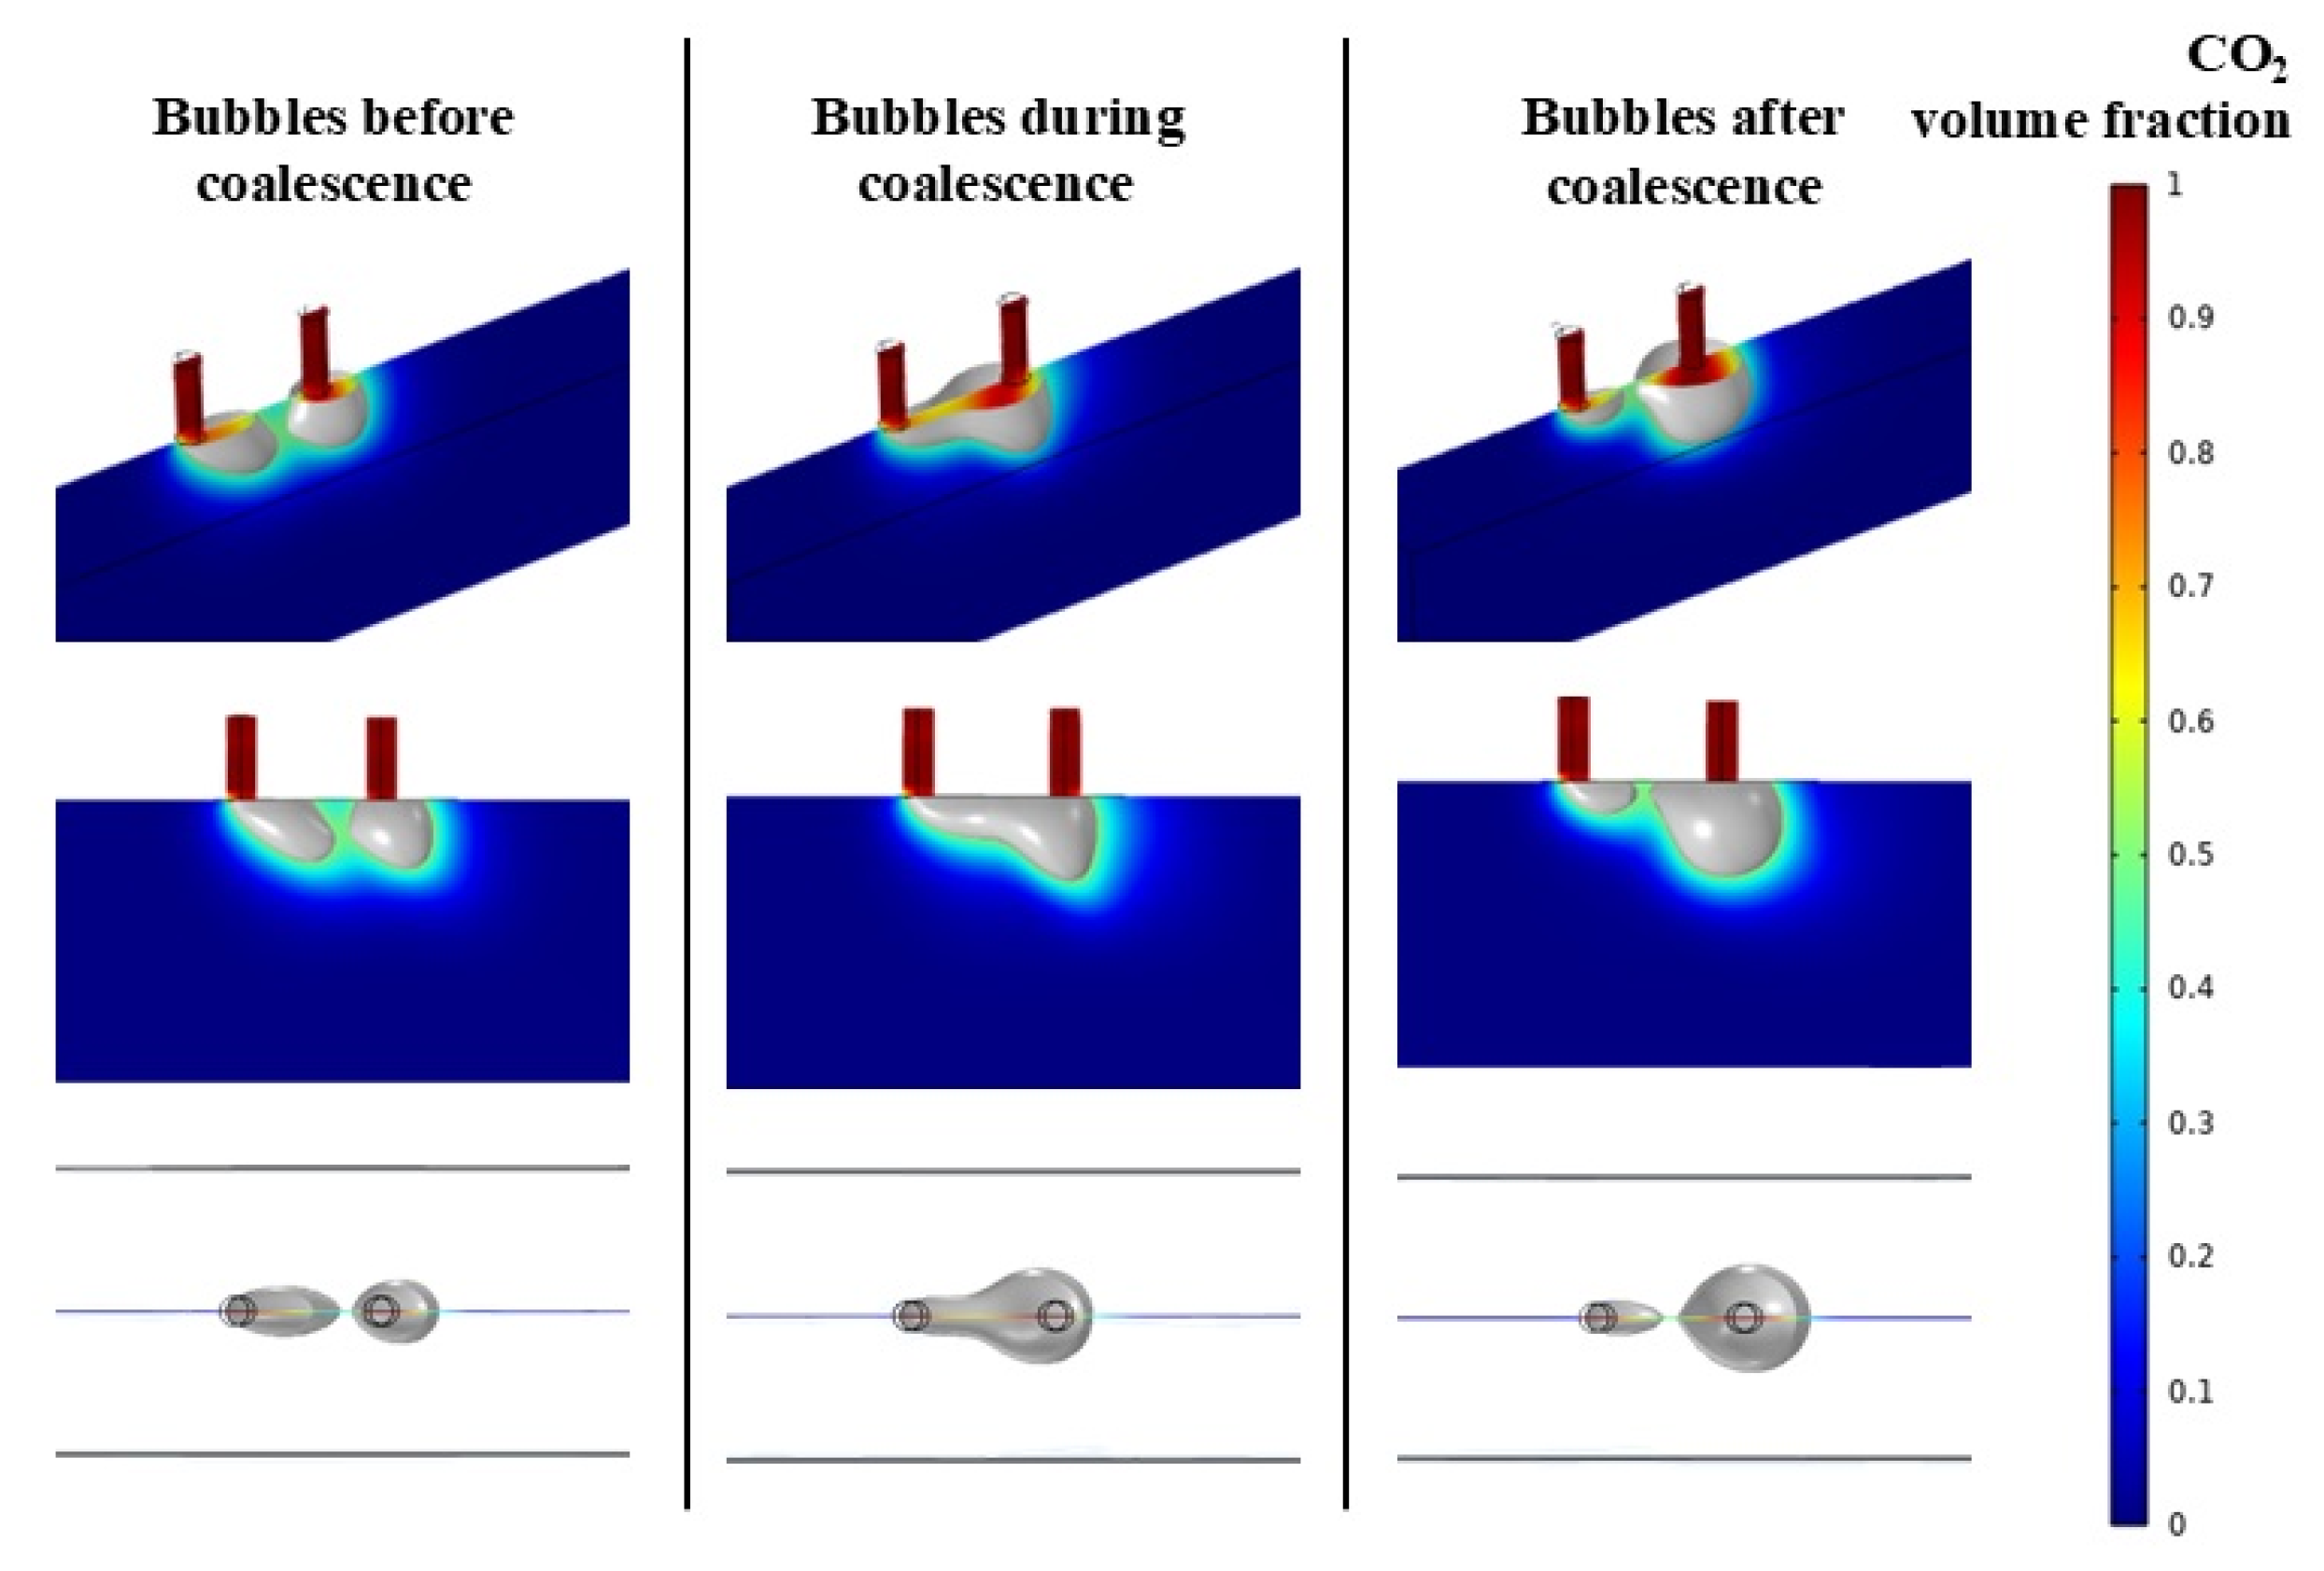
Bubble coalescence is a complex physical process. It primarily manifests as the gradual convergence of two or more small bubbles formed in the diffusion layer, driven by various forces, ultimately merging into a larger bubble. This typically occurs at the interface between the flow channel and the diffusion layer. The dynamic coalescence process is illustrated in Figure 5.
Figure 5.
Three perspective diagrams of the bubble coalescence process.
Figure 5 illustrates the bubble coalescence process from three perspectives: a three-dimensional perspective view, a cross-sectional view of the flow channel, and an axial top view of the bubbles. Before coalescence, the three-dimensional perspective view shows two bubbles growing separately from the orifices of the diffusion layer. The cross-section view and top view reveal a distinct gap between the two bubbles, indicating that no interface contact or deformation has yet occurred. Two bubbles gradually grow larger and approach each other, eventually undergoing coalescence into a larger aggregate bubble. Under the shear forces generated by liquid flow, adjacent bubbles experience the uneven distribution of the shear-lift force during their growth. As bubbles draw closer, they undergo deformation and oscillation, thereby promoting coalescence. During coalescence, the 3D perspective view reveals fusion at the bubble interfaces where they contact, forming a “waist-like” shape at the top. This indicates that coalescence occurs before the bubbles have fully detached from the pores of the diffusion layer. In the cross-section, the bubble volume has significantly increased. In the top view, the interfaces between bubbles have merged into a single, asymmetrical coalesced bubble structure. This occurs because the downstream region has relatively low flow velocity, reduced shear disturbance, and lower local pressure—conditions that favor continued bubble growth and greater gas accumulation. After coalescence, bubbles may separate again, but their separation diameter increases significantly. If no distinct bubble boundary emerges during the calculation, the flow regime is defined as dissipative flow. If the bubble boundary contacts the upper or lower boundary of the flow channel during the calculation, the flow regime is defined as plug flow.
3.2. Effect of Methanol Inlet Velocity on Bubble Coalescence
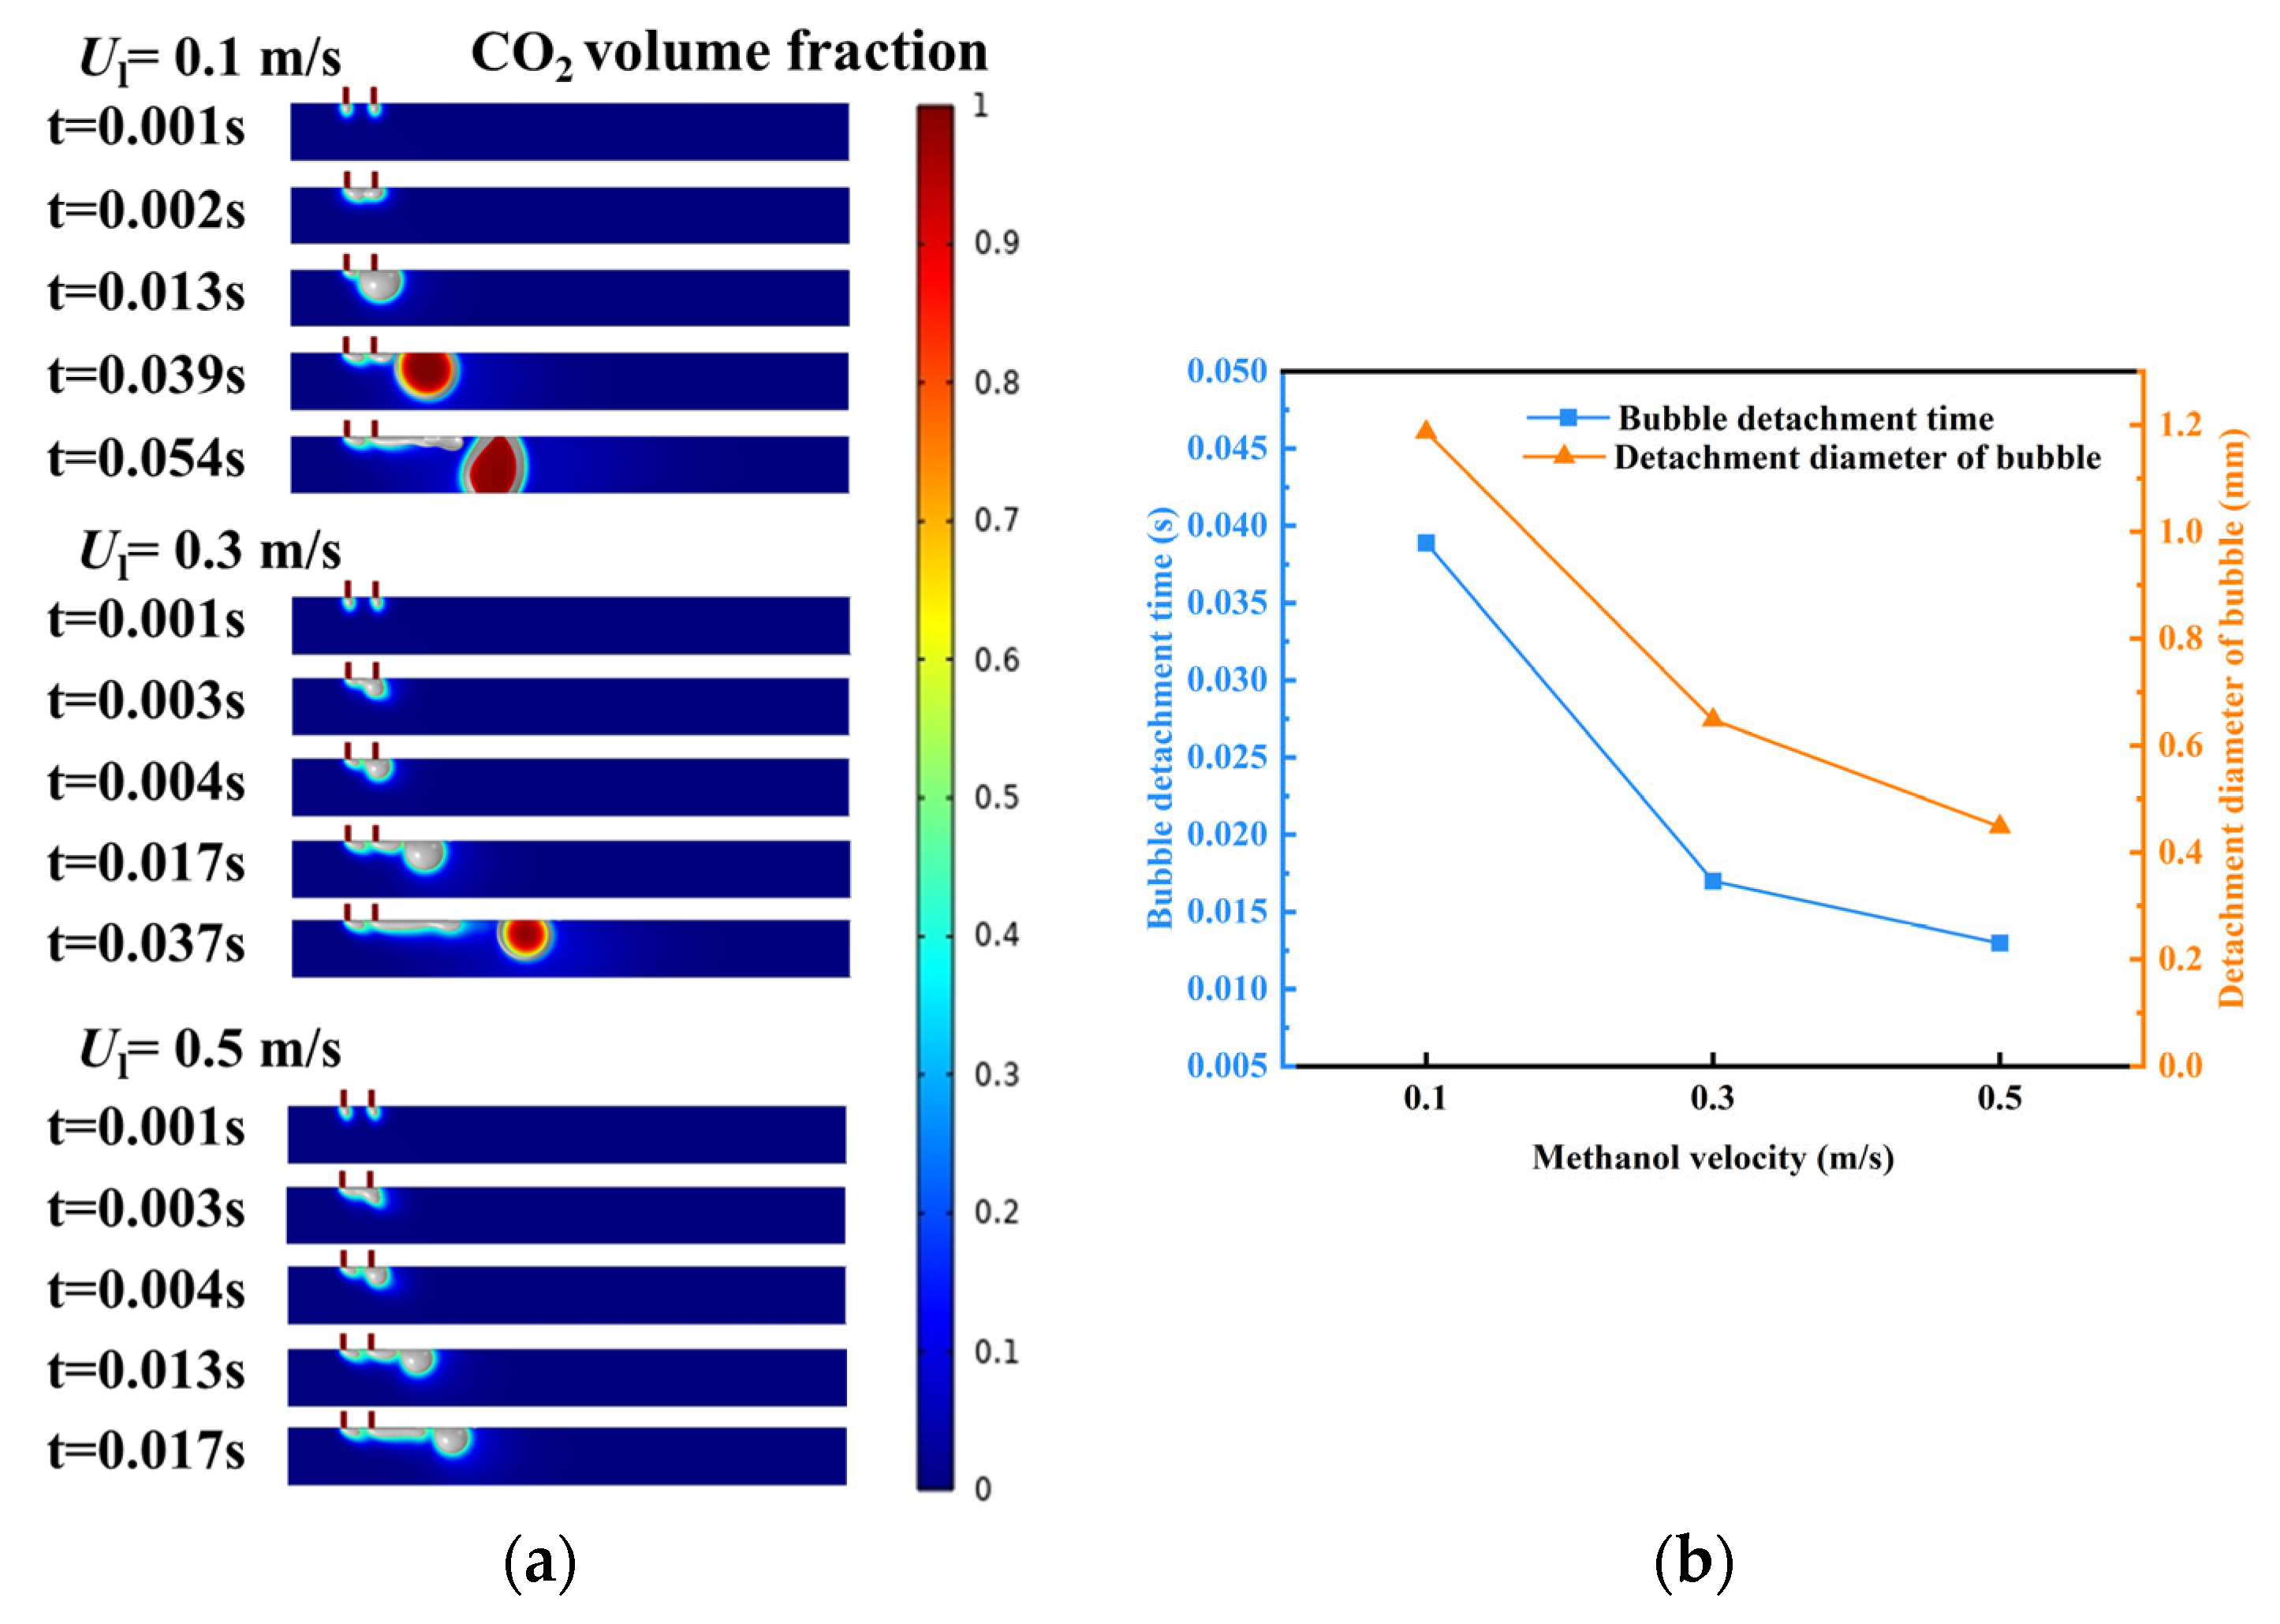
Figure 6a shows the distribution of bubble volume fraction, and Figure 6b illustrates the variation in bubble detachment diameter and detachment time at methanol flow rates of 0.1 m/s, 0.3 m/s, and 0.5 m/s.
Figure 6.
(a) Volume fraction distribution of bubbles and (b) curves of bubble detachment time and detachment diameter under different methanol inlet velocities.
In Figure 6a, each group of figures contains five subplots. From top to bottom, they represent the initial moment, the moment when bubble coalescence begins, the moment when coalesced bubbles separate, the moment when bubbles detach from the orifice, and subsequent developments. At a methanol flow velocity of 0.1 m/s, both drag forces and the shear-lift force acting on the bubbles are relatively weak. The two bubbles have ample time to approach each other and coalesce into a larger coalesced bubble before separating again. The coalesced bubble exhibits a large volume; its detachment diameter exceeds the channel diameter, demonstrating typical slug flow characteristics. In the dual-pore model, the partial velocity field distribution around the two bubbles is uneven. The bubble near the inlet is difficult to grow stably due to stronger drag and shear lift forces, which cause it to migrate along the flow direction. The rear bubble experiences lower local flow velocities and reduced drag forces, facilitating the formation of larger bubbles. At low flow velocity, the system becomes more sensitive to flow field disturbances, making the difference in bubble sizes more pronounced at a methanol flow velocity of 0.1 m/s. At a methanol flow velocity of 0.3 m/s, increased drag forces accelerate bubble detachment from the orifice. Concurrently, the effect of the shear-lift force becomes more pronounced, causing bubbles to stretch and separate before sufficient coalescence occurs. Some bubbles form multiple smaller bubbles after brief contact or partial coalescence due to the shear-lift force, initiating a transition toward a bubbly flow pattern. At a methanol flow velocity of 0.5 m/s, the drag force and the shear-lift force intensify further. Bubbles separate upon initial contact or even before contact, significantly inhibiting the coalescence process. Bubbles detach rapidly at smaller volumes, increasing the separation frequency and making the bubble flow characteristics more pronounced.
Figure 6b further illustrates the effects of methanol flow velocity on separation diameter and separation time. It can be observed that for all pore sizes, both bubble separation time and separation diameter decrease significantly with increasing methanol inlet velocity. This indicates that high flow rates are beneficial for reducing bubble residence time, preventing the formation of large bubbles, and thereby enhancing mass transfer efficiency in DMFCs.
3.3. Effect of Pore Size on Bubble Coalescence
The pore size of the diffusion layer plays a crucial role in gas transport and product removal. Common materials include carbon paper or carbon cloth [,], with pore sizes ranging from 20 μm to 250 μm. This section investigates how gas transport efficiency can be enhanced by modifying pore size. According to Equation (21), the CO2 flow rate generated in a DMFC is directly related to the fuel cell current density []:
where I represents the given current density. In experimental systems, this current density empirically spans a range from tens to hundreds of milliamps per square centimeter. Different pore sizes affect the CO2 volumetric flow rate through each pore. We assume that the total void area at the interfaces of the four materials with varying pore sizes is identical. CO2 enters the flow channel through carbon cloth with the same total area.
The subscript “tot” represents the entire interface, while the subscript “pore” represents the case of a single pore. Building on this assumption, calculations reveal that the effective flow velocity is consistent for different pore sizes. For further analysis, and considering the bond number, pore sizes between 50 and 130 μm are selected. The CO2 inlet velocity is 0.1 m/s, the liquid velocity is 0.3 m/s, the pore spacing is 0.5 mm, and the diffusion layer contact angle is 60°.
Figure 7 shows the distribution of bubble volume fractions, bubble detachment time and diameter curves at different pore sizes. Figure 7a shows that at a pore size of 50 μm, the surface tension is too low for the gas to coalesce into bubbles; instead, it forms a dissipative flow. At pore sizes between 80 μm and 130 μm, the gas–liquid flow velocity remains constant, making shear-lift force a minor factor at this stage. At a pore size of 80 μm, bubble coalescence did not occur. Although the bubble surfaces did not contact, both bubbles tilted toward the center due to the higher gas fraction and lower liquid density between the two pores. At 0.013 s, the liquid shear-lift force acting on the left pore bubble exceeds that on the right pore bubble. Consequently, the gas between the bubbles flows with the methanol into the right pore bubble, making it noticeably larger than the left hole bubble. Since the bubbles never detach from the orifice, their surface tension force continuously increases, leading to detachment at 0.022 s.
Figure 7.
(a) Volume fraction distribution of bubbles and (b) curves of bubble detachment time and detachment diameter at the same mass flow velocity under different pore sizes.
At pore sizes of 100 and 130 μm, bubble coalescence becomes more likely as the pore size increases. The coalescence time is 0.003 s for a 100 μm pore size and 0.002 s for a 130 μm pore size. This is partly due to the increased drag force and surface tension force acting on the bubbles. On the other hand, as the center distance between the pores remains constant while the aperture increases, the reduced spacing between pore orifices causes bubble edges to approach closer, facilitating aggregation and resulting in larger aggregated bubble volumes. However, the bubble separation time increases from 0.004 s to 0.008 s. This is because inertia significantly increases, requiring greater resistance to be overcome during separation. Bubble detachment time increases from 0.017 s to 0.019 s, because volumetric flow rate increases with the square of the pore size, and higher surface tension inhibits bubble detachment.
Figure 7b shows that the bubble detachment diameter increases with increasing pore size. This occurs because the volumetric flow rate is positively correlated with the square of the pore size. When the detachment time falls within the range of 0.017 s to 0.022 s, the variation in cumulative gas volume is primarily influenced by the pore size. Larger pore sizes accommodate more gas within the bubble, resulting in a larger bubble detachment diameter. The detachment time first shortens and then lengthens. This occurs because bubbles at 80 μm can be considered as single bubble detachment. The volume of a single bubble is much smaller than that of a coalesced bubble, which experiences less drag force and is thus more difficult to detach. At pore sizes of 100 μm and 130 μm, higher surface tension inhibits bubble detachment.
3.4. Effect of Pore Spacing on Bubble Coalescence
The size of the pore spacing on the diffusion layer affects the nucleation sites and the number of CO2 bubbles. In this section, the methanol inlet velocity is 0.3 m/s, and the CO2 inlet velocity is 0.1 m/s. As shown in Figure 8a, when the pore spacing is 0.3 mm, bubbles coalesce at 0.001 s. Due to the smaller pore spacing, the interaction forces between adjacent bubbles are stronger, making it easier for bubbles to contact and coalesce. Near the pore orifices, the gas volume fraction is high. As the pore spacing increases, the gas volume fraction and bubble distribution gradually become more dispersed. At a pore space of 0.5 mm, bubbles coalesce near the orifice at 0.003 s. As the spacing further increases to 0.8 mm, inter-bubble interactions weaken. Bubbles formed at the orifice can grow and detach more independently, exhibiting smaller volumes and a more dispersed distribution. They rapidly exit the orifice into the flow channel. When the pore spacing increased to 1 mm, two bubbles detached from the orifices at 0.1 s. The first detached bubble coalesced with a new bubble from the second orifice at 0.11 s, undergoing secondary coalescence and detachment during flow. During bubble detachment, a phenomenon in which elongated necks are drawn between bubbles is clearly observable. This occurs because the surface tension force acts to minimize the bubble surface area, causing the gas connecting two bubbles to stretch into a slender neck.
Figure 8.
(a) Volume fraction distribution of bubbles and (b) curves of bubble detachment time and detachment diameter under different pore spacing.
Figure 8b shows the variation curves of bubble detachment diameter and detachment time for different hole spacings. The curves reveal that both bubble detachment time and detachment diameter first increase and then decrease with the increase in pore spacing. At 0.3 mm spacing, the detachment diameter is relatively low, and the detachment time is relatively short. This occurs because the smaller spacing causes bubbles to coalesce earlier into larger bubbles, which experience greater shear and inertial forces than uncoalesced smaller bubbles, leading to faster detachment. This accelerated detachment actually reduces the likelihood of contact with other bubbles, lowering the frequency of bubble coalescence. Consequently, the bubbles generally detach at smaller volumes, making it easier to obtain uniformly distributed, small-sized CO2 bubbles.
When the pore spacing increases to 0.5 mm, bubbles have greater growth space and a longer growth cycle. Bubbles are less prone to coalescing during growth. However, after detaching from the left pore, the methanol velocity causes bubbles to coalesce with bubbles from the right pore during movement. This leads to gradual bubble enlargement and slower detachment time. At pore spacings below 0.5 mm, bubbles are relatively large with greater inertial forces, but wall resistance is also high, making bubble detachment difficult. At a spacing of 0.8 mm, bubbles aggregate for a relatively short time at the orifice, resulting in smaller bubbles and lower wall resistance. The increased spacing significantly reduces interference between bubbles, allowing shear-lift forces to act more effectively on individual bubbles and promoting rapid detachment. Finally, at a pore spacing of 1 mm, bubbles detach at a very small diameter. However, during their subsequent movement, these bubbles continuously coalesce with other small bubbles, further promoting aggregation behavior.
3.5. Effect of Contact Angle on Bubble Coalescence
The diffusion layer contact angle is the angle formed between the liquid and the diffusion layer wall surface. A larger contact angle indicates a more hydrophobic solid surface. As a parameter for measuring surface wettability, it directly influences the adhesion, aggregation, and detachment characteristics of bubbles at the orifice. This section investigates bubble behavior on four representative wetted surfaces with contact angles of 30°, 60°, 90°, and 120°, under conditions of methanol flow velocity 0.3 m/s and CO2 inlet velocity 0.1 m/s.
Figure 9 shows the distribution of bubble volume fractions, bubble detachment time and diameter curves at different contact angles. As shown in Figure 9a, when the contact angle is 30°, the bubble flow type exhibits bubble dissipation flow. No coalescence occurs at the orifice, and no complete bubble forms. Small bubbles coalesce in the middle of the flow channel and move forward. At a contact angle of 60°, bubbles coalesce at 0.003 s and separate at 0.004 s. By 0.015 s, bubbles detach from the orifice and easily coalesce with other bubbles within the flow channel. At a contact angle of 90°, bubbles coalesce at 0.002 s and separate at 0.018 s. The longer coalescence time results in larger bubble growth volume, with bubbles exiting the orifice at 0.046 s. At a contact angle of 120°, separation becomes more difficult. Bubbles coalesce at 0.002 s, with the first bubble exiting the orifice at 0.049 s.
Figure 9.
(a) Volume fraction distribution of bubbles and (b) curves of bubble detachment time and detachment diameter under different contact angles.
Figure 9b shows the variation in bubble detachment diameter and detachment time for contact angles of 30°, 60°, 90°, and 120°. As the contact angle increases from 30° to 120°, the bubble detachment time exhibits a continuous upward trend. At a contact angle of 30°, no bubble detachment time is recorded because a complete bubble has not yet formed at the orifice. The bubble detachment diameter and time increase with the contact angle, indicating that bubbles can accumulate a greater volume of gas before detachment, forming larger volumes. A larger contact angle inhibits rapid bubble detachment, thereby prolonging the bubble formation and separation process.
Under hydrophilic walls, the contact area between bubbles and the wall is small. During growth, surface tension force dominates, causing the bubbles to maintain a spherical shape with relatively small volumes. When bubbles approach each other, their small size and high surface tension force result in a short aggregation time, making stable bonding difficult. They often separate rapidly after brief contact. After separation, these small bubbles are more prone to coalescing with other bubbles or gas molecules as they move through the flow channel. Under hydrophobic walls, bubbles tend to spread along the surface, forming a larger contact area with the wall and experiencing stronger wall viscous forces. The shear-lift force acting on them is reduced, prolonging the time required for growth and separation. Bubbles formed under these conditions are larger in volume, with lower internal pressure and reduced surface tension force. The resulting aggregated bubbles are more stable and less prone to re-separation. This phenomenon causes uneven gas distribution within the flow channel, adversely affecting the efficient mass transfer of fuel.
4. Conclusions
This study employs the commercial finite element software COMSOL Multiphysics to numerically simulate bubble growth and detachment behavior within a direct methanol fuel cell (DMFC). It systematically investigates the influencing mechanisms of CO2 bubble coalescence within the DMFC anode flow channel, focusing on analyzing the effects of methanol inlet flow velocity, diffusion layer pore size, diffusion layer pore spacing, and diffusion layer contact angle on bubble dynamics. The primary conclusions are as follows:
- (1)
- Bubble coalescence behavior: Bubbles typically coalesce at the interface between the flow channel and the diffusion layer. During coalescence, differing local velocity field distributions upstream and downstream of the bubbles, coupled with uneven shear and pressure distributions, result in size discrepancies between the two bubbles. The resulting coalesced bubble exhibits a larger detachment diameter.
- (2)
- Effect of methanol inlet flow velocity on bubble coalescence behavior: At lower flow velocities, the drag force and the shear-lift force are weaker, allowing bubbles to linger longer at the orifice and facilitating coalescence into larger bubbles. As flow velocity increases, the drag force and the shear-lift force intensify, causing bubbles to be detached before complete coalescence occurs. This shortens the coalescence time and may even prevent coalescence, resulting in bubbles rapidly detaching at smaller volumes.
- (3)
- Effect of pore size on bubble coalescence behavior: At a pore size of 50 μm, bubbles do not form. At a pore size of 80 μm, due to the surface tension force being lower than the drag force, the gas cannot gather on the pore surface. The surface tension increases with the increase in pore size, forming a bubble on the pore surface. The adjacent bubbles coalesce when the pore size is larger than 100 μm.
- (4)
- Effect of pore spacing on bubble coalescence behavior: pore spacing directly influences the frequency and intensity of coalescence by altering the spatial distribution of bubble nucleation sites. When the hole spacing is 0.3 mm, adjacent bubbles coalesce before detachment due to their proximity, forming large bubbles that detach rapidly. When the pore spacing increases to 1.0 mm, the detachment time and detachment diameter of bubbles decrease, while the distance traveled after detachment increases. Bubbles contact and merge with others in the later stages of the flow channel, but their distribution becomes more uniform. Increasing the pore spacing helps suppress bubble coalescence.
- (5)
- Effect of contact angle on bubble coalescence behavior: Under hydrophilic walls, bubble coalescence occurs more rapidly. Bubbles experience greater shear forces during growth, resulting in shorter detachment times and smaller detachment diameters. However, after detachment, these bubbles readily coalesce with others while moving through the flow channel. Under hydrophobic walls, bubble coalescence time is longer. Bubbles grow close to the wall surface, experiencing lower shear-lift forces and higher wall viscous forces, making separation difficult and time-consuming. Separated bubbles have larger volumes but maintain greater spacing afterward, reducing their tendency to coalesce with others.
Author Contributions
Conceptualization, H.Z. and Y.T.; methodology, H.Z.; software, Y.T.; validation, Z.T. and Y.T.; formal analysis, Z.T.; investigation, Z.T.; resources, J.Z.; data curation, J.W.; writing—original draft preparation, Y.T.; writing—review and editing, Z.T. and J.Z.; visualization, J.W.; supervision, H.Z.; project administration, H.Z.; funding acquisition, H.Z. All authors have read and agreed to the published version of the manuscript.
Funding
This research received no external funding.
Data Availability Statement
The original contributions presented in the study are included in the article, further inquiries can be directed to the corresponding author.
Acknowledgments
The contributions of all the coauthors are gratefully acknowledged.
Conflicts of Interest
The authors declare no conflicts of interest.
References
- Ong, B.C.; Kamarudin, S.K.; Basri, S. Direct Liquid Fuel Cells: A Review. Int. J. Hydrogen Energy 2017, 42, 10142–10157. [Google Scholar] [CrossRef]
- Souza, F.M.; Pinheiro, V.S.; Gentil, T.C.; Lucchetti, L.E.B.; Silva, J.C.M.; Santos, M.; De Oliveira, I.; Dourado, W.M.C.; Amaral-Labat, G.; Okamoto, S.; et al. Alkaline Direct Liquid Fuel Cells: Advances, Challenges and Perspectives. J. Electroanal. Chem. 2022, 922, 116712. [Google Scholar] [CrossRef]
- Kulikovsky, A.A. Model of the Flow with Bubbles in the Anode Channel and Performance of a Direct Methanol Fuel Cell. Electrochem. Commun. 2005, 7, 237–243. [Google Scholar] [CrossRef]
- Alias, M.S.; Kamarudin, S.K.; Zainoodin, A.M.; Masdar, M.S. Active Direct Methanol Fuel Cell: An Overview. Int. J. Hydrogen Energy 2020, 45, 19620–19641. [Google Scholar] [CrossRef]
- Balzer, R.J.; Vogt, H. Effect of Electrolyte Flow on the Bubble Coverage of Vertical Gas-Evolving Electrodes. J. Electrochem. Soc. 2003, 150, E11. [Google Scholar] [CrossRef]
- Vogt, H.; Balzer, R.J. The Bubble Coverage of Gas-Evolving Electrodes in Stagnant Electrolytes. Electrochim. Acta 2005, 50, 2073–2079. [Google Scholar] [CrossRef]
- Tavakoli, B.; Roshandel, R. The Effect of Fuel Cell Operational Conditions on the Water Content Distribution in the Polymer Electrolyte Membrane. Renew. Energy 2011, 36, 3319–3331. [Google Scholar] [CrossRef]
- Yuan, W.; Wang, A.; Ye, G.; Pan, B.; Tang, K.; Chen, H. Dynamic Relationship between the CO2 Gas Bubble Behavior and the Pressure Drop Characteristics in the Anode Flow Field of an Active Liquid-Feed Direct Methanol Fuel Cell. Appl. Energy 2017, 188, 431–443. [Google Scholar] [CrossRef]
- Luo, W.-J.; Kuan, Y.-D.; Sung, M.-F.; Huang, M.-S.; Hsu, Y.-W. Direct Methanol Fuel Cell Bubble Removal Mechanism Using Magnetic Actuation. Int. J. Green Energy 2017, 14, 1172–1177. [Google Scholar] [CrossRef]
- Kang, S.; Zhou, B. Numerical Study of Bubble Generation and Transport in a Serpentine Channel with a T-Junction. Int. J. Hydrogen Energy 2014, 39, 2325–2333. [Google Scholar] [CrossRef]
- Zheng, W.; Suominen, A.; Lagercrantz, H.; Tuominen, A. A Two-Dimensional Model for CO2/Fuel Multiphase Flow on the Anode Side of a DMFC. J. Fuel Cell Sci. Technol. 2012, 9, 011009. [Google Scholar] [CrossRef]
- Zhou, Y.; Yang, Y.; Zhu, X.; Ye, D.; Chen, R.; Liao, Q. Bubble-Trap Layer for Effective Removing Gas Bubbles and Stabilizing Power Generation in Direct Liquid Fuel Cell. J. Power Sources 2021, 507, 230260. [Google Scholar] [CrossRef]
- Yuan, Z.; Zhang, Y.; Fu, W.; Li, Z.; Liu, X. Investigation of Corner Effect on Micro-Scale Flow of μDMFC. Microelectron. Eng. 2013, 111, 96–100. [Google Scholar] [CrossRef]
- Yuan, Z.; Zhang, Y.; Leng, J.; Gao, Y.; Liu, X. Development of a 4-Cell Air-Breathing Micro Direct Methanol Fuel Cell Stack. J. Power Sources 2012, 202, 134–142. [Google Scholar] [CrossRef]
- Su, X.; Yuan, W.; Lu, B.; Zheng, T.; Ke, Y.; Zhuang, Z.; Zhao, Y.; Tang, Y.; Zhang, S. CO2 Bubble Behaviors and Two-Phase Flow Characteristics in Single-Serpentine Sinusoidal Corrugated Channels of Direct Methanol Fuel Cell. J. Power Sources 2020, 450, 227621. [Google Scholar] [CrossRef]
- Falcão, D.S.; Pereira, J.P.; Pinto, A.M.F.R. Numerical Simulations of Anode Two-Phase Flow in Micro-DMFC Using the Volume of Fluid Method. Int. J. Hydrogen Energy 2016, 41, 19724–19730. [Google Scholar] [CrossRef]
- Jain, D.; Kuipers, J.A.M.; Deen, N.G. Numerical Study of Coalescence and Breakup in a Bubble Column Using a Hybrid Volume of Fluid and Discrete Bubble Model Approach. Chem. Eng. Sci. 2014, 119, 134–146. [Google Scholar] [CrossRef]
- Colin, C.; Riou, X.; Fabre, J. Bubble Coalescence in Gas–Liquid Flow at Microgravity Conditions. Microgravity Sci. Technol. 2008, 20, 243–246. [Google Scholar] [CrossRef]
- Wen, J.; Sun, Q.; Sun, Z.; Gu, H. Bubble Coalescence Efficiency near Multi-Orifice Plate. Chin. J. Chem. Eng. 2019, 27, 1765–1776. [Google Scholar] [CrossRef]
- Yonemoto, Y.; Kunugi, T. Fundamental Numerical Simulation of Microbubble Interaction Using Multi-Scale Multiphase Flow Equation. Microgravity Sci. Technol. 2010, 22, 397–405. [Google Scholar] [CrossRef]
- Zheng, S.; Xu, K.; Zhang, D. Reactive Precipitation during Overlaying CO2 Dissolution into Brine: The Role of Porous Structure. Adv. Water Resour. 2025, 196, 104880. [Google Scholar] [CrossRef]
- Yuan, W.; Wang, A.; Yan, Z.; Tan, Z.; Tang, Y.; Xia, H. Visualization of Two-Phase Flow and Temperature Characteristics of an Active Liquid-Feed Direct Methanol Fuel Cell with Diverse Flow Fields. Appl. Energy 2016, 179, 85–98. [Google Scholar] [CrossRef]
- Wong, C.W.; Zhao, T.S.; Ye, Q.; Liu, J.G. Transient Capillary Blocking in the Flow Field of a Micro-DMFC and Its Effect on Cell Performance. J. Electrochem. Soc. 2005, 152, A1600. [Google Scholar] [CrossRef]
- Paust, N.; Litterst, C.; Metz, T.; Eck, M.; Ziegler, C.; Zengerle, R.; Koltay, P. Capillary-Driven Pumping for Passive Degassing and Fuel Supply in Direct Methanol Fuel Cells. Microfluid. Nanofluid. 2009, 7, 531–543. [Google Scholar] [CrossRef]
- Tong, Y.; Zhou, H.; Tian, Z.; Zhu, J.; Zhu, J. Analysis of CO2 Bubble Growth Detachment Kinetics in Direct Methanol Fuel Cell Flow Channels. J. Power Sources 2025, 628, 235880. [Google Scholar] [CrossRef]
- Nahra, H.K.; Kamotani, Y. Prediction of Bubble Diameter at Detachment from a Wall Orifice in Liquid Cross-Flow under Reduced Andnormal Gravity Conditions. Chem. Eng. Sci. 2003, 58, 55–69. [Google Scholar] [CrossRef]
- Liu, C.; Liang, B.; Tang, S.; Zhang, H.; Min, E. A Theoretical Model for the Size Prediction of Single Bubbles Formed under Liquid Cross-Flow. Chin. J. Chem. Eng. 2010, 18, 770–776. [Google Scholar] [CrossRef]
- Eskin, D.; Meretskaya, E.; Vikhansky, A. A Model of Breakup of a Rising Bubble in a Turbulent Flow. Chem. Eng. Sci. 2020, 226, 115846. [Google Scholar] [CrossRef]
- Gnyloskurenko, S.V.; Byakova, A.V.; Raychenko, O.I.; Nakamura, T. Influence of Wetting Conditions on Bubble Formation at Orifice in an Inviscid Liquid. Transformation of Bubble Shape and Size. Colloids Surf. A Physicochem. Eng. Asp. 2003, 218, 73–87. [Google Scholar] [CrossRef]
- Zhang, H. Bubble Behavior in Anode Channel of Direct Methanol Fuel Cells. Ph.D. Thesis, Zhejiang University of Technology, Hangzhou, China, 2011. [Google Scholar] [CrossRef]
- Lu, G.Q.; Wang, C.Y. Electrochemical and Flow Characterization of a Direct Methanol Fuel Cell. J. Power Sources 2004, 134, 33–40. [Google Scholar] [CrossRef]
- Yuan, W.; Tang, Y.; Yang, X.; Liu, B.; Wan, Z. Structural Diversity and Orientation Dependence of a Liquid-Fed Passive Air-Breathing Direct Methanol Fuel Cell. Int. J. Hydrogen Energy 2012, 37, 9298–9313. [Google Scholar] [CrossRef]
Disclaimer/Publisher’s Note: The statements, opinions and data contained in all publications are solely those of the individual author(s) and contributor(s) and not of MDPI and/or the editor(s). MDPI and/or the editor(s) disclaim responsibility for any injury to people or property resulting from any ideas, methods, instructions or products referred to in the content. |
© 2025 by the authors. Licensee MDPI, Basel, Switzerland. This article is an open access article distributed under the terms and conditions of the Creative Commons Attribution (CC BY) license (https://creativecommons.org/licenses/by/4.0/).