Abstract
Effective categorization of geothermal resources is essential for strategic and sustainable energy development. Despite the considerable geothermal potential in Spain, utilization remains limited, underscoring the need for advanced and practical assessment methods. This study proposes a structured framework for geothermal resource classification in Catalonia, based on a constructed matrix of features that integrates subsurface temperature, geothermal gradient, and thermal conductivity. The matrix enables resource clustering into potential classes, improving interpretability and regional assessment. The analysis employed predictions from a pretrained hybrid artificial intelligence model optimized using a modified Bat algorithm. At depths between 50 and 150 m, a 20–30% increase in temperature leads to a 30–50% rise in geothermal potential. Approximately 11.5% of sites exhibit high potential and 28.2% moderate potential, indicating the reliability of the adopted framework for geothermal energy source site prioritization. The proposed matrix offers a scalable tool for geothermal evaluation, minimizing exploration risk and supporting sustainable energy planning across diverse geological settings.
1. Introduction
Access to energy resources remains a critical global concern, and the shift to renewable energy sources has emerged as a strategy to ensure minimal environmental footprint and foster sustainable development [,]. Among renewable energies, the reliability of geothermal resources is highlighted more due to their long-term availability and lower carbon intensity, as well as their support for both energy independence and economic diversification [,]. From this point of view, the notably steady expansion of geothermal applications in Europe [] and the hotspot potentials in Spain, due to high subsurface temperatures at shallow depths [], can be highlighted. However, geothermal utilization, and especially the unequal progress in power generation compared to other renewables in Spain, remains limited []. Nonetheless, Spain’s National Plan for Energy and Climate (PNIEC) aim to boost geothermal capacity to 2 GW by 2050 through pilot projects, research and development, and supportive policy instruments [,]. Achieving such ambitions requires developing advanced tools to characterize geothermal reservoirs, reduce exploration risks, and identify productive hotspots.
In the context of geothermal reservoirs, the lack of a universally accepted temperature-based classification has led to several categorizing schemes for different applications []. Sanyal (2005) classified the geothermal resources into seven categories, including non-electrical (<100 °C), very low temperature (100–150 °C), low temperature (150–190 °C), moderate temperature (190–230 °C), high temperature (230–300 °C), ultra-high temperature (>300 °C), and steam fields (approximately 240 °C with steam as the only mobile phase) []. As presented by Cano et al. (2022) [] and referencing Williams et al. (2011) [], the USGS divides resources into low (<90 °C), medium (90–150 °C), and high (>150 °C) enthalpy, which has also been noted by other scholars (Table 1). Furthermore, there is another typical classification of reservoirs into high (>225 °C), intermediate (125–225 °C), and low (<125 °C) temperatures []. These classifications denote the importance of geothermal resources on regional scales.

Table 1.
Categories of geothermal reservoirs based on the USGS.
To assess geothermal potential, parameters such as geothermal gradient, porosity, permeability, salinity, thermal conductivity, and specific heat capacity play critical roles [,]. However, acquiring such information requires continuous borehole monitoring, which is costly, time-consuming, and challenging [,,]. Among the effective factors, thermal conductivity plays a crucial role in evaluating reservoir efficiency because it governs heat transfer to the wellbore. This property is assessed through lab tests or geological data to optimize energy extraction and system performance []. However, there are generally known trends regarding how thermal conductivity varies with both temperature and porosity [].
Recent geothermal exploration approaches often rely on approximations through geophysical methods [], GIS-based spatial analysis [], numerical modeling [], and geological surveys []. Despite their effectiveness, these approaches can be computationally intensive, analytically complex, and limited in generating generalized, high-resolution 3D models [,].
To address these challenges, artificial intelligence (AI) has increasingly been applied to geothermal exploration, enabling the treatment of multisource large datasets, learning complex relationships, and generating predictive 3D subsurface models [,,]. Over the last two decades, AI methods in the form of neural networks, deep learning, evolutionary algorithms, and hybrid topologies have shown success in predicting hotspot locations, spatial temperature mapping, and assessing geothermal production potential [,,,]. The use of AI is further enhanced through metaheuristic algorithms that aim for performance improvement by iteratively searching for near-optimal solutions in complex and high-dimensional spaces [,,]. Although metaheuristics do not always guarantee global optimality [], their flexibility, robustness, and efficiency make them valuable tools in geothermal modeling [,].
Building on this foundation, the present study presents a new framework for clustering geothermal resource assessment in Catalonia, Spain. The applied procedure classifies the resource potential via a constructed matrix of attributes, including different effective parameters. The capability of this method was then examined for predicted temperature at different depths via the model introduced by Mirfallah et al. (2024) []. This approach addresses the limitations of single-algorithm frameworks by integrating different attributes to reduce exploration risks and support Spain’s pathway toward sustainable geothermal development.
2. Study Area and Data Source
The northeastern region of Spain, particularly Catalonia, shows a complex geological setting shaped by tectonics, volcanism, sedimentation, and erosion over millions of years. At the northeastern tip of the Iberian Peninsula, the area includes the Pyrenees, the Ebro Basin, volcanic fields such as La Garrotxa, and karstic landscapes like Montserrat [,,]. This diversity reflects considerable geothermal potential, especially in zones influenced by volcanic and tectonic processes [,].
The Pyrenees and Catalan Coastal Ranges, underlain by Paleozoic crust and intersected by active tectonic structures, provide favorable conditions for geothermal development. Quaternary volcanism in La Garrotxa offers shallow heat sources, while the Ebro Basin’s sedimentary layers and karst aquifers suggest possible geothermal reservoirs.
This study examines a 7942 km2 sector in northeastern Catalonia (Figure 1), extending from the Catalan Coastal Ranges to the Eastern Pyrenees. The region is mainly based on Paleozoic crust modified by later sedimentary processes [] and includes a Paleogene compressive basin formed during the uplift of the Pyrenees and Coastal Ranges []. The geological framework reflects the transition from compressional to extensional tectonics, with key features such as the Valencia Trough, the Catalan Coastal Ranges, and the Empordà Basin. The latter originated in the late Miocene–Pliocene due to extensional tectonics above older Pyrenean structures formed under compression []. Despite their relatively thin crust, the Catalan Coastal Ranges rise to about 1700 m, explained by uplift, erosion, and flexural isostatic rebound [].
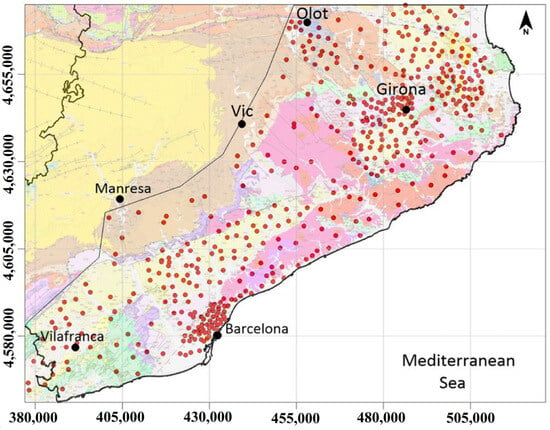
Figure 1.
The location of the study area integrated with the sampled points and nearby cities.
Previous studies have highlighted geothermal potential in Vallès, Empordà, La Selva, Penedès, Fossa d’Olot, Plana de Vic, Depressió Central (Lleida), and Maresme. Building on this, the present work covers a broader area that integrates all these promising zones (Figure 1). For analysis, 496 stochastic datasets were obtained from the Cartographic and Geological Institute of Catalonia (ICGC) (Figure 1), including longitude (X), latitude (Y), elevation (Z), and surface temperature (Ts), and monitored temperatures at depths of 50 and 150 m [,].
Altogether, this geological context and dataset provide a robust basis for assessing the geothermal potential of northern Catalonia.
3. Clustering Configuration Framework
Referring to the outcomes of large-scale assessments [,] and presented recommendations [], the technical potential is calculated as a fraction of the heat in place using a recovery factor. From this point of view, the clustering analyses were performed using 0.75 (capacity factor), 0.4 for system efficiency, and 8760 operating hours/year for full-time functionality.
Using predicted temperatures by [], the clustering analysis was conducted by means of a symbolic feature matrix, where the rows correspond to depth z (50, 120, 150, and 180 m) while the columns represent the ΔTs,z (temperature difference between surface and depth z in °C), (geothermal gradient at depth z in °C/m), λ (thermal conductivity), q (heat flux in W/m2), SF (empirical scaling factor at depth), Pd (Geothermal potential in MWh/y), Cd (capacity in Mw) and Ed (annual energy in GWh/y) as:
This matrix, after completion, can be classified into different categories, i.e., ‘weak’, ‘moderate’, ‘good’ and ‘very good’ based on their thermal profile. To fulfill the required array, the recalculation control via measured temperatures at the surface and any depth (z), considering the geothermal gradient (G), was carried out by:
Accordingly, considering the temperature difference as a clustering feature, the average heat flow proxy can be calculated via:
As a result, Equation (2) can be rewritten as:
where qz and λz denote the heat flux (W/m2) and formation conductivity (W/mK) at depth z. The term dz/dT expresses the temperature gradient, which often varies between 0.03 and 0.1 °C/m.
Referring to the variation in λ and implemented corrections [], the following modification was carried out:
Subsequently, by converting the gradient from °C/km to °C/m the heat flaw at depth z in (W/m2) is calculated by:
The empirical scaling factors [] in this study were considered as 1.2, 1.32, 1.5, and 1.55 for the depths 50, 120, 150, and 180, respectively. The capacity (cd) and energy production (Ed) were then obtained via:
Such feature augmentation enhances the clustered class results with performance-related variables. To evaluate how well the predicted temperatures by the deep learning model and heat flow at depth z, the clustering can be supplemented by model error. In this approach, the data are clustered by similarity in prediction error (e.g., areas where the model over- or under-predicts) as:
Accordingly, the heat flux error can be evaluated by:
As a summary of the above configurations, the proposed clustering analysis is performed based on numeric similarity and geospatial distribution. The data are grouped according to geothermal potential values (partitioning-based), while spatial locations are incorporated to account for density (density-based). This hybrid approach allows spatially coherent clusters with similar geothermal potentials to be identified.
4. Results and Discussion
Based on the matrix of features (Equation (1)) and parameters used (gradient, heat flow, and thermal conductivity), the spatial distribution analysis of potential classes was carried out.
4.1. Spatial Distribution of Thermal Conductivity
Thermal conductivity indicates the ability of materials to transfer heat and thus plays a crucial role in evaluating and utilizing geothermal reservoirs. While its measurement is relatively straightforward through in situ boreholes and the underlying mechanisms are well understood [], significant variability exists across geological settings, including differences in rock types, reservoir temperatures, fluid content, and hydrothermal systems. When combined with geological cross-sections, the estimated thermal conductivity supports more accurate assessments of geothermal potential, leading to valuable insights into the expected magnitude of heat that might be present in various geothermal settings [].
As presented in Figure 2, the analyzed thermal conductivity shows an average value of 2.03 W/mK. Integrating this analysis with the components of the matrix of features (temperature gradient of 37.12 °C/km and a heat flow of 0.08 W/m2) indicates proper conditions for the extraction of geothermal energy. Since thermal conductivity can provide insights into subsurface lithology [,], the physical interpretation of the results shows the presence of crystalline formations like granite and quartzite (values above 3.0 W/mK), partially intermixed with clayey formations (between 1.5 and 3.0 W/mK) and fewer components of insulating rocks (below 1.5 W/mK). Statistically, a drop of 11.1% in thermal conductivity from 50 to 150 m can physically be interpreted as a transition zone that may be attributed to different parameters, like temperature-dependent mineral transformations, enhanced fracturing, or lithological changes [].
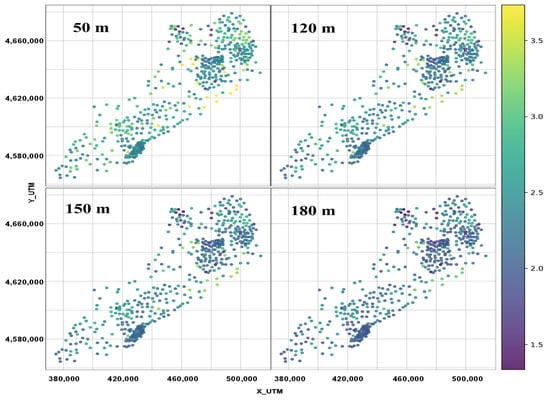
Figure 2.
Spatial distribution of thermal conductivity (W/mK) in sampled points at the depths of 50, 120, 150, 180 m.
Variations in thermal conductivity can indicate geological features such as fractures, hydrothermal alteration, or changes in fluid composition, though these effects are not yet fully understood []. This property also aids in distinguishing between different rock types when combined with other geological data. Categorizing the geothermal systems based on reservoir temperature and capacity (high temperature: >220 °C, >56 MW/km2; medium temperature: 150–220 °C, 20–56 MW/km2; low temperature: <150 °C, <10 MW/km2) helps define the potential output energy and effective resource development []. Physically, a deeper fracture can change the characteristics of heat transfer by creating porous channels. Therefore, higher temperatures can change the conductivity of minerals, especially in clays [].
Referring to Equation (4), an uncertainty of ±5–10% in λ propagates directly into heat flow estimates and may shift sites across classification boundaries (e.g., “Good” vs. “Very Good”). As a result, a site with λ = 2.5 W/mK and a gradient of 30 °C/km yields 75 mW/m2. Applying ±10% uncertainty provides an interval of [67.5, 82.5] mW/m2. This range potentially covers two classes. Such variation introduces boundary ambiguity and reduces confidence for points near threshold limits, while the certified sites within a class will not be affected. To mitigate this impact, replicated or averaged measurements should be used to reduce random error. Additionally, defining buffer zones (e.g., ±5%) around thresholds and incorporating complementary indicators such as subsurface temperature, resistivity, or geological stability can enhance classification reliability. This is the main reason why incorporating uncertainty analysis and adopting threshold buffer zones are recommended to enhance the reliability of geothermal classification.
Furthermore, previous studies have shown that thermal conductivity is generally inversely related to both porosity and, to a lesser extent, temperature. From this perspective, empirical models based on porosity and temperature can help estimate thermal conductivity in various geothermal environments [,]. However, other influencing factors, like pressure, pore fluid chemistry, and mineral composition, should also be taken into account, although data on these parameters are often limited. Consequently, empirical models based on porosity and temperature assist in estimating thermal conductivity in various geothermal environments [,,]. Integrating these variables then affects the dynamics of subsurface heat transmission and critically highlights the necessity of creating detailed geological and thermal models in the evaluation of geothermal resources.
4.2. Distribution of Geothermal Capacity and Potential
Referring to the conducted matrix of features (Equation (1)), the depth-based potential of geothermal resources was assessed through the system capacity. According to the anticipated system capacity at various depths, Figure 3 illustrates a general increase in accessible geothermal energy with depth. At 50 m, system capacity ranges from 0.4 to 0.7 kW (avg. ~0.5 kW), while it rises to 0.6–0.8 kW at 120 m, maintaining a similar minimum. The upward trend continues at 150 m, with a maximum of 0.9 kW and an average of 0.7 kW. Subsequently, the capacity stabilizes at 180 m, averaging 0.7 kW with a minimum slightly above 0.5 kW. Referring to previous studies [,], the analysis demonstrates that the viability of medium-depth geothermal systems can be further supported by this steady growth in capacity, which is compatible with the improved heat availability at deeper depths.
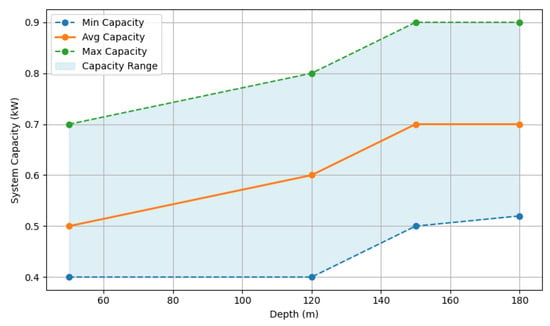
Figure 3.
Variation in geothermal system capacity with depth, derived from the feature matrix.
Referring to insights gained from previous studies [], the spatial distribution of sampled points was analyzed and is presented in Figure 4. The results are based on the consideration of the matrix of features and the calculated capacity using Equation (8).
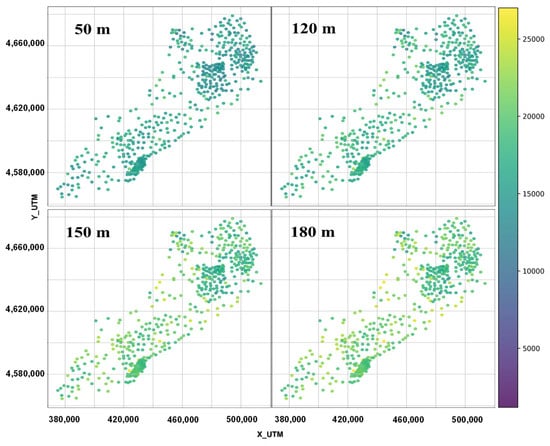
Figure 4.
Distribution of geothermal potential (MWh/y) of sampled points at depths 50, 120, 150, and 180 m.
Figure 4 assists in understanding the further enhancement of geothermal applications in the study area. Small commercial systems fall within the range of 50–200 kW, whereas values less than 50 kW are usually appropriate for single-household applications. Industrial-scale applications require capacities above 500 kW, while larger commercial or district heating projects can be established within the range of 200–500 kW. Based on the system capacity calculated in this study (an example for depth 120 m is presented in Figure 5) and local energy demands, the given spatial distribution provides a useful perspective for the optimal selection of geothermal implementation. Therefore, the priority of investment should be given to areas with higher ratings, since they provide the highest return on development and infrastructure expenditure, ensuring effective resource allocation. The important lesson is that, even though deeper systems often have more thermal potential, site-specific geological conditions still play a crucial role in their viability.
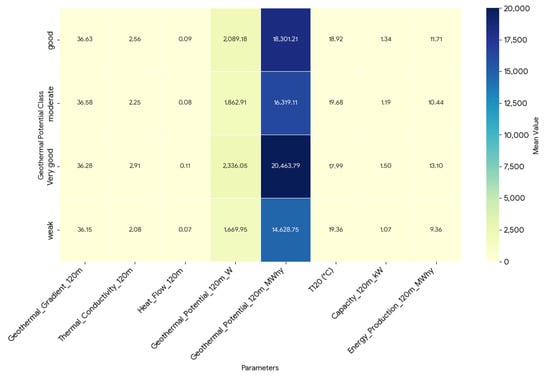
Figure 5.
Visualized matrix of the captured components of the identified site classes for depth 120 m.
4.3. Analysis of Correlated Geothermal Parameters
The correlation between geothermal parameters, i.e., thermal conductivity and the geothermal gradient, provides important information about the main subsurface heat transmission processes [] and thus affects predictive accuracy. Accordingly, the weak correlation indicates different interactions that reduce the reliability of single-parameter models, underscoring the need for integrated multi-parameter approaches for accurate geothermal potential prediction. This subject is also investigated and presented in Table 2. A positive correlation (r > 0.3) indicates that the main mechanism is conductive heat transfer, which means that heat passes through the rock matrix effectively. This is common in crystalline bedrock settings, where solid rock forms like quartzite or granite allow for consistent heat conduction without being greatly impacted by fluid movement []. On the other hand, a negative correlation (r < −0.3) can suggest convective heat transfer, in which heat is actively transported by subterranean fluids like groundwater or geothermal fluids, influencing the geothermal gradient. This situation frequently occurs in areas close to fault zones or in fractured aquifers, where fluid movement can either improve or interfere with patterns of heat transmission [].

Table 2.
Parameter correlation matrix.
Conversely, a weak connection (−0.3 < r < 0.3) suggests the existence of intricate and conflicting heat transmission pathways. In these situations, it is challenging to assign heat flow behavior to a single process due to the interaction of several geological and thermal components. The weak correlation between thermal conductivity and geothermal gradient restricts the reliability of single-parameter classification. This interpretation highlights the importance of integrated multi-parameter analyses for more accurate assessment of potential high- and low-geothermal zones. To fully comprehend the heat transfer dynamics at work, this intricacy frequently calls for site-specific research that incorporates other data, such as rock permeability, fluid flow paths, and localized temperature fluctuations. Consequently, a weak correlation coefficient of 0.14 was obtained from a correlation study between thermal conductivity and the geothermal gradient. This implies that heat transport is influenced by a number of conflicting factors and that regions with high geothermal gradients may not always have the highest conductivity levels.
4.4. Geothermal Potential Classes
Geothermal energy assessment involves multiple approaches utilizing different types of data to evaluate class-based temperature resources. The underlying assessment in this study follows a combination of rapid appraisals [] for preliminary insights, incorporated with analog and prognostic methods [] that estimate resources based on geological similarity and thermal reserves, supplemented by numerical results calculating sampled point temperatures and estimated output [,]. The subsequent spatial distribution of geothermal potential classes and corresponding percentages in the study area, obtained by integrating the results captured from the matrix of features and analyzed interpretations, is presented in Figure 6 and Figure 7. The presented classification is based on key thermal and geological parameters (e.g., thermal conductivity, geothermal gradient, heat flow), which together give an indication of the site’s overall geothermal capacity []. As a result, Figure 6 provides a structured way to assess and compare the suitability of different sites for geothermal energy extraction. Consequently, the assessed classes provide transmission sustainability pathways, helping to estimate the long-term viability of geothermal reservoirs. The numerical analyses (e.g., Figure 2 and Figure 3), supplemented by classification results, show that the average potential increases from 15,408.5 MWh/year at 50 m to 19,260.6 MWh/year at 150 m, indicating an increase in geothermal potential with depth in the studied area. This pattern is consistent with previous predictions by [,], suggesting that more advantageous geothermal resources are found in deeper subsurface regions. To clarify the potential of the study area and gain better insights, the characterized weak classes (Figure 6) were excluded, and a new map corresponding to sampled points with moderate to top potential classes was generated and is presented in Figure 8.
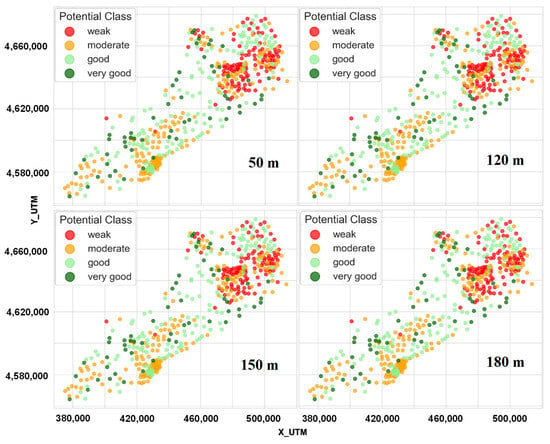
Figure 6.
Spatial distribution of potential class at 50, 120, 150, 180 m.
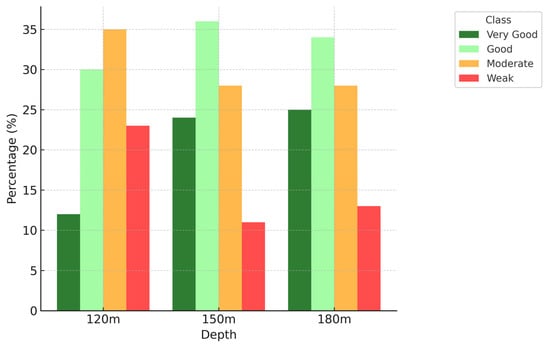
Figure 7.
The percentage of distributed geothermal potential class at depths 120, 150, and 180 m.
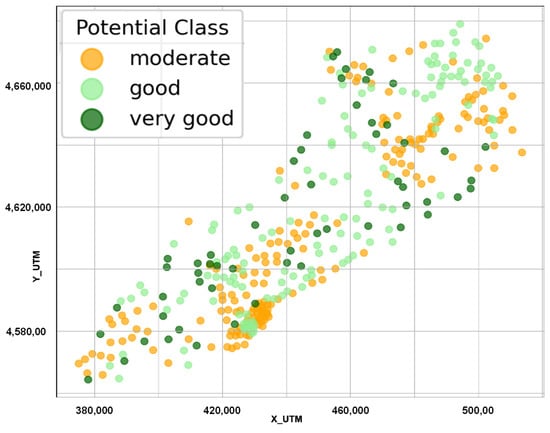
Figure 8.
The characterized top geothermal classes at a depth of 120 m in the study area.
The top five promising potential spots in the study area demonstrated their significant geothermal properties and potential for energy extraction. This physically implies the critical role of a variety of factors in determining whether geothermal energy extraction is feasible. The analysis of geothermal potential across depths of 50, 120, 150, and 180 m highlighted resource availability with increasing depth. The role of the geothermal gradient, with a typical range of 25–30 °C/km, in the analyzed trend cannot be neglected because the increase in temperature with depth is influenced by subsurface heat flow and lithology [,]. These sites have an average thermal conductivity of 3.45 W/mK and a temperature gradient of 35.25 °C/km at a depth of 50 m. The results analyzed at a depth of 150 m indicated that 24.0%, 36.3%, 28.2%, and 11.5% of the surveyed spots are classified as ‘Very Good’, ‘Good’, ‘Moderate’, and ‘Weak’, respectively. The subsequent calculation revealed an average thermal conductivity of 2.03 W/mK and a gradient of 37.12 °C/km for the categorized ‘Very Good’ sites, which represent optimal candidates for high-efficiency geothermal systems. In practice, the categorized areas classified as ‘Good’ or ‘Moderate’ can, through the use of enhancement systems (e.g., heat exchange designs, additional thermal storage options), become feasible for future utilization.
As presented in Figure 9, the geothermal sites categorized as ‘Very Good’ often have high thermal conductivity ranging from 2.5 to 4.0 W/mK, suggesting that heat is efficiently transferred through the rock formations. These locations also have a geothermal gradient of more than 35 °C/km, indicating that the temperature rises quickly with depth, which is advantageous for energy extraction. Furthermore, the heat flow in certain areas exceeds 80 mW/m2, indicating a significant quantity of thermal energy accessible from the subsurface. Such locations are frequently characterized by homogeneous subsurface conditions, with geological features that are reasonably stable, allowing for effective heat transport. The ‘Good’ sites are not as ideal as the ‘Very Good’ ones, but they provide significant geothermal energy. This class and its corresponding locations generally have a thermal conductivity of 2.0 to 2.5 W/mK, a geothermal gradient of 25 to 35 °C/km, and a heat flow of 60 to 80 mW/m2. Although these values are not as high as in the ‘Very Good’ class, they still indicate strong geothermal potential, which makes them viable for geothermal development in many circumstances. ‘Moderate’ geothermal sites have a thermal conductivity of 1.5–2.0 W/mK, geothermal gradients of 15–25 °C/km, and a heat flow of 40–60 mW/m2. These sites are often less advantageous for energy extraction since geothermal resources are limited, and the conditions may necessitate more advanced technology to improve heat transfer and maximize energy output. The ‘Weak’ locations have a thermal conductivity of less than 1.5 W/mK, geothermal gradients below 15 °C/km, and heat flows below 40 mW/m2. These locations have the lowest geothermal potential and are often less practical for geothermal energy extraction due to suboptimal heat transfer efficiency and overall lower accessible energy levels. The locations identified in this class require more research to evaluate alternate approaches; for example, considering enhanced geothermal systems (EGS) might make this class more viable for development. In summary, the presented classification system helps prioritize sites for geothermal exploration and development, guiding decision-making regarding the most cost-effective and technically feasible areas for energy extraction.
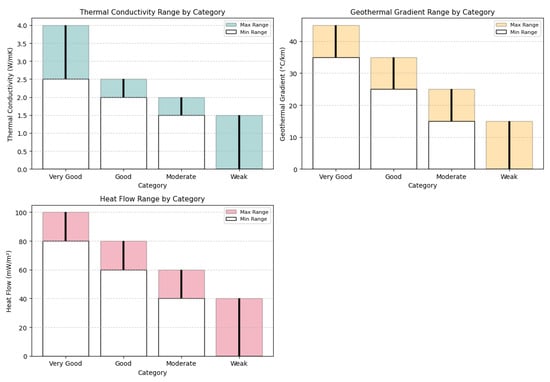
Figure 9.
The analysis of the classified geothermal potential using the parameters in the study area.
4.5. Technical Insights by Depth-Based Distribution Classes
The practical implications of geothermal potential classification and site assessment provide critical insights for both the design and management of geothermal systems. When designing a closed-loop geothermal system, the classification of site potential plays a pivotal role in determining the system’s scale and efficiency [,]. Referring to Figure 10, the ‘weak’ points, due to low conductivity and gradients, were excluded to maintain system performance, as the sampled sites may struggle to meet energy demands and requirements for supplemental heating systems or enhanced geothermal techniques. For ‘Very Good’ sites (high conductivity and geothermal gradients), smaller borehole fields are sufficient to extract the required heat, leading to reduced drilling costs and a more efficient system. In the case of ‘Good’ sites (moderate conductivity and gradient values), the standard geothermal system design is typically appropriate, as the energy extraction rate is generally adequate for conventional system sizing. However, ‘Moderate’ sites may require larger systems due to lower heat transfer rates, necessitating more extensive borehole arrays to achieve the desired energy production.
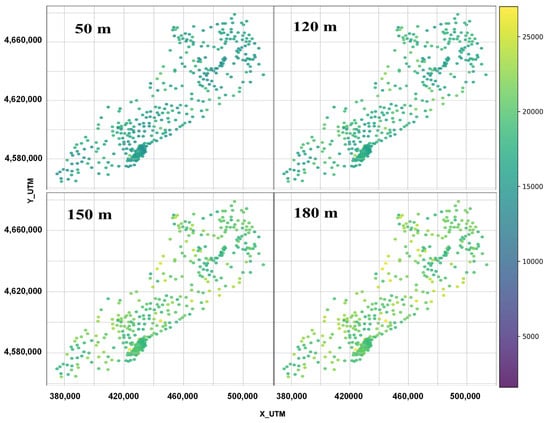
Figure 10.
Depth-based spatial distribution of the prioritized geothermal potentials (MWh/y) in the study area after excluding the weak points.
In planning geothermal exploration and development, it is essential to prioritize areas with the highest resource potential to maximize energy production and system efficiency. Therefore, zones classified as having ‘very good’ potential across all depths should be the primary focus, as they offer the most favorable combination of high thermal conductivity, strong geothermal gradients, and significant heat flow. These characteristics make them the most promising targets for efficient energy extraction and warrant detailed exploration. Additionally, concentrating efforts at depths between 120 and 180 m provides access to higher-temperature resources, typically found beyond the influence of surface temperature fluctuations. At these depths, the geothermal gradient tends to be more stable and elevated, offering a consistent heat source well-suited for long-term energy generation.
Validating temperature estimates with test wells in high-potential zones is a viable approach to ensure their accuracy and refine exploration strategies. Such wells provide actual subsurface temperature data, allowing for the evaluation of projected sample point accuracy and the assessment of each location’s feasibility for future development. In addition, when developing geothermal systems, it is important to examine the relationship between geothermal gradient and thermal conductivity. This ensures that systems are optimized for heat extraction and energy efficiency while accounting for local variations in subsurface conditions. Finally, geographical class distribution maps should be used to identify and prioritize high-potential development zones. These maps display geothermal potential across broad areas, highlighting resource-rich locations and guiding drilling and infrastructure development decisions [,]. This comprehensive approach ensures a targeted and efficient geothermal energy production strategy.
4.6. Limitations and Future Works
Advances in reservoir simulation have expanded geothermal potential beyond ideal geological settings, but subsurface variability still presents challenges. Variations in thermal conductivity can indicate issues such as temperature shifts, fractures, or hard rock formations that impact drilling and costs []. Detailed geological data and site investigations are essential for accurate risk assessment, improved system efficiency, and effective project planning.
As a summary of findings, the limitations of this study and technical recommendations for future studies are listed as follows:
- The matrix of features for clustering, similar to all data-based systems, is constrained by data quality. Therefore, inter-parameter correlations may obscure cluster boundaries. On the other hand, measurement errors and spatial heterogeneity introduce uncertainties affecting cluster resolution and the reliability of geothermal potential classification.
- Economic assessment is essential for the sustainability of geothermal projects, because high-, moderate-, and low-temperature points in this study have similar costs but different levels of exploitable energy. Temperature classification influences both energy potential and the choice of power generation technology. Efficient heat extraction requires careful management to maintain reservoir pressure and may require specific treatment to protect infrastructure and sustain energy output [,].
- Thermal conductivity is a key factor influencing heat transfer efficiency. Accurate conductivity data is essential for evaluating reservoir potential, especially for lower-temperature systems requiring detailed site assessments. Since its measurement from drill-core samples is well recognized, the data gathered reflects the complexities encountered in real-world scenarios [,].
- Technological innovations drive geothermal energy forward. These technological advances are supported by evolving policy frameworks designed to ensure sustainable and efficient resource use. Integration of advanced AI modeling and infrastructure is essential for maximizing output while minimizing environmental impact [].
5. Conclusions
Geothermal exploration, extraction, and development rely on a thorough understanding of subsurface temperature regimes, fluid characteristics, and geological conditions. To address the lack of universally accepted assessment schemes, this study developed a more capable geothermal potential classification procedure for effective decision-making and resource management. The objective of generating a spatial geothermal potential model over the studied area using key physical parameters (e.g., thermal conductivity, subsurface temperature, etc.) was captured via a created matrix of features. By integrating these factors, a deeper understanding of the potential and feasibility of the area studied for geothermal exploitation was obtained. The predictability performance of the AI-enhanced modeling technique was also examined by a fair comparison with other methods for geothermal potential analysis and mapping. These methods outperform traditional approaches by offering better optimization and accuracy, especially when hybridized for complex geoscientific problems. Interpreting the physical and practical implications of the classifications was also achieved by linking the identified geothermal zones to their potential for sustainable energy extraction. The findings of this study provide a structured, practical approach for assessing the classification of geothermal productivity in other favorable zones with site-specific properties. This demonstrates the applicability and transferability of the developed classification framework, thereby reinforcing the study’s contribution to geothermal resource management. Depth-dependent analysis of geothermal potential showed a distinct trend of increasing from shallow to deeper strata. The analysis revealed a significant increase in geothermal potential, specifically between 50 and 150 m. Interpretation suggested that the geothermal gradient, with a typical variation between 25 and 30 °C/km, is the main physical parameter. It indicates higher and more stable temperatures at deeper levels and shows that such zones are more suitable for long-term energy extraction. While temperature is a primary determinant of geothermal capacity, consistent thermal conductivity and minimal surface influence at greater depths further enhance resource reliability.
Approximately 11.5% of the sites surveyed showed ‘Very Good’ potential, with another 28.2% classified as ‘Good’. These insights help prioritize areas for development, supporting efficient resource allocation. The temperature often rises by 20–30% with increasing depth, corresponding to a 30–50% increase in geothermal potential. Higher temperatures and the enhanced ability for heat transfer at deeper depths both contribute to this increase in potential. Because deeper layers are less susceptible to surface-level short-term environmental variations, the stability of thermal conditions likewise increases with depth, resulting in a more reliable and consistent energy supply. Deeper locations are especially appealing for long-term geothermal energy generation because of this steady and predictable growth in geothermal potential.
Although geothermal systems provide stable and renewable energy, successful deployment depends on careful classification, depth analysis, accurate modeling, and a solid understanding of local geological variability. By achieving the stated objectives, this study justified the need for geothermal systems and demonstrated a comprehensive approach for ensuring the feasibility, sustainability, and efficiency of geothermal energy development.
Author Contributions
Conceptualization, S.P.M.L., D.P. and M.H.; methodology, S.P.M.L. and A.A.S.; code development and visualization, S.P.M.L., M.H. and A.A.S.; validation, S.P.M.L. and A.A.S.; formal analysis, S.P.M.L., D.P., M.H. and A.A.S.; data curation, S.P.M.L.; supervision, D.P., M.H. and A.A.S.; writing—original draft preparation, S.P.M.L.; writing—review, A.A.S., D.P. and M.H. All authors have read and agreed to the published version of the manuscript.
Funding
This research received no external funding.
Data Availability Statement
The original contributions presented in this study are included in the article. Further inquiries can be directed to the corresponding author.
Conflicts of Interest
The authors declare no conflicts of interest. There is no role of the funder in the design of the study; in the collection, analyses, or interpretation of data; in the writing of the manuscript; or in the decision to publish the results.
References
- Lund, J.W.; Bjelm, L.; Bloomquist, G.; Mortensen, A.K. Characteristics, development and utilization of geothermal resources—A Nordic perspective. Episodes 2008, 31, 140–147. [Google Scholar] [CrossRef]
- Rohit, R.V.; Vipin Raj, R.; Dennis, C.; Kiplangat Veena, R.; Rajan Jose, A.P.; Pradeepkumar, K.; Satheesh, K. Tracing the evolution and charting the future of geothermal energy research and development. Renew. Sustain. Energy Rev. 2023, 184, 113531. [Google Scholar] [CrossRef]
- Tester, J.W.; Anderson, B.J.; Batchelor, B.J.; Blackwell, D.D.; DiPippo, R.; Drake, E.M.; Garnish, J.; Livesay, B.; Moore, M.C.; Nichols, K.; et al. The Future of Geothermal Energy. In Impact of Enhanced Geothermal Systems (EGS) on the United States in the 21st Century; Renewable Energy and Power Department, Idaho National Laboratory: Idaho Falls, ID, USA, 2006. [Google Scholar]
- Osman, A.I.; Chen, L.; Yang, M. Cost, environmental impact, and resilience of renewable energy under a changing climate: A review. Environ. Chem. Lett. 2023, 21, 741–764. [Google Scholar] [CrossRef]
- Taylor, N.; Georgakaki, A.; Ince, E.; Letout, S.M.; Gea Bermudez, J.; Schmitz, A. Clean Energy Technology Observatory: Geothermal Energy in the European Union; European Commission, Joint Research Centre, 2024 Status Report on Technology Development, Trends, Value Chains and Markets; JRC139312; Publications Office of the European Union: Luxembourg, 2024; Available online: https://data.europa.eu/doi/10.2760/8898786 (accessed on 27 October 2025).
- Chamorro, C.R.; Garcia-Cuesta, J.L.; Modejar, M.E.; Linares, M.M. An estimation of the enhanced geothermal system potential for the Iberian Peninsula. Renew. Energy 2014, 66, 1–14. [Google Scholar] [CrossRef]
- Arrizabalaga, I.; De Gregorio, M.; De Santiago, C.; García de la Noceda, C.; Pérez, P.; Urchueguía, J.F. Geothermal energy use, country update for Spain. In Proceedings of the European Geothermal Congress, Den Haag, The Netherlands, 11–14 June 2019. [Google Scholar]
- Hernando, G.P.; Pfeifer, A.; Frechoso, F.; González, L.J.M.; Duić, N. A novel approach to represent the energy system in integrated assessment models. Energy 2022, 258, 124743. [Google Scholar] [CrossRef]
- Dincer, I.; Ezzat, M.F. Geothermal energy production. Compr. Energy Syst. 2018, 3, 252–303. [Google Scholar] [CrossRef]
- Sanyal, S.K. Classification of geothermal systems; A possible scheme. In Proceedings of the Thirtieth Workshop on Geothermal Reservoir Engineering, Stanford University, Stanford, CA, USA, 31 January–2 February 2005; SGP-TR-176. pp. 85–88. [Google Scholar]
- Cano, N.A.; Céspedes, S.; Redondo, J.; Foo, G.; Jaramillo, D.; Martinez, D.; Gutiérrez, M.; Pataquiba, J.; Rojas, J.; Cortés, F.B.; et al. Power from geothermal resources as a co-product of the oil and gas industry: A review. ACS Omega 2022, 7, 40603–40624. [Google Scholar] [CrossRef]
- Williams, C.F.; Reed, M.J.; Anderson, A.F. Updating the classification of geothermal resources. In Proceedings of the Thirty-Sixth Workshop on Geothermal Reservoir Engineering, Stanford, CA, USA, 31 January–2 February 2011; Volume 1, pp. 50–57, Stanford Geothermal Program Workshop Report SGP-TR-191. [Google Scholar]
- Hochstein, M.P.; Brown, P.R.L. Surface manifestations of geothermal systems with volcanic heat sources. In Encyclopedia of Volcanoes; Sigurdsson, H., Ed.; Academic Press: San Diego, CA, USA, 2000; pp. 835–855. [Google Scholar]
- Montanari, D.; Lupi, M.; Calcagno, P. Geothermal systems: Interdisciplinary approach for an effective exploration. Geofluids 2019, 2019, 9895659. [Google Scholar] [CrossRef]
- Omodeo-Salé, S.; Eruteya, O.E.; Cassola, T.; Baniasad, A.; Moscariello, A. A basin thermal modelling approach to mitigate geothermal energy exploration risks: The St. Gallen case study (eastern Switzerland). Geothermics 2020, 87, 101876. [Google Scholar] [CrossRef]
- Matsumoto, M. An approach for estimating geothermal reservoir productivity under access limitations associated with snowy and mountainous prospects. In Geothermal Energy; Ismail, B.I., Ed.; IntechOpen Press: London, UK, 2021. [Google Scholar] [CrossRef]
- Lesmana, A.; Pratama, H.B.; Ashat, A.; Saptadji, N.M. Sustainability of geothermal development strategy using a numerical reservoir modeling: A case study of Tompaso geothermal field. Geothermics 2021, 96, 102170. [Google Scholar] [CrossRef]
- Ciapala, B.; Georgiou, G.S.; Aresti, L.; Onoufriou, T.; Florides, G.A.; Christodoulides, P. Thermal performance evaluation of energy piles and energy foundations: A comprehensive review of thermal effectiveness testing methods. Energy Build. 2025, 346, 116181. [Google Scholar] [CrossRef]
- Janssen, H.; Van De Walle, W. The impact of pore structure parameters on the thermal conductivity of porous building blocks. Constr. Build. Mater. 2022, 324, 126681. [Google Scholar] [CrossRef]
- Kana, J.D.; Djongyang, N.; Raïdandi, D.; Nouck, P.N.; Dadjé, A. A review of geophysical methods for geothermal exploration. Renew. Sustain. Energy Rev. 2015, 44, 87–95. [Google Scholar] [CrossRef]
- Tende, A.W.; Iiiya, M.M.; Habu, S.; Gajere, J.N.; Iyakwari, S.; Aminu, M.D. GIS-Based Multi-Criteria Predictive Modelling for Geothermal Energy Exploration. Energy Geosci. 2025, 6, 100409. [Google Scholar] [CrossRef]
- Franco, A.; Vaccaro, M. Numerical Simulation of Geothermal Reservoirs for the Sustainable Design of Energy Plants: A Review. Renew. Sustain. Energy Rev. 2014, 30, 987–1002. [Google Scholar] [CrossRef]
- Xu, L.; Zhang, D.; Li, Q.; Yu, B.; Zhang, Y.; Tan, H.; Cheng, Y. An Integrated Approach to Analyze the Formation Models of Geothermal Resources in Complicated Areas with Low Exploration: A Case Study of the Midu County in Yunnan Province, China. Nat. Gas Ind. B 2024, 11, 42–49. [Google Scholar] [CrossRef]
- Zhu, J.; Wright, G.; Wang, J.; Wang, X. A Critical Review of the Integration of Geographic Information System and Building Information Modelling at the Data Level. ISPRS Int. J. Geo-Inf. 2018, 7, 66. [Google Scholar] [CrossRef]
- Choi, Y.; Baek, J.; Park, S. Review of GIS-Based Applications for Mining: Planning, Operation, and Environmental Management. Appl. Sci. 2020, 10, 2266. [Google Scholar] [CrossRef]
- Chen, X.W.; Lin, X. Big Data Deep Learning: Challenges and Perspectives. IEEE Access 2014, 2, 514–525. [Google Scholar] [CrossRef]
- Karpatne, A.; Ebert-Uphoff, I.; Ravela, S.; Babaie, H.A.; Kumar, V. Machine Learning for the Geosciences: Challenges and Opportunities. IEEE Trans. Knowl. Data Eng. 2018, 31, 1544–1554. [Google Scholar] [CrossRef]
- Abbaszadeh Shahri, A.; Shan, C.; Zall, E.; Larsson, S. Spatial Distribution Modeling of Subsurface Bedrock Using a Developed Automated Intelligence Deep Learning Procedure: A Case Study in Sweden. J. Rock Mech. Geotech. Eng. 2021, 13, 1300–1310. [Google Scholar] [CrossRef]
- Mirfallah, S.P.L.; Parcerisa, D.; Himi, M.; Abbaszadeh Shahri, A. Generating 3D Geothermal Maps in Catalonia, Spain Using a Hybrid Adaptive Multitask Deep Learning Procedure. Energies 2022, 15, 4602. [Google Scholar] [CrossRef]
- Luo, J.; Qu, Z.; Guan, J.; Chen, Y.; Wang, Y.; Zhou, W.; Hu, Y.; Zhang, H.; Liang, T.; Fu, G.; et al. Evaluating the Potential Distribution of Deep Geothermal Resources in the North Jiangsu Basin, East China, Using Machine Learning. Geoenergy Sci. Eng. 2025, 252, 213957. [Google Scholar] [CrossRef]
- Qin, Z.; Jiang, A.; Faulder, D.; Cladouhos, T.T.; Jafarpour, B. Physics-Guided Deep Learning for Prediction of Energy Production from Geothermal Reservoirs. Geothermics 2024, 116, 102824. [Google Scholar] [CrossRef]
- Suzuki, A.; Shi, S.; Sakai, T.; Fukui, K.; Onodera, S.; Ishizaki, J.; Hashida, T. Automated Parameter Estimation for Geothermal Reservoir Modeling Using Machine Learning. Renew. Energy 2024, 224, 120243. [Google Scholar] [CrossRef]
- Abbaszadeh Shahri, A.; Khorsand Zak, M.; Abbaszadeh Shahri, H. A Modified Firefly Algorithm Applying on Multi-Objective Radial-Based Function for Blasting. Neural Comput. Appl. 2022, 34, 2455–2471. [Google Scholar] [CrossRef]
- Ma, Z.; Wu, G.; Suganthan, P.N.; Song, A.; Luo, Q. Performance Assessment and Exhaustive Listing of 500+ Nature-Inspired Metaheuristic Algorithms. Swarm Evol. Comput. 2023, 77, 101248. [Google Scholar] [CrossRef]
- Alorf, A. A Survey of Recently Developed Metaheuristics and Their Comparative Analysis. Eng. Appl. Artif. Intell. 2023, 117 Pt A, 105622. [Google Scholar] [CrossRef]
- Mirfallah, S.P.L.; Parcerisa, D.; Himi, M.; Abbaszadeh Shahri, A. A Novel Modified Bat Algorithm to Improve the Spatial Geothermal Mapping Using Discrete Geodata in Catalonia-Spain. Model. Earth Syst. Environ. 2024, 10, 4415–4428. [Google Scholar] [CrossRef]
- Puigdefàbregas, C.; Muñoz, J.A.; Vergés, J. Thrusting and Foreland Basin Evolution in the Southern Pyrenees. In Thrust Tectonics; Chapman and Hall: London, UK, 1992. [Google Scholar] [CrossRef]
- Lladó, X.M.; Vilà, M.; Martí, V.; Rovira, M.; Domènech, J.A.; Pablo, J.D. Trace Element Distribution in Topsoils in Catalonia: Background and Reference Values and Relationship with Regional Geology. Environ. Eng. Sci. 2008, 25, 863–878. [Google Scholar] [CrossRef]
- Martí, J.; Ricci, J.; Planagumà, L.; Aguirre-Díaz, G.J. The Quaternary La Garrotxa Volcanic Field (NE of Iberia): A Geochronological Approach. Quat. Sci. Adv. 2025, 17, 100267. [Google Scholar] [CrossRef]
- Bartolini, S.; Bolós, X.; Martí, J.; Pedra, E.R.; Planagumà, L. Hazard Assessment at the Quaternary La Garrotxa Volcanic Field (NE Iberia). Nat. Hazards 2015, 78, 1349–1367. [Google Scholar] [CrossRef]
- Bartrina, M.T.; Cabrera, L.; Jurado, M.J.; Guimerà, J.; Roca, E. Evolution of the Central Catalan Margin of the Valencia Trough (Western Mediterranean). Tectonophysics 1992, 203, 219–247. [Google Scholar] [CrossRef]
- Peris, S.; Griera, A.; Gómez-Gras, D.; Teixell, A. The Transition from Convergence to Extension in the NW Mediterranean: Insights from the Thermochronologic and Tectono-Sedimentary Record in the Eastern Pyrenees and Empordà Basin (NE Spain). In Proceedings of the EGU General Assembly 2023, Vienna, Austria, 24–28 April 2023. pp. EGU23-7642. [Google Scholar] [CrossRef]
- Lewis, C.J.; Vergés, J.; Marzo, M. High Mountains in a Zone of Extended Crust: Insights into the Neogene–Quaternary Topographic Development of Northeastern Iberia. Tectonics 2000, 19, 86–102. [Google Scholar] [CrossRef]
- ICGC. ICGC Shallow Geothermal Energy. Geoindex (Viewer & Geoservices WMS), Barcelona: Institut Cartogràfic i Geològic de Catalunya. February 2021. Available online: https://www.icgc.cat/en/Tools-and-viewers/Viewers/Geoindex-viewers/Geoindex-Shallow-geothermal-energy (accessed on 1 June 2021).
- ICGC. ICGC Deep Geothermal Energy. Geoindex (Viewer & Geoservices WMS), Barcelona: Institut Cartogràfic i Geològic de Catalunya. October 2020. Available online: https://www.icgc.cat/ (accessed on 1 June 2021).
- Williams, C. Updated Methods for Estimating Recovery Factors for Geothermal Resources. In Proceedings of the Thirty-Second Workshop on Geothermal Reservoir Engineering, Stanford, CA, USA, 22–24 January 2007. [Google Scholar]
- Limberger, J.; Calcagno, P.; Manzella, A.; Trumpy, E.; Boxem, T.; Pluymaekers, M.; Van Wees, J.D. Assessing the Prospective Resource Base for Enhanced Geothermal Systems in Europe. Geotherm. Energy Sci. 2014, 2, 55–71. [Google Scholar] [CrossRef]
- Grant, M. Stored-Heat Assessments: A Review in the Light of Field Experience. Geotherm. Energy Sci. 2014, 2, 49–54. [Google Scholar] [CrossRef]
- Norden, B.; Förster, A.; Förster, H.J.; Fuchs, S. Temperature and Pressure Corrections Applied to Rock Thermal Conductivity: Impact on Subsurface Temperature Prognosis and Heat-Flow Determination in Geothermal Exploration. Geotherm. Energy 2020, 8, 1. [Google Scholar] [CrossRef]
- Baralis, M.; Barla, M. rOGER: A Method for Determining the Geothermal Potential in Urban Areas. Geothermics 2024, 124, 103148. [Google Scholar] [CrossRef]
- García-Noval, C.; Álvarez, R.; García-Cortés, S.; García, C.; Alberquilla, F.; Ordóñez, A. Definition of a Thermal Conductivity Map for Geothermal Purposes. Geotherm. Energy 2024, 12, 17. [Google Scholar] [CrossRef]
- Luo, J.; Qiao, Y.; Xiang, W.; Rohn, J. Measurements and Analysis of the Thermal Properties of a Sedimentary Succession in Yangtze Plate in China. Renew. Energy 2020, 147 Pt 2, 2708–2723. [Google Scholar] [CrossRef]
- Suft, O.; Hagenauer, H.; Bertermann, D. Relationship between Thermal Conductivity, Mineral Composition and Major Element Composition in Rocks from Central and South Germany. Geosciences 2025, 15, 19. [Google Scholar] [CrossRef]
- Schuster, V.; Rybacki, E.; Schleicher, A.M.; Koirala, R.; Göbel, T.H.W. The Effect of Hydrothermal Alteration and Microcracks on Hydraulic Properties and Poroelastic Deformation: A Case Study of the Blue Mountain Geothermal Field. J. Geophys. Res. Solid Earth 2025, 130, e2024JB030541. [Google Scholar] [CrossRef]
- Mjami, N.B.; Kimambo, C.; Ayeng'o, S.; Orozova-Bekkevold, I. Prospects and Challenges for Utilisation of Low- to Medium-Temperature Geothermal Resources in Tanzania. Geothermics 2025, 129, 103288. [Google Scholar] [CrossRef]
- Heim, E.; Laska, M.; Becker, R.; Klitzsch, N. Estimating the Subsurface Thermal Conductivity and Its Uncertainty for Shallow Geothermal Energy Use—A Workflow and Geoportal Based on Publicly Available Data. Energies 2022, 15, 3687. [Google Scholar] [CrossRef]
- Kolawole, O.; Ispas, I.; Kolawole, F.; Germay, C.; McLennan, J.D. Mechanical Zonation of Rock Properties and the Development of Fluid Migration Pathways: Implications for Enhanced Geothermal Systems in Sedimentary-Hosted Geothermal Reservoirs. Geotherm. Energy 2021, 9, 14. [Google Scholar] [CrossRef]
- Romanov, D.; Leiss, B. Geothermal Energy at Different Depths for District Heating and Cooling of Existing and Future Building Stock. Renew. Sustain. Energy Rev. 2022, 167, 112727. [Google Scholar] [CrossRef]
- Nath, F.; Mahmood, M.D.N.; Ofosu, E.; Khanal, A. Enhanced Geothermal Systems: A Critical Review of Recent Advancements and Future Potential for Clean Energy Production. Geoenergy Sci. Eng. 2024, 243, 213370. [Google Scholar] [CrossRef]
- Björbsson, G.; Bodvarsson, G. A Survey of Geothermal Reservoir Properties. Geothermics 1990, 19, 17–27. [Google Scholar] [CrossRef]
- Guo, L.L.; Zhang, Y.B.; Wang, Z.C.; Zeng, J.; Zhang, Y.J.; Zhang, Z.X. Parameter Sensitivity Analysis and Optimization Strategy Research of Enhanced Geothermal System: A Case Study in Guide Basin, Northwestern China. Renew. Energy 2020, 153, 813–831. [Google Scholar] [CrossRef]
- Shu, B.; Bao, Y.; Markides, C.N.; Besagni, G.; Moore, J. Overview and Outlook of Thermal Processes in Geothermal Energy Extraction. Appl. Therm. Eng. 2025, 272, 126329. [Google Scholar] [CrossRef]
- Carruthers, I.; Chambers, R. Rapid Appraisal for Rural Development. Agric. Adm. 1981, 8, 407–422. [Google Scholar] [CrossRef]
- Peacock, D.C.P.; Sanderson, D.J.; Leiss, B. Use of Analogue Exposures of Fractured Rock for Enhanced Geothermal Systems. Geosciences 2022, 12, 318. [Google Scholar] [CrossRef]
- Naseer, M.T. Spectral Decomposition-Based Temperature and Water Saturation-Constrained Dynamical Simulations Detect High-Temperature Geothermal Energy Resource. Renew. Energy 2026, 256 Pt A, 123356. [Google Scholar] [CrossRef]
- Gürtürk, M. Predicting the Optimal Timing for System Upgrades in Binary Geothermal Power Plants: A Thermodynamic and Exergetic Approach. Energy Convers. Manag. 2025, 343, 120225. [Google Scholar] [CrossRef]
- Farghali, M.; Osman, A.I.; Chen, Z.; Abdelhaleem, A.; Ihara, A.; Mohamed, I.M.A.; Yap, P.S.; Rooney, D.W. Social, Environmental, and Economic Consequences of Integrating Renewable Energies in the Electricity Sector: A Review. Environ. Chem. Lett. 2023, 21, 1381–1418. [Google Scholar] [CrossRef]
- Al Mubarak, F.; Rezaee, R.; Wood, D.A. Economic, Societal, and Environmental Impacts of Available Energy Sources: A Review. Eng 2024, 5, 1232–1265. [Google Scholar] [CrossRef]
- Koray, A.M.; Gyimah, E.; Metwally, M.; Rahnema, H.; Tomomewo, O. Leveraging Machine Learning for Enhanced Reservoir Permeability Estimation in Geothermal Hotspots: A Case Study of the Williston Basin. Geotherm. Energy 2025, 13, 8. [Google Scholar] [CrossRef]
- Vaccaro, M. Multidisciplinary Approach for the Sustainable Utilization of Medium–Low Temperature Geothermal Resources. 2013, Università degli Studi di Pisa. Available online: https://hdl.handle.net/20.500.14242/131298 (accessed on 27 October 2025).
Disclaimer/Publisher’s Note: The statements, opinions and data contained in all publications are solely those of the individual author(s) and contributor(s) and not of MDPI and/or the editor(s). MDPI and/or the editor(s) disclaim responsibility for any injury to people or property resulting from any ideas, methods, instructions or products referred to in the content. |
© 2025 by the authors. Licensee MDPI, Basel, Switzerland. This article is an open access article distributed under the terms and conditions of the Creative Commons Attribution (CC BY) license (https://creativecommons.org/licenses/by/4.0/).