Abstract
The use of Renewable Energy Sources necessitates efficient site selection methods, also for wind farm deployment. This study applies a machine learning (ML) approach to optimize wind turbine siting in Poland, addressing limitations of traditional multi-criteria decision-making (MCDM) methods. A multilayer perceptron model was trained on a dataset of 28 spatio-environmental features, including wind speed, power density, land use, and protected areas. The model was validated using 100,000 randomly selected points and applied to identify suitable locations under real-world constraints. Results indicate that, in Poland, the total number of wind turbines, either as part of wind parks or as single turbines, was 4260 in 2023, and as of the beginning of 2025, stood at 5160, representing a 21% increase. The MLP model demonstrates high performance on both validation and testing subsets, with an accuracy of 91% on the test subset. In this research, after applying the multilayer perceptron (MLP) model and filtering points that obtain a prediction score higher than 0.9, a total of 16,807 valid points were obtained. After applying buffer zones, 3040 validation points are obtained, which are suitable for further location of wind turbines. The majority of validation points for potential new wind turbine construction are located on the Baltic coast, totaling 2355 points. Compared to conventional MCDM methods, MLP reveals hidden spatial patterns and enhances predictive accuracy, and is a valuable tool to expand wind energy capacity in Poland and beyond.
1. Introduction
Global climate change and the reduction in dependence on fossil fuels have directed energy strategies towards renewable energy sources. Among these, wind energy is often recognized as a sustainable and economically viable solution. Eurostat estimates that by 2030, one-third of electricity generation in the EU will come from the wind energy sector []. Similarly, the IEA forecasts that wind and solar energy will account for 95% of global renewable electricity generation by 2030 []. The rapid expansion of wind energy is evident in the milestone achievement of 1 terawatt (TW) of installed global capacity in 2023 [], underscoring its vital role in the transition to a clean energy future []. China and Europe continue to lead global wind energy installations, with China reaching 440 Gigawatts (GW) [,] and Europe attaining 240 GW [] of wind power capacity in 2023. The annual installed capacity in these regions in 2023 was 63.7 GW and 18.3 GW, respectively, year on year.
The global push towards decarbonization has placed renewable energy at the forefront of strategies to combat climate change and reduce reliance on fossil fuels []. In response to global challenges such as the climate crisis [,,,] and rising fossil fuel prices [,,,], governments worldwide are intensifying efforts to transition towards sustainable energy [,,]. This shift is reflected in increasing investments in renewable energy projects [], with more than 400 billion US dollars invested in the wind energy sector by China and the EU alone in 2023 [].
Poland has demonstrated significant growth in renewable energy technology adoption in recent years, with its share rising to 24% in 2023 [] and further increasing to 30% of total electricity production in 2024 []. This expansion has been facilitated by the liberalization of local environmental regulations in 2023 [,,,,]. These developments are critical for meeting the EU’s ambitious renewable energy target of 42.5% by 2030 [].
The advancement of wind energy is improving production technologies at all levels of the supply chain, which aims to enhance efficiency while maintaining a relatively low environmental impact compared to traditional energy sources []. Nevertheless, the wind energy sector faces notable challenges. These include visual impacts on the landscape [,], potential risks to wildlife, particularly predatory birds [,] and bats [], as well as noise emission [,], and social acceptance issues among local communities [,,], which are all often difficult to quantify. Moreover, a comprehensive analysis of meteorological, technological, and ecological criteria is needed to ensure sustainable development.
Poland’s domestic energy production has historically been heavily dependent on coal, which continues to account for a considerable portion of the country’s energy mix, reaching 60% of the total primary energy supply (TPES) []. However, renewable energy sources, particularly wind and solar power, are gaining traction as key components in transforming Poland’s energy landscape. These technologies not only contribute to reducing CO2 emissions but also enhance energy security by decreasing the reliance on imported fossil fuels. Additionally, societal, economic, and political pressures from the EU government have further accelerated Poland’s transition toward renewable energy [].
Onshore wind farms represent the largest share of Poland’s renewable power capacity, with installed capacity increasing from 8.29 GW in January 2023 [] to 9.56 GW in March 2024 [,]. Recent legislative changes, particularly the abolition of the 10H rule (i.e., installing wind turbines from residential areas at a distance equal to ten times the hub height of the turbine to be installed), have determined to reduce the required distance to a 700 m buffer from residential areas without considering the hub height of the wind turbine [,,,,]. This regulatory shift has opened new opportunities for wind farm development. Our previous research has shown 7555.91 km2 of potentially suitable areas for wind farm construction, which influenced the development of wind energy in the region [].
Identifying optimal locations for wind farms is critical to balancing clean energy production with environmental protection, economic feasibility, and social acceptance. Several factors, including wind resource potential (e.g., wind speed and power density), land availability, environmental impact, public acceptance, and grid integration, play a vital role in the successful development of wind energy projects.
Traditional site selection methods often rely on multi-criteria decision-making (MCDM) techniques such as the analytic hierarchy process (AHP) [,,,], the technique for order of preference by similarity to ideal solution (TOPSIS) [,], multi-criteria optimization and compromise solution (VIKOR) [], and preference ranking for organization method for enrichment evaluation (PROMETHEE) [,].
These methods are often combined with GIS tools to balance these diverse decision factors []. Numerous studies have applied MCDM to assess environmental [,,], social [,], and economic criteria [,], or applied advanced geospatial methods to mitigate negative impacts on humans [,], wildlife [,], and habitats [,,,]. However, these techniques frequently rely on subjective expert or stakeholders’ input, which limits their scalability and adaptability to high-dimensional datasets.
In contrast, the machine learning (ML) approach presented in this study offers a scalable and adaptable solution for wind farm site selection by eliminating subjective weighting and uncovering complex spatial patterns in large datasets. ML has revolutionized the renewable energy sector, addressing challenges such as: short- and long-term wind speed forecasting [], electricity production predictions [,], wave height forecasting around offshore wind farms [], turbine maintenance optimization [], and ecological zone assessment for offshore wind projects []. Despite the growing application of ML in renewable energy forecasting and optimization, its direct use for wind turbine site suitability modeling still remains limited [,,,].
The research aims to employ ML techniques in combination with GIS mapping to optimize wind turbine siting in Poland. This study applies 28 spatio-environmental features, including wind velocity and power density of air at 100 m, slope, and digital elevation models, 10 types of nature protection areas, and 14 types of infrastructural objects from the Bdot10k database [,], which provides detailed land use and infrastructure data for Poland. A multilayer perceptron (MLP) model was trained and validated using a dataset of artificially created points with the same set of features across Poland to ensure robustness and accuracy.
The novelty of this study lies in its holistic integration of diverse datasets and advanced ML models to optimize wind farm site selection in Poland. Unlike traditional MCDM methods, which heavily depend on predefined weights and expert judgments, the ML approach relies on real-world data to identify optimal locations with precision and scalability. This study broadens the scope of wind energy planning by incorporating underutilized spatial features, such as detailed classifications of nature protection areas and infrastructure objects, guiding the sustainable expansion of wind energy in Poland and beyond.
The methodological contribution of this study lies in the integration of advanced ML algorithms with multi-source geospatial datasets to identify suitable wind farm locations. Unlike conventional MCDM approaches, this framework automatically derives spatial feature importance from data, minimizing subjectivity, and enhancing model scalability and transferability.
2. Materials and Methods
2.1. Materials
This study combines various spatial datasets for site selection for wind farms in Poland using machine learning-driven methods. Among these are the National Database of Topographic Features at a 1:10,000 scale (Bdot10k) [,] and data on Poland’s environmental protection zones, maintained by the Polish General Directorate for Environmental Protection (GDEP) []. Additionally, the analysis incorporates global wind speed and air power density maps at a height of 100 m, sourced from the Global Wind Atlas [], as well as existing wind farm locations obtained from OpenStreetMap []. A digital elevation model (DEM) [,] is also employed to create a terrain slope map and to calculate the elevation above sea level.
The Bdot10k database consists of 14 thematic layers, including: water networks: Rivers and springs (SWRS), canals (SWKN), drainage ditches (SWRM), wetlands (OIMK), and surface water bodies (PTWP), urbanized areas: Buildings (BUBD), power infrastructure: Electrical networks (SULN), transportation routes: Roads (SKDR), forested regions: Tree-covered areas (PTLZ), permanent crops: Agricultural plantations (PTUT), sacral sites: Religious structures (KUSC), historical sites: Cultural heritage areas (KUZA), administrative divisions: Boundaries of municipalities (ADMS), mining sites and heaps: Extraction and waste deposit areas (PTWZ).
Poland’s nature conservation areas include 10 distinct categories, such as national parks, nature reserves, Natura 2000 sites (SAC and SPA categories), landscape parks, protected landscape zones, natural landscape complexes, ecological sites, natural monuments, and documentation sites [].
Data from Bdot10k, GDEP, and OpenStreetMap are provided in geospatial vector file format (SHP shape files), whereas wind speed, air power density maps at 100 m, and DEM data are available in Tagged Image File Format (TIFF files).
2.2. Methods
The dataset utilized in this study comprises 28 features, encompassing critical environmental, topographical, and meteorological factors relevant to wind turbine siting in Poland. These features were carefully selected to ensure comprehensive coverage of variables that influence wind energy generation potential while accounting for environmental and regulatory constraints.
The dataset was categorized into two primary classes: existing wind turbine locations and randomly generated points with similar regional characteristics. This approach ensured a balanced representation of potential and non-potential sites while capturing the region’s spatio-environmental diversity. Missing values within the dataset were replaced with zeros (i.e., when random points are created at the boundary of the maps used, where data may not be available).
All features were standardized using the StandardScaler function []. Standardization was applied to normalize feature ranges, improving the convergence and performance of the ML model. The standardization formula applied was:
where z is the standardized feature value, x is the original feature value, μ is the mean of the feature, and σ is the standard deviation of the feature.
For the classification of potential wind turbine sites, an MLP was employed. The MLP, a type of feedforward artificial neural network, was selected for its ability to model complex, non-linear relationships among heterogeneous spatial features while maintaining computational efficiency [,]. Preliminary tests comparing MLP with logistic regression and decision tree classifiers indicated superior performance and generalization, making it a suitable choice for this study.
To optimize the model parameters, the GridSearchCV function was used []. The network architecture was designed as follows (Figure 1):
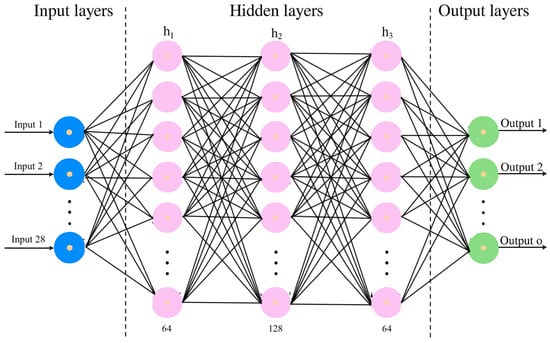
Figure 1.
The network architecture of the MLP model.
- Input layer: Corresponding to the 28 features representing environmental, topographical, and meteorological factors;
- Hidden layers: Three layers with 64, 128, and 64 neurons, respectively, to capture intricate feature interactions;
- Activation function: The hyperbolic tangent (tanh) activation function was applied in the hidden layers []:
Figure 1 also illustrates the three main stages of the analytical procedure. The first stage comprised data preprocessing and feature engineering, involving cleaning, normalization, and standardization to construct the final training dataset. The second stage focused on the MLP model training, while monitoring the training history and validation metrics. The third stage addressed evaluation and interpretation, including performance assessment with accuracy, precision, recall, and AUC metrics.
The output layer employed the sigmoid activation function, which transforms inputs into probabilities, making it suitable for binary classification tasks. The function is defined as:
where x is the original feature value.
The sigmoid activation function ensures that output values range between 0 and 1, facilitating probabilistic interpretation of the classification results. This is particularly beneficial in wind turbine site selection, where the model predicts the likelihood of a given location being suitable for wind farm deployment.
Early stopping was incorporated during training with a validation fraction of 10%, halting the training process when no improvement was observed in the validation loss for a set number of iterations. This technique minimized the risk of overfitting, ensuring robust model generalization.
The training dataset was divided into training (70%), validation (15%), and testing (15%) subsets using stratified sampling. This method preserved class balance across all subsets, allowing for fair evaluation of the model’s performance. Figure 2 illustrates a portion of the training dataset, providing insight into its structure.
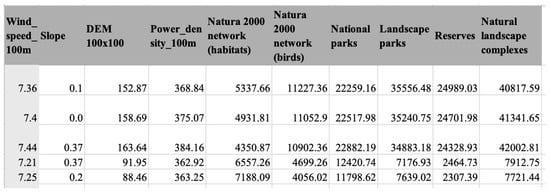
Figure 2.
The fragment of the training dataset used in the MLP model. The value “0” in the slope column indicates that the turbine is located on flat terrain.
The units of measurement are specified as follows: wind speed is expressed in meters per second (m/s), slope in degrees (°), DEM in meters (m), and air power density in watts per square meter (W/m2). All remaining spatial parameters are measured in meters (m).
The model was trained using the Adam optimizer [] with a learning rate of 0.01 and a regularization parameter () of 0.0001, which adjusts learning rates adaptively. The updated rules for the optimizer are as follows:
where is the exponentially weighted average of gradients at iteration t, is the exponentially weighted average of squared gradients at iteration t, and are decay rates for the moment estimates, is the gradient of the loss function with respect to the weights at iteration t, and are bias-corrected versions of and , represents the weights at iteration t, is a constant for numerical stability.
The Adam optimizer was chosen due to its efficiency in handling sparse gradients and its adaptive learning rate adjustments, making it well-suited for training deep neural networks in high-dimensional spaces.
Training was conducted for up to 200 iterations with early stopping based on validation loss. To evaluate the MLP model, multiple performance metrics were employed, including accuracy, precision [], recall, and F1-score [,]:
where TP is true positives, TN is true negatives, FP is false positives, and FN is false negatives.
The support metric indicates the number of instances in each class. For a given class 0, support is calculated as:
Additionally, the Matthews Correlation Coefficient (MCC) [] was used to measure the quality of binary classifications, particularly in imbalanced datasets:
Additional metrics, such as balanced accuracy and Cohen’s Kappa [], provided insights into class imbalance handling. The Receiver Operating Characteristic (ROC) curve and the Area Under the Curve (AUC) metric [] were used to assess the model’s discriminatory power.
Log loss [], a measure of prediction uncertainty, was calculated as:
where N is a number of samples, is the true label (0 or 1) for the i-th sample, and is the predicted probability for the positive class for the i-th sample.
The trained MLP model was applied to a new dataset consisting of 100,000 randomly selected points to predict their suitability for wind turbine installation in Poland (see Figure 3). Each point was assigned a suitability probability, which was appended to the dataset for further analysis. These predictions were exported in CSV and Excel formats, facilitating data visualization, post-processing, and integration with GIS software (v. 3.32 Lima) for spatial analysis.
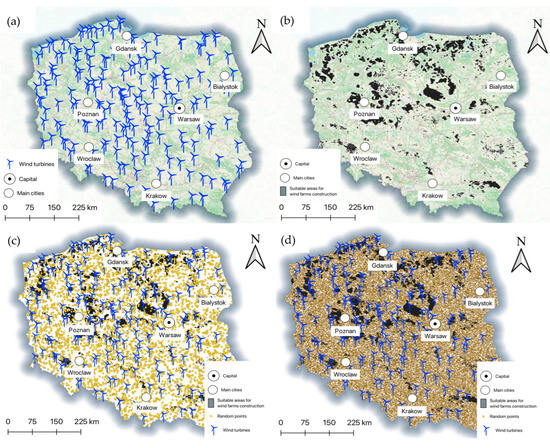
Figure 3.
(a) study area with existing wind turbines in Poland (as of April 2023); (b) study area with a map of suitable areas for wind farm construction in Poland; (c) existing wind turbines in Poland with random points located across the country, except for suitable areas; (d) Existing wind turbines in Poland with random points (blue color—existing wind turbines, yellow color—random points for training dataset, orange color—random points for testing dataset, black color—suitable areas).
3. Results
3.1. Preliminary Stage
At the end of 2021, the initial research, a review of the state-of-the-art practices in Poland, was conducted []. The total number of wind turbines as part of wind parks or single turbines was 3955. The dataset was subsequently updated for further analyses in April 2023 []. The number of wind turbines in the updated dataset was 4260 (Figure 3a). At present, there is no more up-to-date information about the number of installed wind turbines in public sources (i.e., annual reports, articles). However, this value is increasing. Thus, according to data from OpenStreetMap, at the beginning of 2025, the number of installed wind turbines in Poland amounted to 5160, which is an increase of 21% in two years.
In prior research, a map indicating suitable areas for wind farm construction across Poland was developed using a multi-criteria decision-making (MCDM) approach. Calculations were performed using the no-code environment of the QGIS software (v.3.32 Lima). This suitability map forms a foundational reference for the current study (Figure 3b).
3.2. The MLP Model Performance
Before assessing the performance of the MLP model, comprehensive data pre-processing was conducted. All existing wind turbines (4260 as of April 2023) were consolidated into a single file, supplemented with 4500 randomly generated points across Poland, excluding previously identified suitable areas (Figure 3c). While creating a set of random points, a minimum acceptable radius of 250 m was set, which is the minimum allowable distance between two neighboring industrial wind turbines. Each entry in the dataset was labeled with a binary suitability indicator, where wind turbines were labeled as 1 (suitable) and randomly generated points as 0 (unsuitable).
This pre-processed dataset served as the training set for the MLP model, enabling it to learn patterns distinguishing viable wind farm locations from unsuitable areas. The algorithm for creating the MLP model in Python is presented in Supplementary Material File S1.
Distances from each entry in the training dataset to natural protection zones from the GDEP database and infrastructural elements from the Bdot10k database were calculated. Additional attributes, including wind speed, power density at 100 m, slope, and elevation, were integrated. A total of 28 features were used to train the model. To evaluate the model efficiency, a testing dataset comprising 100,000 random points across Poland with an identical feature set was created (Figure 3d).
The MLP model demonstrates high performance on both validation and testing subsets, with an accuracy of 91% on the test subset (Table 1). The Precision, Recall, and F1-scores for both classes are well-balanced, indicating consistent performance in minimizing false positives and maximizing correct classifications.

Table 1.
Performance parameters of the MLP model on validation and testing subsets.
The performance parameters of the MLP model on the training dataset are presented below in Figure 4.
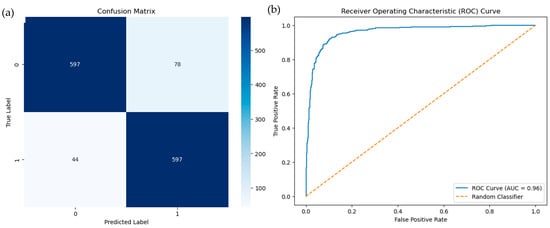
Figure 4.
MLP model performance analysis: confusion matrix (a) and ROC curve (b), testing dataset.
The confusion matrix (Figure 4a) demonstrates the performance of the MLP classification model in distinguishing suitable and unsuitable areas for wind turbine placement. Out of the total validation samples, 597 true positives and 597 true negatives were correctly identified, while 78 false positives and 44 false negatives were observed. This indicates a high level of classification accuracy and balanced model behavior across both classes.
The ROC curve (Figure 4b) further illustrates the model’s discriminative ability between the two classes. The area under the ROC curve (AUC = 0.9603) confirms the strong predictive capability of the model, with values close to 1.0 indicating excellent separability between suitable and unsuitable locations.
Figure 5 shows the results of probabilistic predictions for the testing dataset as a distribution diagram.
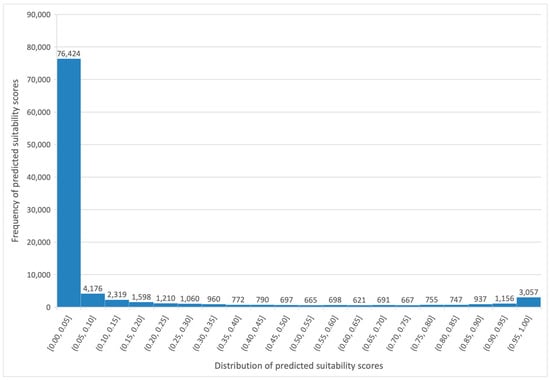
Figure 5.
Distribution diagram of predicted suitability scores for the testing dataset.
An issue was identified within the training dataset concerning the presence of zero values in multiple rows corresponding to wind turbine locations. This discrepancy is likely due to inconsistencies between historical data and subsequent administrative changes.
For instance, a wind farm may have been constructed in compliance with existing regulations, but later modifications to the boundaries of protected areas or urban districts by Polish authorities could render the original data obsolete. Consequently, the updated datasets, which incorporate both wind turbine locations and revised maps of protected areas and urban borders, contain zero values for certain parameters.
It is important to note that the year of wind farm construction is rarely reported in press releases or public records, with only a limited number of wind farms including this information.
Zero values were excluded from the training and testing datasets for two main reasons:
- The origin of these values is unclear; however, it is hypothesized by the authors that they may be associated with the construction year of the wind farms and border changes;
- Randomly generated points in the training and testing datasets exhibited zero values more frequently and were deemed unsuitable for analysis. For instance, random points situated in the center of Warsaw or within lakes represent locations where wind turbines cannot be constructed and, therefore, these were removed prior to the analysis.
The performance parameters of the MLP model trained on data without zeroes in the training dataset are presented in Table 2 and Figure 6.

Table 2.
Performance parameters of the MLP model on validation and testing subsets.
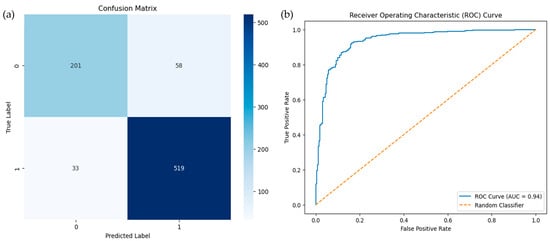
Figure 6.
MLP model performance analysis: confusion matrix (a) and ROC curve (b), testing dataset.
As Table 2 shows, the MLP model on a training dataset without zeroes achieved high performance, with 89% accuracy on the testing subset (Table 2b). Precision, Recall, and F1-scores indicate that the model performs well overall, with class 1 being slightly better classified than class 0.
Figure 6a presents the confusion matrix for the MLP model trained on the dataset with zero values removed. The results indicate that the model correctly classified 519 true negatives and 201 true positives, while misclassifying 58 false positives and 33 false negatives. These results confirm that the exclusion of uncertain zero values improved the model’s ability to generalize and better distinguish between suitable and unsuitable locations for wind turbines.
The corresponding ROC curve (Figure 6b) demonstrates strong model performance, with an AUC score of 0.94. This high AUC value indicates excellent separability between the two classes and validates the robustness of the model after data refinement. The enhanced classification stability suggests that removing ambiguous zero values mitigated data noise and improved the predictive accuracy of the MLP classifier.
Figure 7 shows the results of probabilistic predictions for the testing dataset as a distribution diagram.
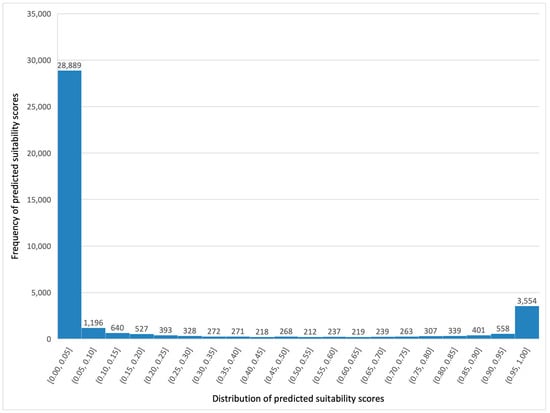
Figure 7.
Distribution diagram of predicted suitability scores for the testing dataset without zero values.
After removing the zero values, the testing dataset was reduced to 39,331 rows out of an initial 100,000, each accompanied by a corresponding prediction score. The range of the prediction scores spans from 0.00 to 0.99. Subsequently, points with prediction scores greater than 0.9 were filtered, resulting in a subset of 4112 rows.
In the next step, local regulations were applied to this filtered subset to exclude points that are situated too close to nature-protected areas, urban areas, and the power grid (Table 3).

Table 3.
Criteria with strict distance limitations.
After applying all filtering criteria, 510 random points were identified as suitable for the construction of new wind turbines, depicted in Figure 8.
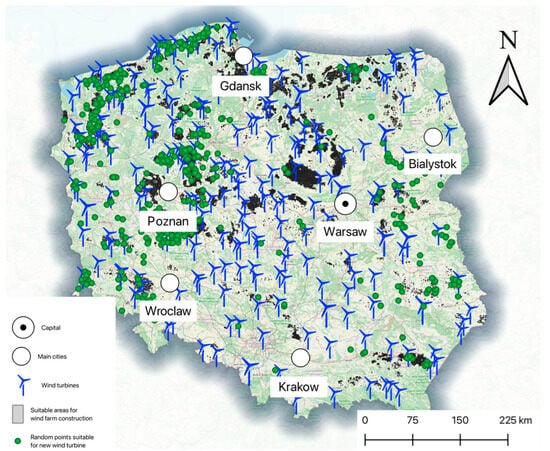
Figure 8.
Map of suitable random points for new wind turbine construction (blue color—existing wind turbines, green color—random points suitable for new wind turbine construction, black color—suitable areas). Own elaboration, based on own primary data.
3.3. The MLP Model Validation
To check the model performance heterogeneity across regions, three different areas of Poland were chosen: coastal, central, and mountainous (Figure 9). The selection of these areas allows us to cover all possible scenarios of wind turbine deployment in the country.
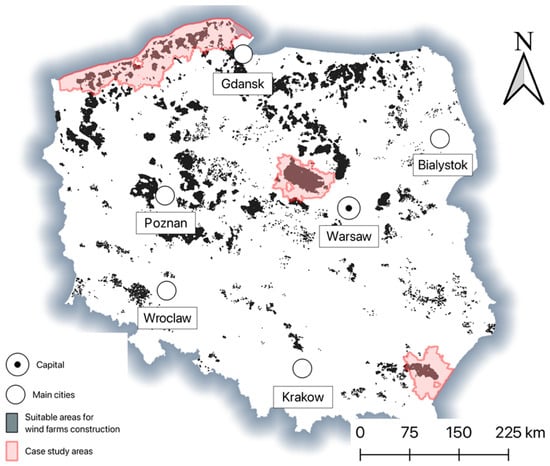
Figure 9.
Map with validation areas and suitable areas for wind turbine construction (red color—validation case study areas, black color—suitable areas).
In the case study area, 145,000 random points were created with the same set of features as in the training dataset for validation purposes (Figure 10).
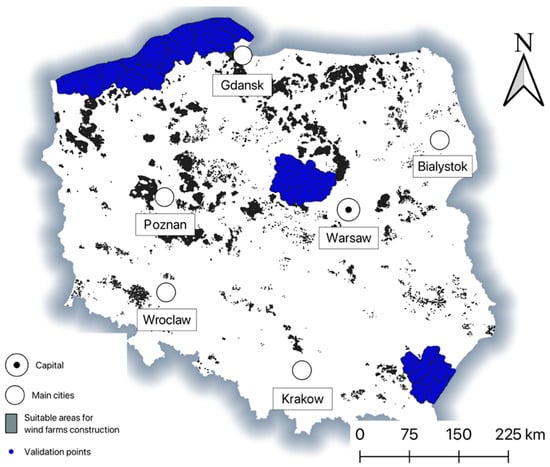
Figure 10.
Map with validation points before modeling and suitable area for wind turbine construction (blue color—validation points, black color—suitable areas).
After applying the MLP model and filtering points that achieve a prediction score higher than 0.9, a total of 16,807 valid points were obtained. After applying buffer zones, 3040 validation points are obtained, which are suitable for further investigations. Figure 11, Figure 12, Figure 13 and Figure 14 show the results for the suitable validation points and existing wind turbines.
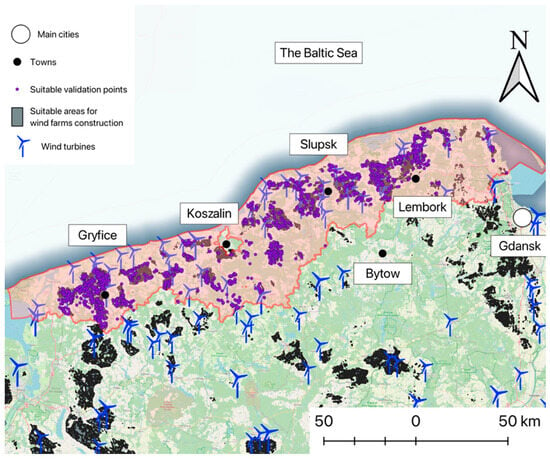
Figure 11.
Map with validation points suitable for wind turbine construction in the coastal region and existing wind turbines (blue color—wind turbines, purple color—validation points suitable for wind turbine construction, red color—validation area).
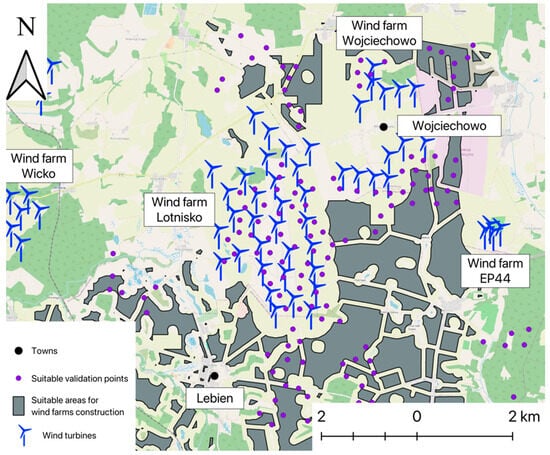
Figure 12.
Map with overlapping validation points suitable for wind turbine construction in the coastal region (zoomed-in view) and existing wind turbines (blue color—wind turbines, purple color—validation points suitable for wind turbine construction).
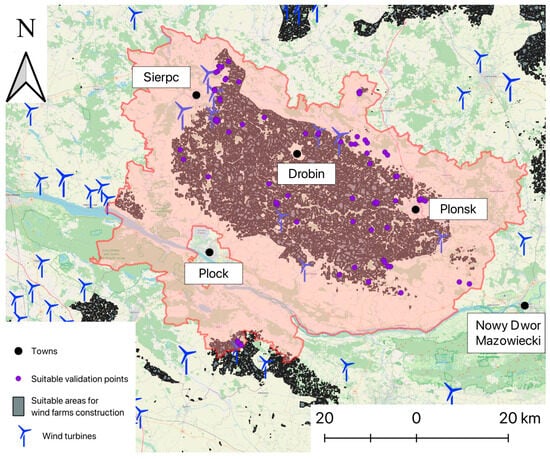
Figure 13.
Map with validation points suitable for wind turbine construction in the central region of Poland and existing wind turbines (blue color—wind turbines, purple color—validation points suitable for wind turbine construction, red color—validation area).
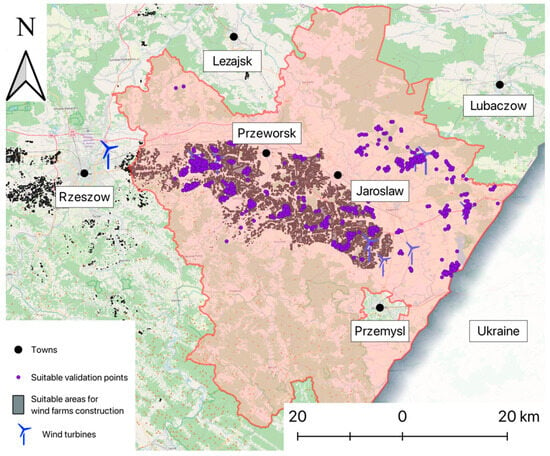
Figure 14.
Map with validation points suitable for wind turbine construction in the mountainous region of Poland and existing wind turbines (blue color—wind turbines, purple color—validation points suitable for wind turbine construction, red color—validation area).
The majority of validation points for potential new wind turbine construction are located on the Baltic coast, totaling 2355 points. As illustrated in Figure 11, the model’s predictions exhibit a strong correlation with the map of potential wind energy development in Poland, as presented in previous studies []. Additionally, the results align well with existing wind turbine locations, suggesting the high efficiency of the proposed model.
The model’s accuracy is further supported by its ability to replicate the locations of existing wind turbines with minor deviations, reinforcing its predictive reliability (Figure 12). The actual number of viable locations for new wind turbine construction, this is why, may be lower than predicted, as model-generated points frequently overlap with existing installations. Nevertheless, administrative boundaries were used as the spatial framework for the analysis—rather than a specific area-based assessment of investment potential—this limitation should be addressed in future refinements. Adjusting the model to investment potential areas further enhances accuracy and provides a more precise evaluation of suitable wind energy sites.
The lowest number of suitable points for wind turbine construction was identified in central Poland, a total of just 76 points. Despite the low count, the model maintains strong consistency with both the map of wind energy development areas and the distribution of existing wind turbines in this region. Existing wind turbines are primarily concentrated in the southwest and northeast of the study area (Figure 13). This spatial distribution shows the intentional creation of an air corridor to facilitate aircraft takeoffs and landings near the second airport of the capital city, Warsaw, located near Nowy Dwor Mazowiecki. These are the limitations of the model in terms of airspace control, as well as the unwillingness or inability of investors to develop a potentially affordable and sizeable (20 × 60 km) region.
The remaining 609 suitable points for wind turbine construction were identified in the mountainous region of southeastern Poland (Figure 14). However, as illustrated in Figure 3a,b and Figure 8, this region exhibits low potential for wind energy development. This is indicated by fewer viable wind turbine locations based on the wind resource map (Figure 3b) and a lower number of existing wind farms compared to other regions. In this case, the model demonstrates the lowest consistency with the map of potential wind energy development but maintains good alignment with existing wind turbine locations. This result finds insufficient input data for model training, particularly in regions with limited historical wind energy deployment. These are also topographical constraints, where rugged terrain and complex wind flow patterns reduce the feasibility of large-scale wind farm construction. The model’s predictions align well with existing wind farms, but incorporating wind speed data from weather stations or measurements taken from meteorological aerostats could give greater predictive accuracy in complex terrain.
4. Discussion
The results of this study emphasize the high potential of ML in site selection for renewable energy sources, particularly wind farm construction. The MLP model enabled a robust assessment of the wind turbine site suitability in Poland and demonstrated its ability to process high-dimensional datasets similarly to the studies of other authors []. The procedure was performed while integrating environmental [], topographical [], and infrastructure features [] to decision-making accuracy and scalability [].
Compared to traditional MCDM methods, the ML approach provides greater credibility and reliability for the location of wind turbines, distinct advantages as shown in the studies of other authors [,]. Traditional methods rely on subjective weighting factors and are limited in handling large datasets on a country-wide scale (excluding desert regions) [,]. In contrast, the MLP model objectively analyzes 28 parameters, identifying complex relationships that would be difficult to detect manually. Furthermore, additional parameters can be incorporated into the model, increasing complexity without reducing accuracy.
In addition, although the model was designed for Poland, its applicability to other countries is evident once trained on region-specific data [,]. Expanding the analysis to global datasets [,] and different regulatory frameworks [,,] will further enhance its utility for companies evaluating investment opportunities in renewable energy markets worldwide.
This study provides practical recommendations for policymakers, investors, and renewable energy planners, similar to the studies of other authors [,]. By identifying optimal sites for wind farm construction, the results contribute to Poland’s renewable energy targets [] while also aligning with the European Union’s broader [] energy transition goals. The methodology outlined in this research serves as a reference for integrating ML models into renewable energy planning [], offering a scalable [] and adaptable framework [] for application in other regions.
5. Conclusions
This study demonstrates the effectiveness of ML, particularly the MLP model, in optimizing site selection for wind farms in Poland. By integrating diverse datasets and incorporating complex environmental, topographical, and infrastructural criteria, the study provides a scalable and objective alternative to traditional site selection methods. Incorporating ML into wind farm site selection, compared to conventional methods, includes:
- Scalability and adaptability to high-dimensional datasets;
- The ability to identify intricate spatial patterns across multiple variables;
- Improved prediction accuracy and objectivity;
- Dynamic adaptation to new incoming data, allowing for continuous model refinement.
The identification of optimal wind turbine installation highlights the practical usability of the model in expanding renewable energy capacity while adhering to spatio-environmental and regulatory constraints.
ML-based approaches also present several challenges, including:
- Dependence on data quality, where incomplete or biased datasets may affect model accuracy;
- Difficulties in incorporating non-quantifiable factors, like social acceptance;
- Risk of overfitting or increased model complexity.
While challenges related to data quality and the exclusion of social acceptance factors remain, the study results reveal the potential of ML to enhance renewable energy planning. Future research should focus on improving model reliability by incorporating social and economic factors and expanding its applicability in a global context. Addressing these challenges will enable ML-based methodologies to play a substantial role in accelerating the transition to sustainable energy systems, aligning with both national and international climate goals.
Supplementary Materials
The following supporting information can be downloaded at: https://www.mdpi.com/article/10.3390/en18226038/s1, File S1: the algorithm for creating the MLP model (Python v.3.11.1).
Author Contributions
A.A.: Writing—original draft, Visualization, Validation, Software, Methodology, Investigation, Formal analysis, Data curation, Conceptualization. G.Ł.: Writing, review and editing, Funding acquisition. K.Y.: Writing—review and editing, Software, Methodology. R.M.: Writing—review and editing, Supervision, Resources, Project administration, Funding acquisition, Conceptualization. All authors have read and agreed to the published version of the manuscript.
Funding
This research was funded by the Ministry of Education and Science of Poland, grant numbers WZ/WB-IIS/4/2023 and WI/WB-IIŚ/3/2024.
Data Availability Statement
The MLP model algorithm is available in the Supplementary Material File S1. Input data used will be made available on request.
Acknowledgments
The authors gratefully acknowledge the Erasmus+ Program for funding this research.
Conflicts of Interest
The authors declare no conflicts of interest.
References
- Wind Energy—European Commission. Available online: https://research-and-innovation.ec.europa.eu/research-area/energy/wind-energy_en (accessed on 19 November 2024).
- Executive Summary—Renewables 2024—Analysis—IEA. Available online: https://www.iea.org/reports/renewables-2024/executive-summary (accessed on 19 November 2024).
- 1TW Celebration—Global Wind Energy Council. Available online: https://gwec.net/gwec-news/ (accessed on 19 November 2024).
- Wind Industry Reaches 1 Terawatt Wind Energy Capacity Milestone—GEV Wind Power. Available online: https://www.gevwindpower.com/wind-industry-news/wind-energy-capacity/ (accessed on 19 November 2024).
- China: Installed Wind Power Capacity 2023 | Statista. Available online: https://www.statista.com/statistics/950342/china-accumulated-installed-wind-power-capacity/ (accessed on 19 November 2024).
- China’s Solar Power Capacity Soared by 55% in 2023 and Wind Capacity by 21%|Enerdata. Available online: https://www.enerdata.net/publications/daily-energy-news/chinas-solar-power-capacity-soared-55-2023-and-wind-capacity-21.html (accessed on 19 November 2024).
- Wind Energy in Europe: 2023 Statistics and the Outlook for 2024-2030|WindEurope. Available online: https://windeurope.org/intelligence-platform/product/wind-energy-in-europe-2023-statistics-and-the-outlook-for-2024-2030/ (accessed on 19 November 2024).
- Net Zero by 2050—Analysis—IEA. Available online: https://www.iea.org/reports/net-zero-by-2050 (accessed on 19 November 2024).
- Japan’s Strategy to Expand Renewable Energy Contributes to the World’s Efforts Toward Tripling Renewable Energy. Available online: https://www.enecho.meti.go.jp/en/category/special/article/detail_198.html (accessed on 19 November 2024).
- China’s Net-Zero Ambitions: The next Five-Year Plan Will Be Critical for an Accelerated Energy Transition—Analysis—IEA. Available online: https://www.iea.org/commentaries/china-s-net-zero-ambitions-the-next-five-year-plan-will-be-critical-for-an-accelerated-energy-transition (accessed on 19 November 2024).
- China’s Green Efforts to Gain Momentum—Chinadaily.Com.Cn. Available online: https://global.chinadaily.com.cn/a/202409/05/WS66d90d9fa3108f29c1fca3fe.html (accessed on 19 November 2024).
- French Policies to Tackle Climate Change | Climate Change Observations. 2023. Available online: https://www.statistiques.developpement-durable.gouv.fr/edition-numerique/chiffres-cles-du-climat-2023/en/19-french-policies-to-tackle-climate (accessed on 19 November 2024).
- Energy Policy of Poland Until 2040 (EPP2040)—Ministry of Climate and Environment—Gov.Pl Website. Available online: https://www.gov.pl/web/climate/energy-policy-of-poland-until-2040-epp2040 (accessed on 19 November 2024).
- What the Government Is Doing for the Climate. Available online: https://www.bundesregierung.de/breg-en/issues/climate-action/government-climate-policy-1779414 (accessed on 19 November 2024).
- Green Transition—European Commission. Available online: https://reform-support.ec.europa.eu/what-we-do/green-transition_en (accessed on 19 November 2024).
- IEA Policy Review Highlights Leadership of United States on Energy Security and Clean Energy Transitions—News—IEA. Available online: https://www.iea.org/news/iea-policy-review-highlights-leadership-of-united-states-on-energy-security-and-clean-energy-transitions (accessed on 19 November 2024).
- Powering Up Britain: Net Zero Growth Plan—GOV.UK. Available online: https://www.gov.uk/government/publications/powering-up-britain/powering-up-britain-net-zero-growth-plan (accessed on 19 November 2024).
- Federal Sustainability Plan: Catalyzing America’s Clean Energy Industries and Jobs | Office of the Federal Chief Sustainability Officer. Available online: https://www.sustainability.gov/federalsustainabilityplan (accessed on 19 November 2024).
- Go Green with Australia | Austrade International. Available online: https://international.austrade.gov.au/en/why-australia/go-green-with-australia (accessed on 19 November 2024).
- Overview and Key Findings—World Energy Investment 2024—Analysis—IEA. Available online: https://www.iea.org/reports/world-energy-investment-2024/overview-and-key-findings (accessed on 19 November 2024).
- Global Renewable Energy Investments by Region 2023 | Statista. Available online: https://www.statista.com/statistics/186923/new-investments-worldwide-in-sustainable-energy-by-region/ (accessed on 19 November 2024).
- Raporty Za Rok 2023—PSE. Available online: https://www.pse.pl/dane-systemowe/funkcjonowanie-kse/raporty-roczne-z-funkcjonowania-kse-za-rok/raporty-za-rok-2023#r6_1 (accessed on 25 October 2024).
- Polska Przekroczyła 30-Proc. Udział Pogodozależnych OZE w Produkcji Energii w Kwietniu 2024—OPINIE. Available online: https://www.cire.pl/artykuly/opinie/polska-przekroczyla-30-proc-udzial-pogodozaleznych-oze-w-produkcji-energii-w-kwietniu-2024 (accessed on 25 October 2024).
- Poland Onshore Wind Energy 10H Distance Rule Liberalized. Available online: https://www.trade.gov/market-intelligence/poland-onshore-wind-energy-10h-distance-rule-liberalized (accessed on 21 June 2023).
- Nowe Odległości Farm Wiatrowych Od Domów—Ustawa Wiatrakowa Obowiązuje. Available online: https://www.muratorplus.pl/biznes/prawo/nowe-odleglosci-farm-wiatrowych-od-domow-ustawa-wiatrakowa-obowiazuje-aa-3pnA-gW7q-uxk4.html (accessed on 27 June 2023).
- Elektrownie Wiatrowe—Do Końca Czerwca Ma Być Nowa Ustawa. Available online: https://www.prawo.pl/biznes/elektrownie-wiatrowe-do-konca-czerwca-ma-byc-nowa-ustawa,514681.html (accessed on 12 May 2022).
- Ustawa z Dnia 20 Maja 2016 r. o Inwestycjach w Zakresie Elektrowni Wiatrowych. Available online: https://isap.sejm.gov.pl/isap.nsf/DocDetails.xsp?id=WDU20160000961 (accessed on 12 May 2022).
- Ustawa z Dnia 9 Marca 2023 r. o Zmianie Ustawy o Inwestycjach w Zakresie Elektrowni Wiatrowych Oraz Niektórych Innych Ustaw. Available online: https://isap.sejm.gov.pl/isap.nsf/DocDetails.xsp?id=WDU20230000553 (accessed on 19 July 2023).
- Renewable Energy Targets—European Commission. Available online: https://energy.ec.europa.eu/topics/renewable-energy/renewable-energy-directive-targets-and-rules/renewable-energy-targets_en (accessed on 25 October 2024).
- Pablo-Romero, P.; Pozo-Barajas, R.; Sánchez, J.; García, R.; Holechek, J.L.; Geli, H.M.E.; Sawalhah, M.N.; Valdez, R. A Global Assessment: Can Renewable Energy Replace Fossil Fuels by 2050? Sustainability 2022, 14, 4792. [Google Scholar] [CrossRef]
- Abromas, J.; Kamičaitytė-Virbašienė, J.; Ziemeļniece, A. Visual Impact Assessment of Wind Turbines and Their Farms on Landscape of Kretinga Region (Lithuania) and Grobina Townscape (Latvia). J. Environ. Eng. Landsc. Manag. 2015, 23, 39–49. [Google Scholar] [CrossRef]
- Ladenburg, J. Visual Impact Assessment of Offshore Wind Farms and Prior Experience. Appl. Energy 2009, 86, 380–387. [Google Scholar] [CrossRef]
- Estellés-Domingo, I.; López-López, P. Effects of Wind Farms on Raptors: A Systematic Review of the Current Knowledge and the Potential Solutions to Mitigate Negative Impacts. Anim. Conserv. 2024, 28, 334–352. [Google Scholar] [CrossRef]
- Williams, K.A.; Gulka, J.; Cook, A.S.C.P.; Diehl, R.H.; Farnsworth, A.; Goyert, H.; Hein, C.; Loring, P.; Mizrahi, D.; Petersen, I.K.; et al. A Framework for Studying the Effects of Offshore Wind Energy Development on Birds and Bats in the Eastern United States. Front. Mar. Sci. 2024, 11, 1274052. [Google Scholar] [CrossRef]
- Ellerbrok, J.S.; Farwig, N.; Peter, F.; Voigt, C.C. Forest Bat Activity Declines with Increasing Wind Speed in Proximity of Operating Wind Turbines. Glob. Ecol. Conserv. 2024, 49, e02782. [Google Scholar] [CrossRef]
- Wolniewicz, K.; Zagubień, A.; Wesołowski, M. Energy and Acoustic Environmental Effective Approach for a Wind Farm Location. Energies 2021, 14, 7290. [Google Scholar] [CrossRef]
- Pedersen, E.; van den Berg, F.; Bakker, R.; Bouma, J. Response to Noise from Modern Wind Farms in The Netherlands. J. Acoust. Soc. Am. 2009, 126, 634–643. [Google Scholar] [CrossRef]
- Hall, N.; Ashworth, P.; Devine-Wright, P. Societal Acceptance of Wind Farms: Analysis of Four Common Themes across Australian Case Studies. Energy Policy 2013, 58, 200–208. [Google Scholar] [CrossRef]
- Sonnberger, M.; Ruddat, M. Local and Socio-Political Acceptance of Wind Farms in Germany. Technol. Soc. 2017, 51, 56–65. [Google Scholar] [CrossRef]
- Mroczek, B.; Kurpas, D. Social Attitudes towards Wind Farms and Other Renewable Energy Sources in Poland. Med. Sr.—Environ. Med. 2014, 4, 19–28. [Google Scholar]
- Rocznik—Dane o Energetyce—Forum Energii. Available online: https://www.forum-energii.eu/rocznik-dane-o-energetyce (accessed on 20 November 2024).
- W Unii Weszło w Życie Nowe Prawo Dla OZE. Polska Była Przeciw—Gramwzielone.Pl. Available online: https://www.gramwzielone.pl/trendy/20171137/w-unii-weszlo-w-zycie-nowe-prawo-dla-oze-polska-byla-przeciw (accessed on 19 November 2024).
- Energetyka Wiatrowa w Polsce 2024—Odpowiedź Na Unijny Zwrot. Available online: https://www.teraz-srodowisko.pl/publikacje/energetyka-wiatrowa-w-polsce-2024/ (accessed on 20 November 2024).
- Moc Zainstalowana Farm Wiatrowych w Polsce w Czerwcu 2024 r. Available online: https://www.rynekelektryczny.pl/moc-zainstalowana-farm-wiatrowych-w-polsce/ (accessed on 20 November 2024).
- Amsharuk, A.; Łaska, G. Site Selection of Wind Farms in Poland: Combining Theory with Reality. Energies 2024, 17, 2635. [Google Scholar] [CrossRef]
- Saaty, T.L. Making and Validating Complex Decisions with the AHP/ANP. J. Syst. Sci. Syst. Eng. 2005, 14, 1–36. [Google Scholar] [CrossRef]
- Skibniewski, M.J.; Chao, L. Evaluation of Advanced Construction Technology with AHP Method. J. Constr. Eng. Manag. 1992, 118, 577–593. [Google Scholar] [CrossRef]
- Lin, Z.C.; Yang, C.B. Evaluation of Machine Selection by the AHP Method. J. Mater. Process Technol. 1996, 57, 253–258. [Google Scholar] [CrossRef]
- Amsharuk, A.; Łaska, G. A Review: Existing Methods for Solving Spatial Planning Problems for Wind Turbines in Poland. Energies 2022, 15, 8957. [Google Scholar] [CrossRef]
- Kaya, T.; Kahraman, C. Multicriteria Decision Making in Energy Planning Using a Modified Fuzzy TOPSIS Methodology. Expert. Syst. Appl. 2011, 38, 6577–6585. [Google Scholar] [CrossRef]
- Konstantinos, I.; Georgios, T.; Garyfalos, A. A Decision Support System Methodology for Selecting Wind Farm Installation Locations Using AHP and TOPSIS: Case Study in Eastern Macedonia and Thrace Region, Greece. Energy Policy 2019, 132, 232–246. [Google Scholar] [CrossRef]
- Kaya, T.; Kahraman, C. Multicriteria Renewable Energy Planning Using an Integrated Fuzzy VIKOR & AHP Methodology: The Case of Istanbul. Energy 2010, 35, 2517–2527. [Google Scholar] [CrossRef]
- Brans, J.P.; De Smet, Y. PROMETHEE Methods. Int. Ser. Oper. Res. Manag. Sci. 2016, 233, 187–219. [Google Scholar] [CrossRef]
- Sotiropoulou, K.F.; Vavatsikos, A.P. Onshore Wind Farms GIS-Assisted Suitability Analysis Using PROMETHEE II. Energy Policy 2021, 158, 112531. [Google Scholar] [CrossRef]
- Łaska, G. Wind Energy and Multicriteria Analysis in Making Decisions on the Location of Wind Farms: A Case Study in the North-Eastern of Poland. In Modeling, Simulation and Optimization of Wind Farms and Hybrid Systems; Maalawi, K., Ed.; IntechOpen: London, UK, 2020; pp. 1–18. [Google Scholar]
- Aydin, N.Y.; Kentel, E.; Sebnem Duzgun, H. GIS-Based Site Selection Methodology for Hybrid Renewable Energy Systems: A Case Study from Western Turkey. Energy Convers. Manag. 2013, 70, 90–106. [Google Scholar] [CrossRef]
- Amsharuk, A.; Łaska, G.; Malinowski, P. Statistical Analysis and Linear Model to Assess Wind Turbine Parameters Concerning Natural, Topographical and Meteorological Conditions in Poland; Polish Botanical Society, Agencja Wydawnicza EkoPress: Białystok, Poland, 2025; ISBN 978-83-969798-8-9. [Google Scholar]
- Latinopoulos, D.; Kechagia, K. A GIS-Based Multi-Criteria Evaluation for Wind Farm Site Selection. A Regional Scale Application in Greece. Renew. Energy 2015, 78, 550–560. [Google Scholar] [CrossRef]
- Baban, S.M.J.; Parry, T. Developing and Applying a GIS-Assisted Approach to Locating Wind Farms in the UK. Renew. Energy 2001, 24, 59–71. [Google Scholar] [CrossRef]
- Resak, M.; Rogosz, B.; Szczepiński, J.; Dziamara, M. Legal Conditions for Investments in Renewable Energy in the Overburden Disposal Areas in Poland. Sustainability 2022, 14, 1065. [Google Scholar] [CrossRef]
- Szurek, M.; Blachowski, J.; Nowacka, A. GIS-Based Method for Wind Farm Location Multi-Criteria Analysis. Min. Sci. 2014, 21, 65–81. [Google Scholar] [CrossRef]
- Sliz-Szkliniarz, B.; Vogt, J. GIS-Based Approach for the Evaluation of Wind Energy Potential: A Case Study for the Kujawsko–Pomorskie Voivodeship. Renew. Sustain. Energy Rev. 2011, 15, 1696–1707. [Google Scholar] [CrossRef]
- Chamanehpour, E. Site Selection of Wind Power Plant Using Multi-Criteria Decision-Making Methods in GIS: A Case Study. Comput. Ecol. Softw. 2017, 7, 49–64. [Google Scholar]
- Díaz-Cuevas, P.; Domínguez-Bravo, J.; Prieto-Campos, A. Integrating MCDM and GIS for Renewable Energy Spatial Models: Assessing the Individual and Combined Potential for Wind, Solar and Biomass Energy in Southern Spain. Clean. Technol. Environ. Policy 2019, 21, 1855–1869. [Google Scholar] [CrossRef]
- Rehman, S.; Mohammed, A.B.; Alhems, L. A Heuristic Approach to Siting and Design Optimization of an Onshore Wind Farm Layout. Energies 2020, 13, 5946. [Google Scholar] [CrossRef]
- Hajto, M.; Cichocki, Z.; Bidłasik, M.; Borzyszkowski, J.; Kuśmierz, A. Constraints on Development of Wind Energy in Poland Due to Environmental Objectives. Is There Space in Poland for Wind Farm Siting? Environ. Manage 2017, 59, 204–217. [Google Scholar] [CrossRef]
- Díaz-Cuevas, P.; Biberacher, M.; Domínguez-Bravo, J.; Schardinger, I. Developing a Wind Energy Potential Map on a Regional Scale Using GIS and Multi-Criteria Decision Methods: The Case of Cadiz (South of Spain). Clean Technol. Environ. Policy 2018, 20, 1167–1183. [Google Scholar] [CrossRef]
- Tsoutsos, T.; Tsitoura, I.; Kokologos, D.; Kalaitzakis, K. Sustainable Siting Process in Large Wind Farms Case Study in Crete. Renew. Energy 2015, 75, 474–480. [Google Scholar] [CrossRef]
- Amsharuk, A.; Łaska, G. The Approach to Finding Locations for Wind Farms Using GIS and MCDA: Case Study Based on Podlaskie Voivodeship, Poland. Energies 2023, 16, 7107. [Google Scholar] [CrossRef]
- Liu, B.; Ma, X.; Guo, J.; Li, H.; Jin, S.; Ma, Y.; Gong, W. Estimating Hub-Height Wind Speed Based on a Machine Learning Algorithm: Implications for Wind Energy Assessment. Atmos. Chem. Phys. 2023, 23, 3181–3193. [Google Scholar] [CrossRef]
- Zhang, Y. Forecasting for Wind Farm Energy Output in South Australia: A Comparative Analysis of Physical Methods and Deep Learning Methods. In Proceedings of the 2022 5th Asia Conference on Machine Learning and Computing, ACMLC, Bangkok, Thailand, 28–30 December 2022; pp. 83–88. [Google Scholar] [CrossRef]
- Mollick, T.; Hashmi, G.; Sabuj, S.R. Wind Speed Prediction for Site Selection and Reliable Operation of Wind Power Plants in Coastal Regions Using Machine Learning Algorithm Variants. Sustain. Energy Res. 2024, 11, 5. [Google Scholar] [CrossRef]
- Tapoglou, E.; Forster, R.M.; Dorrell, R.M.; Parsons, D. Machine Learning for Satellite-Based Sea-State Prediction in an Offshore Windfarm. Ocean Eng. 2021, 235, 109280. [Google Scholar] [CrossRef]
- Ti, Z.; Deng, X.W.; Yang, H. Wake Modeling of Wind Turbines Using Machine Learning. Appl. Energy 2020, 257, 114025. [Google Scholar] [CrossRef]
- Grilli, A.R.; Shumchenia, E.J. Toward Wind Farm Monitoring Optimization: Assessment of Ecological Zones from Marine Landscapes Using Machine Learning Algorithms. Hydrobiologia 2015, 756, 117–137. [Google Scholar] [CrossRef]
- Bilgili, A.; Arda, T.; Kilic, B. Explainability in Wind Farm Planning: A Machine Learning Framework for Automatic Site Selection of Wind Farms. Energy Convers. Manag. 2024, 309, 118441. [Google Scholar] [CrossRef]
- Sari, F.; Yalcin, M. Investigation of the Importance of Criteria in Potential Wind Farm Sites via Machine Learning Algorithms. J. Clean. Prod. 2024, 435, 140575. [Google Scholar] [CrossRef]
- Chaibi, M.; Ben Ghoulam, E.M.; Khallouk, N.; Tarik, L.; El Yousfi, Y.; El Hmaidi, A.; Berrada, M.; Mabrouki, J. A Novel Fuzzy-Multi-Criteria-GIS-Machine Learning Approach for Onshore Wind Power Plant Site Selection. EuroMediterr J. Environ. Integr. 2024, 10, 1025–1045. [Google Scholar] [CrossRef]
- Petrov, A.N.; Wessling, J.M. Utilization of Machine-Learning Algorithms for Wind Turbine Site Suitability Modeling in Iowa, USA. Wind. Energy 2015, 18, 713–727. [Google Scholar] [CrossRef]
- Topographic Objects Database (BDOT10k). Available online: https://www.geoportal.gov.pl/dane/baza-danych-obiektow-topograficznych-bdot10k/ (accessed on 28 June 2023).
- Geoportal.Gov.Pl. Available online: https://mapy.geoportal.gov.pl/imap/Imgp_2.html (accessed on 28 June 2023).
- Dostęp Do Danych Geoprzestrzennych—Generalna Dyrekcja Ochrony Środowiska. Available online: https://www.gov.pl/web/gdos/dostep-do-danych-geoprzestrzennych (accessed on 28 June 2023).
- Global Wind Atlas. Available online: https://globalwindatlas.info/en/ (accessed on 1 July 2023).
- Poland Wind Power Plants. Available online: https://openinframap.org/stats/area/Poland/plants?source=wind (accessed on 29 June 2023).
- Numeryczny Model Terenu o Interwale Siatki Co Najmniej 100 m. Available online: https://dane.gov.pl/pl/dataset/792,numeryczny-model-terenu-o-interwale-siatki-co-najmniej-100-m (accessed on 28 June 2023).
- Digital Elevation Model (DEM). Available online: https://www.geoportal.gov.pl/dane/numeryczny-model-terenu (accessed on 28 June 2023).
- Dziennik Ustaw—Rok 2023 Poz. 1336—INFOR.PL. Available online: https://www.infor.pl/akt-prawny/DZU.2023.194.0001336,ustawa-o-ochronie-przyrody.html (accessed on 1 March 2024).
- Pedregosa, F.; Michel, V.; Grisel, O.; Blondel, M.; Prettenhofer, P.; Weiss, R.; Vanderplas, J.; Cournapeau, D. Scikit-Learn: Machine Learning in Python. J. Mach. Learn. Res. 2011, 12, 2825–2830. [Google Scholar]
- Rumelhart, D.E.; Hinton, G.E.; Williams, R.J. Learning Representations by Back-Propagating Errors. Nature 1986, 323, 533–536. [Google Scholar] [CrossRef]
- Rumelhart, D.E.; McClelland, J.L.; Group, P.R. Parallel Distributed Processing, Volume 1: Explorations in the Microstructure of Cognition: Foundations; The MIT Press: Cambridge, MA, USA, 1986; ISBN 9780262291408. [Google Scholar]
- LeCun, Y.; Bottou, L.; Bengio, Y.; Haffner, P. Gradient-Based Learning Applied to Document Recognition. Proc. IEEE 1998, 86, 2278–2323. [Google Scholar] [CrossRef]
- Kingma, D.P.; Ba, J.L. Adam: A Method for Stochastic Optimization. arXiv 2014, arXiv:1412.6980. [Google Scholar]
- Powers David, M.W. Evaluation: From Precision, Recall and F-Measure to ROC, Informedness, Markedness and Correlation. Int. J. Mach. Learn. Technol. 2011, 2, 37–63. [Google Scholar]
- Van Rijsbergen, C.J. Information Retrieval. J. Am. Soc. Inf. Sci. 1979, 30, 374–375. [Google Scholar] [CrossRef]
- Rijsbergen, V. Information Retrieval—Chapter 7; Department of Computing Science, University of Glasgow: Glasgow, UK, 1979; ISBN 0408709294. [Google Scholar]
- Matthews, B.W. Comparison of the Predicted and Observed Secondary Structure of T4 Phage Lysozyme. Biochim. Et Biophys. Acta BBA—Protein Struct. 1975, 405, 442–451. [Google Scholar] [CrossRef]
- Cohen, J. A Coefficient of Agreement for Nominal Scales. Educ. Psychol. Meas. 1960, 20, 37–46. [Google Scholar] [CrossRef]
- Hanley, J.A.; McNeil, B.J. The Meaning and Use of the Area under a Receiver Operating Characteristic (ROC) Curve. Radiology 1982, 143, 29–36. [Google Scholar] [CrossRef]
- Good, I.J. Rational Decisions. J. R. Stat. Soc. Ser. B Methodol. 1952, 14, 107–114. [Google Scholar] [CrossRef]
- Moradi, S.; Yousefi, H.; Noorollahi, Y.; Rosso, D. Multi-Criteria Decision Support System for Wind Farm Site Selection and Sensitivity Analysis: Case Study of Alborz Province, Iran. Energy Strategy Rev. 2020, 29, 100478. [Google Scholar] [CrossRef]
- Azizi, A.; Malekmohammadi, B.; Jafari, H.R.; Nasiri, H.; Amini Parsa, V. Land Suitability Assessment for Wind Power Plant Site Selection Using ANP-DEMATEL in a GIS Environment: Case Study of Ardabil Province, Iran. Environ. Monit. Assess. 2014, 186, 6695–6709. [Google Scholar] [CrossRef] [PubMed]
- Wind Energy Developments and Natura 2000: Guidance Document. Available online: https://op.europa.eu/en/publication-detail/-/publication/65364c77-b5b8-4ab6-919d-8f4e3c6eb5c2 (accessed on 12 May 2025).
Disclaimer/Publisher’s Note: The statements, opinions and data contained in all publications are solely those of the individual author(s) and contributor(s) and not of MDPI and/or the editor(s). MDPI and/or the editor(s) disclaim responsibility for any injury to people or property resulting from any ideas, methods, instructions or products referred to in the content. |
© 2025 by the authors. Licensee MDPI, Basel, Switzerland. This article is an open access article distributed under the terms and conditions of the Creative Commons Attribution (CC BY) license (https://creativecommons.org/licenses/by/4.0/).