Abstract
The G-function can obtain the formation ground stress information by identifying the fracture closure point after fracturing, but the main fracture closure period of the deep coal seam volume fracture network is long, and the on-site pump stop time is short, and only the branch fracture closure can be observed. In order to explore the relationship between the closure pressure of branch fractures and the horizontal in situ stress, taking the deep coal seam in Daning–Jixian area as the background, the numerical simulation of the pump-stopping pressure drop of a complex fracture network with different complexity and different approximation angles was carried out using a finite element method, and the relationship between the closure pressure corresponding to the fracture closure point and the in situ stress was explored. The results show that when the crack approximation angle is greater than 60°, it can be approximately considered that the closure pressure of the first crack closure point tends to the maximum horizontal in situ stress. Furthermore, the minimum horizontal in situ stress can be obtained by formula conversion. The above-outlined method is applied to the in situ stress prediction of the X well area in Daning–Jixian County. The calculation results are compared with the test fracturing results, and the relative difference is within 5%, which shows that it has good accuracy and feasibility. The research results can provide guidance for the optimization of deep coalbed methane scheme design.
1. Introduction
According to preliminary assessments, the geological resources of deep coalbed methane (CBM) in China at depths exceeding 2000 m amount to 40.71 × 10¹² m3, with recoverable resources of 10.01 × 10¹² m3 [1,2]. In recent years, China’s deep CBM development has gradually entered a stage of efficient and large-scale production capacity construction [3]. There is an urgent need for accurate in situ stress results to provide effective data support for research such as pressure prediction and design optimization, and a pressing demand to understand the impact of the in situ stress field on deep CBM occurrence, fracturing, and gas production, thereby guiding perforation interval selection and operational parameter optimization for gas wells.
In engineering practice, the G-function is mostly used to analyze the shut-in pressure decline curve from mini-frac tests. The closure pressure identified at the main fracture closure point via the G-function is considered the minimum horizontal principal stress, which can relatively accurately reflect formation stress information and friction conditions, and has wide application [4,5]. Chen Zhengrong et al. [6], taking CBM wells in the northern margin of the Qinshui Basin as their research object, obtained closure pressure values from G-function plots based on mini-frac pressure decline data; these values were basically consistent with the minimum horizontal principal stress obtained from laboratory tests. Jiang Jianfang et al. [7] used mini-frac data to obtain parameters such as fluid loss coefficient and closure pressure through methods like the G-function and log–log plots. Jing Jiyun et al. [8] modified the expression for the reservoir fluid loss coefficient and proposed an improved G-function method to obtain the formation closure pressure. However, in practical field applications, due to time and cost constraints, it is impossible to conduct mini-frac tests on every well. Moreover, deep coal seams have strong heterogeneity and significant local variations in the stress field [9], making the fracturing test results from some wells not universally applicable. There is an urgent need to explore new methods for in situ stress evaluation.
Fracturing operation data are direct parameters reflecting formation characteristics, and shut-in pressure decline tests are almost a mandatory step after fracturing in directional or horizontal wells. After shut-in, the fluid within the fractures gradually leaks off, and the fractures tend to close under the action of in situ stress. The time and pressure of closure reflect the formation stress characteristics. Therefore, in situ stress information of the reservoir can be obtained from the shut-in pressure decline test data of the main fracturing operation. However, compared to the simple fractures formed by traditional small-scale mini-frac tests, the complex fracture networks formed by current volume fracturing have more complex closure characteristics. Field monitoring and interpretation of shut-in pressure decline have found that volume-fractured fracture networks are characterized by “late initiation of closure and long closure period” [10], while the on-site shut-in time is relatively short (generally about 15–30 min). Using the G-function often fails to identify the main fracture closure point but instead identifies multiple branch fracture closure points. Current research focuses on analyzing the main fracture closure process, neglecting the influence of in situ stress on branch fractures.
In summary, to investigate the relationship between the closure pressure of different branch fractures and in situ stress, this paper first analyzes the relationship between the maximum and minimum horizontal principal stresses and closure pressure from a mechanical perspective, concluding that the closure pressure is significantly related to the natural fracture approach angle. Secondly, numerical simulations of shut-in pressure decline for fracture networks of different complexities were conducted, and the G-function was used to analyze the shut-in pressure decline curves, clarifying the relationship between the maximum horizontal stress and the closure behavior of volume-fractured fracture networks in regions with high-angle natural fractures. Furthermore, based on the conclusions from the numerical simulations, the minimum horizontal principal stress was obtained through formula conversion. The research results can provide support for the optimization of hydraulic fracturing technology and design in deep coal seams.
2. Basic Principles of the G-Function
The G-function is a diagnostic analysis tool based on pressure decay data after fracturing operations. By constructing a relationship curve between pressure and the G-time function, it accurately identifies fracture closure characteristics. Through G-function analysis, the fracture closure pressure can be clearly determined, thereby effectively obtaining the principal stresses of the formation, which is of great significance for reservoir evaluation and fracturing design optimization.
2.1. Relationship Between Closure Pressure and Horizontal Stress
It is currently generally believed that closure pressure refers to the bottomhole pressure when the existing fracture faces come into contact [11]; in engineering, it is mostly considered to be the average fluid pressure acting on the fracture face required to just keep an existing fracture from closing under specific conditions, i.e., the fluid pressure required to prevent the fracture from closing. When pumping of fracturing fluid stops, the fracture begins to close gradually from the tip, and its length, width, and height correspondingly decrease. When the fracture faces are about to contact, the fluid pressure within the fracture reaches equilibrium with the normal stress perpendicular to the fracture face. Thus, the closure pressure can be considered equivalent to the formation normal stress perpendicular to the fracture face.
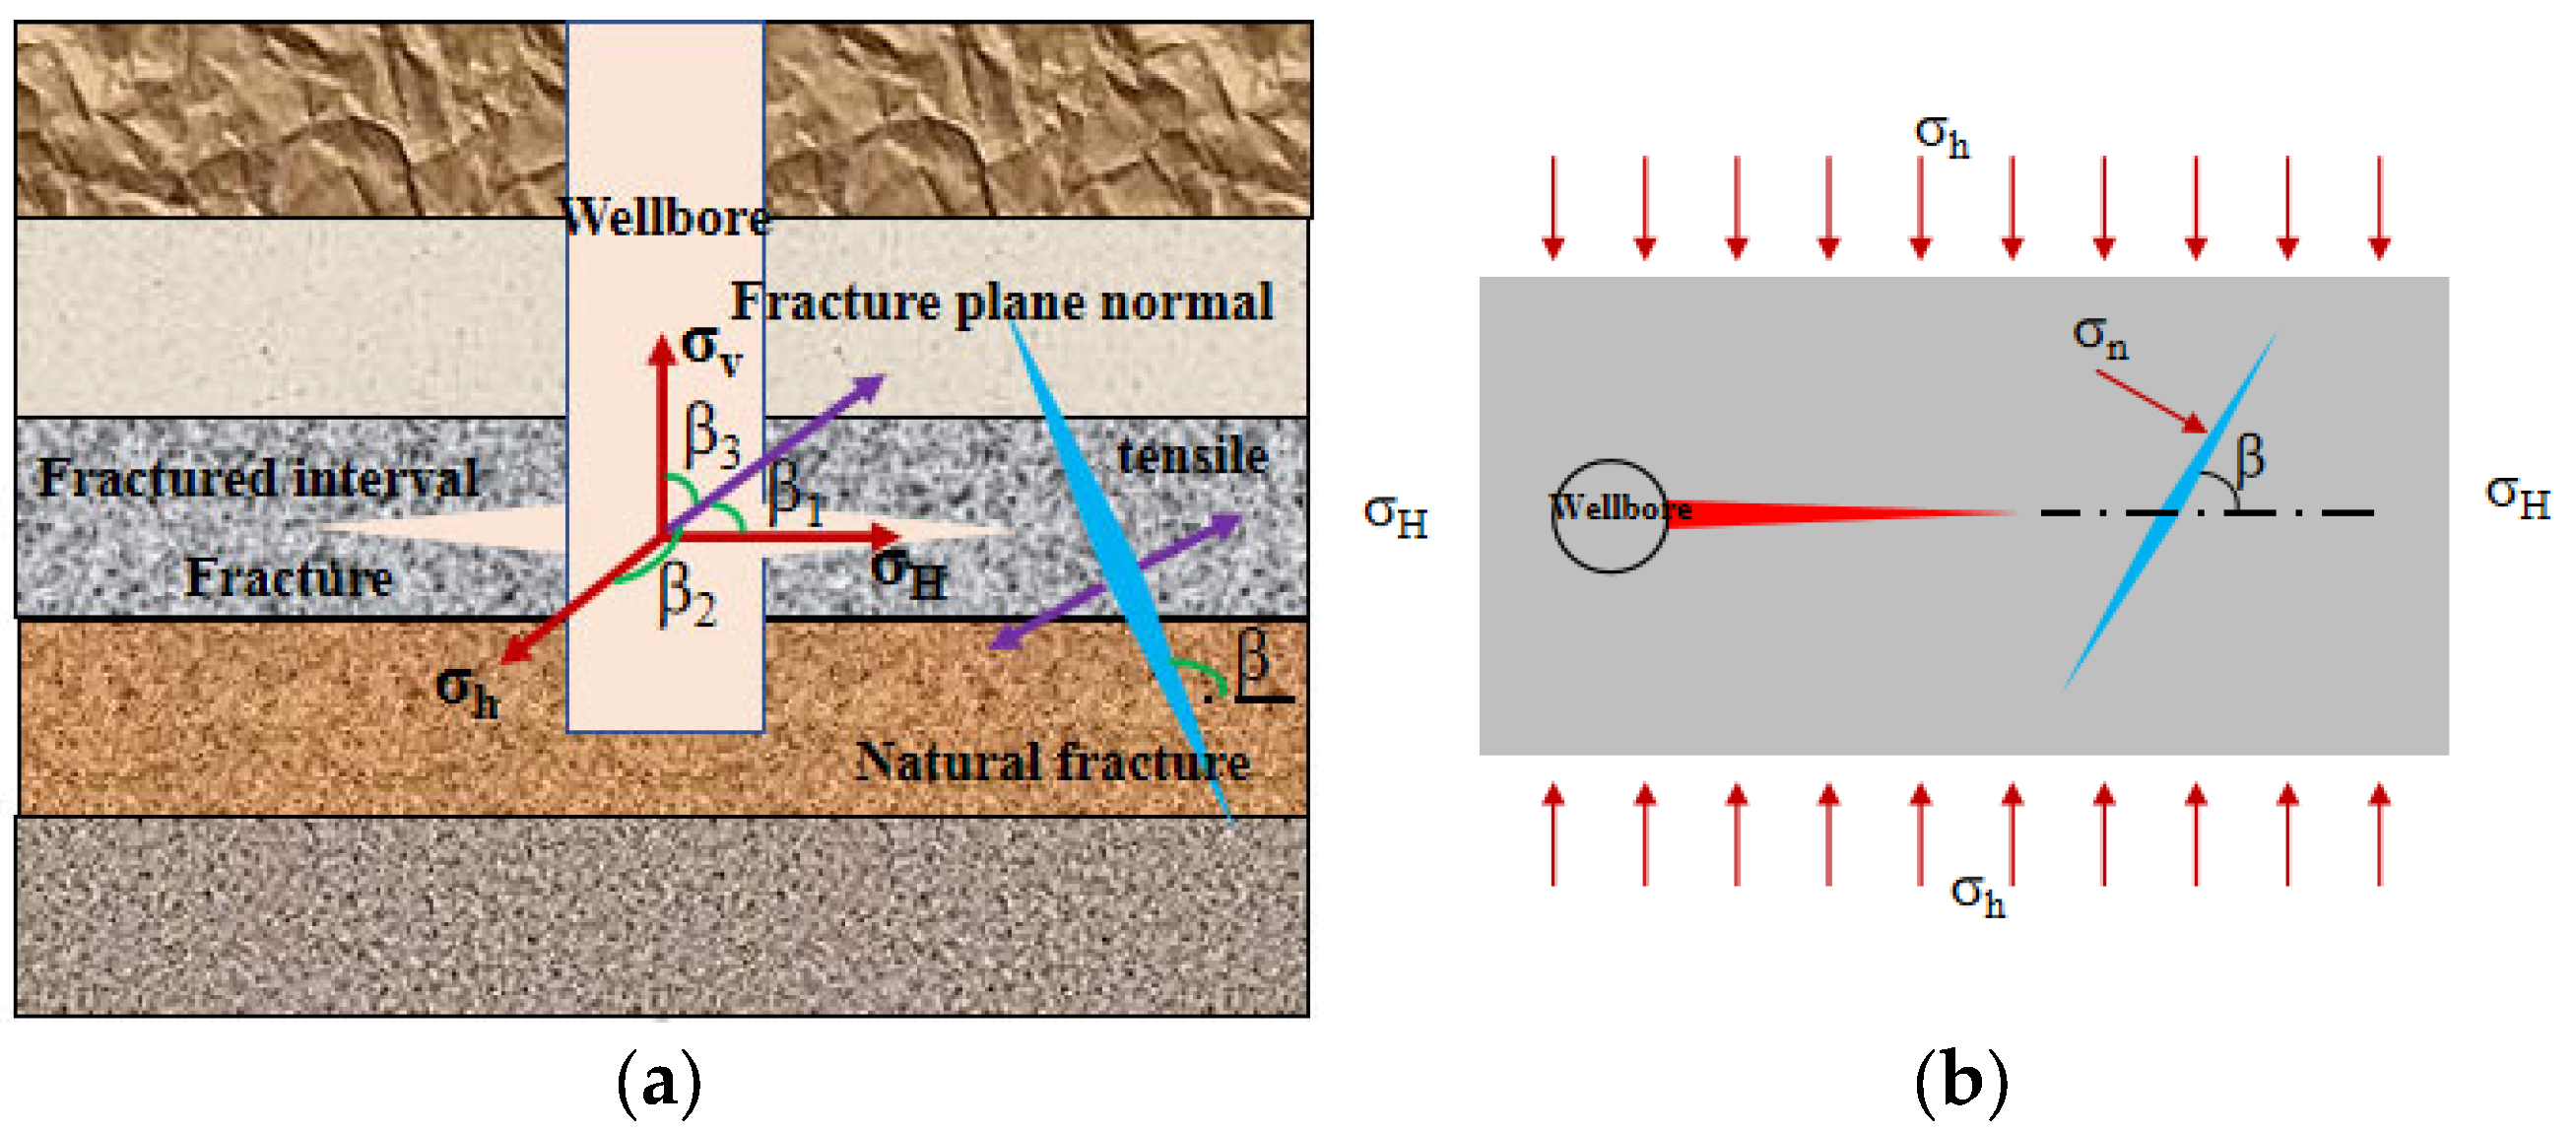
As shown in Figure 1, during fracturing, the fracturing fluid enters the fracture and generates a normal stress acting on the fracture walls. When the normal stress generated by the fracturing fluid is not less than the effective compressive stress borne by the formation, hydraulic fractures will cause tensile or shear failure along natural fractures. The normal stress acting on the fracture surface can be calculated by considering the orientation of the fracture relative to the in situ stress field. Let the approach angle of the natural fracture be β, then the normal stress acting on a fracture face of any orientation is [12,13,14]
Figure 1.
Crack normal stress diagram. (a) Tensile failure of natural fracture. (b) Interaction between hydraulic fracture and natural fracture.
The formula for the normal stress on a natural fracture plane in a two-dimensional plane can be expressed as
where σH is the maximum horizontal principal stress, MPa; σh is the minimum horizontal principal stress, MPa; σv is the overburden pressure, MPa; , , are the direction cosines of the natural fracture face normal vector with the three principal stress vectors, dimensionless; and β is the natural fracture approach angle, °.
2.2. G-Function Method for Identifying Closure Point
When the fluid loss into micro-fractures is not considered, the fluid loss coefficient can be approximately considered constant, leading to the following G-function formula [15]:
For reservoirs with developed fractures, the fracturing fluid loss coefficient is usually considered a function related to pressure. The loss coefficient can be expressed as
where is the fracturing fluid efficiency at the end of pumping excluding spurt loss, dimensionless; ΔPf(tp) is the net pressure in the fracture at shut-in, MPa; Φ is the fracturing fluid loss parameter during fracture extension; C(t) represents the fluid loss coefficient at any time after shut-in, cm/min1/2; C(tp) represents the fluid loss coefficient at the moment of shut-in, cm/min1/2; P(tp) represents the instantaneous shut-in pressure (ISIP) at the wellbore at shut-in, MPa; P(t) represents the bottomhole pressure at any time after shut-in, MPa; and Pi represents the original formation pressure, MPa.
A Cartesian coordinate system of G-function vs. P (treatment pressure) is established based on the G-function equation and the pressure decline equation. The treating pressure p* is the slope of this curve [14]:
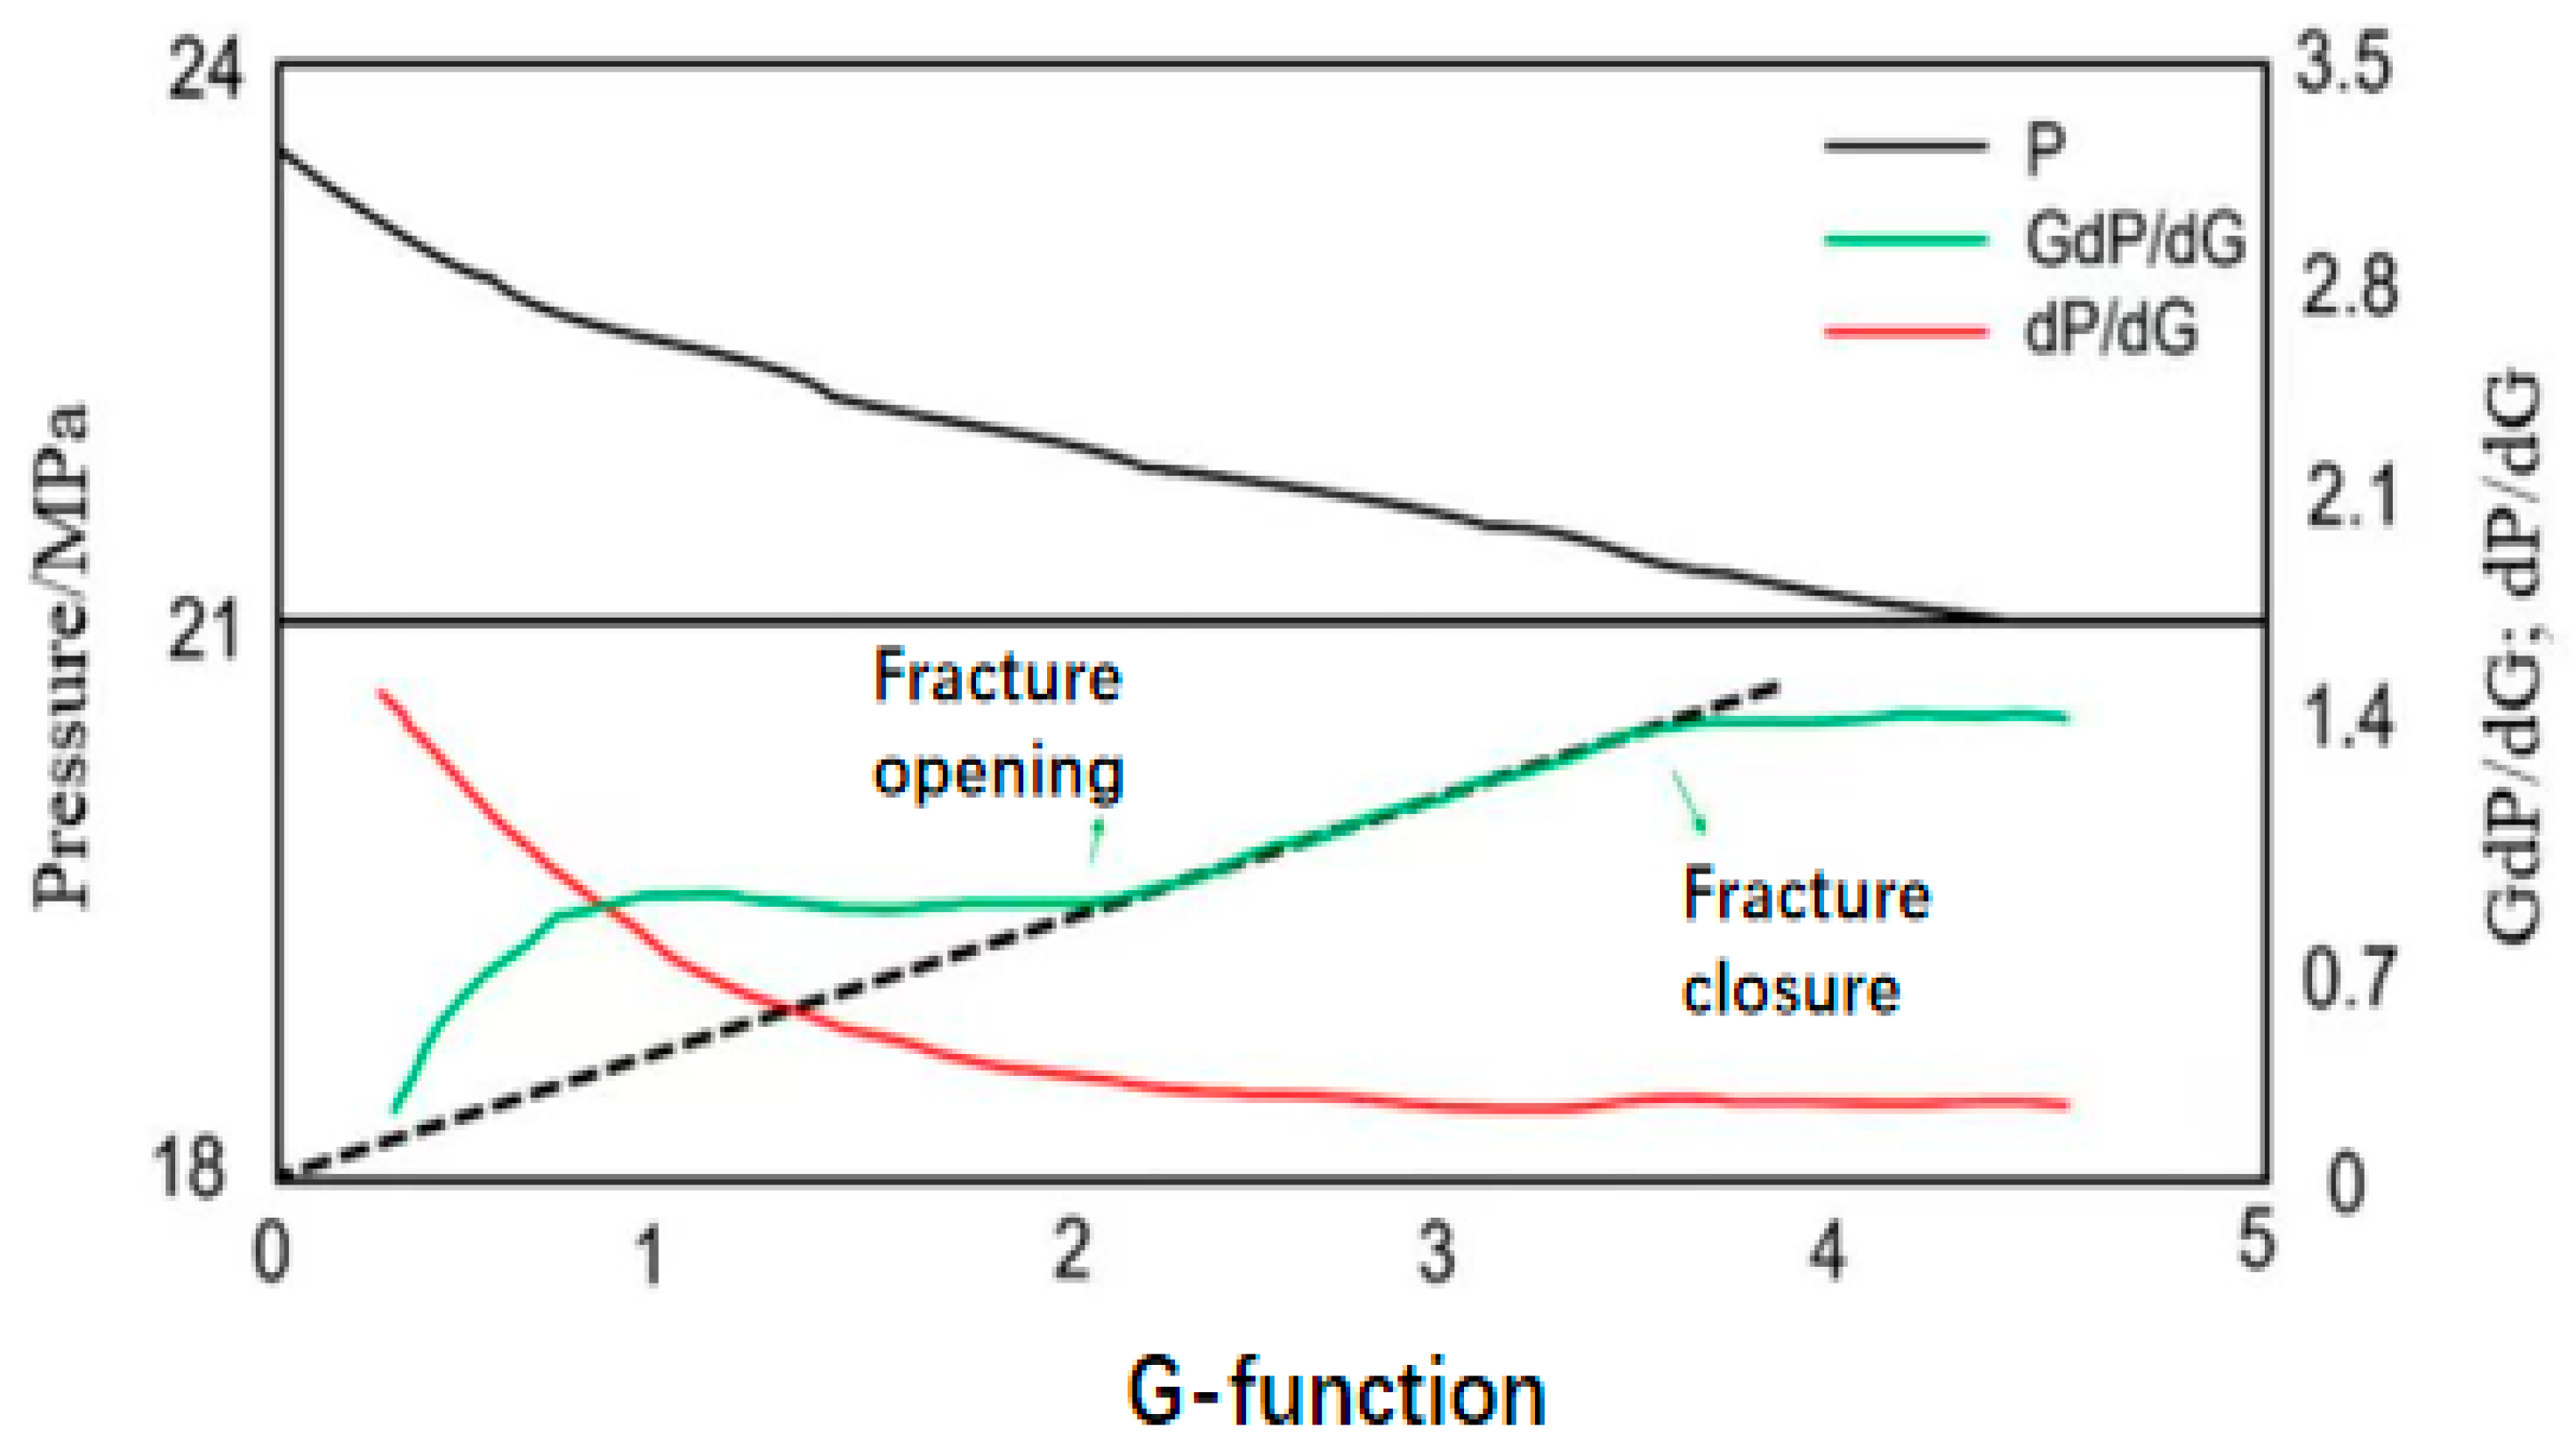
According to the formula, when the match pressure remains constant, parameters such as the fluid loss coefficient and proportionality coefficient remain unchanged for any given formation, indicating that the fluid state within the fracture is stable and the fracture is in the stage of gradual closure. Therefore, the relationship curve between the treating pressure p* and the G-function can be plotted (Figure 2). The interval where p* remains constant is the fracture closure interval, thus allowing the determination of the fracture closure point [16]. To identify the fracture closure point more accurately, a superposition derivative function GdP/dG is created to amplify the variation trend of the curve. When the horizontal segment in the dP/dG vs. G relationship curve is difficult to distinguish, it can be judged based on the approximate linear relationship in the GdP/dG vs. G plot.
Figure 2.
G-function relation curve diagram.
2.3. Identification of Closure Points for Fractures of Different Complexity
Based on common simple, moderately complex, and complex natural fractures in formations, hydraulic fracturing processes can form hydraulic fracture systems of varying complexity.
2.3.1. Conventional Fractures
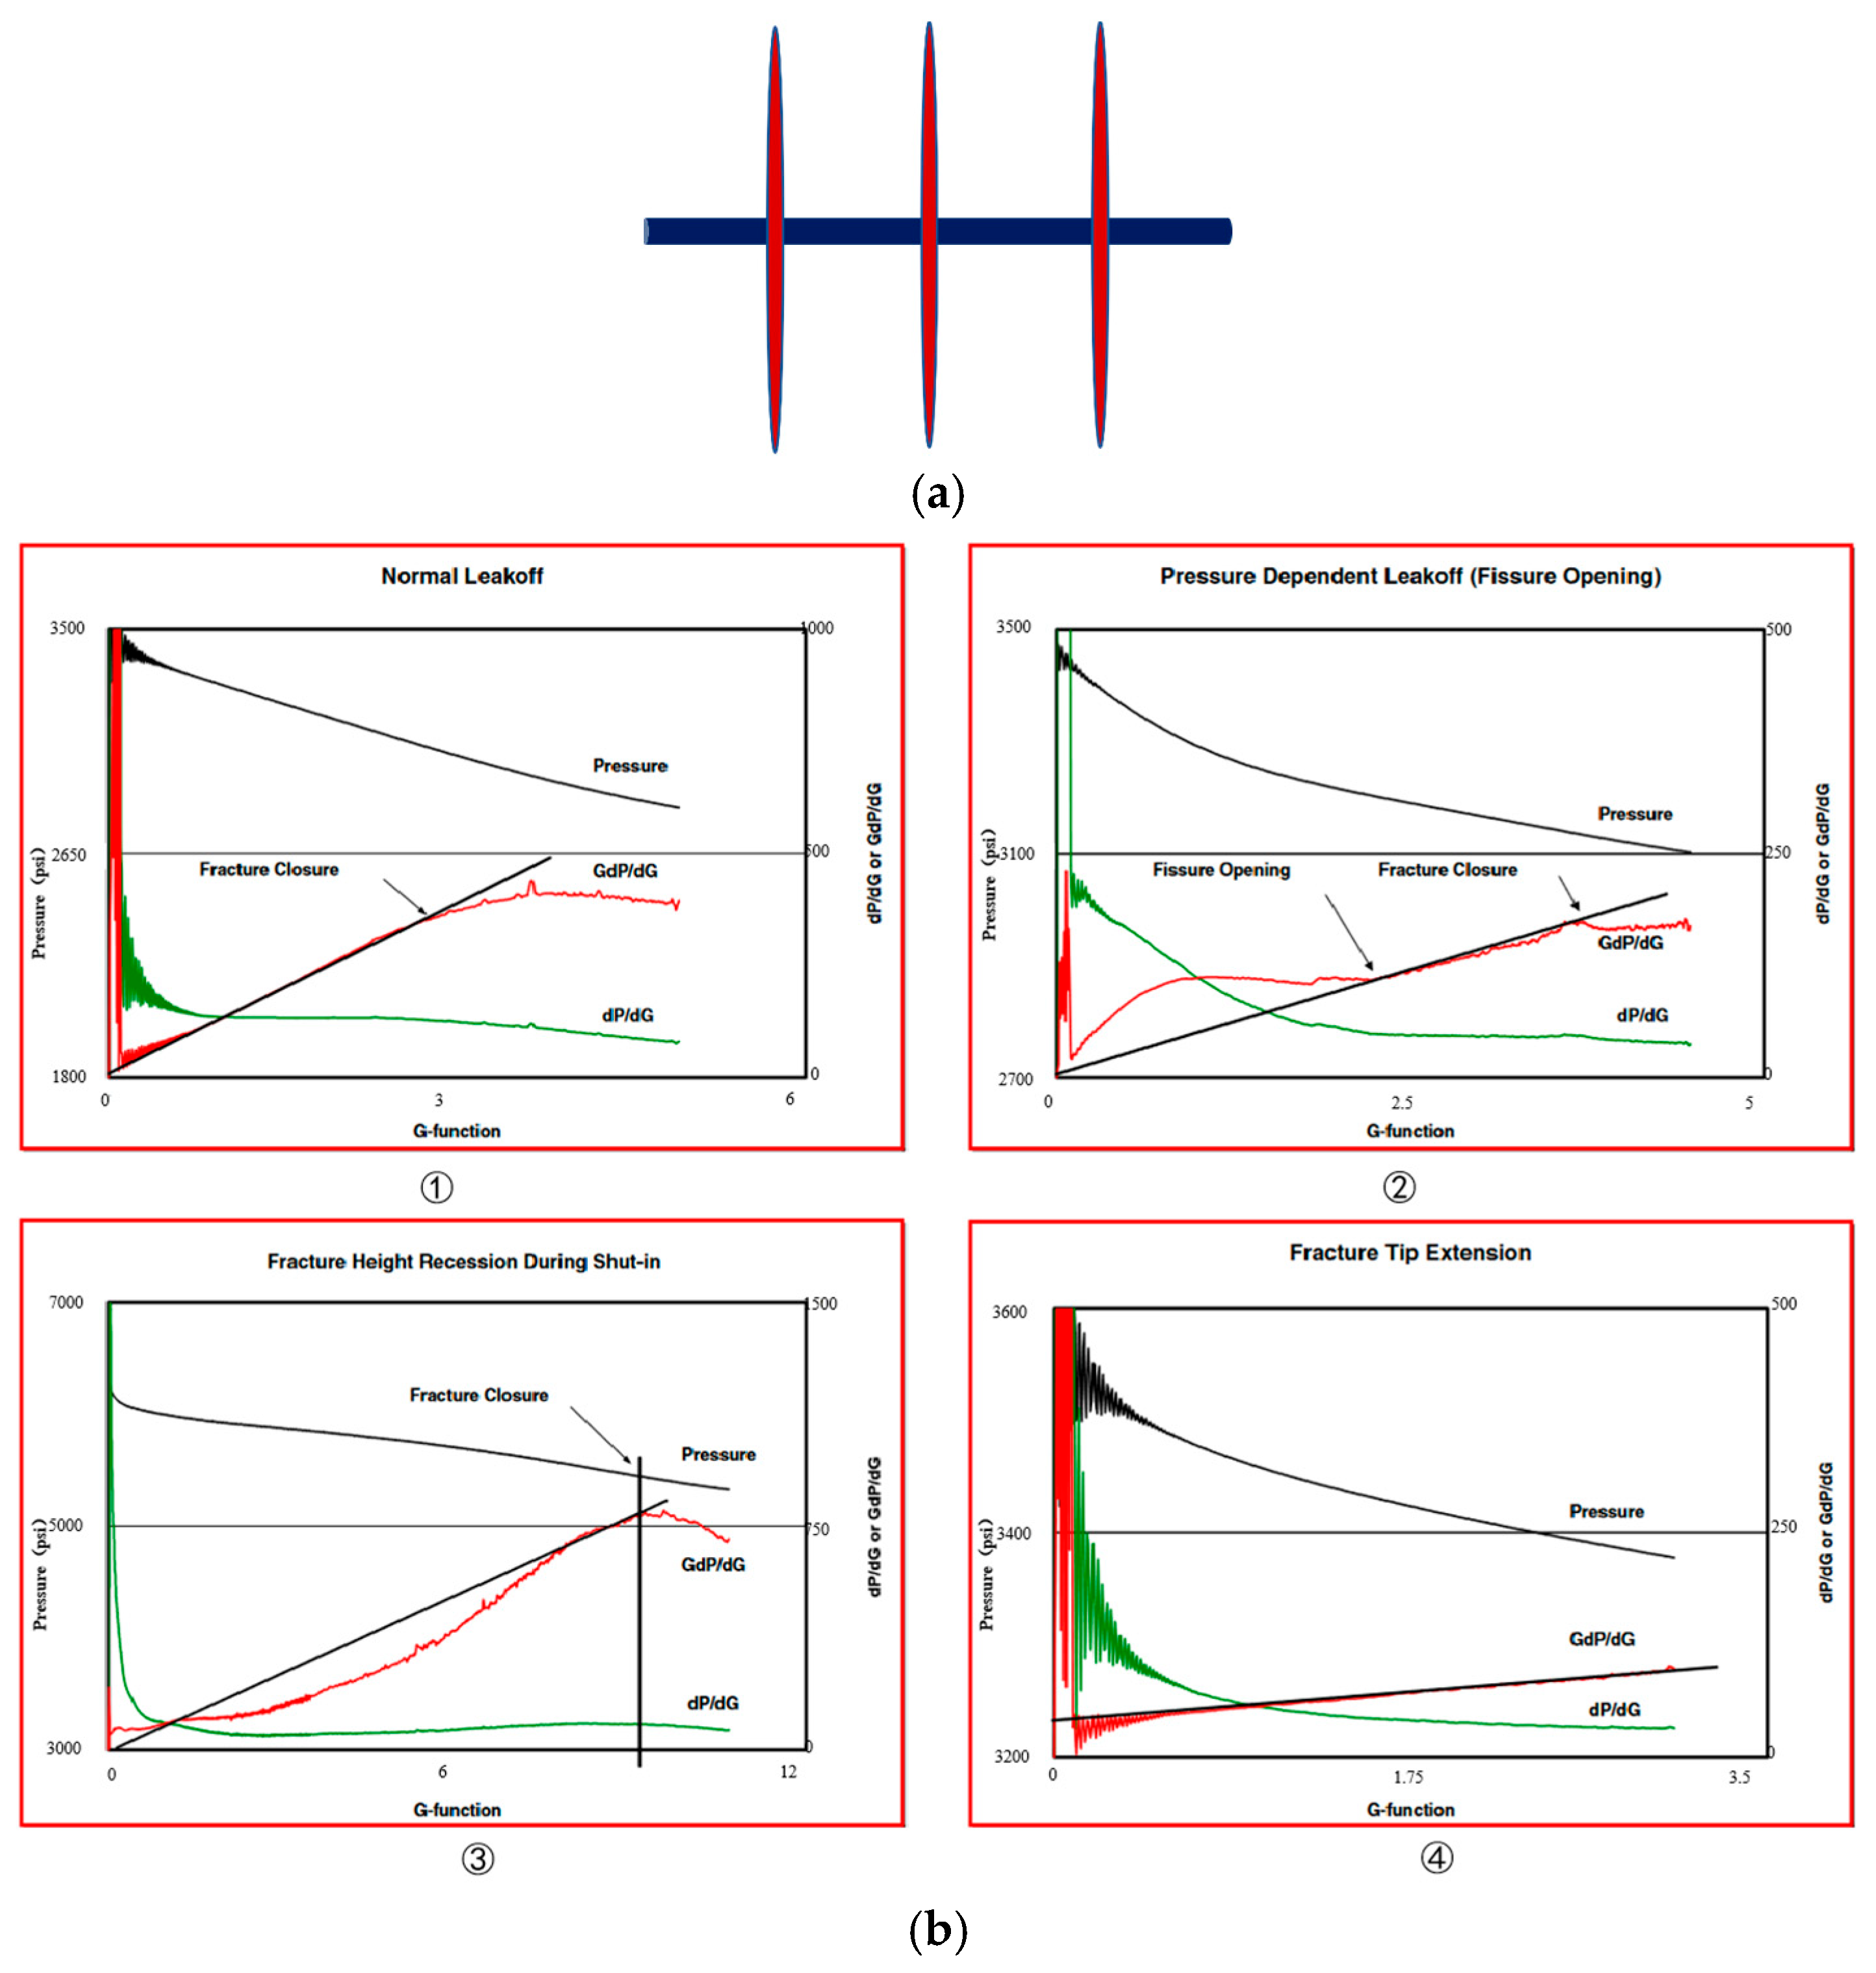
Nolte emphasized that since fluid loss is limited by filter cake or the reservoir, the fluid loss coefficient for conventional bi-wing fractures can be considered constant and independent of pressure. In this case, the G-function superposition derivative equation exhibits a linear relationship with time, and the formula can be simplified as [17]
G-function plots for conventional bi-wing fractures can be further divided into four types based on leak-off behavior (Figure 3): normal leak-off, fracture height recession leak-off, stress-sensitive leak-off, and fracture extension leak-off, commonly used for post-fracturing evaluation in unconventional volume fracturing.
Figure 3.
Conventional simple fracture morphology and corresponding G-function image [18]. (a) Conventional simple fracture morphology. (b) The corresponding G-function image.
2.3.2. Moderately Complex Fractures
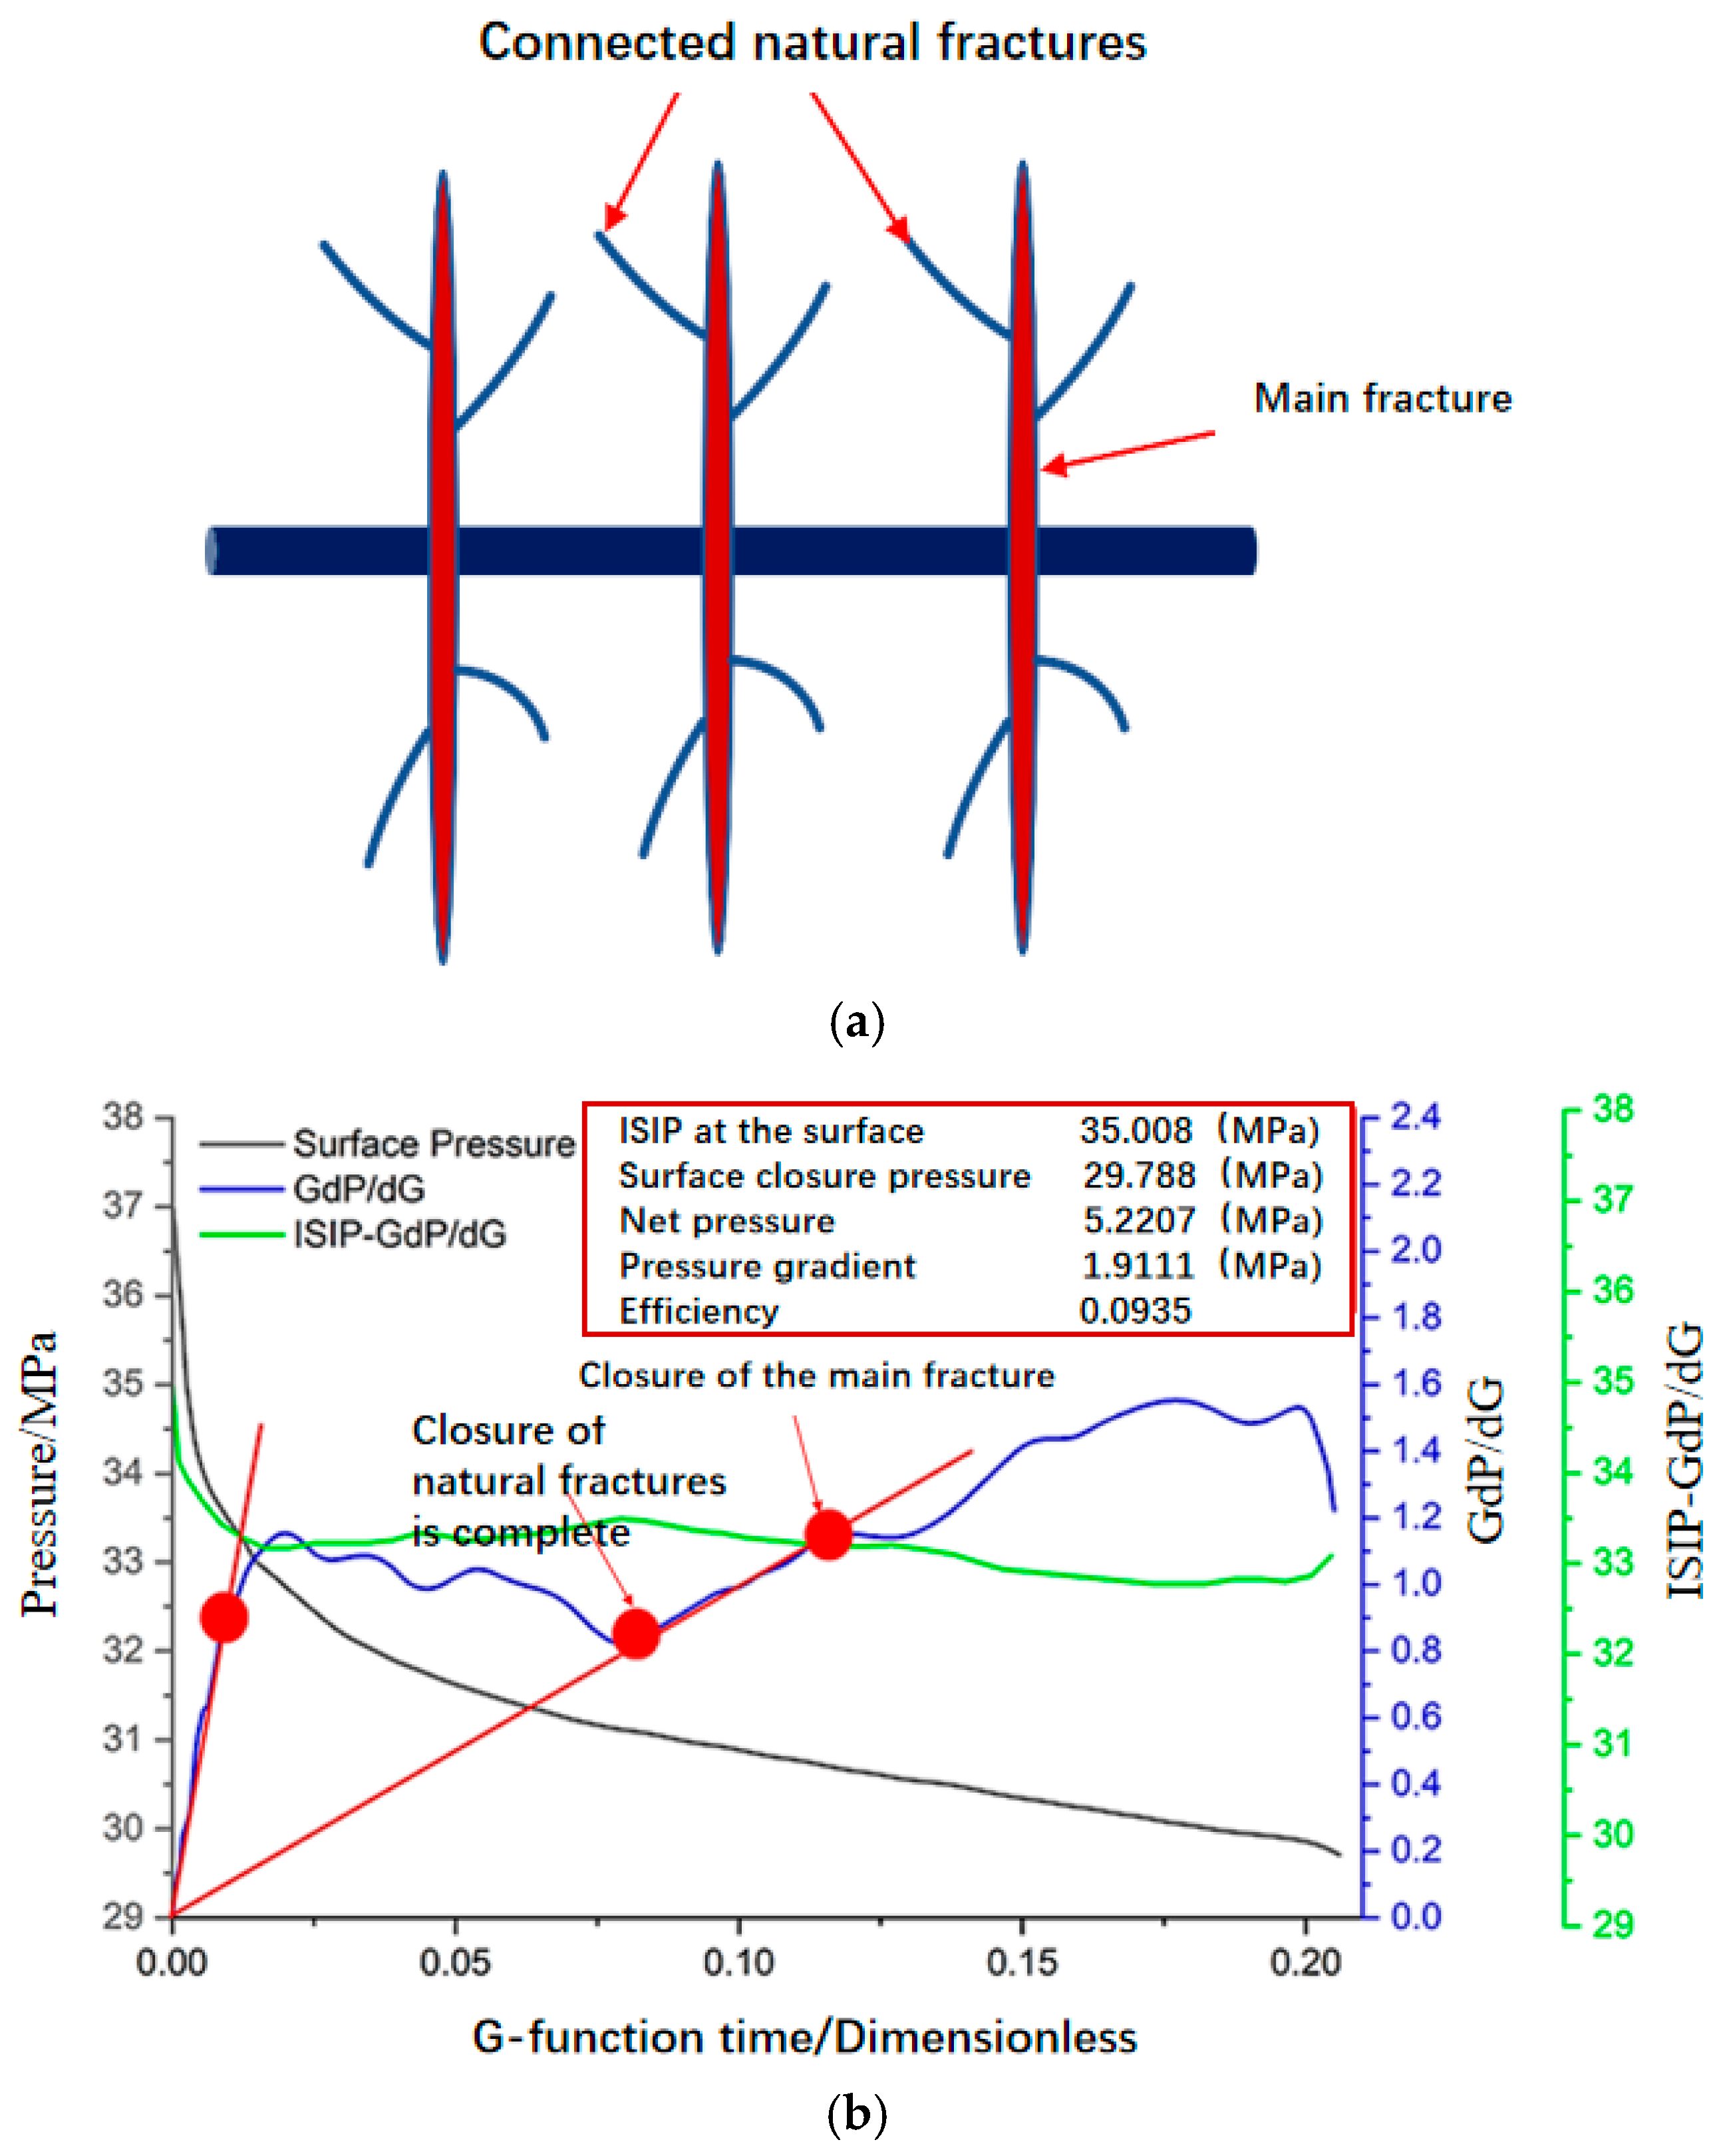
This type of fracture usually forms during fracturing in reservoirs with relatively developed natural fractures. The main hydraulic fracture connects with some natural fractures or other structural weak planes in the reservoir, generating secondary fractures. In this case, the fluid loss coefficient is a function of pressure. When the fluid pressure within the fractures is greater than the closure pressure of the natural fractures, fracturing fluid in both the main hydraulic fracture and the connected natural fractures leaks off into the formation simultaneously, with a fluid loss coefficient of CL1; as the pressure within the fractures continuously decreases, the natural fractures gradually close, after which the fracturing fluid leaks off only through the main hydraulic fracture, with a fluid loss coefficient of CL2 [19].
Here, Pf0 is the closure pressure of the natural fracture, MPa; CL1 is the fluid loss coefficient before the natural fracture closes, cm/min1/2; and CL2 is the fluid loss coefficient after the natural fracture closes, cm/min1/2.
After pumping stops at the end of the field fracturing operation, fractures close sequentially according to their width and net pressure, from smallest to largest; the main hydraulic fracture closes last (Figure 4). By drawing the G-function superposition derivative curve intersecting the origin, the closure points of both the natural fractures and the main hydraulic fracture can be obtained.
Figure 4.
More complex fracture morphology and corresponding G-function image. (a) More complex fracture morphology. (b) The corresponding G-function image.
2.3.3. Complex Fractures
During volume fracturing, a network of intersecting fractures, with main fractures as the backbone, is formed. This involves creating one or more main fractures with a high net pressure and large width through fracturing. These main fractures simultaneously connect with natural fractures, rock bedding, joints, and other structural weak planes in the reservoir. Due to changes in the reservoir stress state and the continuous leak-off of fracturing fluid into these weak planes, tensile failure and shear slip occur, generating secondary fractures on both sides of the main fracture, which then further branch to form the next generation of induced fractures. This cycle repeats, eventually forming a fracture network system with varying net pressures and fracture widths, ranging from large to small [20].
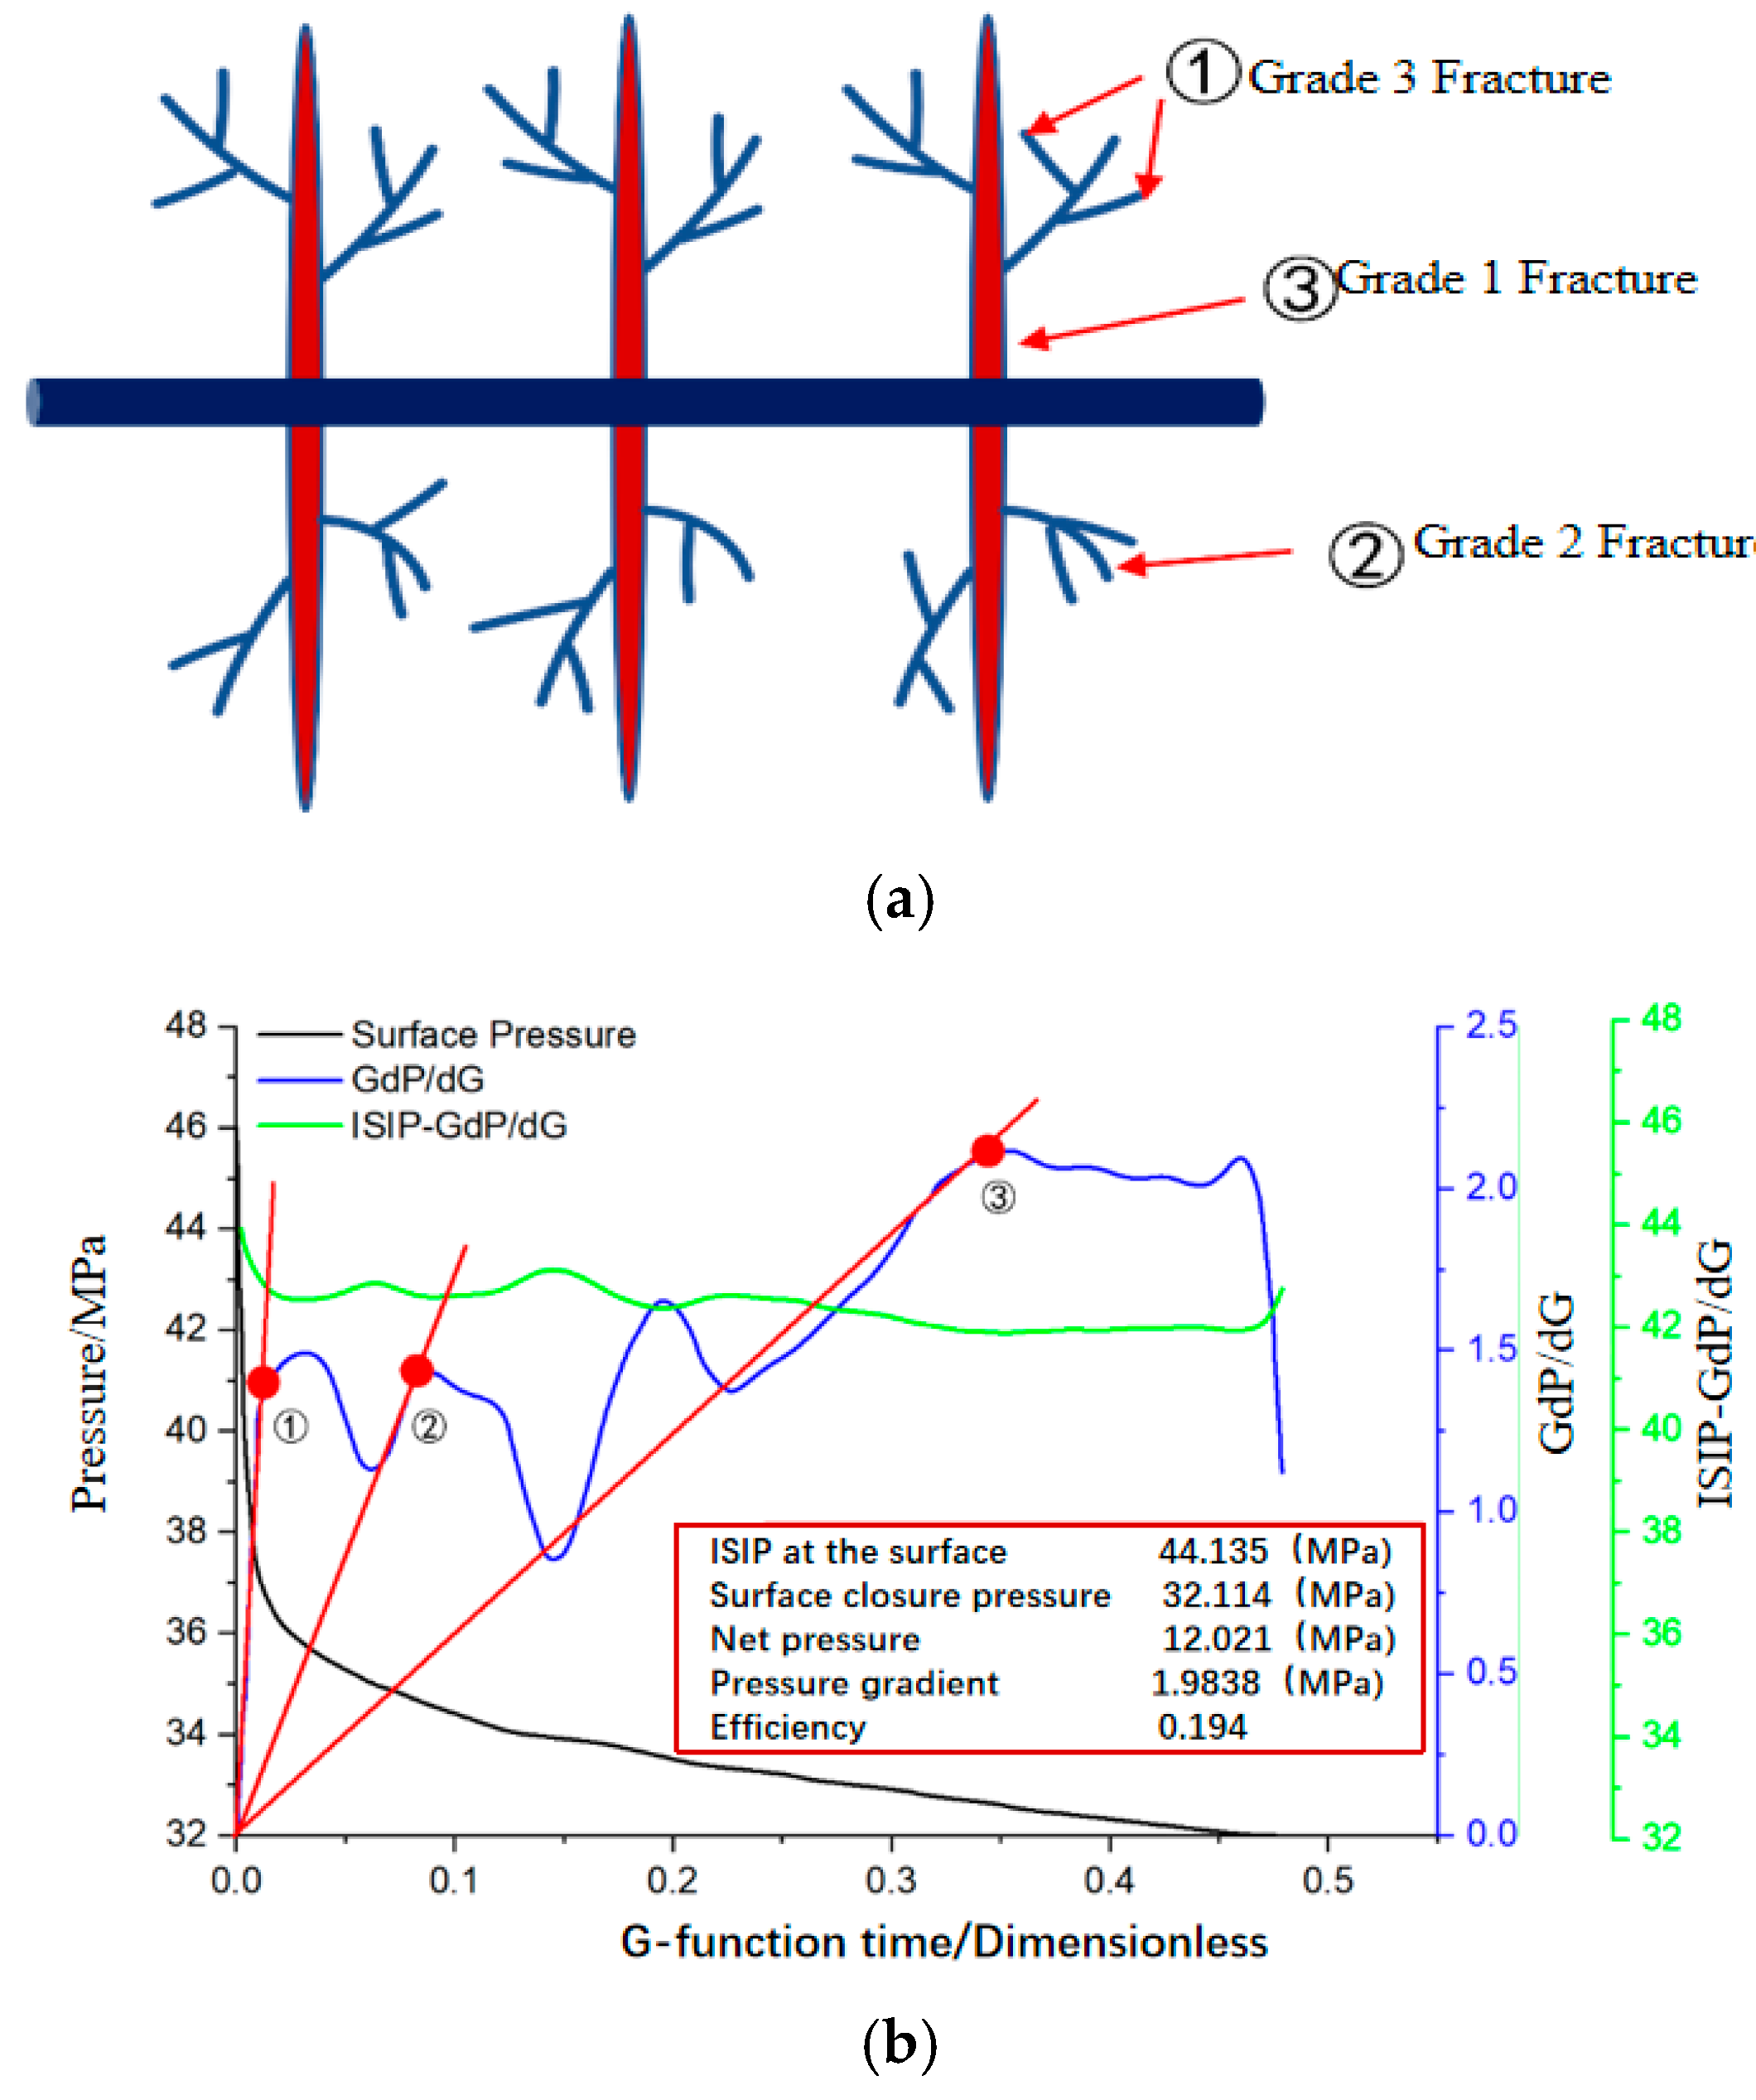
During shut-in after pumping stops, fractures close continuously, meaning smaller-scale fractures close first, and larger-scale fractures close later, with the largest main fracture closing last. Because volume fracturing creates a complex fracture network system with multiple levels of branch fractures, closure does not occur continuously within a certain time frame but shows multiple closure events. The fluid loss coefficient also changes with the different scales of fractures formed. According to the chronological order of fracture closure (same as the order of fracture scale), the fractures are named sequentially—Fracture 1, Fracture 2, …, Fracture n—with corresponding fluid loss coefficients—CL1, CL2 … CLn—showing a stepwise decrease starting from CL1, leading to the following formula [21]:
Analyzing the G-function curve and pressure decline for this type of fracture (Figure 5), the G-function superposition derivative GdP/dG continuously fluctuates up and down during the shut-in period, showing multiple convex features. Each characteristic convex feature indicates the closure of a certain number of fractures of a similar scale, presenting multiple closure points.
Figure 5.
Complex seam and corresponding G-function image. (a) Complex seam; (b) The corresponding G-function image.
Due to the well-developed cleats and fractures in deep coal rocks, ultra-large-scale hydraulic fracturing may form fracture networks of varying complexity. The shut-in pressure decline curves and G-function characteristics corresponding to fractures of different complexities vary significantly, potentially leading to differences in closure stress. To investigate the closure pressure characteristics of fractures with different complexities, numerical simulations of shut-in pressure decline for multiple types of natural fracture networks were conducted.
3. Numerical Simulation of Shut-In Pressure Decline for Natural Fracture Networks of Different Complexity
3.1. Model Setup
Based on the characteristics of the deep No. 8 coal reservoir in the Daning–Jixian area, numerical simulations of fracture propagation and shut-in under natural fracture conditions of different complexities were conducted using the finite element platform with the cohesive zone element method. The process of fracture initiation–propagation–shut-in–closure was simulated to explore the relationship between branch fracture closure pressure and horizontal stress.
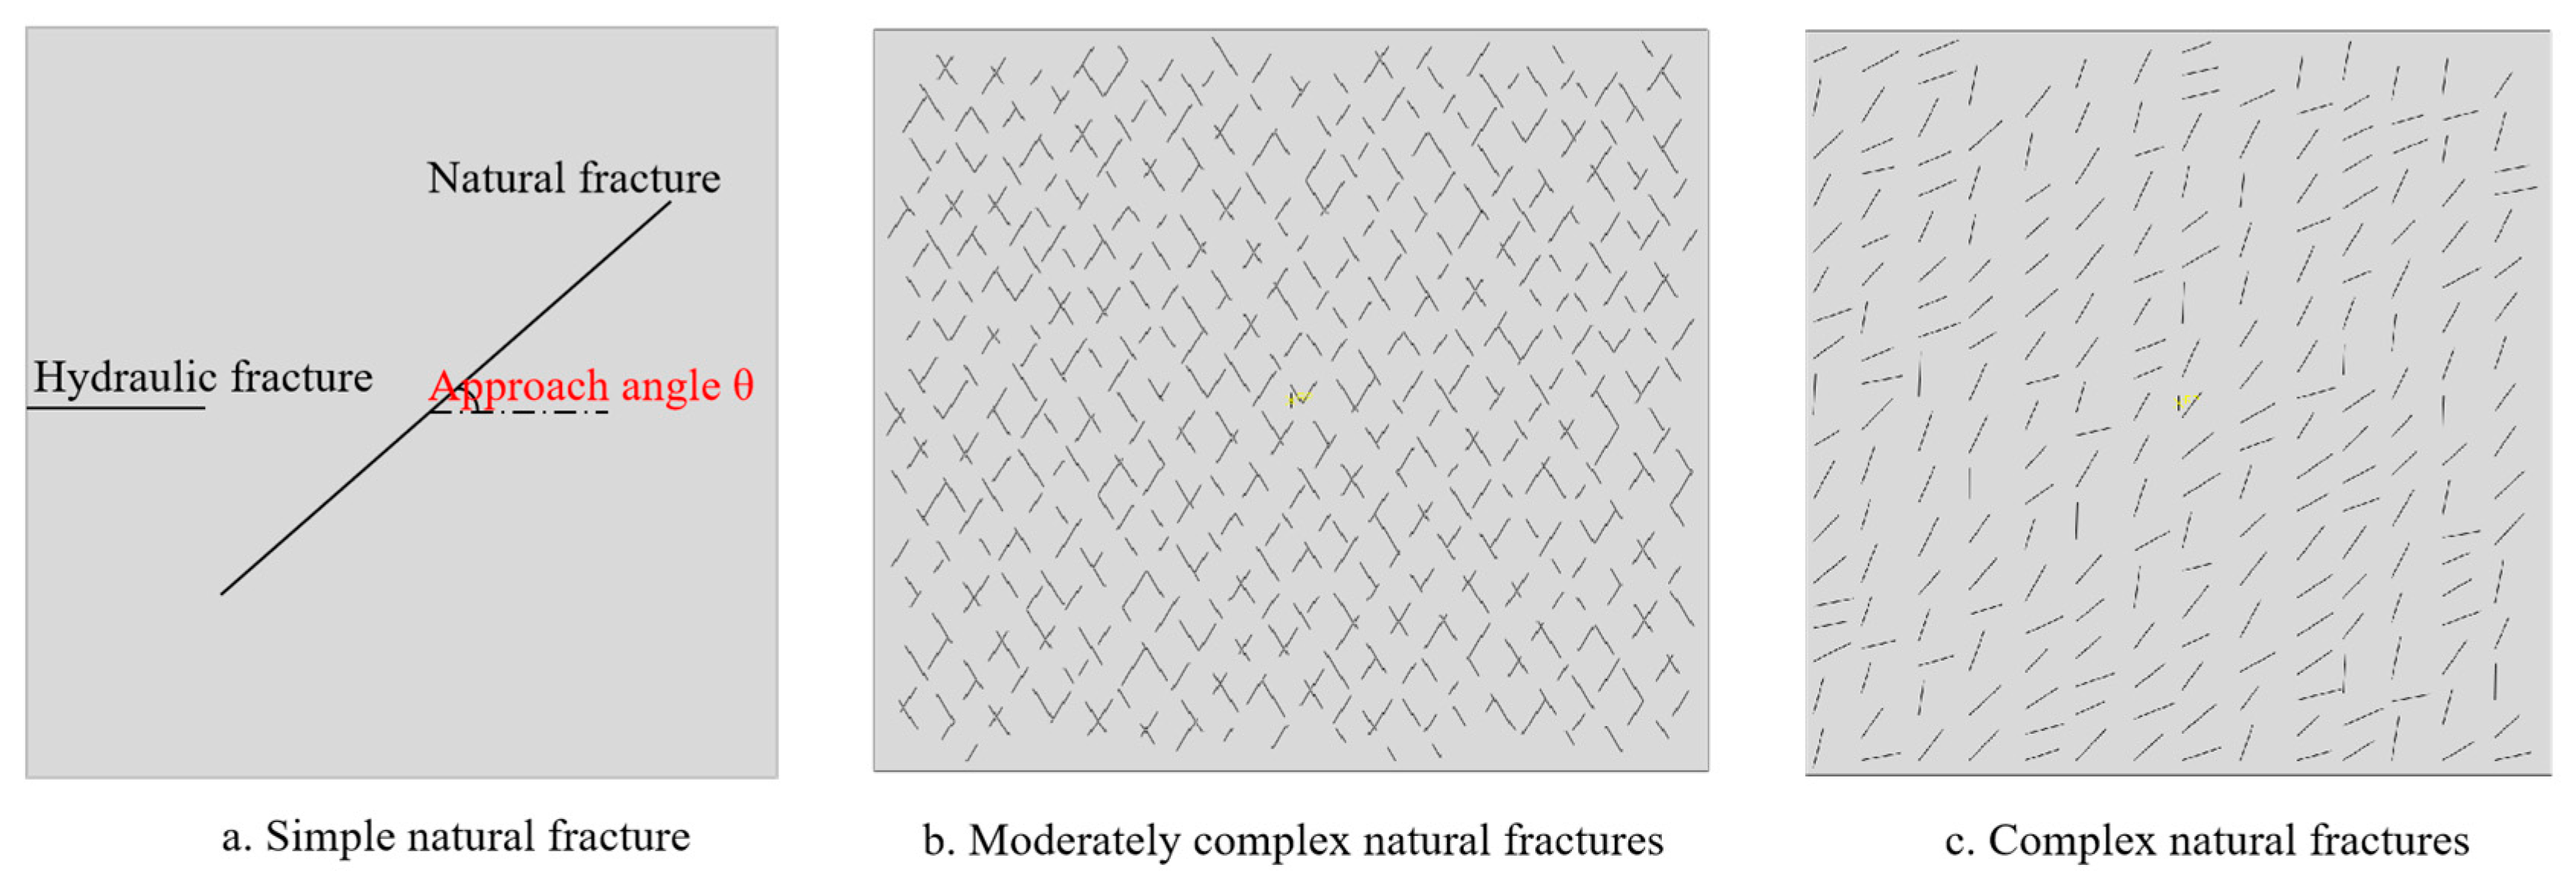
This section conducts numerical simulations of shut-in pressure decline in complex fracture networks for three distinct fracture geometries. A three-dimensional model can more realistically represent the propagation behavior of fractures in three-dimensional space, particularly in describing fracture height growth, interactions with bedding planes, and the three-dimensional effects of stress shadows. However, constructing a 3D model also comes with significant challenges, such as extremely high computational resource consumption, complex model setup, lengthy solution times, and stringent requirements for the accuracy and completeness of input parameters. Therefore, 3D models are not the most efficient first choice. We opted for a 2D model, whose core advantages lie in its computational simplicity and efficiency, facilitating in-depth analysis and iteration. The 2D model simplifies complex 3D problems into planar problems, leading to an order-of-magnitude reduction in computational grids and variables. It also provides a clearer and more intuitive representation of interactions, such as those between hydraulic fractures and natural fractures. A 50 m × 50 m two-dimensional plane strain finite element model is established. A simple natural fracture interaction is simulated by predefining a single hydraulic fracture horizontally and a natural fracture vertically with a dip angle θ relative to the hydraulic fracture, assuming all natural fractures in the reservoir are vertical, as shown in Figure 6a. For moderately complex natural fractures, cohesive elements are globally embedded with orthogonal partitioning to characterize homogeneous natural fractures, as illustrated in Figure 6b. For complex natural fractures, random partitioning is employed to represent natural fractures with varying angles, as depicted in Figure 6c.
Figure 6.
Natural fracture networks with different complexities.
To ensure computational accuracy and efficiency, the model employs a refined mesh around the predefined and potential fracture paths. The typical element size in the fracture region is approximately 0.1 m. The simulation uses an implicit time integration scheme with an automatic time-stepping algorithm, where the initial time step is set to 0.01 s and can adapt based on solution convergence.
3.2. Model Parameters
3.2.1. Boundary Conditions
① Seepage boundary condition: Set a pore pressure boundary to simulate the effective stress conditions of the reservoir, with zero seepage velocity.
② Displacement boundary condition: Constrain both horizontal and vertical displacements to zero.
③ Initial conditions: Based on field measured parameters, set the initial porosity to 0.02.
3.2.2. Basic Mechanical Parameters
The reservoir property parameters in the model are based on average field data from the Daning–Jixian block, and the rock mechanical parameters are derived from laboratory experimental data, as shown in Table 1.
Table 1.
Basic parameters of numerical simulation.
3.3. Simulation Results
3.3.1. Simple Natural Fractures
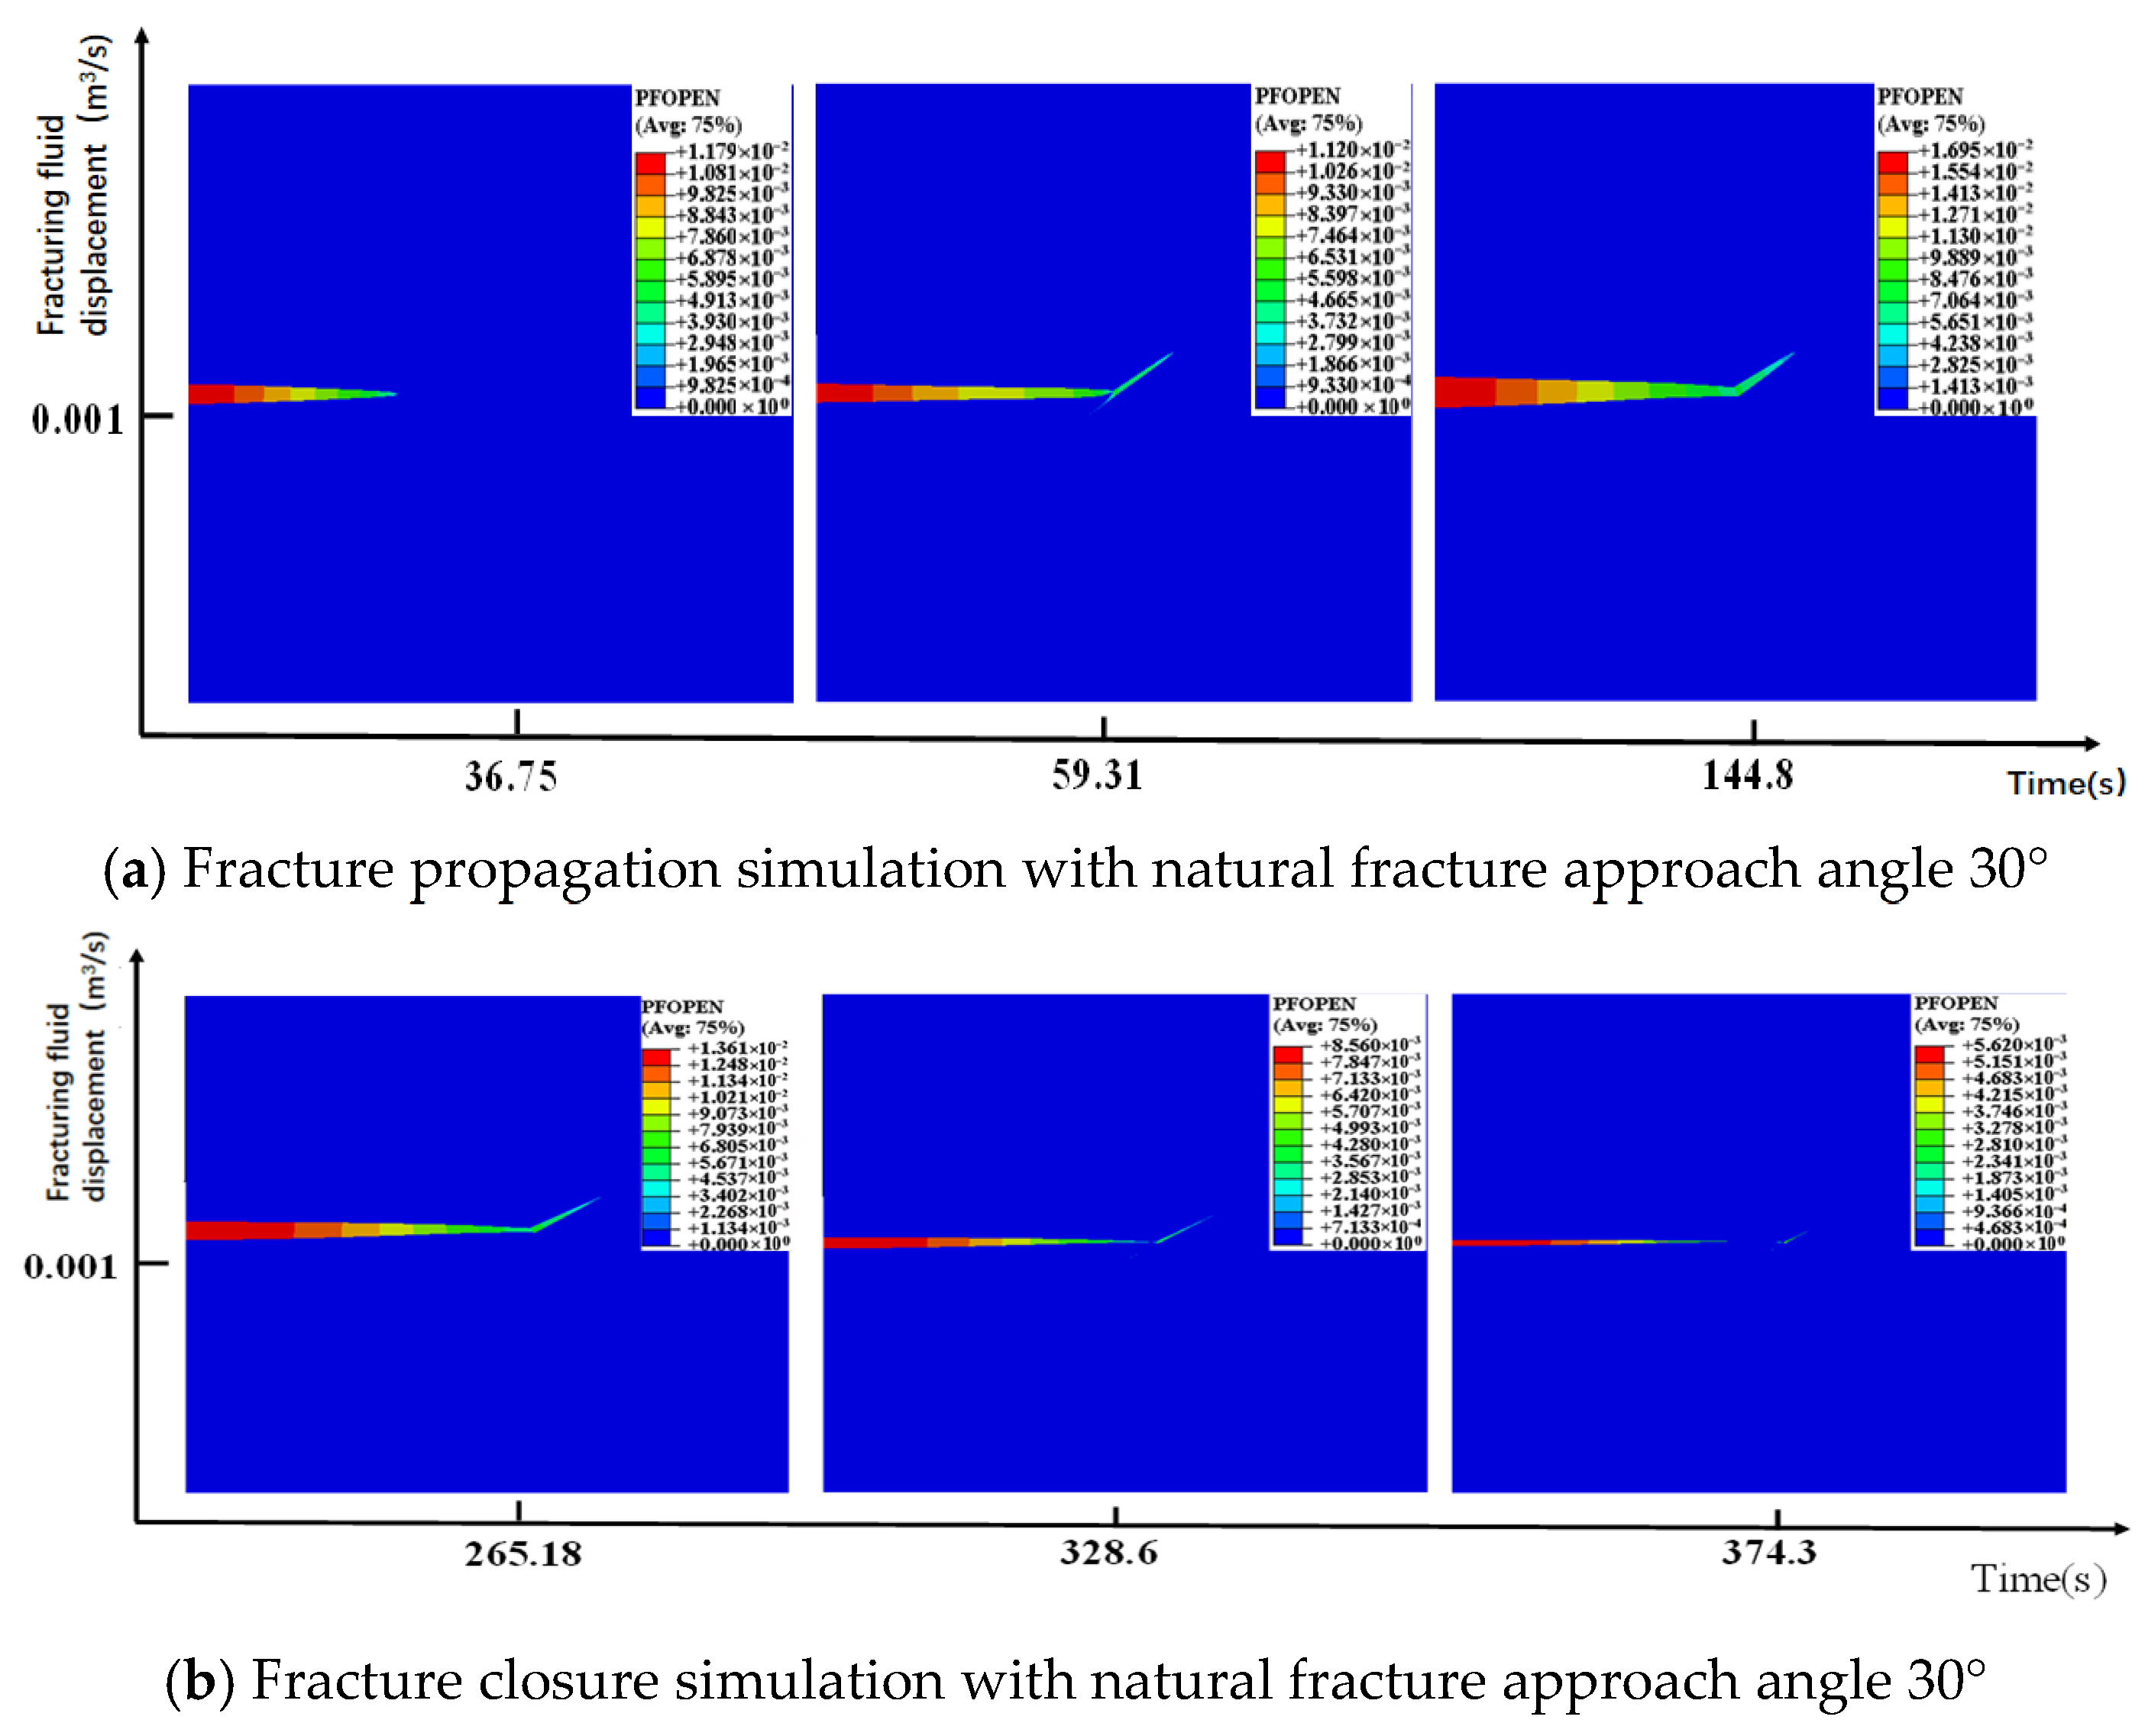
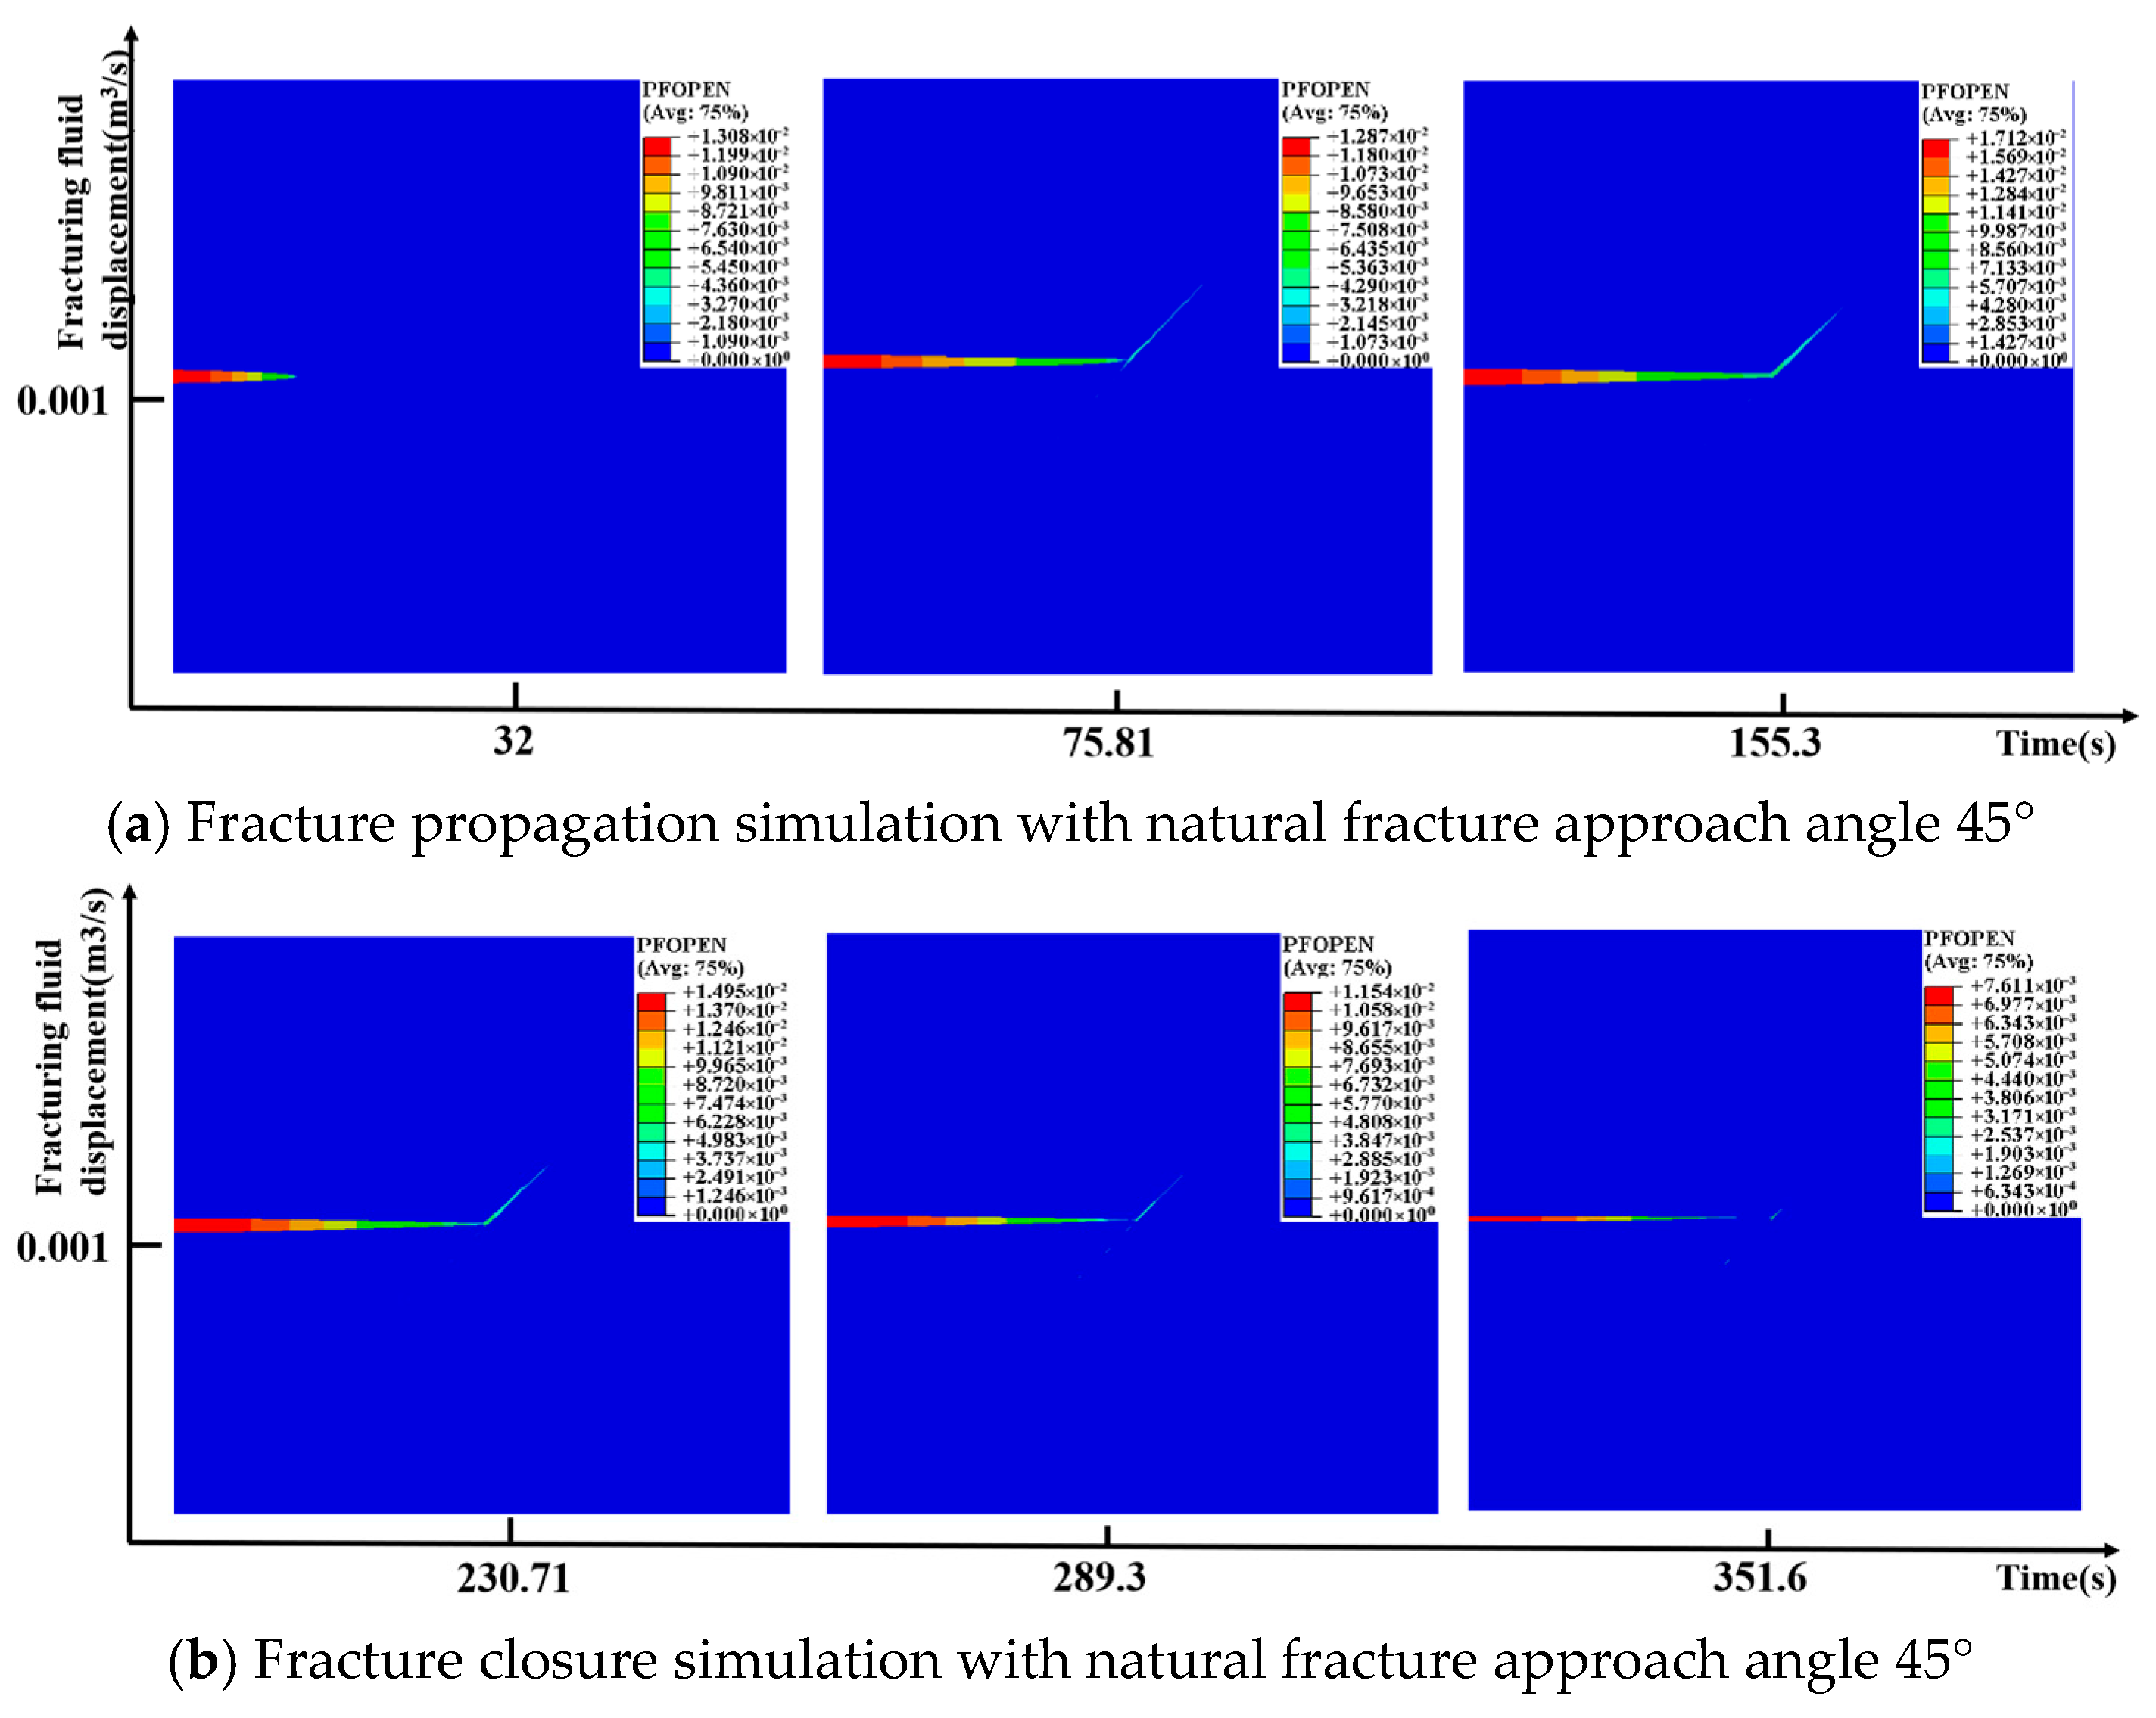
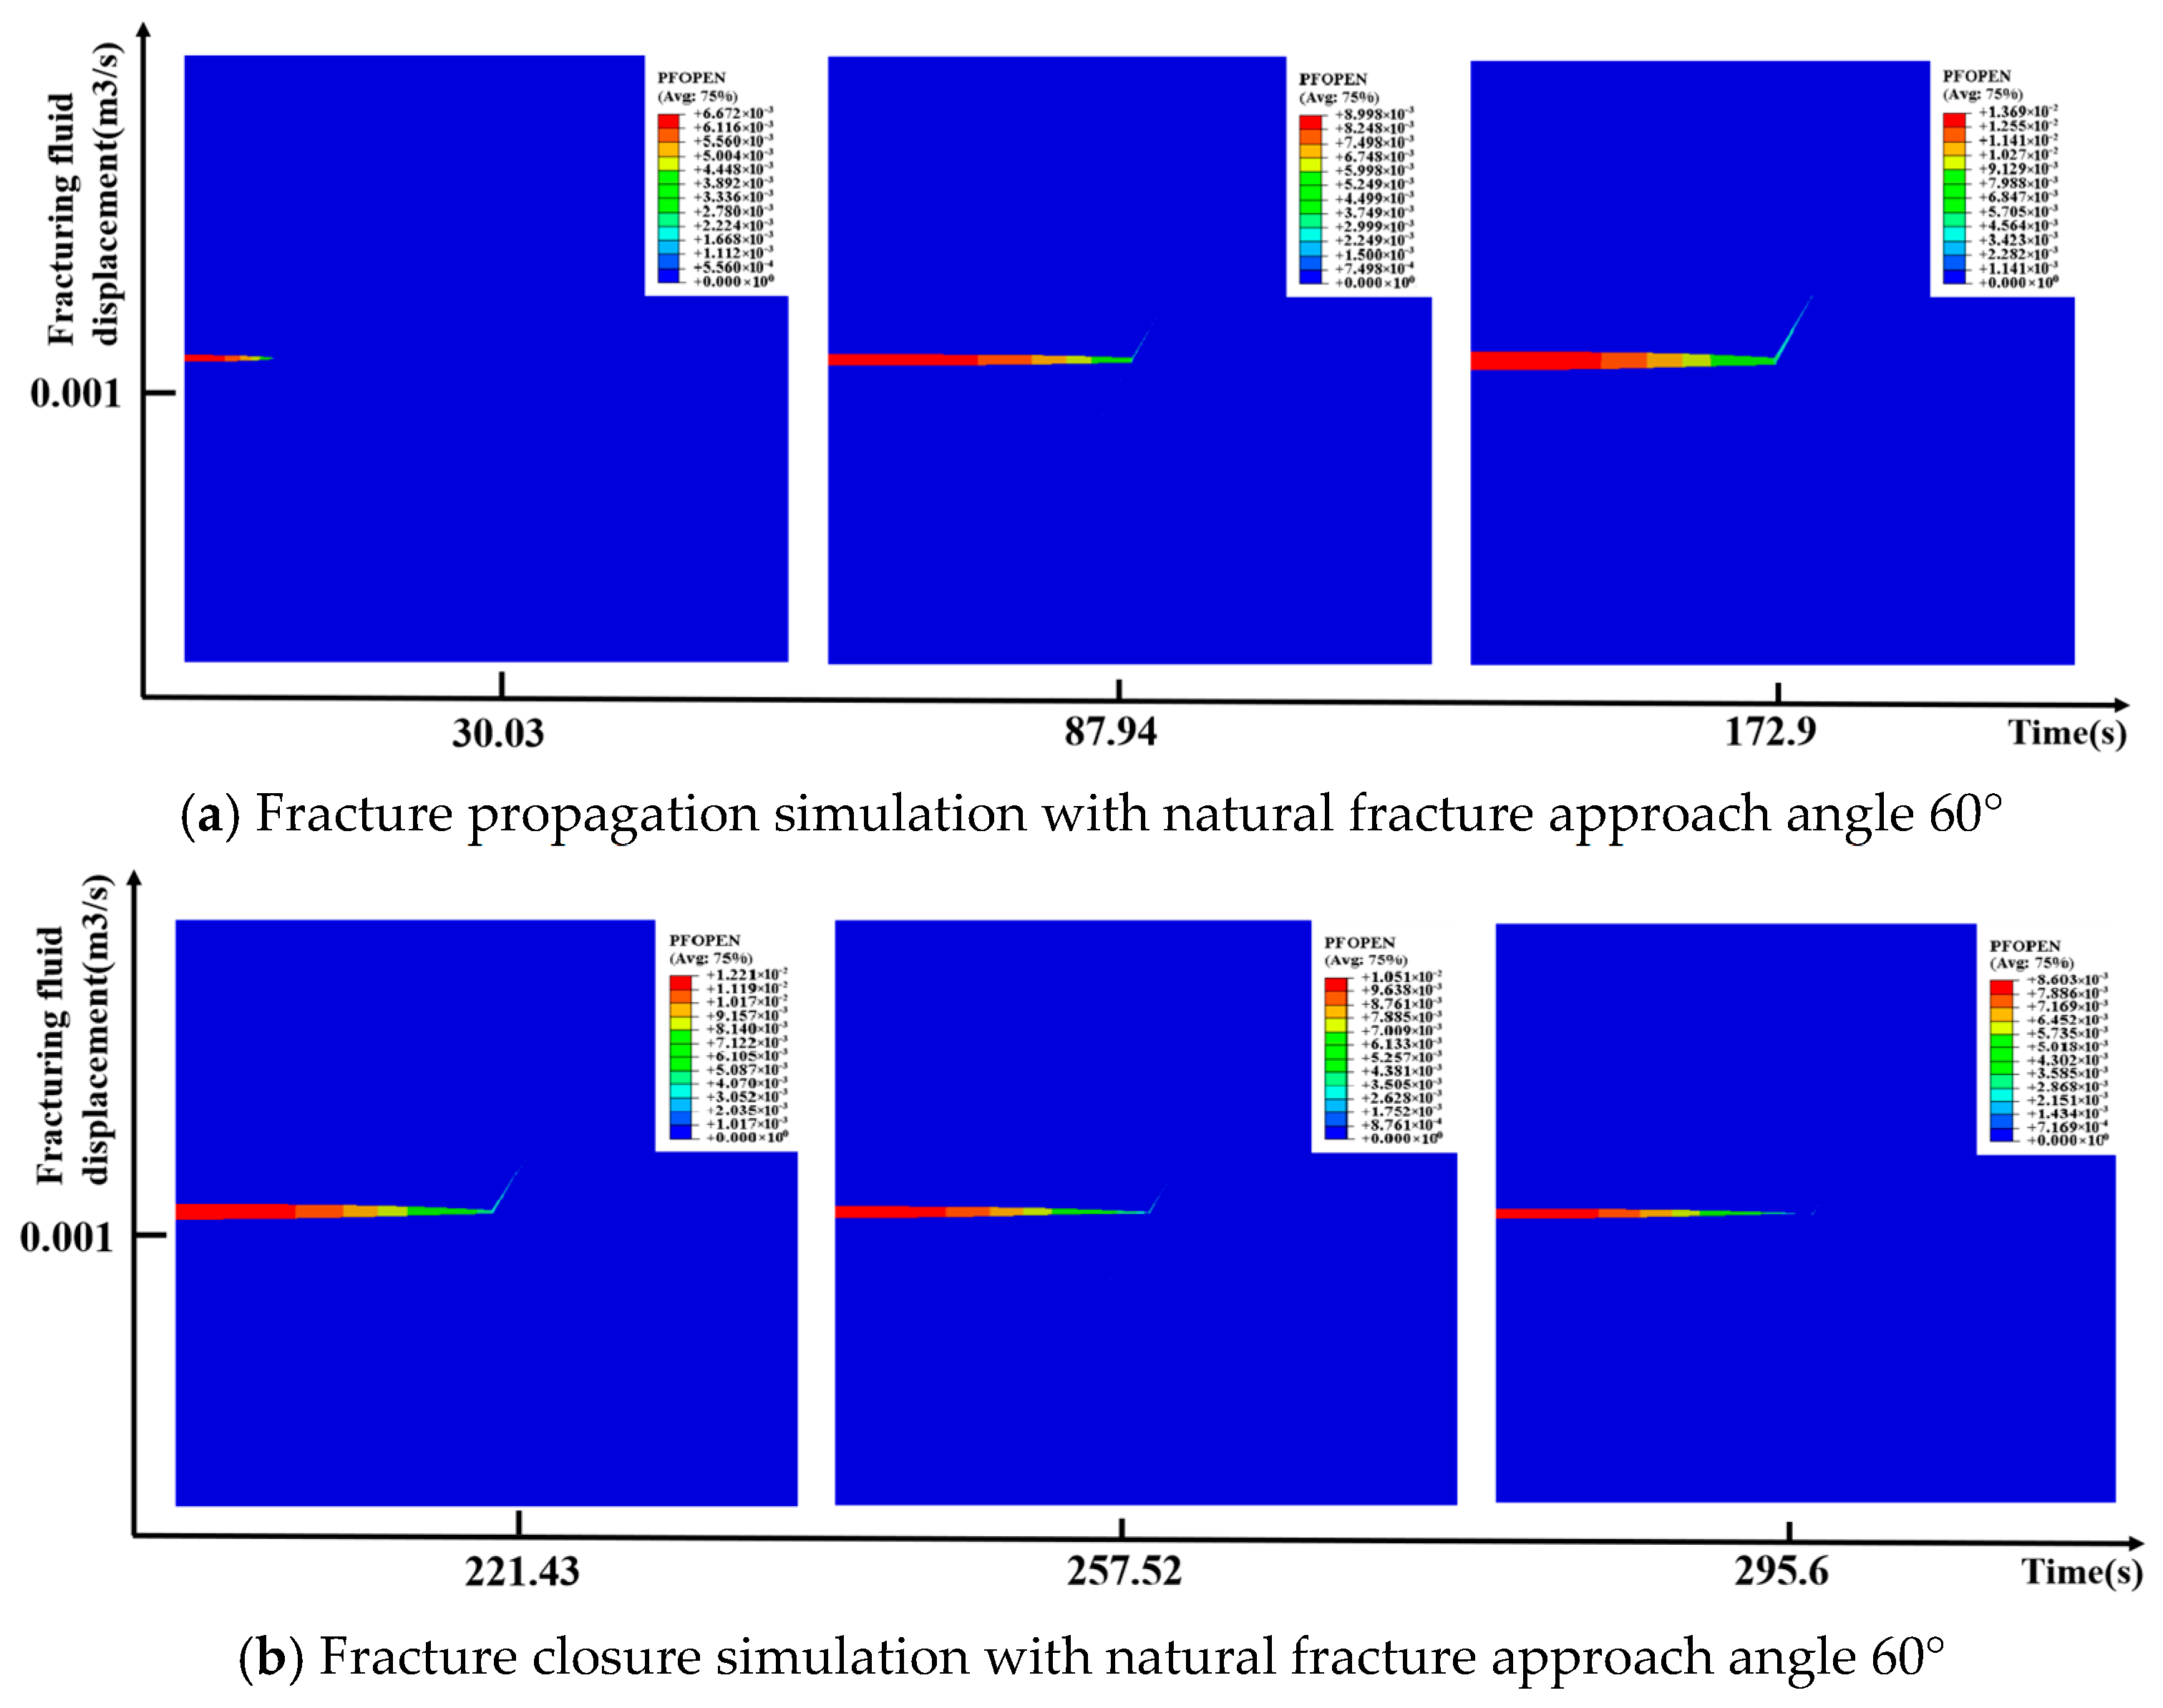
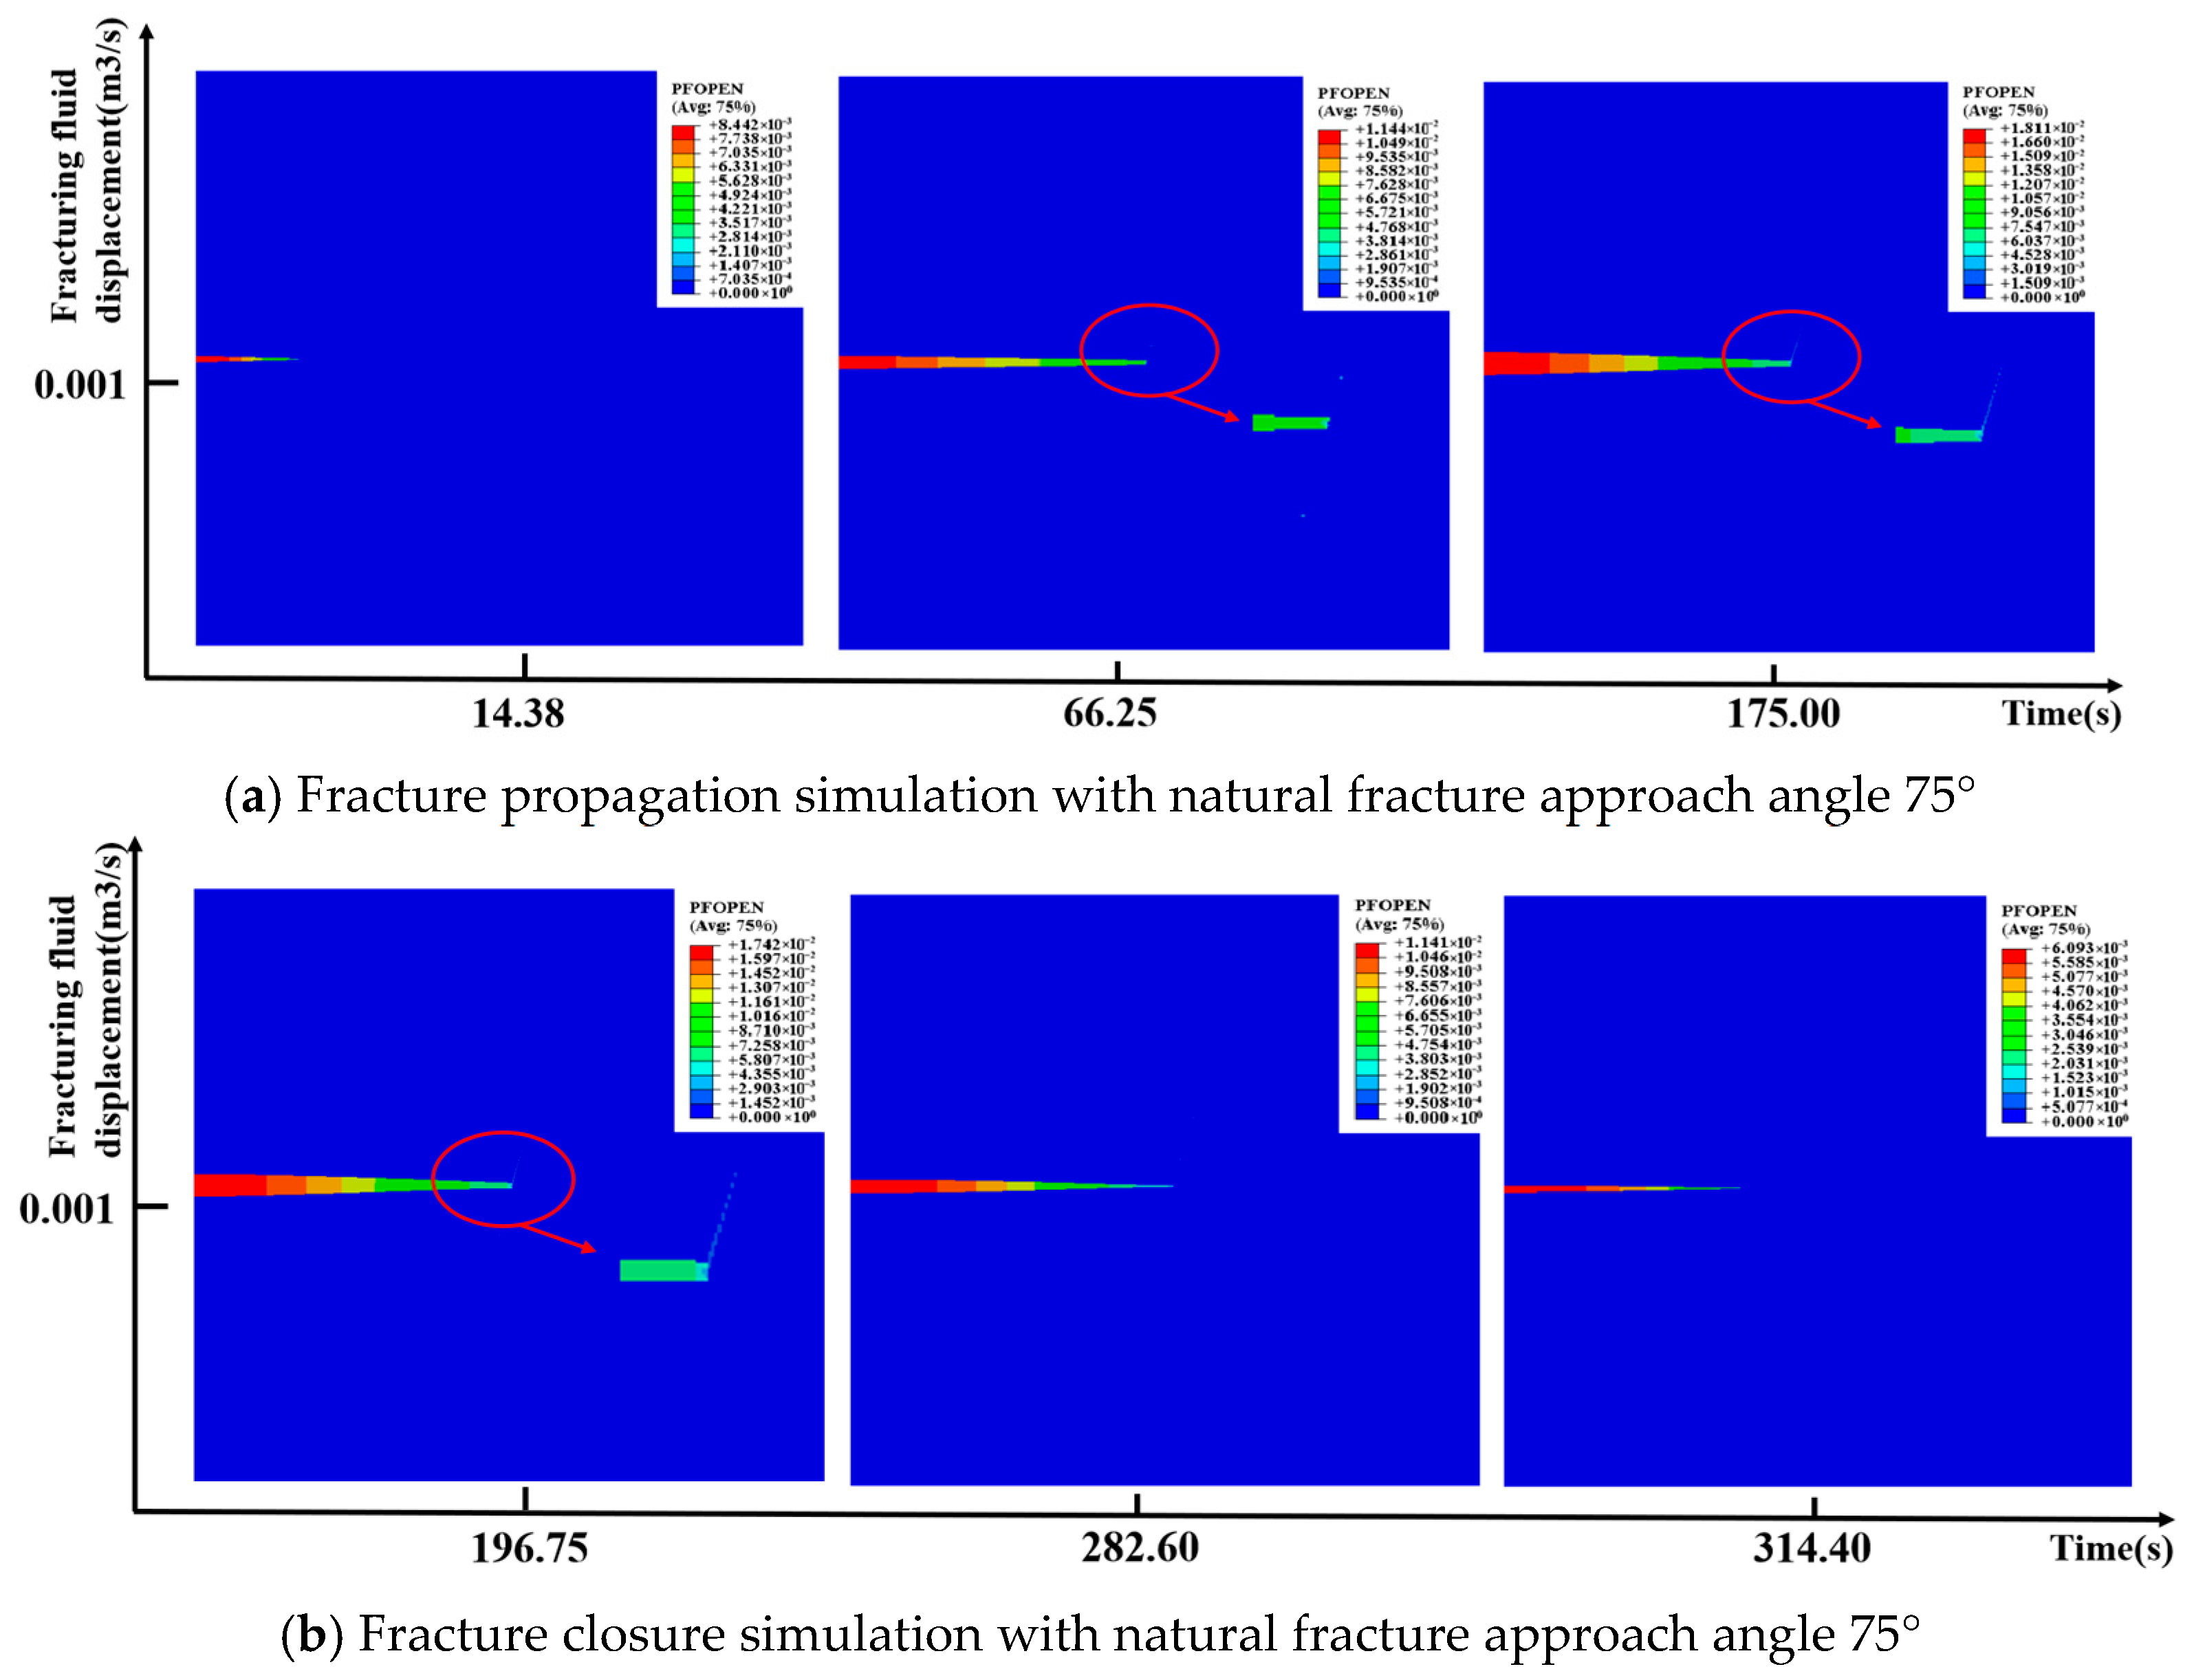
To study the relationship between closure pressure and in situ stress for simple natural fractures with different approach angles, numerical simulations were conducted on models with natural fractures interacting with hydraulic fractures at approach angles of 30°, 45°, 60°, and 75°. The simulation results are shown in Figure 7, Figure 8, Figure 9 and Figure 10. The results indicate that when the natural fracture approach angle is 30°, a smaller approach angle results in lower shear stress at the intersection of the hydraulic and natural fractures, reducing the resistance to fracture propagation. The hydraulic fracture tends to propagate along the natural fracture, forming a larger communication area. As the natural fracture approach angle gradually increases, the increased shear stress between fractures causes the hydraulic fracture to tend to penetrate the natural fracture rather than propagate along it, thus reducing the scale of fracture communication. Simulation results of the shut-in unloading process show that natural fractures close before the hydraulic fracture, and the smaller the scale of the natural fracture, the shorter the closure time. This is because smaller-scale natural fractures have higher closure pressures, causing them to close earlier after shut-in. Simultaneously, as the approach angle increases, the scale of activated natural fractures decreases, and the required closure time also shortens accordingly.
Figure 7.
Fracture propagation and closure process with approaching angle of 30°.
Figure 8.
Fracture propagation and closure process with approaching angle of 45°.
Figure 9.
Fracture propagation and closure process with approaching angle of 60°.
Figure 10.
Approximation angle 75° fracture propagation and closure process.
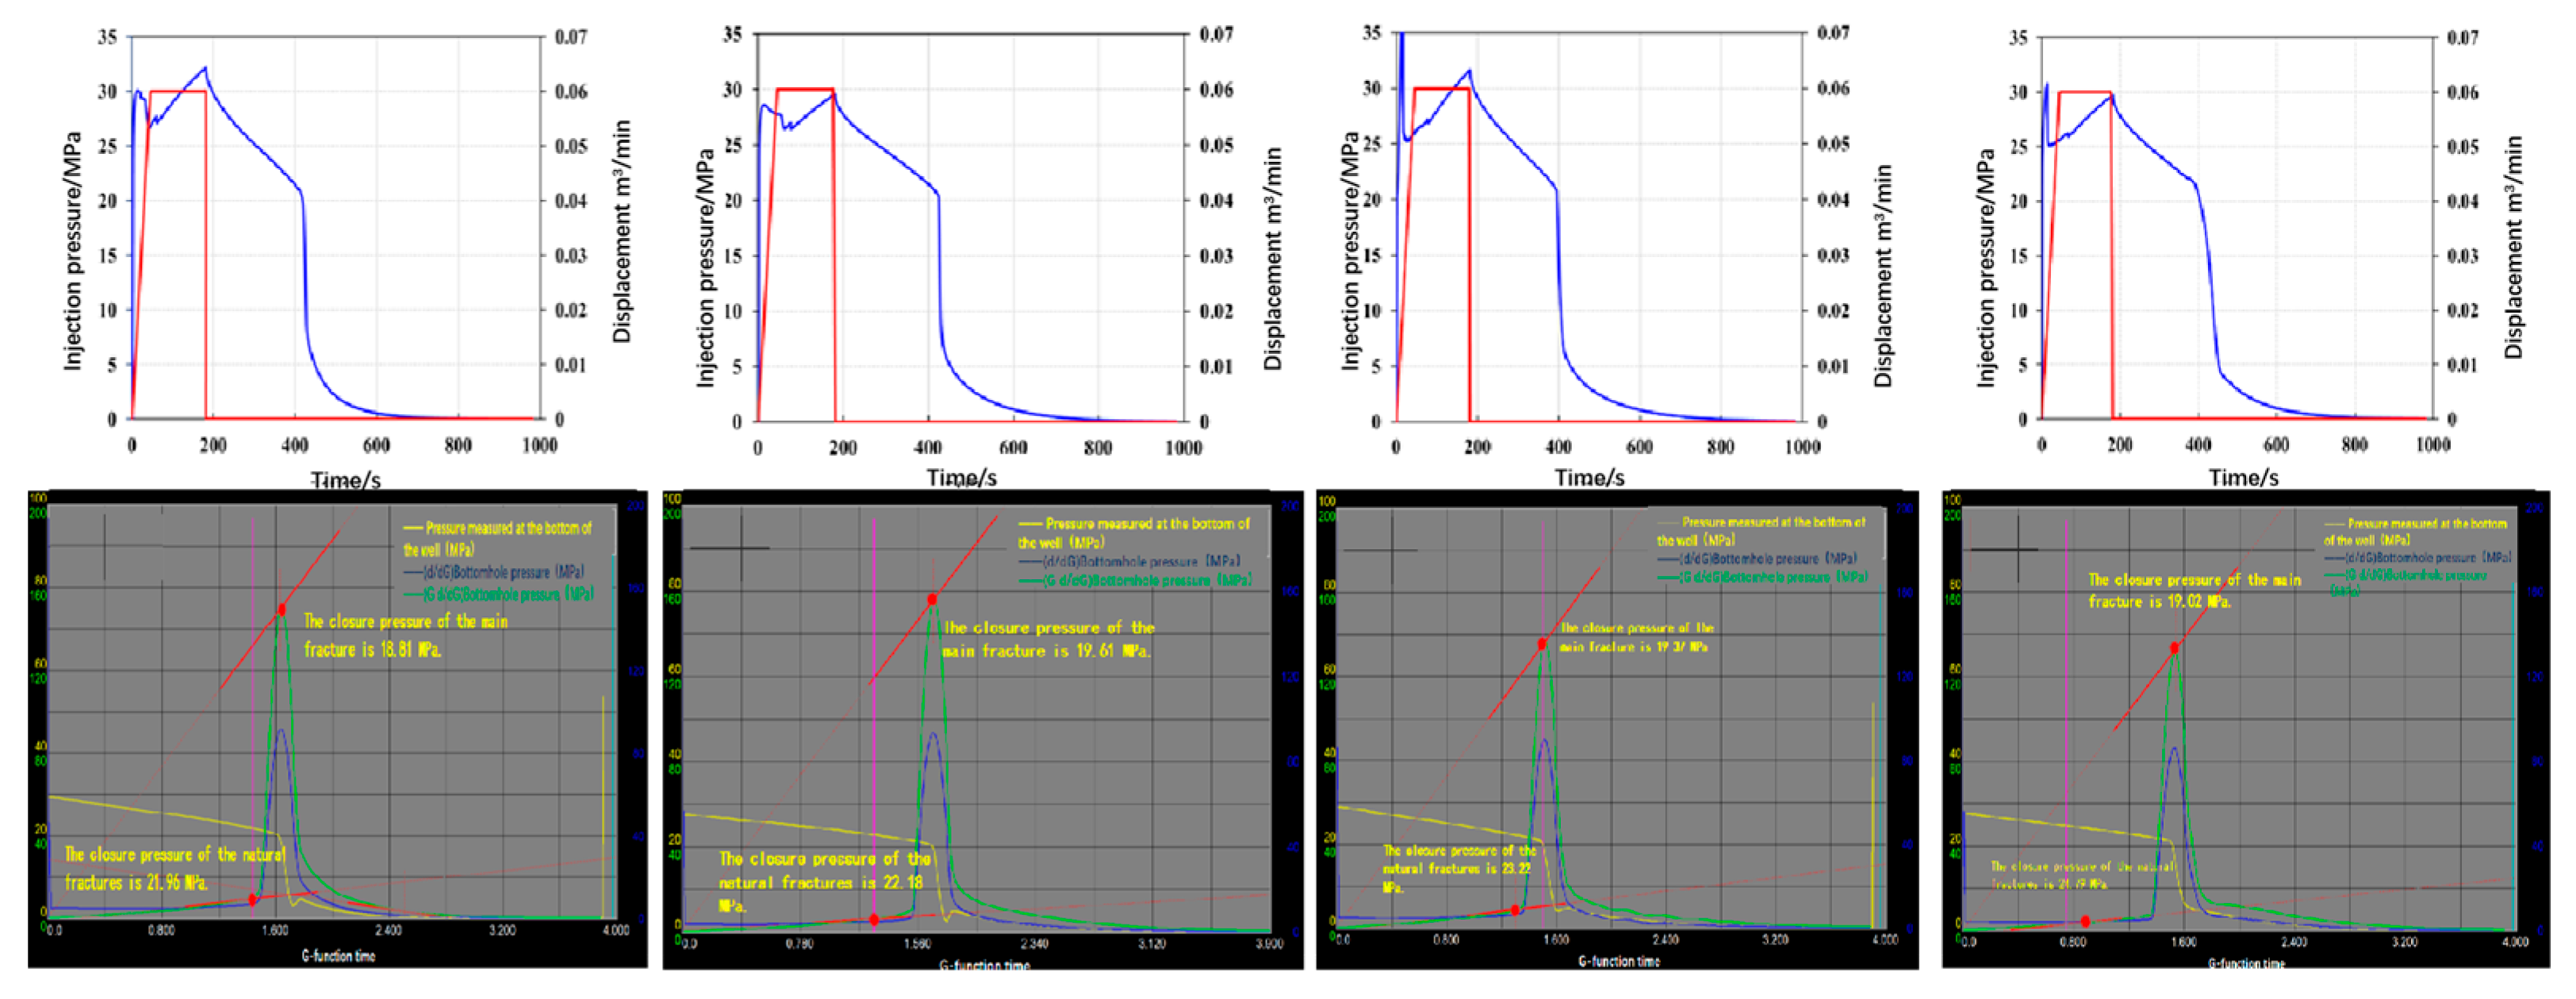
Analysis of the simulated shut-in pressure decline curves for simple fractures (Figure 11) using the G-function revealed that when injection time, flow rate, and in situ stress magnitude remain constant, only changing the approach angle, the closure time of the main fracture (hydraulic fracture) is nearly consistent, and the obtained closure pressure is the minimum horizontal effective stress. The closure pressures corresponding to natural fractures at approach angles of 30°, 45°, 60°, and 75° are 21.96 MPa, 22.18 MPa, 23.22 MPa, and 24.79 MPa, respectively. This means that the closure pressure of natural fractures at different angles increases with the increasing approach angle, increasingly approaching the maximum horizontal effective stress (25 MPa). At an approach angle of 75°, the difference from the maximum horizontal effective stress is only about 0.21 MPa, very close to the maximum effective stress.
Figure 11.
The pressure drop injection curve and G-function curve of simple fracture stopping pump.
3.3.2. Moderately Complex Natural Fractures
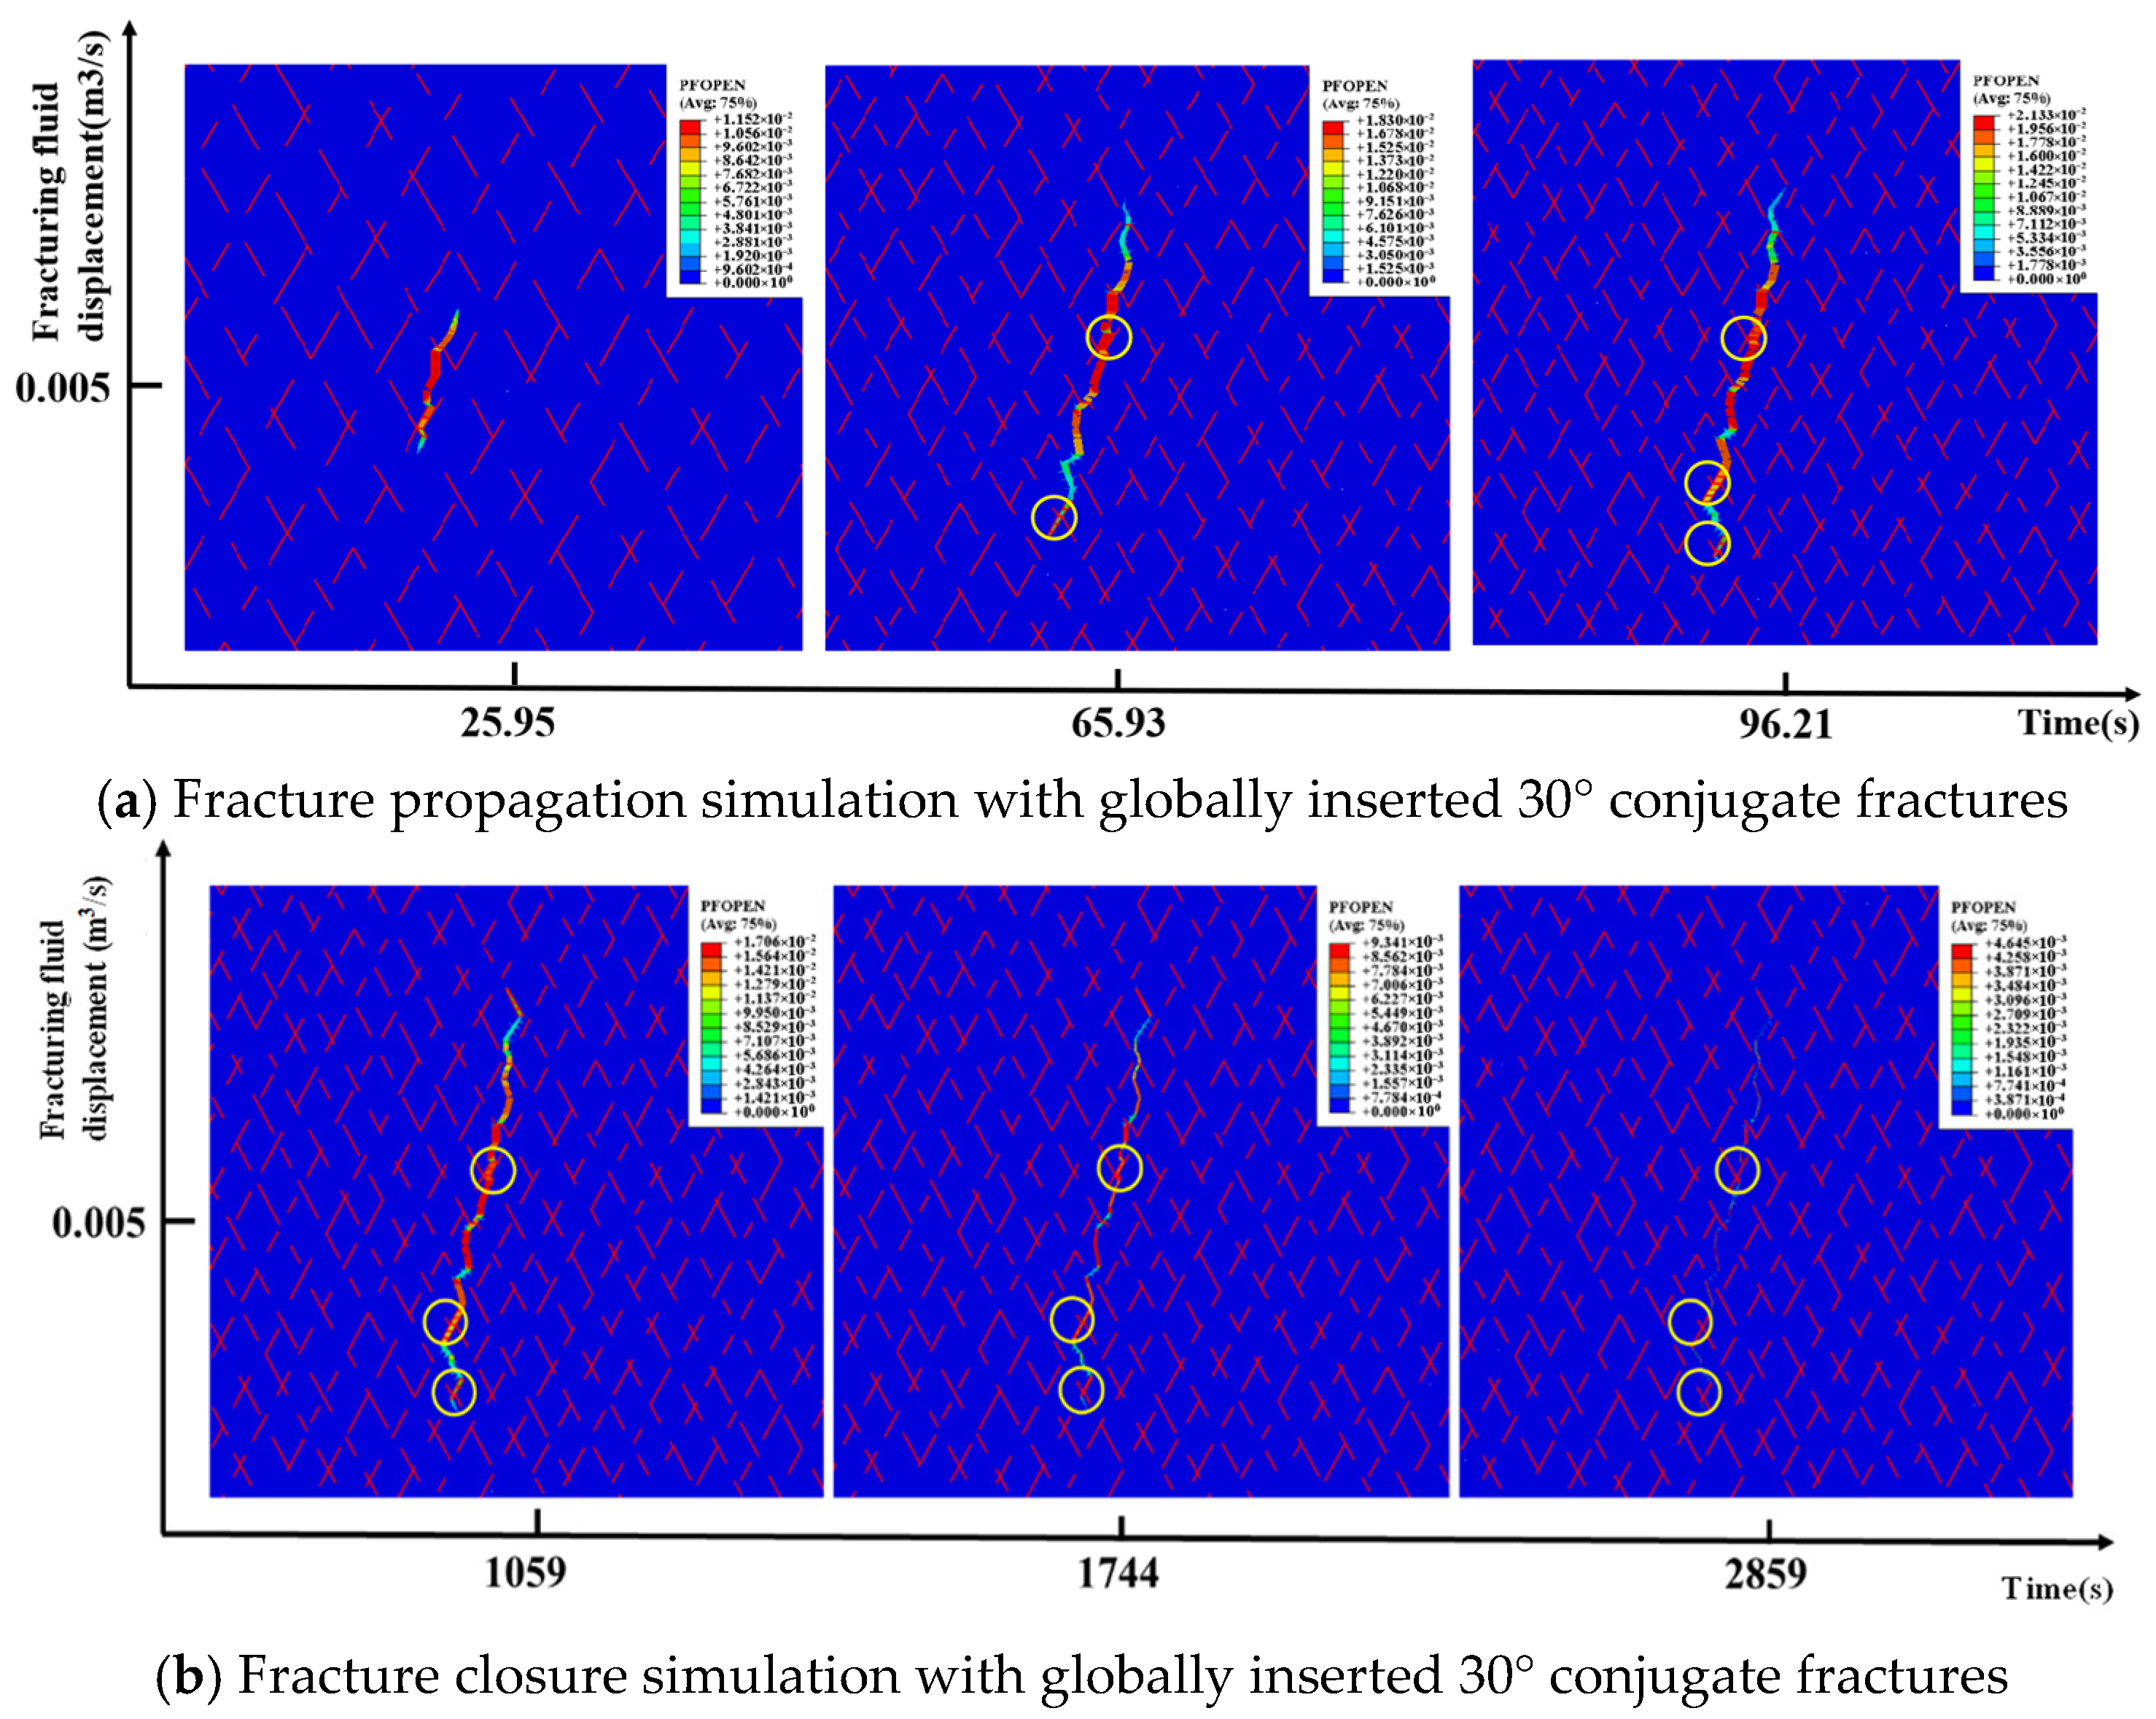
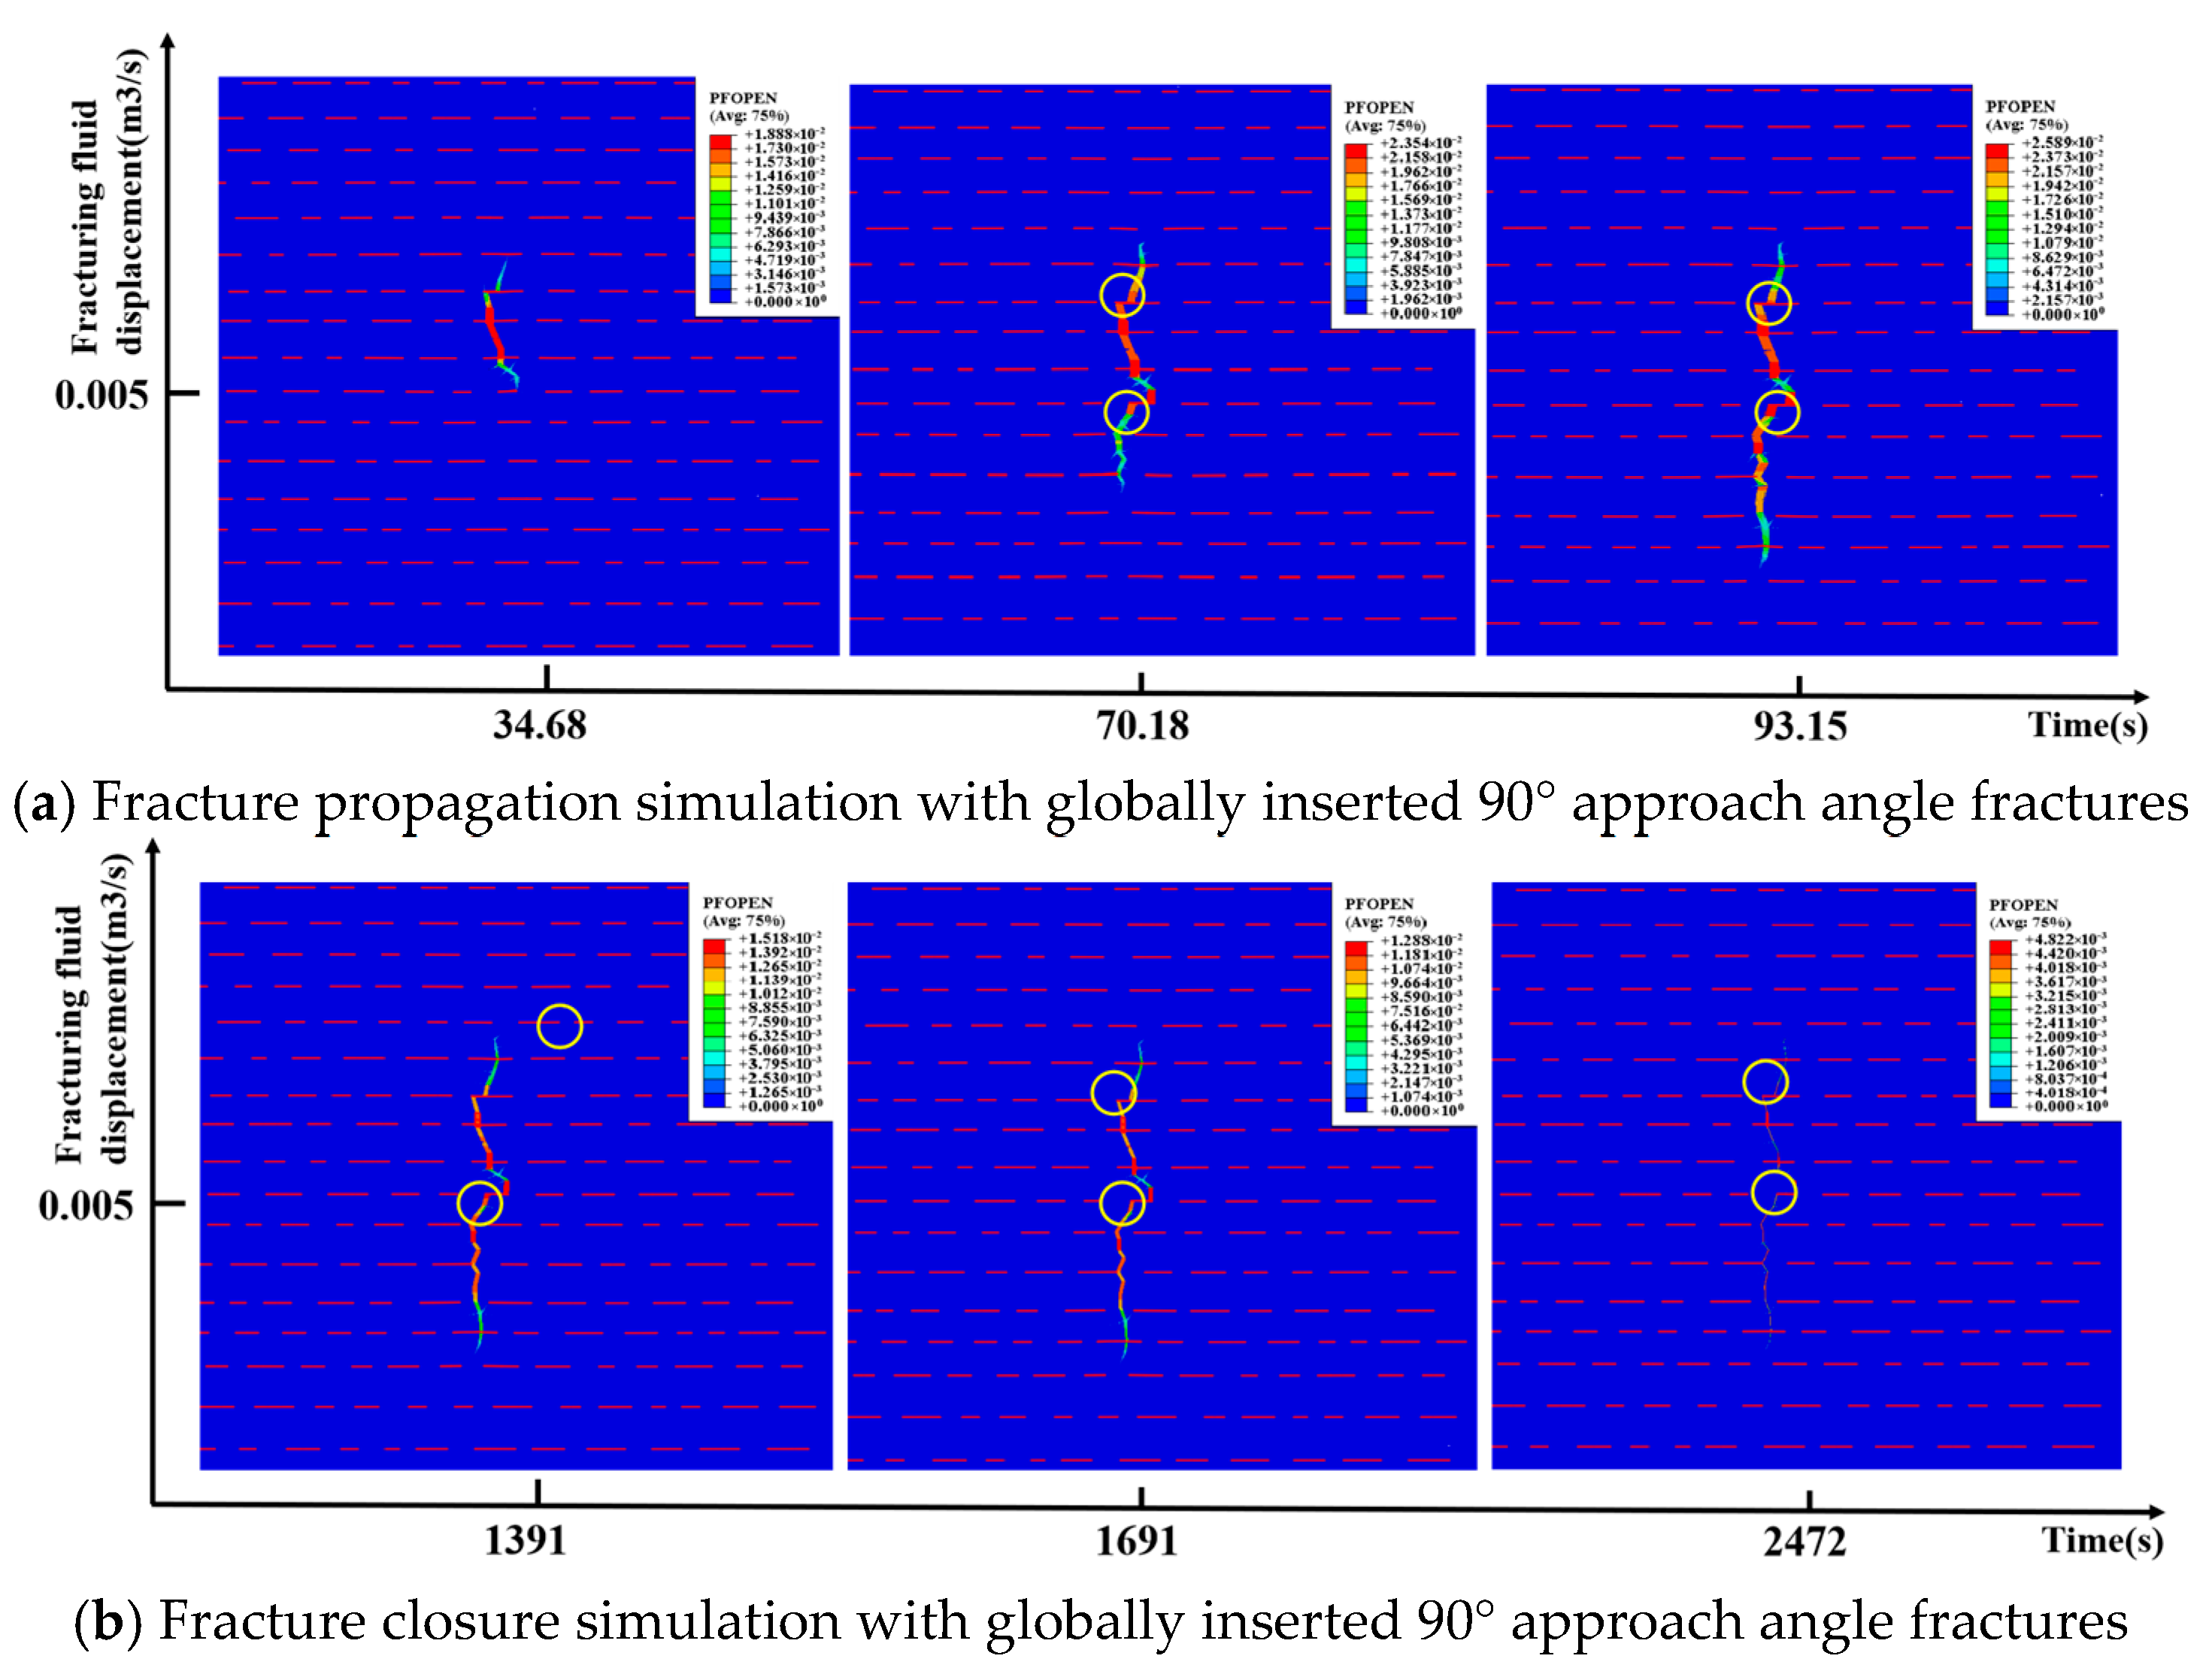
To study the relationship between closure pressure and in situ stress for moderately complex fractures under different approach angles, numerical models with globally inserted conjugate natural fractures at approach angles of 30° (Figure 12), 60° (Figure 13), and 90° (Figure 14) were established for simulation [22]. The results show that as the approach angle increases, the geometric morphology of the natural fractures and the propagation path of the hydraulic fracture change. At an approach angle of 30°, the hydraulic fracture can propagate relatively smoothly along the extension direction of the natural fractures, resulting in a longer closure time for the natural fractures. At an approach angle of 90°, the propagation direction of the hydraulic fracture is more perpendicular to the natural fractures, restricting hydraulic fracture propagation, and the natural fractures close more quickly.
Figure 12.
Globally inserted 30° conjugate fracture propagation and closure process.
Figure 13.
Global insertion 60° conjugate fracture propagation and closure process.
Figure 14.
Global approximation angle insert 90° crack propagation and closure.
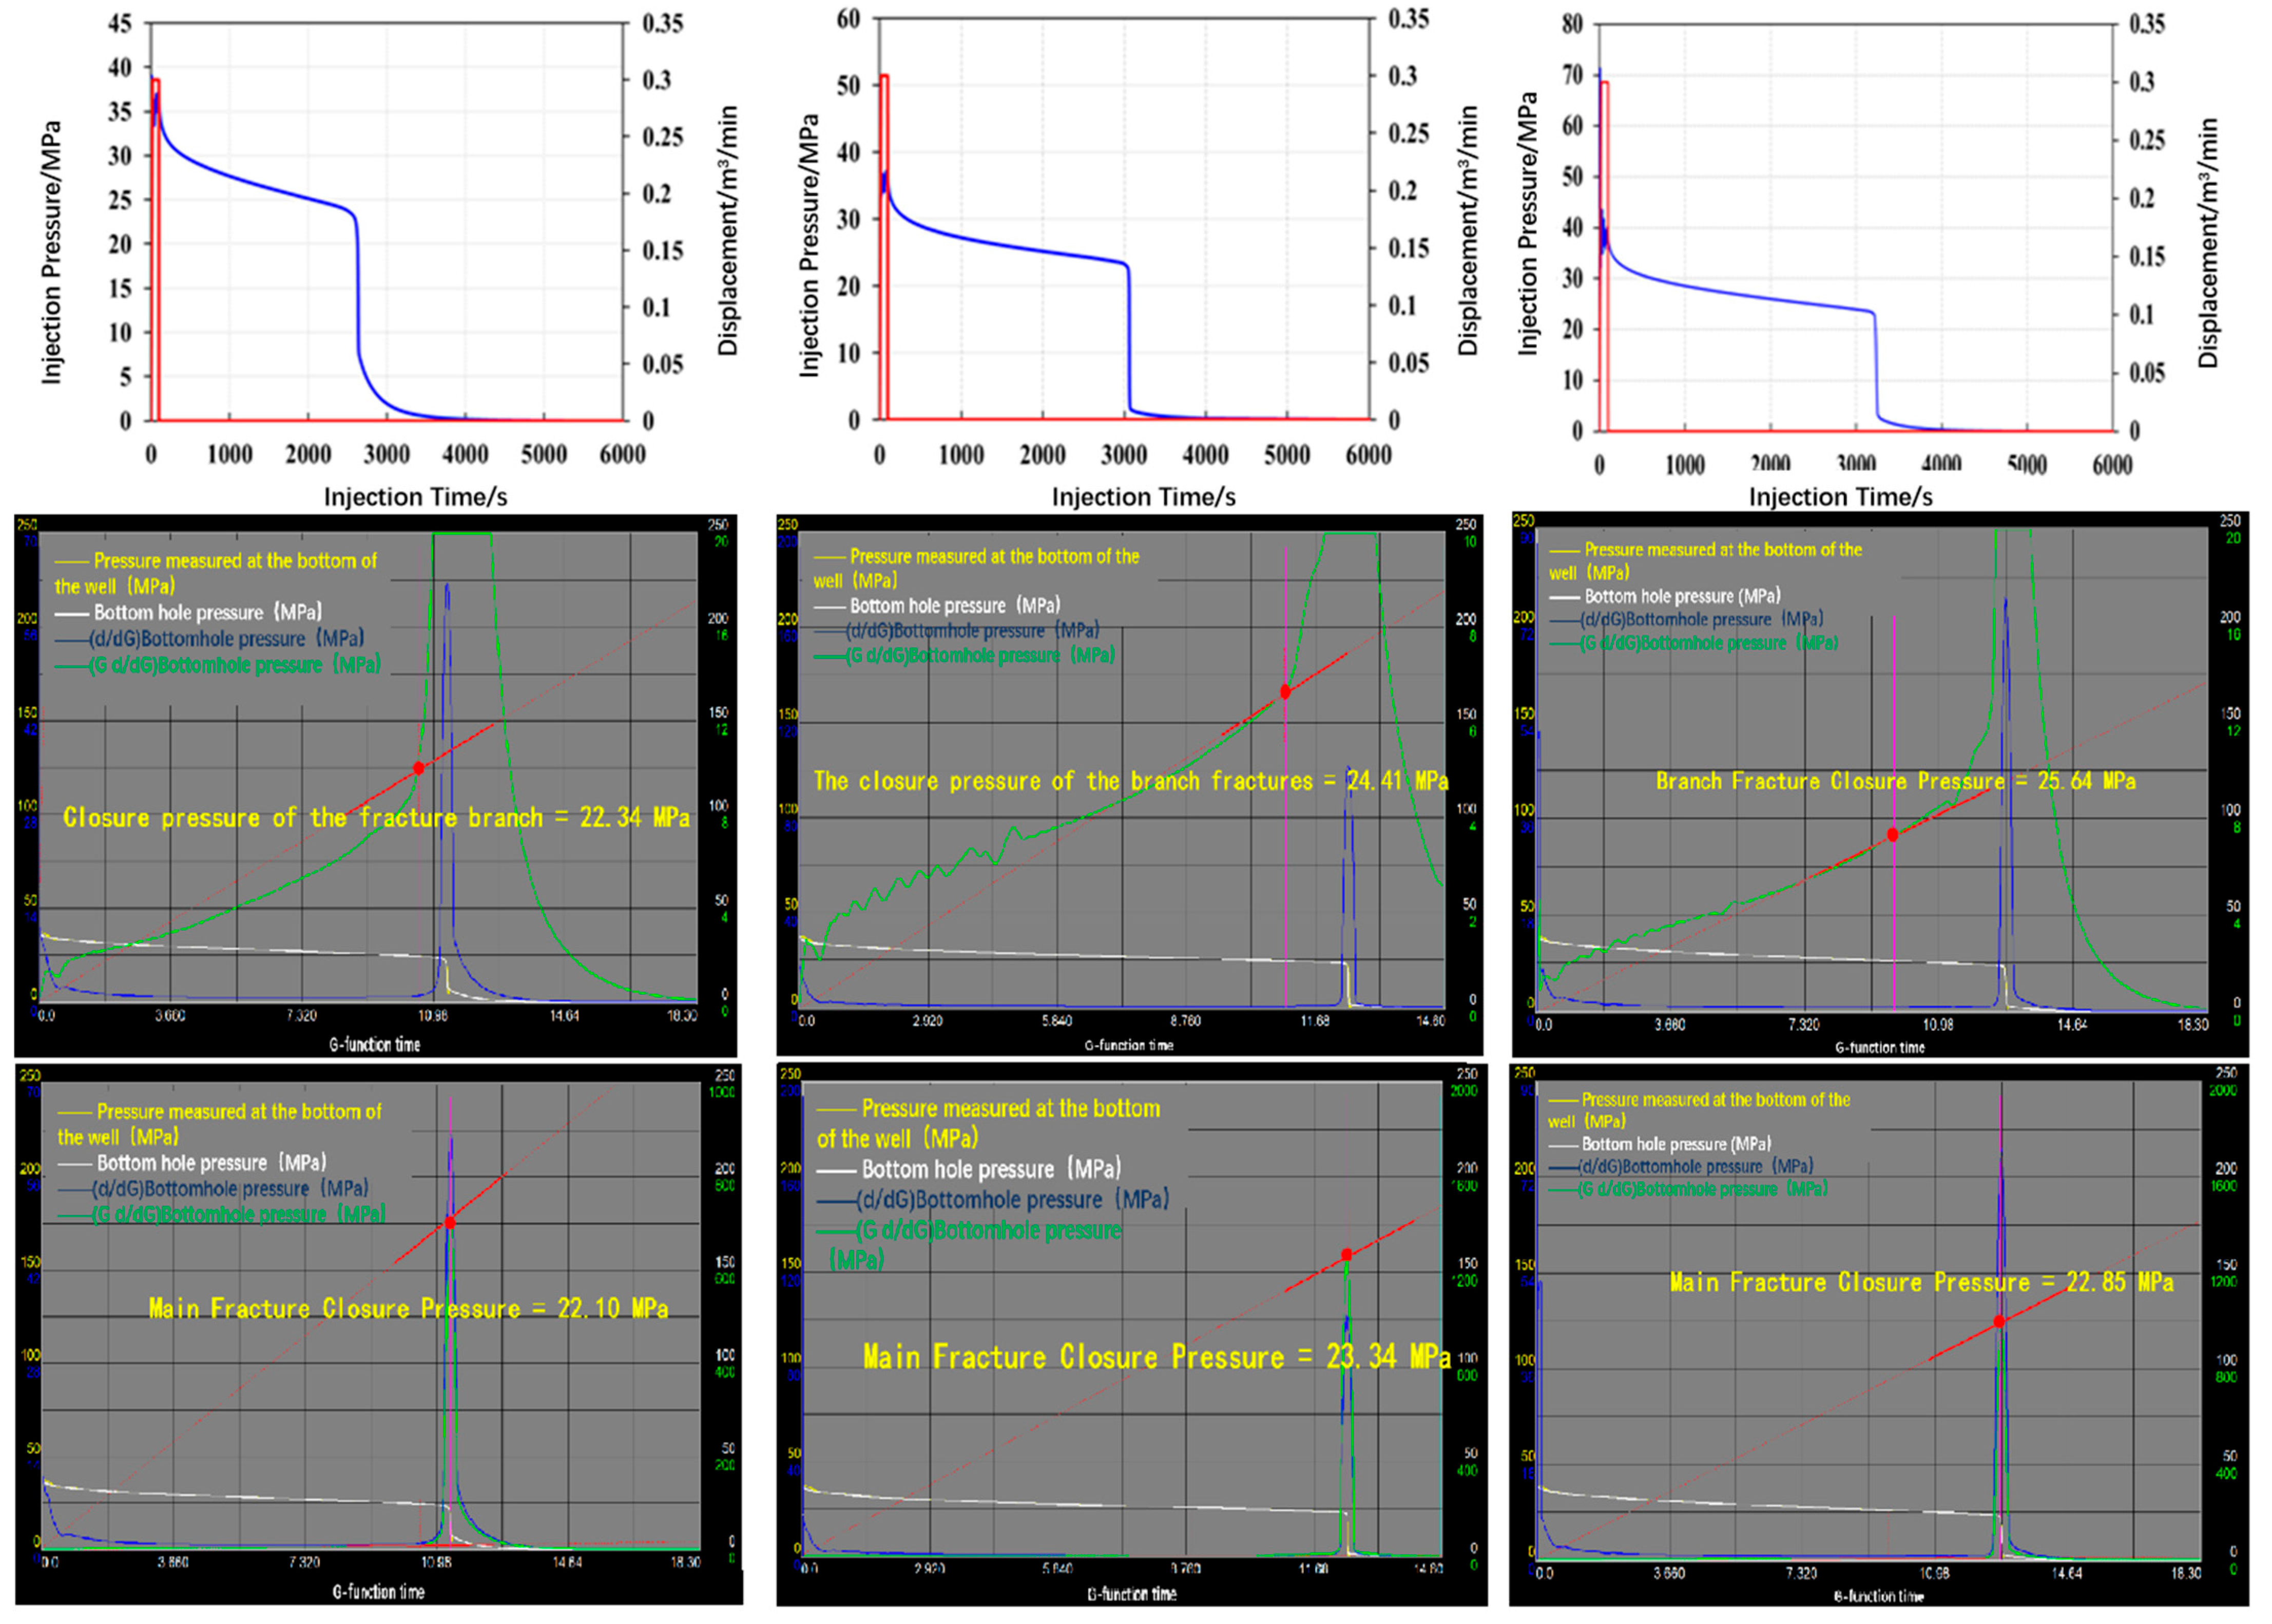
Analysis of the simulated shut-in pressure decline curves for moderately complex fractures using the G-function (Figure 15) revealed that when injection time, flow rate, and in situ stress magnitude remain constant, only changing the approach angle, the closure time of the main fracture (hydraulic fracture) is nearly consistent, and the obtained closure pressure is the minimum horizontal effective stress. Because the scale of the branch fractures connected during the hydraulic fracture propagation process is consistent, the branch fractures close simultaneously after shut-in, so only one natural fracture closure point can be identified. When the fracture approach angle is 60°, the identified closure pressure is 24.41 MPa, differing from the maximum horizontal effective stress by only 0.59 MPa, indicating that the closure pressure approaches the maximum horizontal effective stress.
Figure 15.
The pressure drop injection curve and G-function curve of the complex fracture-stopping pump are shown.
3.3.3. Complex Natural Fractures
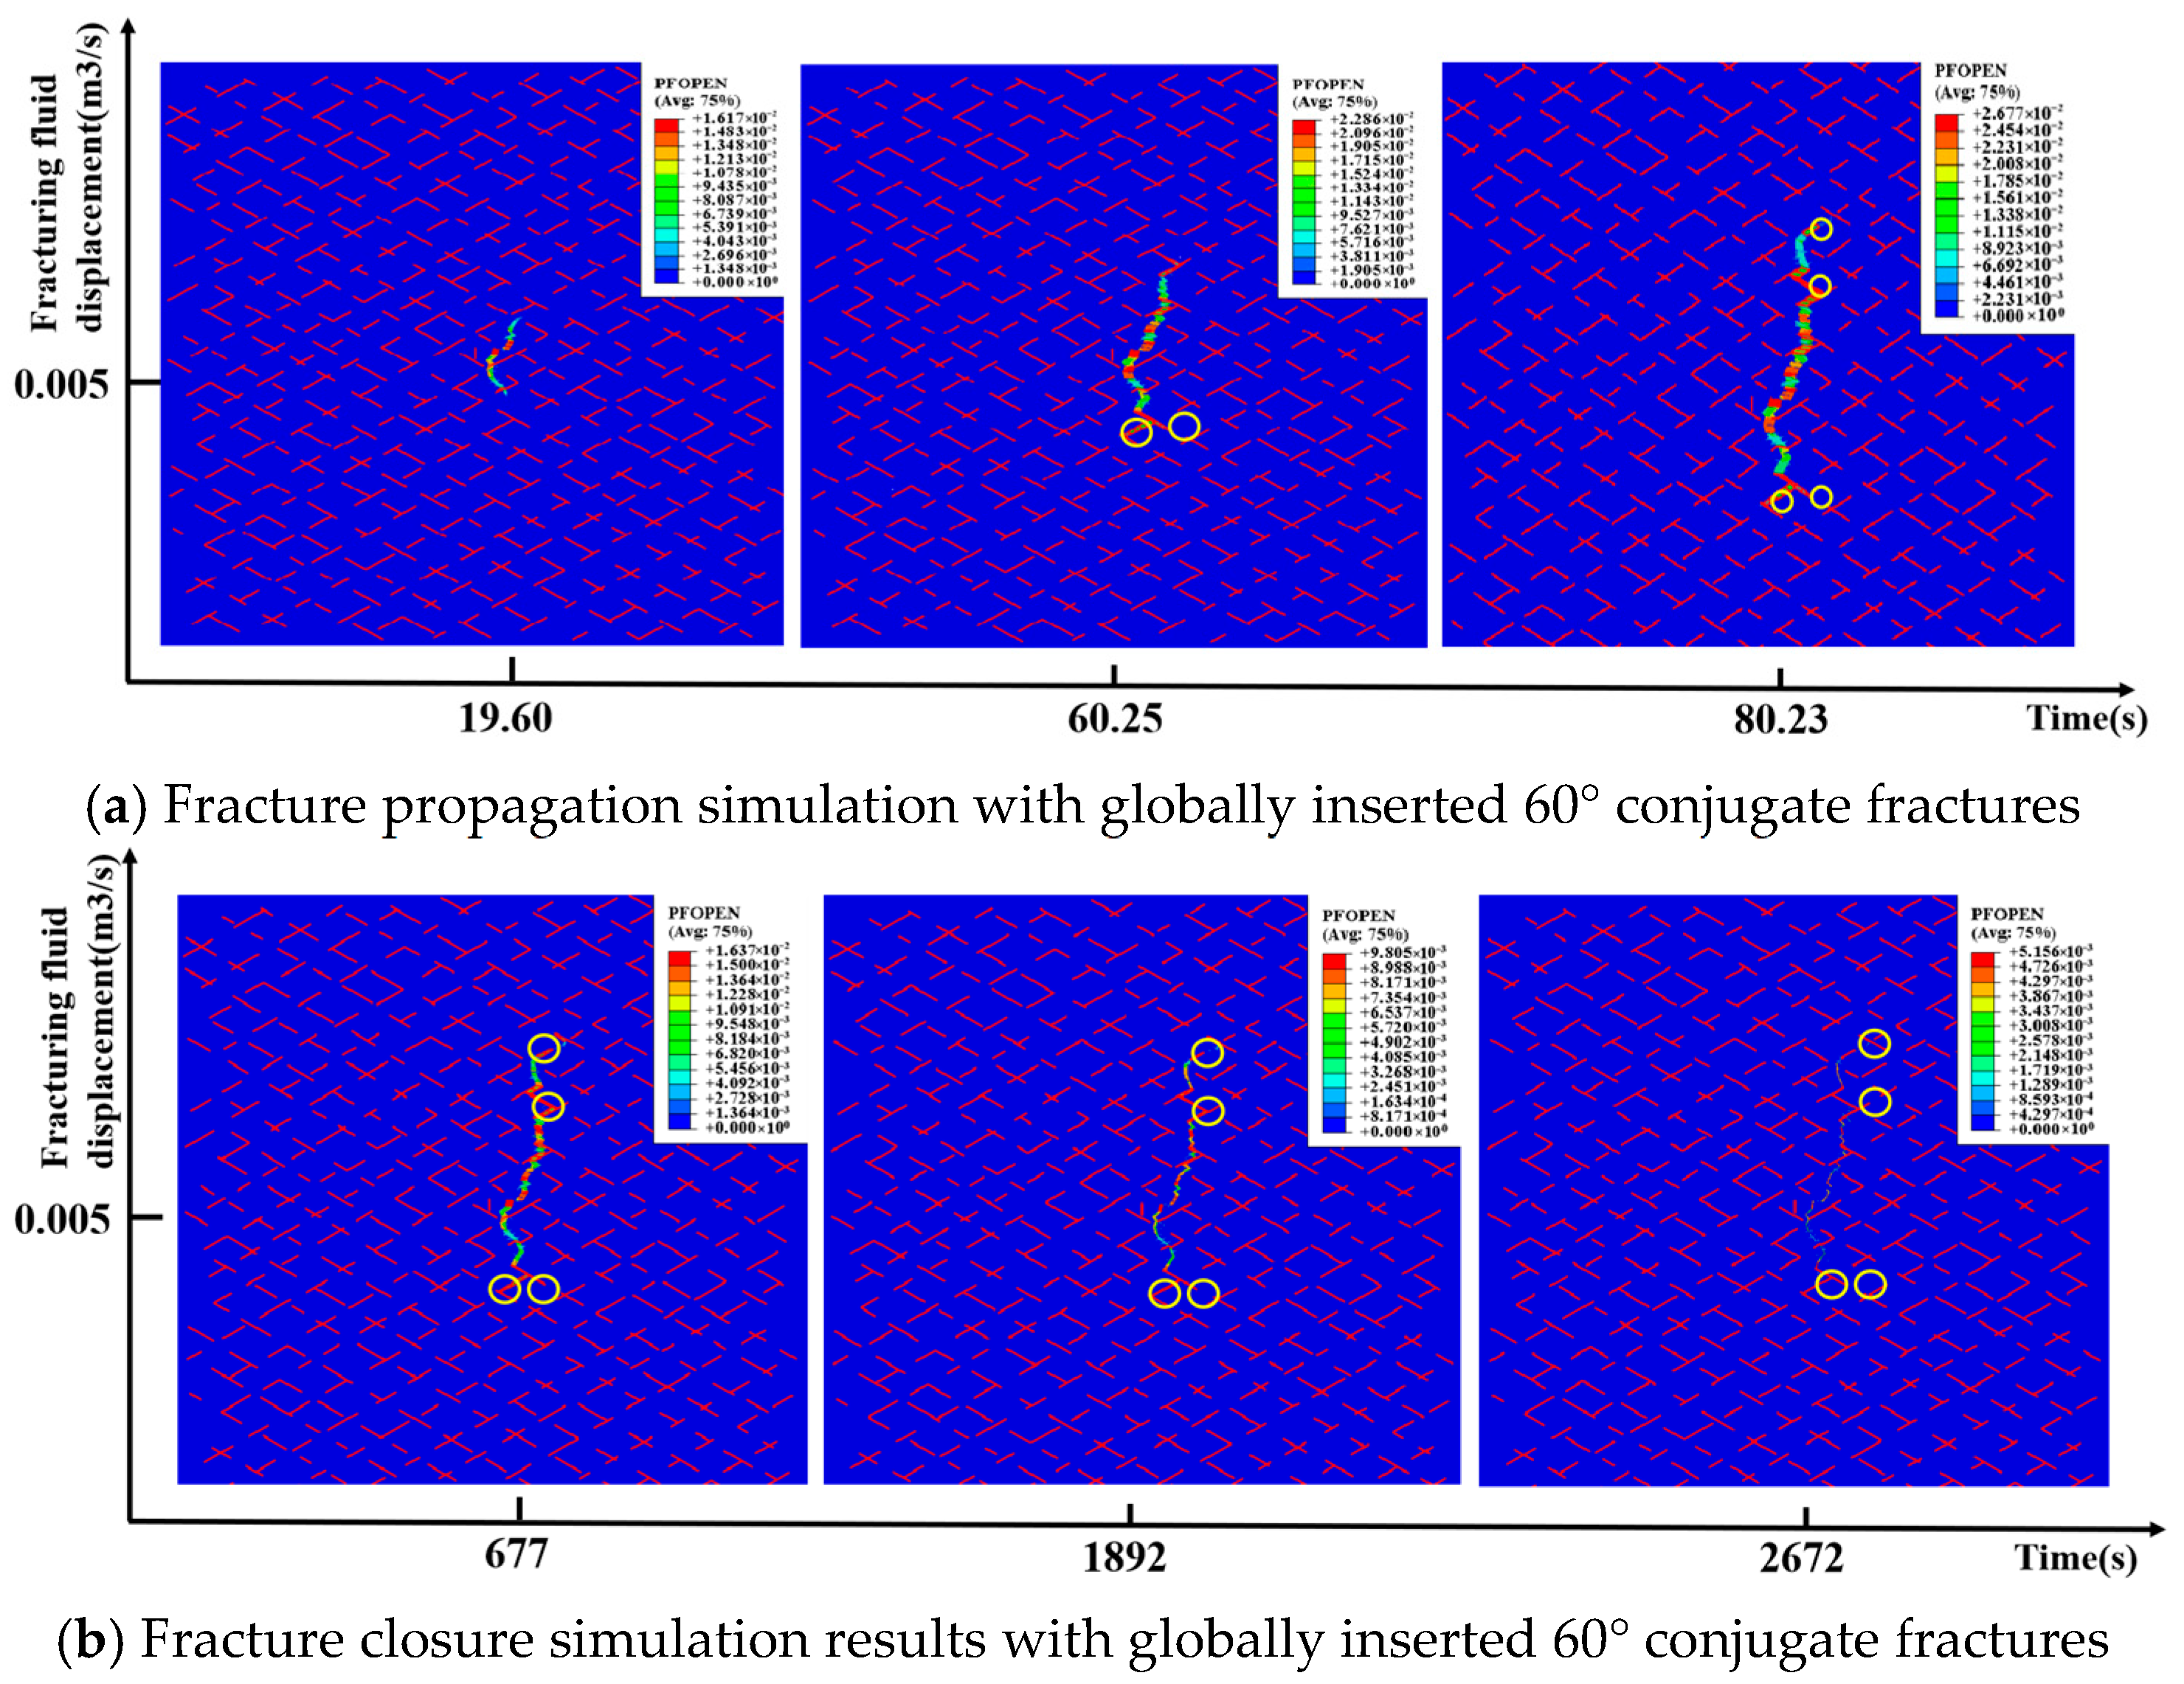
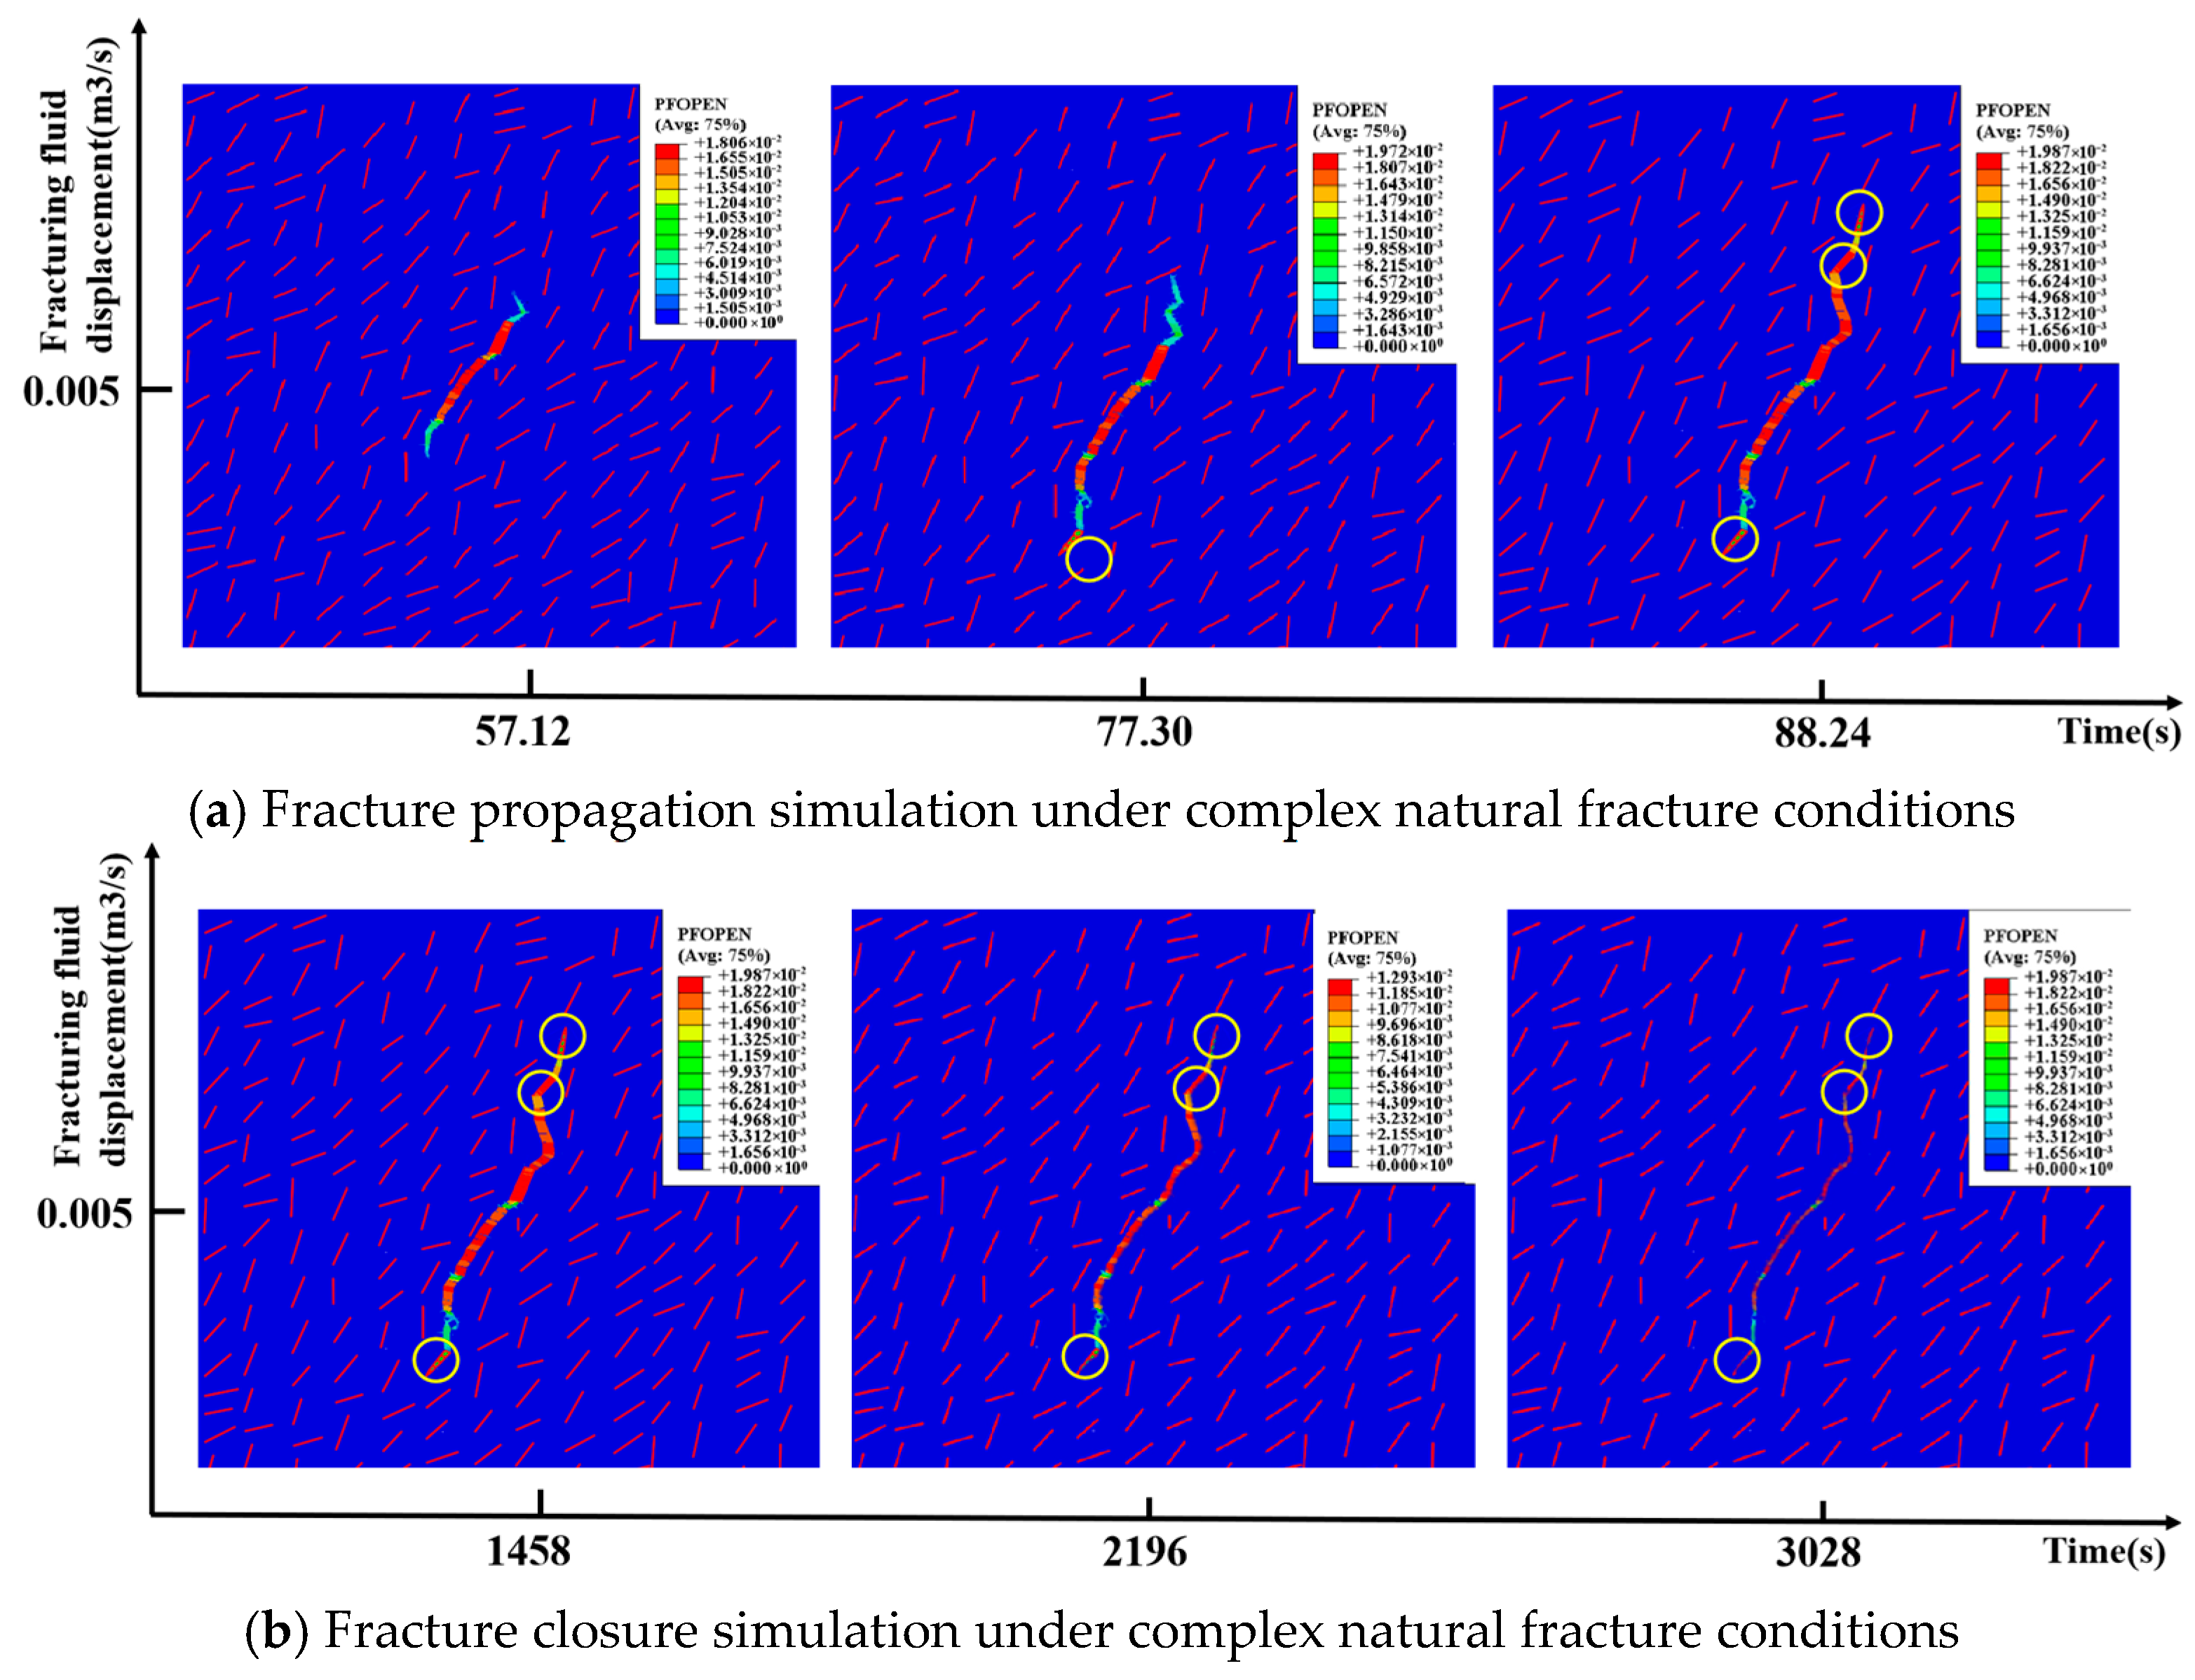
To study the relationship between closure pressure and in situ stress for complex fractures under different approach angle conditions, numerical simulations were conducted with globally embedded random natural fractures (Figure 16). The results show that due to the presence of complex natural fractures, the fracture propagation path is more tortuous, and fractures tend to propagate along the natural fractures, forming a complex fracture network.
Figure 16.
Simulation of fracture propagation and closure under complex natural fracture conditions.
Due to the varying angles and scales of the globally inserted fractures, the scales of the connected branch fractures also differ. As shown in Figure 17, three natural fracture closure points are identified using the G-function, corresponding to connected high-angle, medium-angle, and low-angle natural fractures, respectively. The high-angle branch fractures close first and are closest to the maximum horizontal effective stress. The closure pressure of the medium-angle branch fractures lies between the maximum and minimum horizontal effective stresses. The closure pressure of the low-angle branch fractures approaches the minimum horizontal effective stress.
Figure 17.
Pressure drop injection curve and G-function curve of complex fracture pump stop.
3.3.4. Results Comparison
The closure pressures of hydraulic fractures (HF) and natural fractures (NF) interpreted from the numerically simulated shut-in pressure decline curves using the G-function were compared with the closure pressures calculated using Formula (5) for verification (Table 2, Table 3 and Table 4). When the horizontal stress difference is 5 MPa and the approach angle is 60°, the natural fracture closure pressure identified by the G-function is 22.22 MPa. When the approach angle is 75°, the natural fracture closure pressure identified by the G-function is 24.79 MPa, differing from the read hydraulic fracture closure pressure by only 0.21 MPa. When the horizontal stress difference is 2 MPa and the approach angle is 60°, the fracture closure pressure is 95% of the maximum horizontal effective stress. This indicates that when the stress difference is smaller and the fracture approach angle is larger, the natural fracture closure pressure tends closer to the maximum horizontal effective stress.
Table 2.
Comparison of interpretation results and calculation results of simple seam closure pressure.
Table 3.
Comparison of interpretation results and calculation results of moderately complex fracture closure pressure.
Table 4.
Comparison of interpretation results and calculation results of complex fracture closure pressure.
Analysis of the simulated shut-in pressure decline curves for simple fractures using the G-function revealed that when injection time, flow rate, and in situ stress magnitude remain constant, only changing the approach angle, the closure time of the main fracture (hydraulic fracture) is nearly consistent, and the obtained closure pressure is the minimum horizontal effective stress. The closure pressures corresponding to natural fractures at approach angles of 30°, 45°, 60°, and 75° are 21.96 MPa, 22.18 MPa, 23.22 MPa, and 24.79 MPa, respectively. This means that the closure pressure of natural fractures at different angles increases with the increasing approach angle, increasingly approaching the maximum horizontal effective stress (25 MPa). At an approach angle of 75°, the difference from the maximum horizontal effective stress is only about 0.21 MPa, very close to the maximum horizontal effective stress. The comparison results show that the error between the in situ stress values interpreted by the complex fracture network shut-in pressure decline model and the calculated values is within 10%, proving the model’s reliability.
4. Calculation Method for Horizontal In Situ Stress Based on Shut-In Fracturing Curves
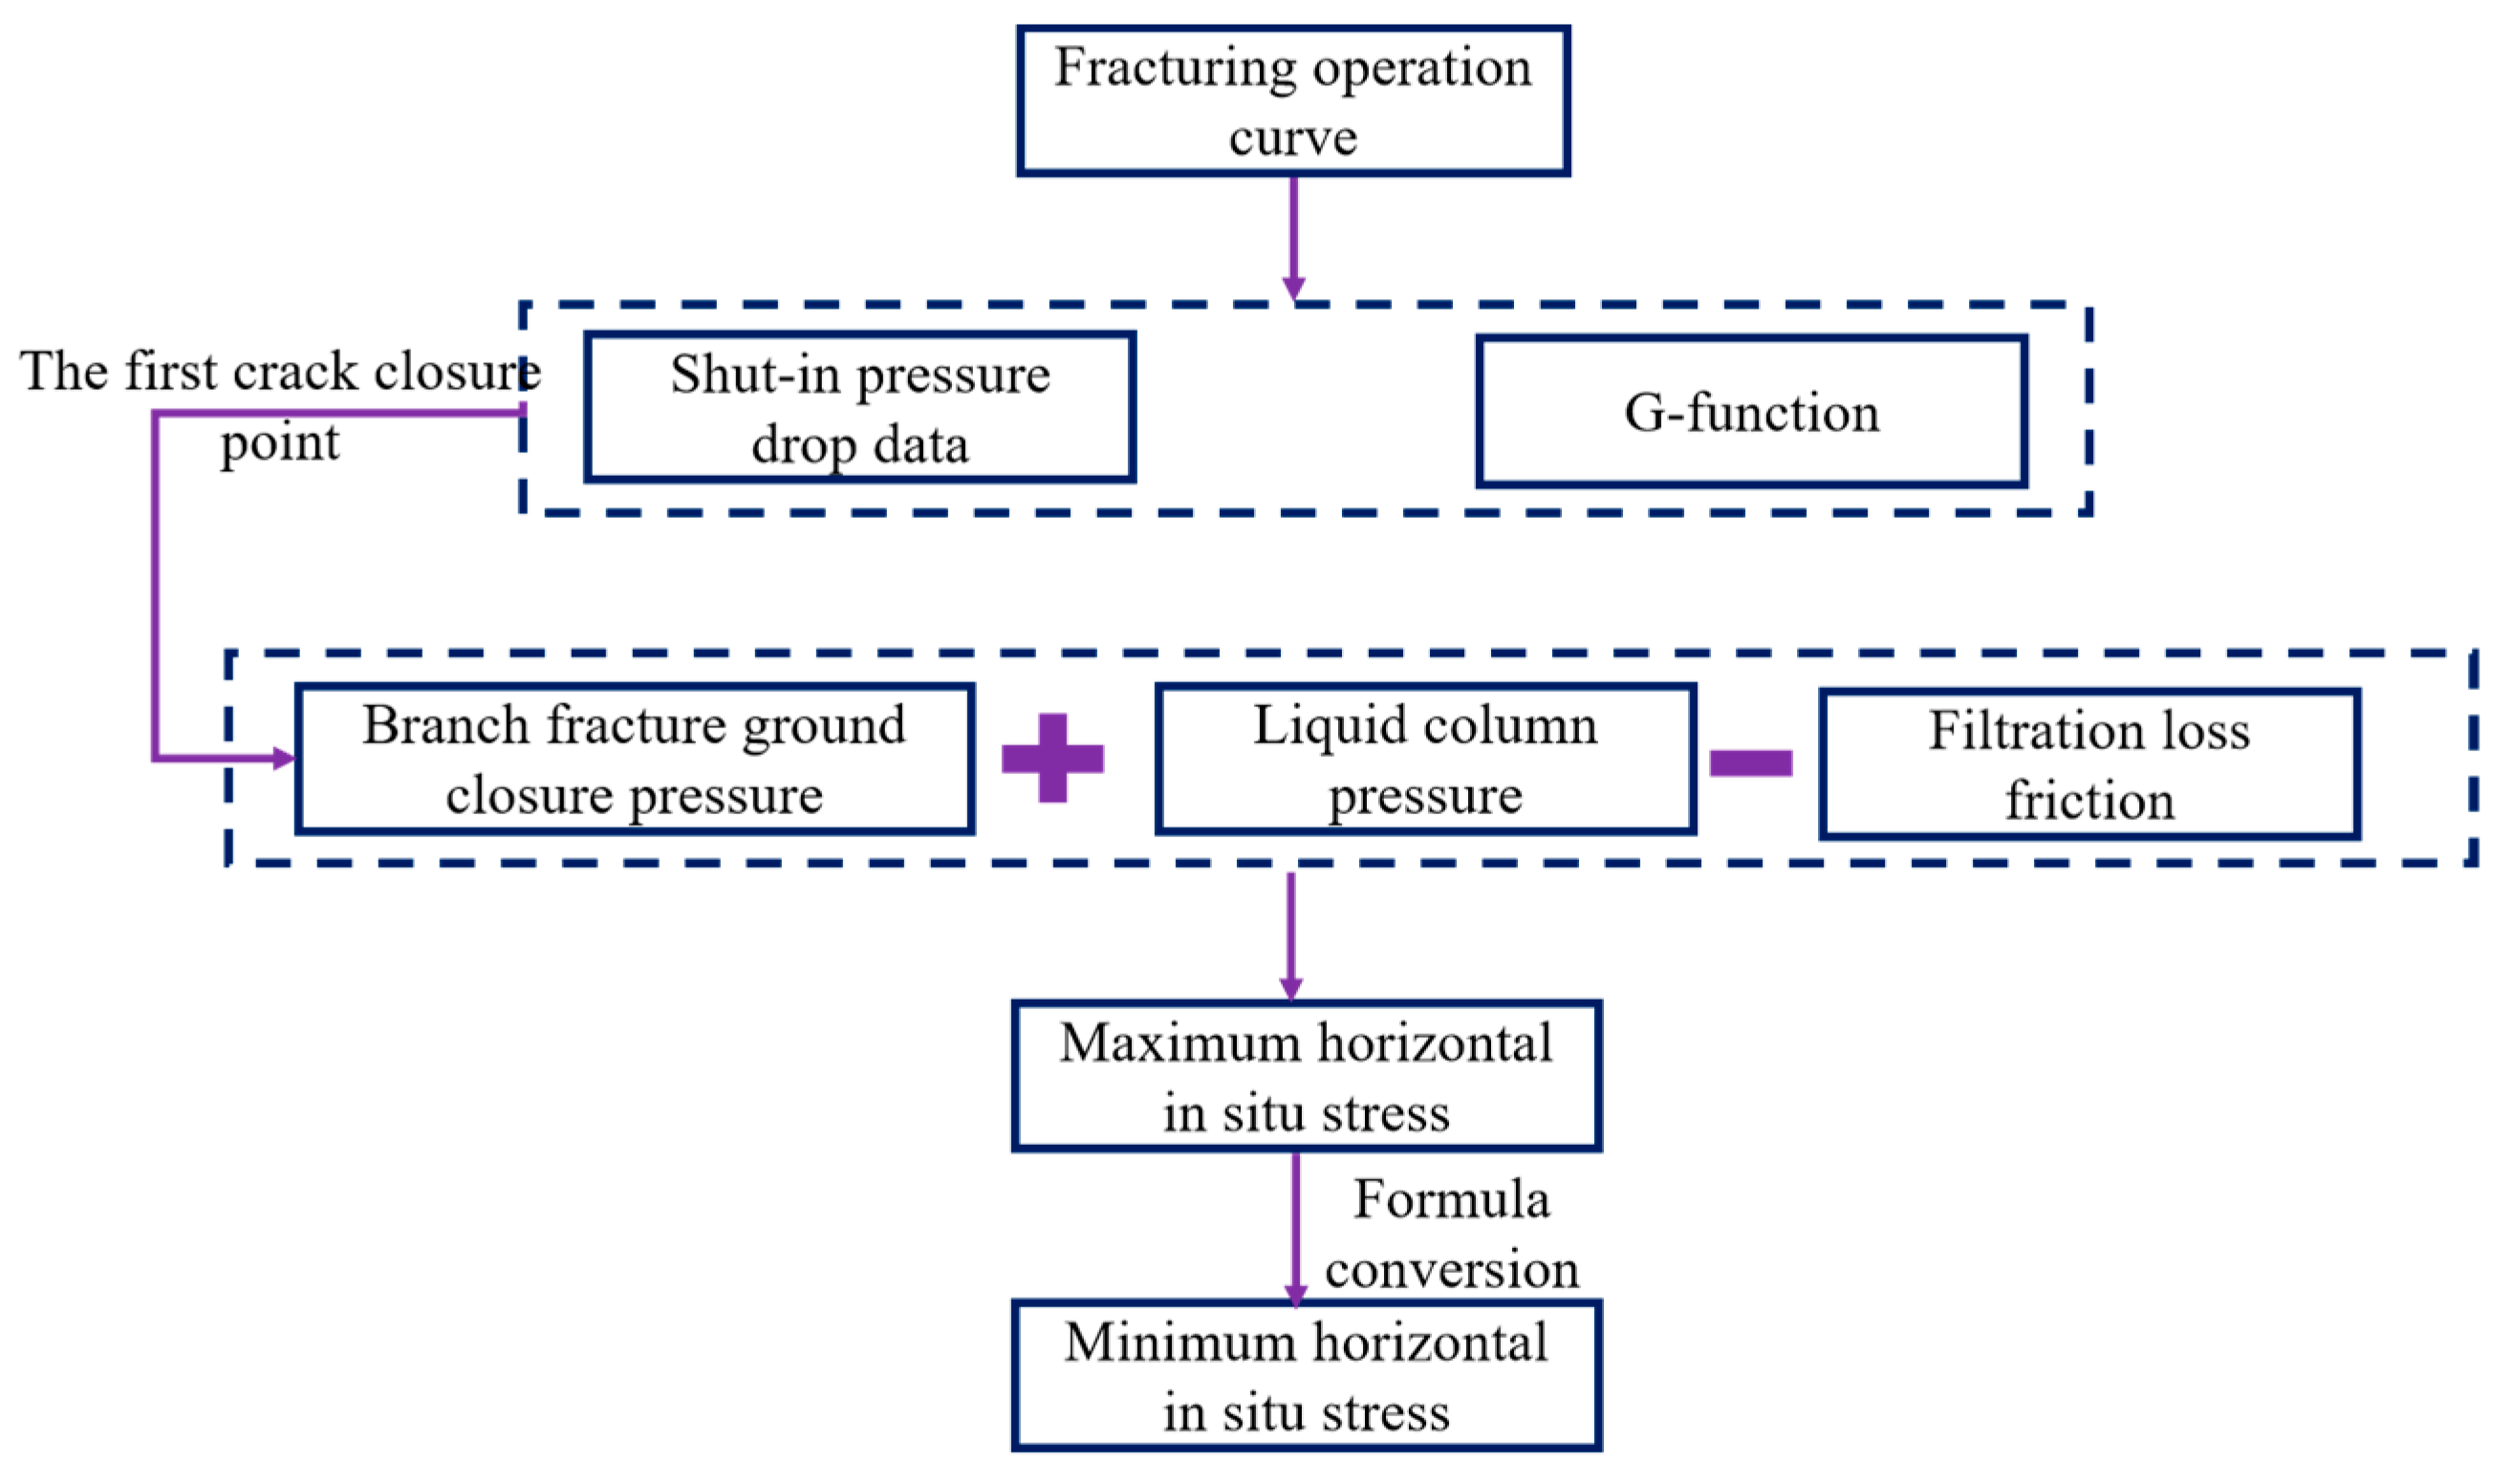
Based on the numerical simulation results from the previous section, whether for simple, moderately complex, or complex natural fractures, when the approach angle is greater than 60°, the closure pressure at the first fracture closure point after shut-in in the deep coal seam fracture network fracturing approximates the maximum horizontal principal stress. Based on this conclusion, the surface first closure pressure is picked from the fracturing shut-in data. This surface first closure pressure is converted to the bottomhole closure pressure, which is the maximum horizontal principal stress. Furthermore, the minimum horizontal principal stress can be obtained through formula conversion based on the maximum horizontal principal stress.
After surface fracturing fluid pumping stops, the fluid in the formation is not static but begins to gradually leak off into the formation. During this flow process, friction is generated, defined here as “leak-off friction”. During fracturing, hydraulic fractures connect with natural fractures and cleats, forming a complex fracture network. The leak-off volume and leak-off friction for each fracture are difficult to calculate directly. However, the friction generated by post-fracturing leak-off is caused by the slow flow of fluid in the wellbore. Therefore, referring to the frictional pressure loss formula [23] and combining the fluid leak-off velocity in deep coal rocks measured in laboratory experiments [24], a calculation formula for leak-off friction was established:
In perforated completions, the minimum horizontal principal stress can be expressed as [25]
where σh is the minimum horizontal principal stress, MPa; σH is the maximum horizontal principal stress, MPa; pe is the bottomhole first closure pressure, MPa; pt is the surface first closure pressure, MPa; pm is the wellbore hydrostatic pressure, MPa; pf is the leak-off friction, MPa; D is the inner diameter of the casing, m; Q is the leak-off flow rate, m3/min; L is the casing length, m; λ is the friction reduction ratio, dimensionless; σv is the vertical in situ stress, MPa; σf is the tensile strength, MPa; Φ is the rock porosity, dimensionless; po is the formation pore pressure, MPa; pb is the fracture initiation pressure, MPa; and υ is the rock Poisson’s ratio, where .
The calculation process for the minimum horizontal in situ stress is illustrated in Figure 18.
Figure 18.
Calculation process.
5. Application Example
A1 and A2 are two vertical wells in the Daning–Jixian area. The target reservoir is the deep No. 8 coal seam, with the roof consisting of Taiyuan Formation limestone and the floor composed of Benxi Formation mudstone. The No. 8 coal seam is primarily of primary structure, with well-developed cleats and fractures. The horizontal stress difference is relatively small (2–5 MPa). According to field imaging logging results (Figure 19), the target area predominantly contains high-angle fractures (53.5–75.6°), creating favorable conditions for the formation of an extensive and dense fracture network.
Figure 19.
Imaging logging curves of A1 well (left) and A2 well (right).
Wells A1 and A2 had comparable fracturing scales, both utilizing large-scale volume-fracturing technology. The injection rate ranged from 15 to 17 m3/min, with a total fluid volume of 3200 m3. Medium- and high-viscosity slick water were alternately and continuously pumped. The proppant volume per stage was 550–560 m3. After fracturing, a 30 min shut-in pressure decline monitoring was conducted. The complete fracturing curves are shown in Figure 20 and Figure 21. To investigate the relationship between closure pressure and in situ stress, the method established earlier was applied. The G-function was used to identify the closure point, and the closure pressure of the first identified closure point was taken as the maximum horizontal principal stress. The minimum horizontal principal stress was then calculated using Equation (14), where σv = 50 MPa; σf =1 MPa; Φ = 0.02; po = 20.2 MPa; pb = 67 MPa; and υ = 0.31. The results were compared with the in situ stress values obtained from the actual formation rock acoustic emission experiments [25] conducted on Wells A1 and A2, as shown in Table 5.
Figure 20.
A1 well fracturing curve and G-function curve.
Figure 21.
A2 well fracturing curve and G-function curve.
Table 5.
In situ stress results interpreted by pump-stopping pressure drop of five wells in Daning–Jixian area.
It can be seen that the relative difference between the horizontal in situ stress interpreted based on the shut-in pressure decline curve and the results of the acoustic emission laboratory test on rock cores is less than 5%, demonstrating good accuracy.
6. Conclusions
- (1)
- Currently, it is difficult to conduct mini-fracturing tests in every deep coalbed methane well to obtain in situ formation stress. To address this issue, based on the geological characteristics of the deep coal seams in the Daning–Jixian region, a numerical model of the shut-in pressure decline for natural fracture networks of varying complexity was established using the cohesive element method on a finite element platform. The process of hydraulic fracture initiation, propagation, shut-in, and closure was simulated. The results indicate that for natural fractures, whether simple, moderately complex, or complex, when the approach angle is greater than 60°, the closure pressure of the first fracture closure point after shut-in during network fracturing in deep coal seams can be approximated as the maximum horizontal stress.
- (2)
- Based on theoretical analysis and numerical simulation results, in the context of volumetric fracturing in formations with high-angle natural fractures (where the fracture approach angle exceeds 60°), the bottomhole closure pressure of the first closure point in the fracture network after shut-in can be regarded as the maximum horizontal stress. By applying formula conversion, the minimum horizontal stress is derived. A comparison between the in situ stress interpreted from the shut-in pressure decline and the results of the acoustic emission tests shows a relative difference of less than 5%, demonstrating good applicability and accuracy.
- (3)
- Due to the narrow width and low internal pressure of high-angle branch fractures, they are less affected by proppant and the induced stress field during volumetric fracturing. As a result, their closure pressure remains relatively close to the original in situ stress. This method enables efficient and cost-effective determination of formation stress, providing valuable guidance for re-fracturing in existing wells and fracturing design in adjacent wells. The approach can be further extended to deep coal reservoirs in other blocks, offering insights for understanding deep coalbed methane reservoirs and optimizing operational techniques.
Author Contributions
H.Z. (Huaibin Zhen): Data curation and Methodology; H.Z. (Haifeng Zhao): Formal analysis, Conceptualization; Z.J.: Writing—original draft; F.X.: Supervision and Validation; Y.S.: Validation and Visualization; W.Z.: Investigation, Methodology; Q.Z.: Writing—review & editing. All authors have read and agreed to the published version of the manuscript.
Funding
This research was funded by China National Natural Science Foundation grant number 11672333.
Data Availability Statement
The raw data supporting the conclusions of this article will be made available by the authors on request.
Conflicts of Interest
Author Huaibin Zhen was employed by China United Coalbed Methane National Engineering Research Center Company Limited. Author Fengyin Xu was employed by National Engineering Research Center of China United Coalbed Methane Corp., Ltd. Author Yanqi Sun was employed by No. 3 Oil Production Plant, PetroChina Changqing Oilfield Company. Author Qi Zhu was employed by the company CNPC Bohai Drilling Engineering Company Limited. The remaining authors declare that the research was conducted in the absence of any commercial or financial relationships that could be construed as a potential conflict of interest.
References
- Qin, Y. Progress on geological research of deep coalbed methane in China. Acta Pet. Sin. 2023, 44, 1791–1811. [Google Scholar]
- Yang, F.; Li, B.; Wang, K.; Wen, H.; Yang, R.; Huang, Z. Extreme massive hydraulic fracturing in deep coalbed methane horizontal wells: A case study of Linxing Block, eastern Ordos Basin, NW China. Pet. Explor. Dev. 2024, 51, 389–398. [Google Scholar] [CrossRef]
- Zeng, W.; Xu, F.; Zhang, L.; Sun, W.; Wang, Q.; Liu, Y.; Yu, L.; Ji, L.; Zeng, Q.; Zhang, K. Deep coalbed methane production technology for the eastern margin of the Ordos Basin: Advances and their implications. Coal Geol. Explor. 2024, 52, 23–32. [Google Scholar]
- Cai, D.; Cheng, S.; Li, Y.; Bai, W.; Xu, Z.; Wang, Y. Step pump injection pressure drop test to determine the morphology of formation fractures after fracturing. Oil Drill. Prod. Technol. 2023, 45, 748–755. [Google Scholar]
- Zhou, Q.; Deng, R.; Han, X.; Li, C. Evaluation on the Fracturing Effects of Tight Sandstones Based on Pump—off Pressure Drop Analysis. Spec. Oil Gas Reserv. 2017, 24, 165–169. [Google Scholar]
- Chen, Z.; Liu, S.; Zhang, B.; Peng, C.; Li, Y. Study on geostress model of coalbed methane wells in north edge of Qinshui Basin. Coal Sci. Technol. 2018, 46, 136–142. [Google Scholar]
- Jiang, J.; He, C.; Song, Q.; Jin, L.; Feng, Z.; Liu, Q.; Chu, Z.; Zhang, T. Analysis on the geological characteristics of Nantun Formation in Hailaer Oilfield based on mini-frac test. Oil Drill. Prod. Technol. 2019, 41, 636–642. [Google Scholar]
- Jing, J.; Guo, B.; Wang, X.; Li, X. Improvement and Application of Pressure Drop Analysis Method for Mini-Fracturing in Tight Reservoirs. Xinjiang Pet. Geol. 2019, 40, 371–375. [Google Scholar]
- Xiong, X.; Zhen, H.; Li, S.; Wang, H.; Zhang, L.; Song, W.; Lin, H.; Xu, F.; Li, Z.; Zhu, W.; et al. Multi-round diverting fracturing technology and its application in deep coalbed methane in the Daning-Jixian block. Coal Geol. Explor. 2024, 52, 147–160. [Google Scholar]
- Wang, F.; Xu, J.; Zhou, T.; Zhang, S. Pump-stopping pressure drop model considering transient leak-off of fracture network. Pet. Explor. Dev. 2023, 50, 416–423. [Google Scholar] [CrossRef]
- Ecnomides, J.; Nolte, G. Reservoir Stimulation Measures; Zhang, B.; Jiang, W.; Liu, L.; Zhang, R., Translators; Petroleum Industry Press: Beijing, China, 2002; pp. 189–205. [Google Scholar]
- Jin, Y.; Chen, M.; Zhang, X. Hydraulic fracturing initiation pressure models for directional wells in naturally fractured for mation. Acta Pet. Sin. 2006, 27, 124–126. [Google Scholar]
- Zhao, H.; Li, P.; Li, X.; Yao, W. Fracture propagation and evolution law of indirect fracturing in the roof of broken soft coal seams. Int. J. Coal Sci. Technol. 2024, 11, 4. [Google Scholar] [CrossRef]
- Zhao, H. Fracturing Mechanics of Unconventional Oil and Gas Reservoirs; Petroleum Industry Press: Beijing, China, 2023. [Google Scholar]
- Zhao, W.; Zhang, S.; Sun, Z.; Zhao, Y.; Yang, Y. Fracture after compression based on G function curve analysis Complexity assessment study. Sci. Technol. Eng. 2016, 16, 29–33+45. [Google Scholar]
- Wang, X. Research and Application of Fracturing Pressure Decline Analysis in Fractured Reservoir. Ph.D. Thesis, Southwest Petroleum Institute, Nanchong, China, 2005. [Google Scholar]
- Xing, L. The Methods to Analysis of Minimum Ground Stress Based on Fracture Construction Curves. Master’s Thesis, China University of Petroleum, Beijing, China, 2019. [Google Scholar]
- Nolte, K.G. Application of Fracture design Based on Pressure Analysis. SPE Prod. Eng. 1988, 3, 31–42. [Google Scholar] [CrossRef]
- Craig, D.P.; Eberhard, M.J.E.; Barree, R.D. Adapting High Permeability Leakoff Analysis to low Permeability Sands for Estimating Reservoir Engineering Parameters. In Proceedings of the SPE Rocky Mountain Regional/Low-Permeability Reservoirs Symposium and Exhibition, Denver, CO, USA, 12–15 March 2000. [Google Scholar]
- Liu, G.; Ehlig-Economides, C. Comprehensive Global Model for Before Closure Analysis of an Injection Falloff Fracture Calibration Test. In Proceedings of the SPE Annual Technical Conference and Exhibition, Houston, TX, USA, 28–30 September 2015. [Google Scholar]
- Wu, Q.; Xu, Y.; Liu, Y.; Ding, Y.; Wang, X.; Wang, T. The current situation of stimulated reservoir volume for shale in U.S. and its inspiration to China. Oil Drill. Prod. Technol. 2011, 33, 1–7. [Google Scholar]
- Zhao, H.; Luo, J.; Li, X.; Yao, W.; Ji, L.; Zhen, H. Experimental investigation into the fracture propagation behavior of horizontal well multi-stage and multi-cluster fracturing within the roof of crushed soft coal seams. Pet. Sci. 2025; in press. [Google Scholar] [CrossRef]
- Sazid, M.; Hussein, K.; Abudurman, K. Rock Stress Measurement Methods in Rock Mechanics—A Brief Overview. World Eng. Technol. 2023, 11, 252–272. [Google Scholar] [CrossRef]
- Li, C. Calculation formula of rock rupture pressure under perforation and completion conditions. Oil Drill. Prod. Technol. 2002, 2, 37–38. [Google Scholar] [CrossRef]
- Shi, L.; Zhang, X.; Jin, Y.; Chen, M. New method for measurement of in-situ Stresses at great depth. Chin. J. Rock Mech. Eng. 2004, 14, 2355–2358. [Google Scholar]
Disclaimer/Publisher’s Note: The statements, opinions and data contained in all publications are solely those of the individual author(s) and contributor(s) and not of MDPI and/or the editor(s). MDPI and/or the editor(s) disclaim responsibility for any injury to people or property resulting from any ideas, methods, instructions or products referred to in the content. |
© 2025 by the authors. Licensee MDPI, Basel, Switzerland. This article is an open access article distributed under the terms and conditions of the Creative Commons Attribution (CC BY) license (https://creativecommons.org/licenses/by/4.0/).