Article

Broadband Response Enhancement of a Pitching Wave Energy Converter Using a Nonlinear Stiffness Mechanism Under Dry Friction Effects

1
Department of Mechanical Engineering, College of Engineering, Universidad del Bío-Bío, Collao Avenue 1202, Concepción 4051381, Chile
2
Institute of Naval Architecture and Ocean Engineering, Universidad Austral de Chile, Valdivia 5090000, Chile
3
Institut für Getriebetechnik, Maschinendynamik und Robotik, RWTH Aachen University, Eilfschornsteinstraße 18, 52062 Aachen, Germany
*
Author to whom correspondence should be addressed.
Energies 2025, 18(22), 6022; https://doi.org/10.3390/en18226022
Submission received: 24 October 2025 / Revised: 14 November 2025 / Accepted: 15 November 2025 / Published: 18 November 2025
(This article belongs to the Special Issue New Advances in Wave Energy Conversion)

Abstract

This work presents an experimental and theoretical study of a pitching point-absorber wave energy converter (WEC) equipped with a nonlinear stiffness mechanism (NSM) based on a pre-compressed spring. The mechanism is designed to reduce the equivalent restoring stiffness and enhance the device response without external control. A 1:13 scale prototype of the Lafkenewen WEC, deployed off Lebu (Chile), was tested in regular waves within a wave tank for two configurations: with and without the NSM. The rotational response amplitude operator (RAO) was obtained from experiments and compared against a linear hydrodynamic model formulated via Newtonian mechanics and frequency domain radiation/excitation coefficients. Dry friction at the hinge was represented as an equivalent viscous damping term identified iteratively. Unlike narrow-resonance WECs, both configurations exhibited a broadband response without a sharp resonance peak in the 0.7 1.2 Hz range, due to significant radiation damping and hinge friction. The NSM produced a moderate amplification of the rotational RAO (up to ∼32%) while preserving the broadband character. Theoretical predictions agreed with the measurements when dry friction was included. These results demonstrate that passive stiffness reduction via an NSM enhances wave–structure energy transfer even in systems dominated by effective damping and provides a consistent basis for future nonlinear time domain modeling and control-oriented studies.

1. Introduction

The global transition toward low-carbon energy systems has intensified interest in renewable energy technologies capable of providing reliable and continuous power generation [1]. Among these, wave energy has attracted increasing attention due to its high energy density, long-term predictability, and complementarity with wind and solar resources [2,3]. The global theoretical potential of wave energy exceeds 30,000 TWh per year [4], positioning it as a promising candidate for sustainable energy diversification in coastal regions.
Wave Energy Converters (WECs) are designed to capture and transform energy from ocean waves into useful mechanical or electrical power. In particular, Point Absorber (PA) WECs are widely studied due to their compact geometry and relatively simple mechanical configuration [5]. However, their performance is often limited by a mismatch between the natural frequency of the device and the dominant wave frequencies encountered at operational sites [6]. The typically high hydrostatic stiffness of PA systems results in natural frequencies above the energetic region of wave spectra, reducing energy transfer efficiency.
To address this limitation, recent research has explored passive structural mechanisms that modify the dynamic properties of WECs without requiring external energy input [7]. One promising approach involves the use of Nonlinear Stiffness Mechanisms (NSMs), which introduce negative-stiffness characteristics into the restoring force of the system. These mechanisms are typically realized through pre-compressed springs, pneumatic systems, or magnetic components, and may exhibit bistable, multistable, or adaptive bistable behavior depending on their configuration. Wu [8] demonstrated that incorporating a nonlinear stiffness element into a floating point absorber increases mean absorbed power by extending the natural period and broadening the resonance bandwidth, thereby improving energy harvesting efficiency. Similarly, Todalshaug [9] verified through large-scale wave-basin testing that the WaveSpring—a pre-tensioned pneumatic negative-stiffness mechanism developed for the CorPower device—can triple absorbed power under realistic sea states. More recently, Khasawneh [10] implemented a bistable NSM based on magnetic components, showing that the nonlinear restoring force can shift the effective response of a point absorber toward lower, more energetic frequencies without the need for added mass or active control.
Beyond these implementations, several configurations of NSMs have been proposed to achieve broadband energy absorption. Xiao [11] developed a nonlinear snap-through PTO system for a heaving-type WEC, composed of two symmetrically oblique springs and a linear damper, forming a double-well potential that enhances energy capture in low-frequency waves compared to a linear system. Later, Têtu [12] extended this concept to a pitching-type converter, introducing a pre-tensioned spring mechanism mounted in parallel with the PTO unit, which effectively shifts the resonance period and broadens the response bandwidth of a semi-submerged buoy. Younesian [13] further demonstrated that a multistable nonlinear oscillator, combining a nonlinear restoring mechanism with a linear damping generator, can multiply the absorption efficiency of heaving WECs and substantially broaden the frequency bandwidth of both motion and PTO damping. Building upon these concepts, Zhang [14] proposed an adaptive bistable mechanism with auxiliary springs that continuously adjust the potential barrier, maintaining high performance across varying wave amplitudes and eliminating the low-energy “intrawell” oscillations that limit conventional bistable devices. Collectively, these studies demonstrate that NSMs can effectively reproduce equivalent stiffness characteristics that reduce overall system stiffness and enhance energy absorption. Unlike active control strategies [15], NSMs operate passively, offering greater robustness, reduced control complexity, and improved efficiency across a wide range of sea states.
Despite growing interest, the dynamic behavior of WECs equipped with NSMs remains insufficiently understood, particularly under realistic operating conditions. Much of the existing literature focuses on idealized dynamic conditions, often neglecting dissipative effects such as frictional losses in mechanical joints or added damping due to fluid–structure interaction [16]. These factors may play a significant role in full-scale or laboratory prototypes [17] and influence the frequency response and energy transfer characteristics of the system. Furthermore, few studies provide experimental validation of simplified hydrodynamic models that incorporate NSMs [7] while retaining computational efficiency for engineering design applications.
This study aims to evaluate the influence of a nonlinear stiffness mechanism on the dynamic response of a pitching-type wave energy converter through combined experimental and theoretical, including the effect of the frictional loses as an equivalent damping. To this end, the dynamic behavior of the Lafkenewen WEC—a pitching-type point absorber developed in Chile—is investigated when equipped with a passive NSM based on a pre-compressed spring, conceptually inspired by the mechanism proposed by Têtu [12]. A 1:13 Froude-scaled physical model is tested experimentally under regular waves to quantify the system response in the frequency domain using the Response Amplitude Operator (RAO). Additionally, a friction-aware linear hydrodynamic model is developed, incorporating both radiation damping and dry friction through an equivalent viscous formulation. This approach enables realistic dynamic characterization while maintaining a low computational cost. The study enhances current understanding of passive stiffness modification in WECs and highlights the importance of including frictional effects in dynamic modeling frameworks for wave energy systems.

2. Methodology

The methodology followed in this study begins with the analysis of the experimental setup. The nonlinear stiffness mechanism (NSM) employed in the system is described, along with the characteristics of the experimental tests and the corresponding laboratory configuration. These experiments done provide the first result, which indicates whether the proposed NSM increases the dynamic response of the WEC.
In parallel, based on the same characteristics of the physical system, a theoretical representation of its behavior was developed. For this purpose, the hydrodynamic coefficients were obtained and incorporated into the equation of motion, which aims to represent the WEC–NSM dynamic interaction. Then, the second outcome was evaluated, corresponding to how accurately the proposed equation of motion can reproduce the experimental response of the WEC equipped with the NSM.

2.1. Experimental Set-Up

The experimental tests were conducted in the Wave/Towing Tank of Universidad Austral de Chile (CEH–UACh), a 45 m long, 3 m wide, and 2 m deep facility with an operational water depth of 1.7 m. Wave reflections were minimized through an active absorption system at the paddle and a passive wave-energy dissipation structure at the opposite end, ensuring stable wave conditions throughout the tests. The WEC motion was measured using a Qualisys motion-tracking system operating at a sampling rate of 200 Hz, with a calibration residual less than 2 mm. Reflective markers were attached to the buoy to accurately capture its complete motion during wave excitation, and the recorded data have been used to obtain the kinematic response of the system. Figure 1 illustrates the experimental setup and the installation of the scaled WEC in the tank.

2.1.1. WEC Description

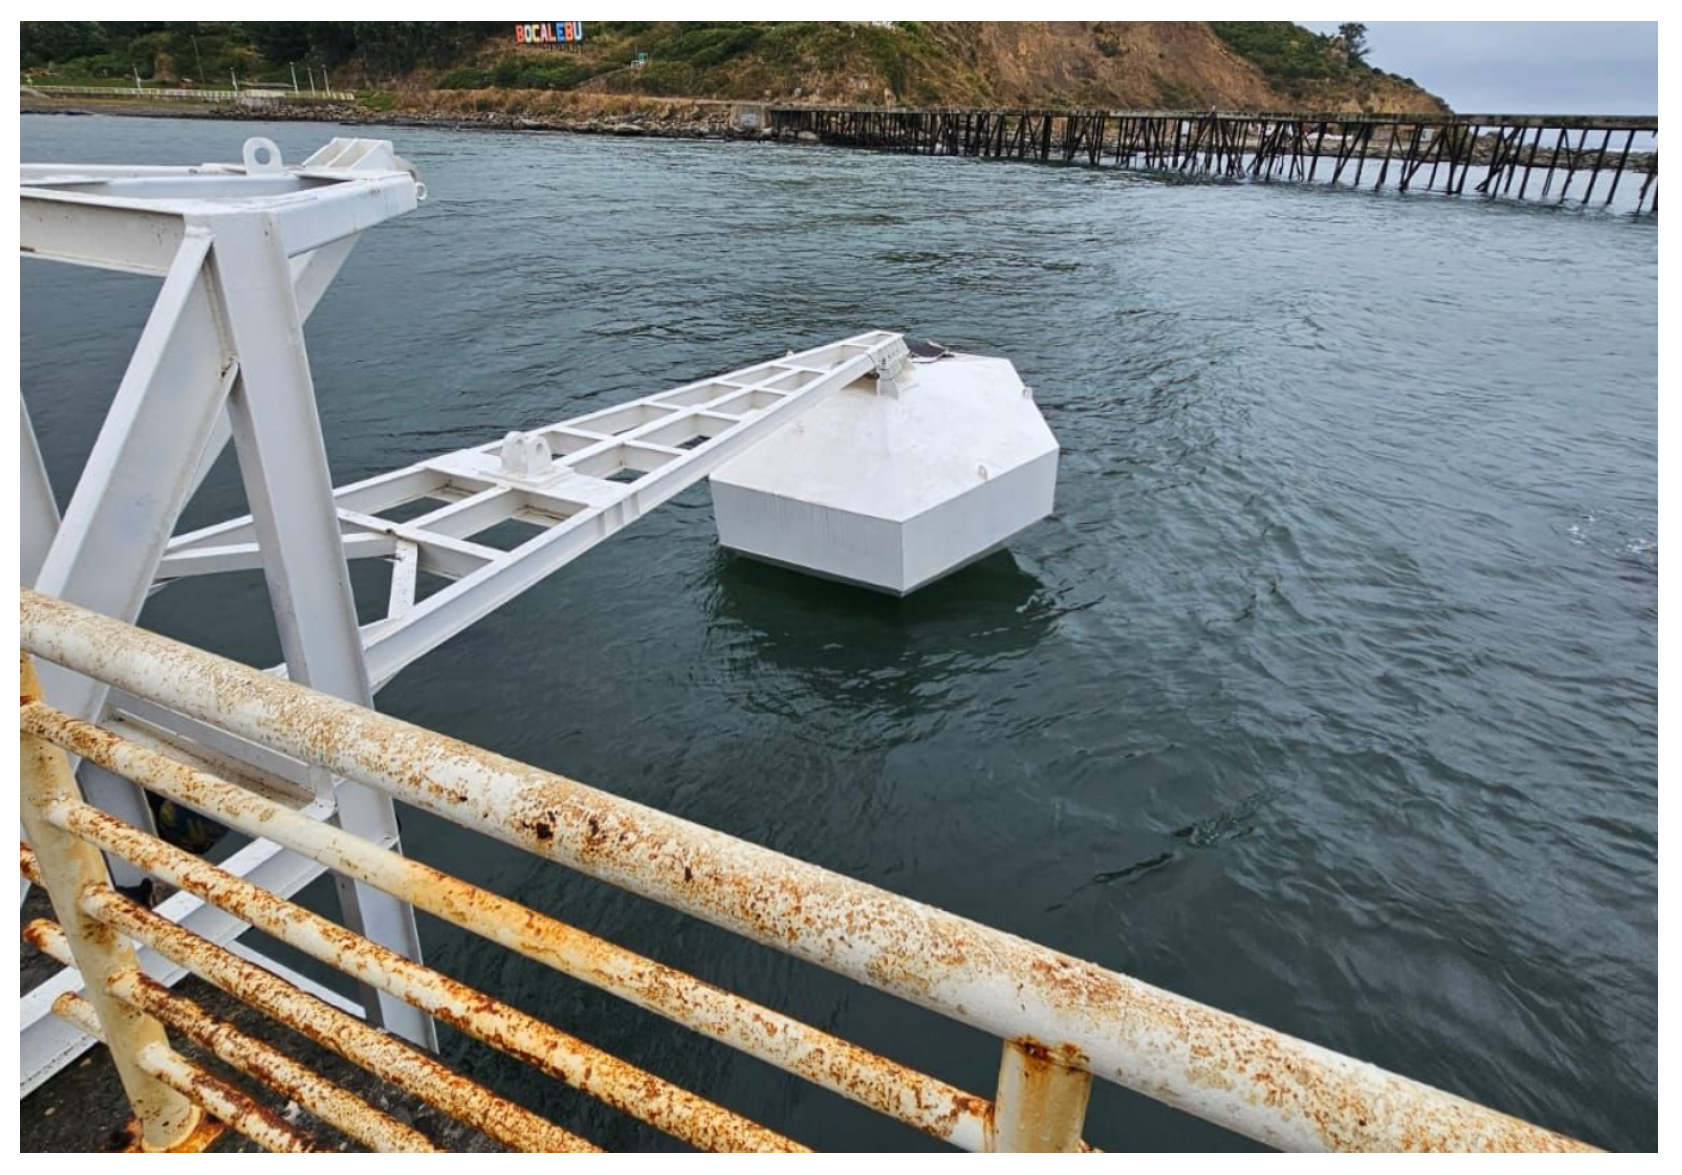
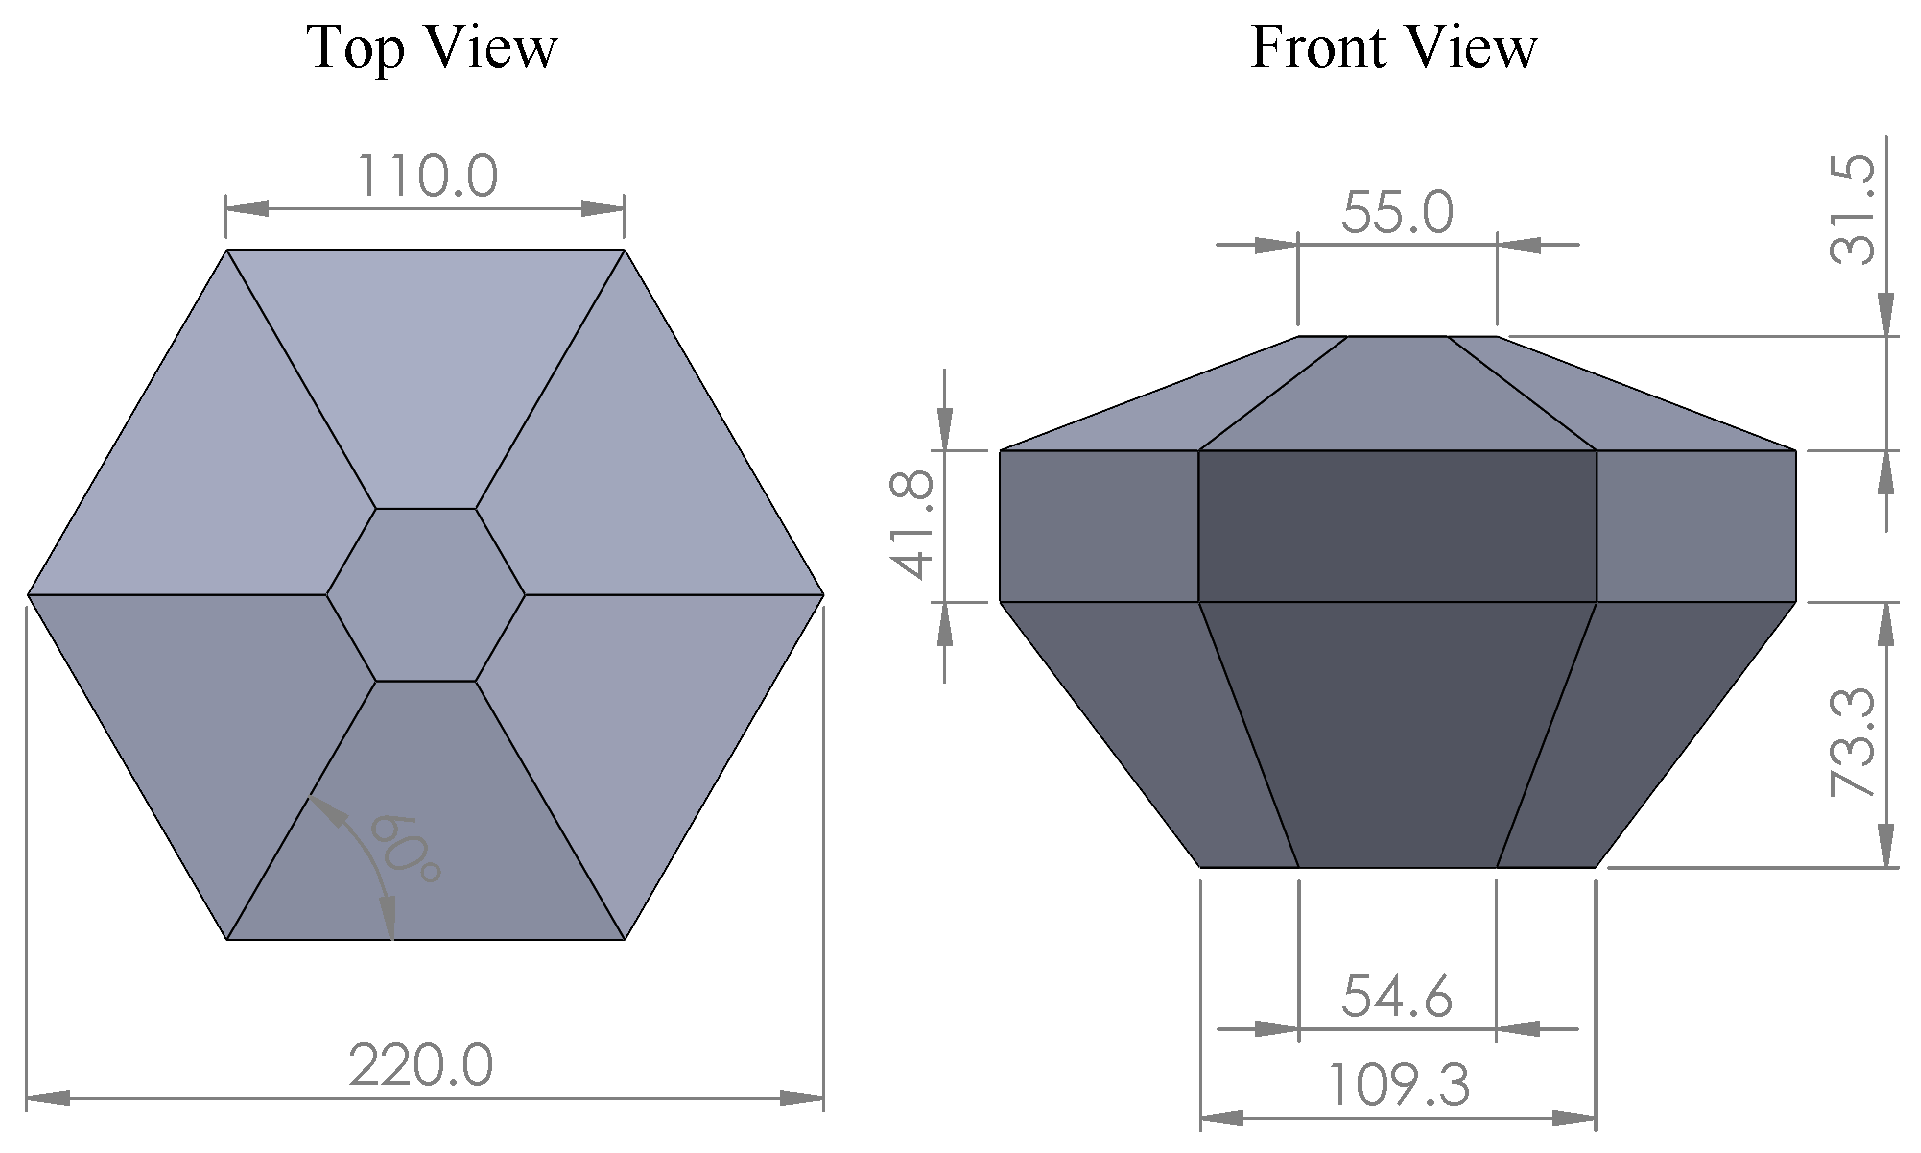
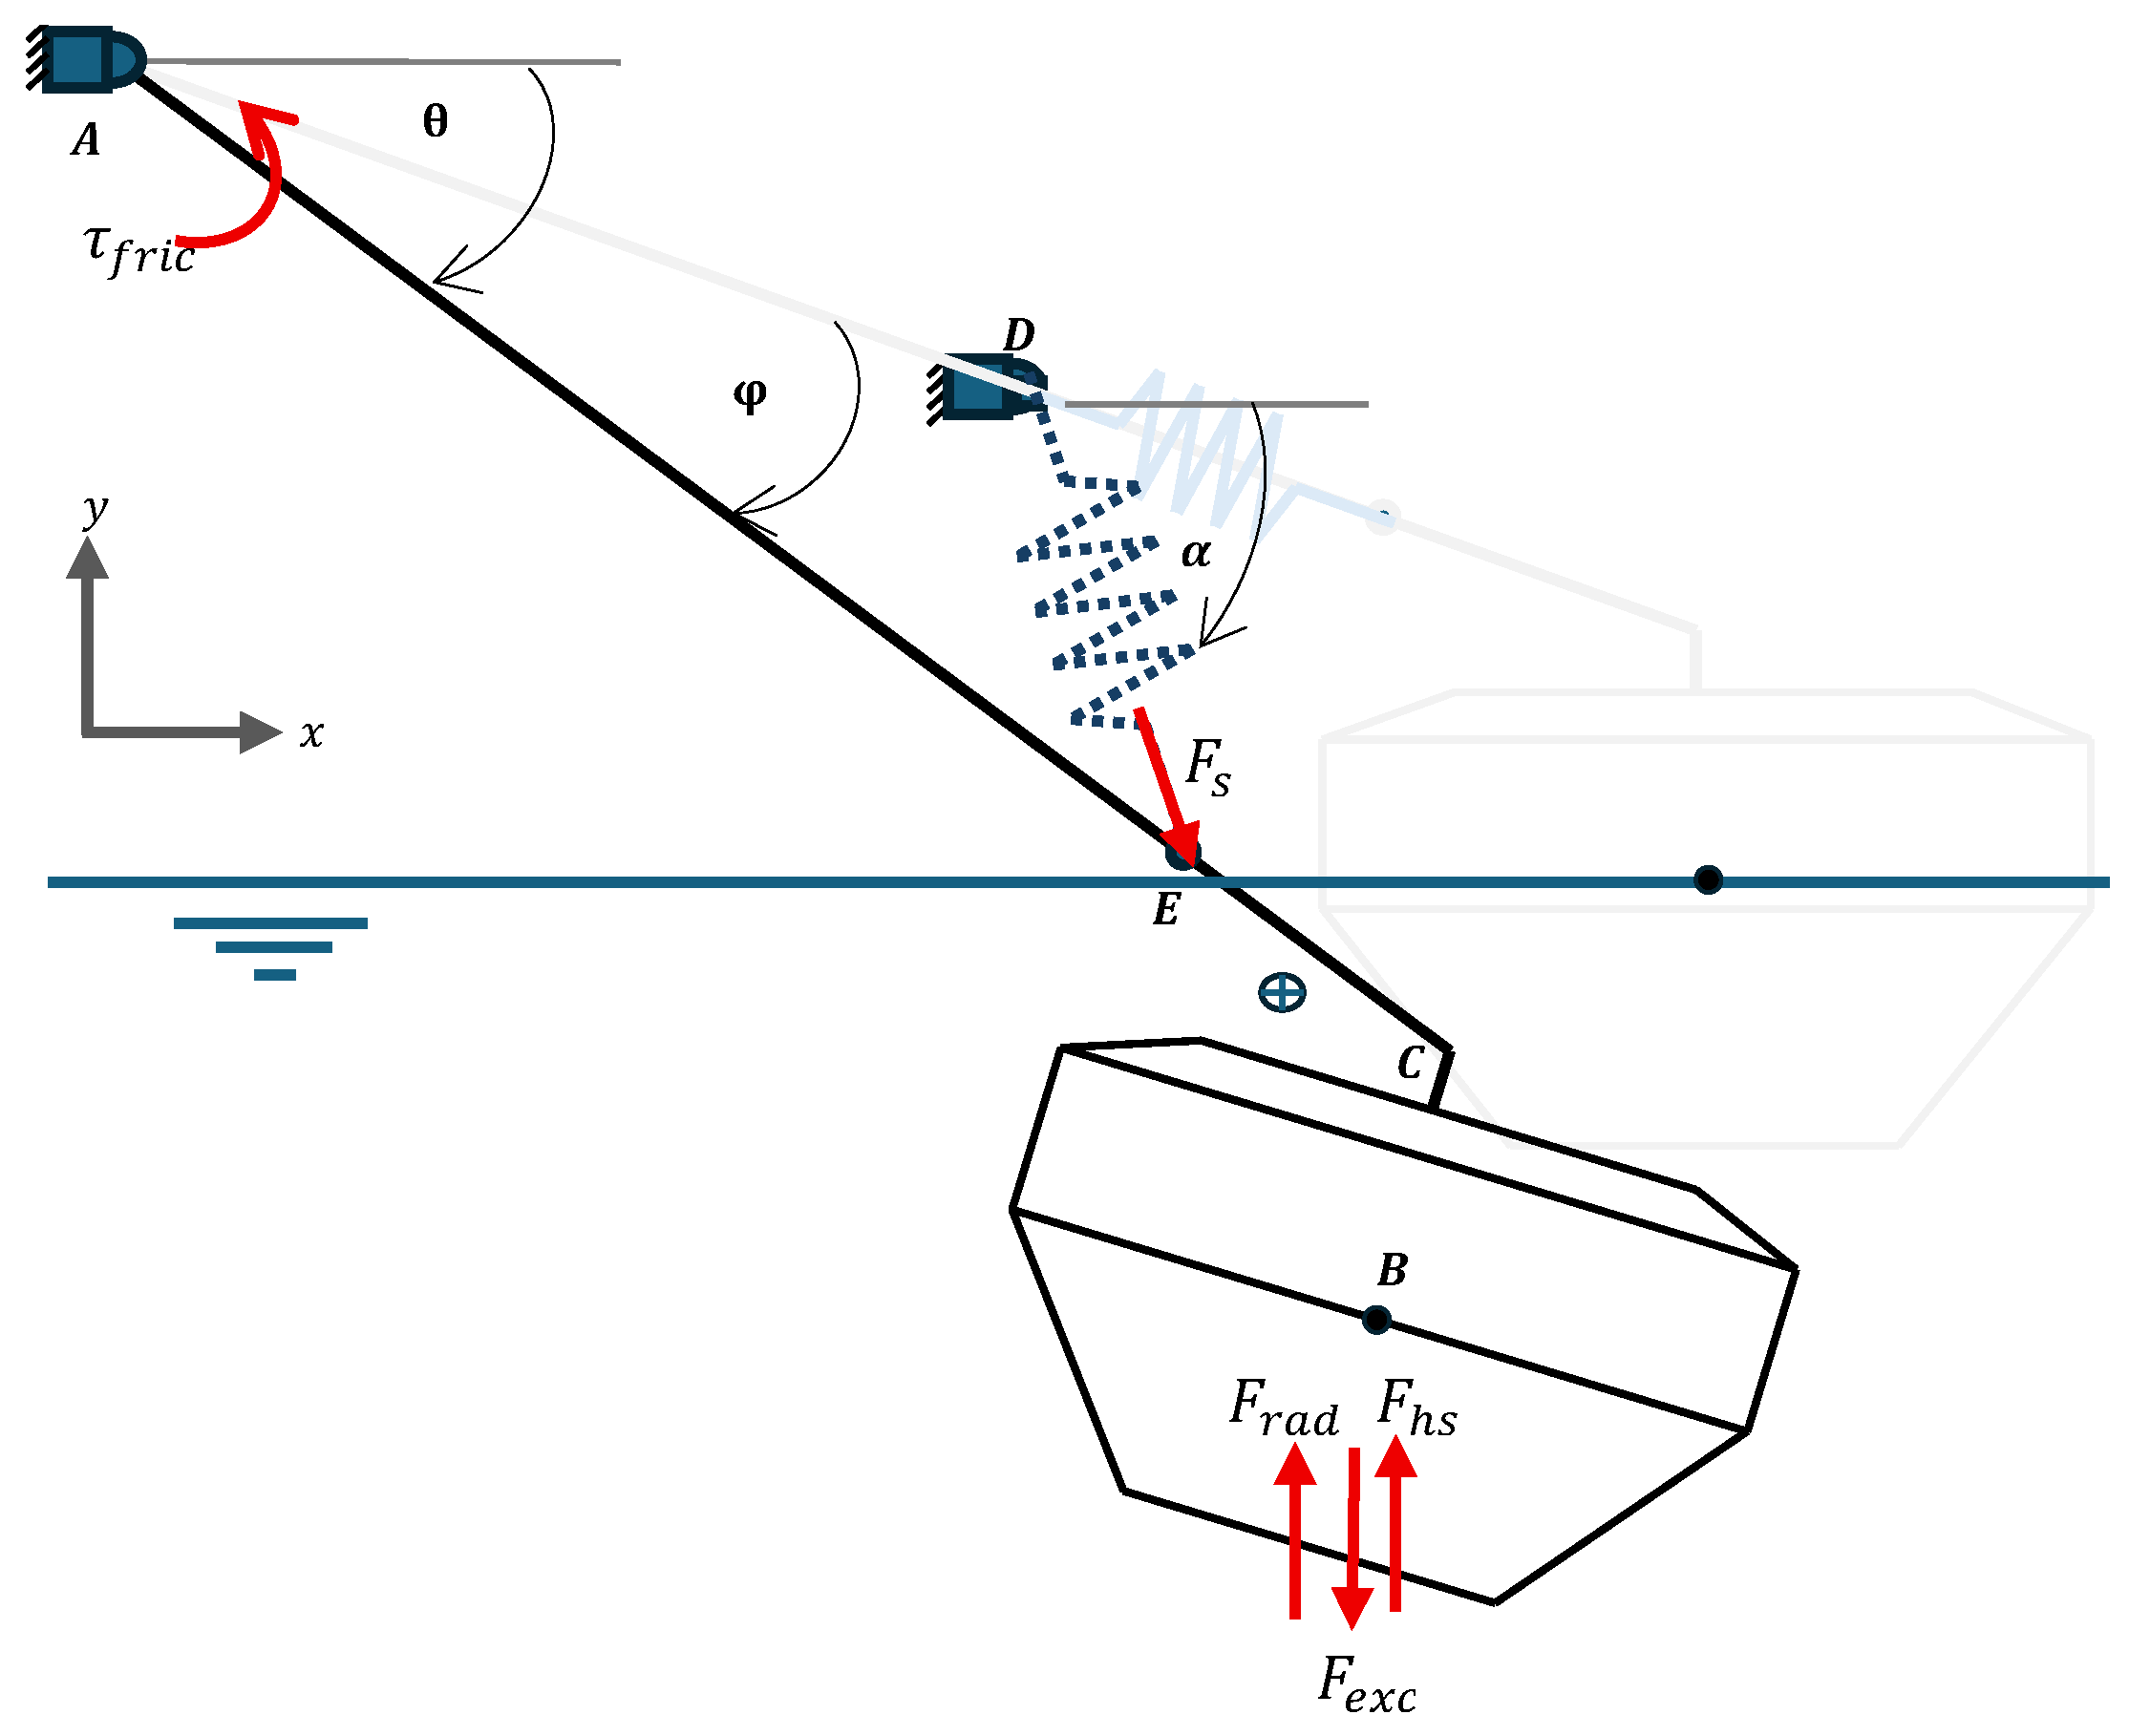
In order to analyze the performance of the Lafkenewen WEC depicted in Figure 2, a 1:13 scale model was employed, as shown in Figure 1. A compression spring was added to the system following the concept proposed by [12]. A schematic representation of the scaled WEC equipped with the NSM is illustrated in Figure 3. The main geometric and dynamic properties of the tested WEC are summarized in Table 1. The buoy dimensions are illustrated in Figure 4. The scaled model behaves as a single-degree-of-freedom system, with motion restricted to the pitching mode about the pivot axis A. The corresponding angular displacement, denoted by φ , was used as the main dynamic coordinate in both experimental measurements and theoretical modeling.
This preliminary investigation did not include the implementation of a Power Take-Off (PTO) system, as the primary objective was to evaluate the influence of the nonlinear stiffness mechanism on the dynamic response amplitude of the WEC. The design and integration of an appropriate PTO configuration are planned for future research stages.

2.1.2. Wave Conditions

To generate linear waves on the laboratory, a constant wave steepness (defined as the ratio between wave height and wave length), of 0.035 was selected. The characteristics of the generated regular waves are summarized in Table 2. Wave elevation and wave period are first calibrated in the laboratory using a set of three Akamina wave gauges, sampling at 200 Hz, without the presence of the WEC model in the tank. Once waves are calibrated, meaning wave height and period at the location of the WEC model has less than 5% error with respect to the theoretical values for linear waves on deep water condition, the model is installed. Each wave condition is ran three times to ensure replicability of the results. Each test lasted approximately 90 s, sufficient for the wave field to fully developed and interact with the WEC system.

2.1.3. Data Processing and Analysis

The WEC response was measured as the rotational motion about its pivot axis, which represents the primary degree of freedom of the system. To obtain the representative response for each test, the 90 s of recorded data were processed using a Fast Fourier Transform (FFT). A 10 s time window has been applied and shifted every 5 s along the entire signal. For each window, the dominant spectral component was identified, and the corresponding rotational amplitude was extracted. This approach allow the smoothing of local fluctuations and yielded an averaged representative response for the full experiment.
As mentioned previously, the wave height varied with the excitation frequency to maintain a constant wave steepness. Consequently, the rotational response of the buoy was normalized with respect to the amplitude of the generated wave, enabling the calculation of the transfer function or Response Amplitude Operator (RAO), as defined in (1).
RAO φ = φ A w a v e ,
where φ is the rotational response amplitude (rad) and A w a v e is the incident wave amplitude (m), resulting in units of [rad/m]. This parameter represents the main experimental result used to compare the WEC behavior with and without the nonlinear stiffness mechanism.

2.2. Theoretical Model

2.2.1. Hydrodynamic Modeling

To represent the dynamic response of the WEC, frequency-dependent hydrodynamic coefficients were required, including the added mass m add , the radiation damping coefficient c rad , and the normalized excitation force F wave . These coefficients were obtained using ANSYS 2024 R1 AQWA®, which solves the linear potential-flow problem in the frequency domain using a boundary-element formulation. The model was configured in a pivoting mode to replicate the motion of the experimental setup, reproducing the same tank dimensions and water depth than the experiments. However, only the vertical component of the hydrodynamic response was extracted and used in the analysis. This simplification is justified because, for small pitch angles, the vertical motion of the buoy dominates the overall hydrodynamic response.
It should be noted that the standard radiation–diffraction formulation in ANSYS AQWA® is inviscid and, therefore, does not account for viscous dissipation. In the present work, the AQWA-derived hydrodynamic coefficients are used solely as linear radiation–excitation inputs, while the dominant dissipative effects at this experimental scale are introduced explicitly in the analytical model through the dry-friction term at the hinge (see Section 2.2.2 and the friction formulation in Section 2.2.5).
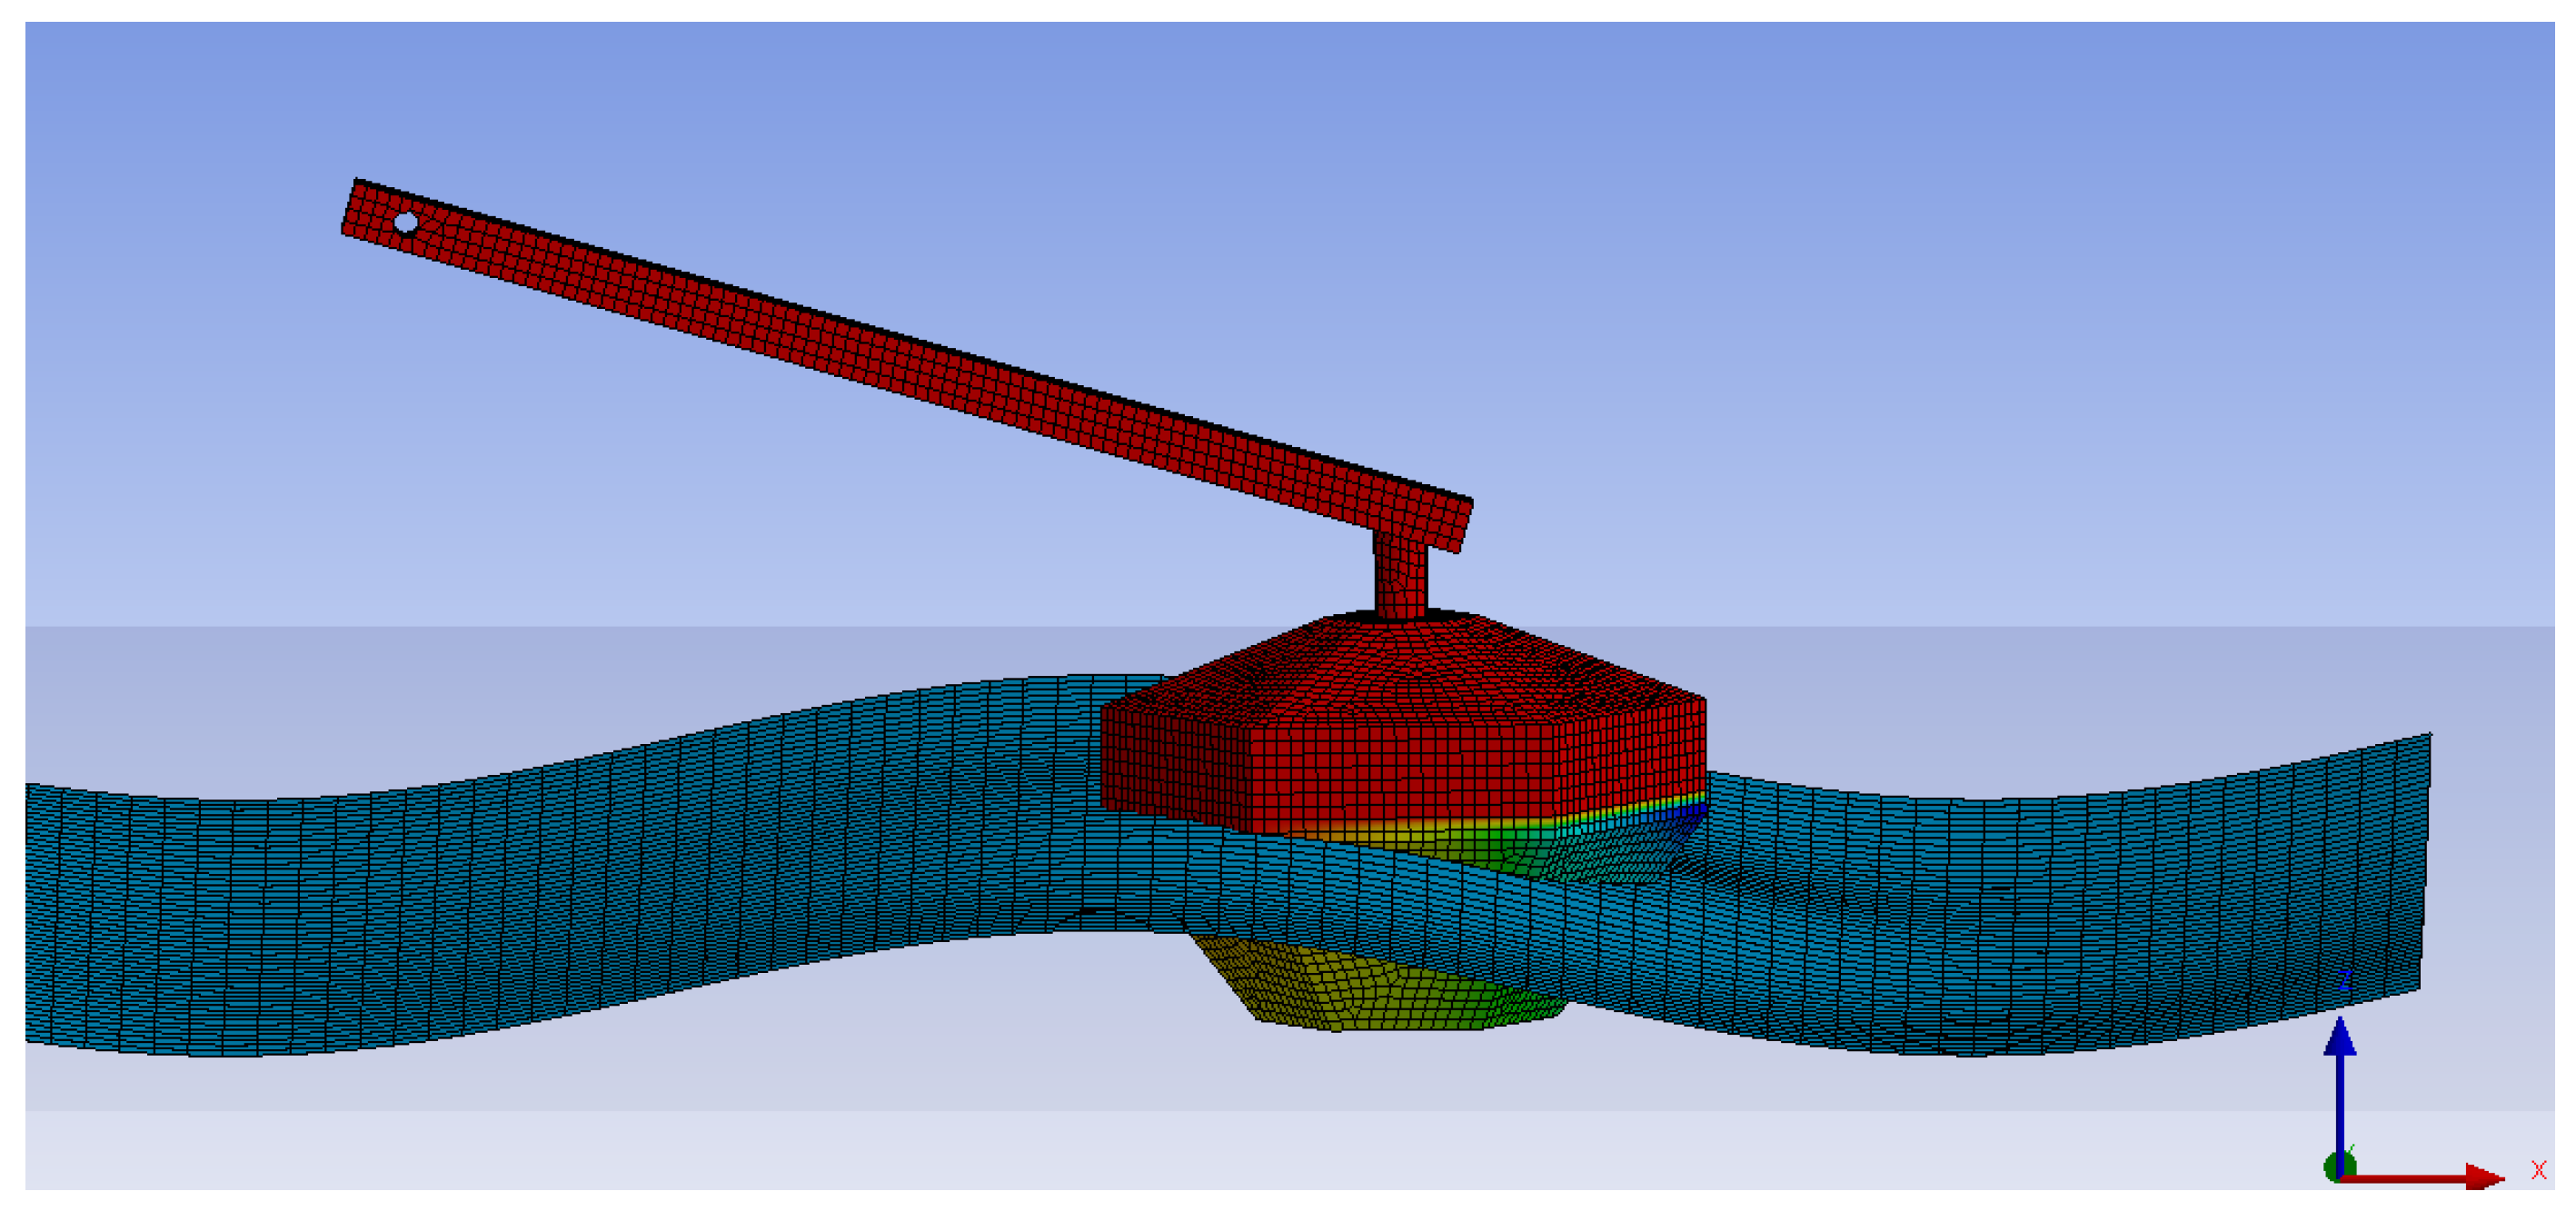
A radiation–diffraction analysis was performed over a frequency range of 0.7–1.5 Hz, with a resolution of 0.05 Hz. To ensure numerical consistency, a mesh-sensitivity analysis was carried out by varying the panel element size between 0.010 m, 0.0075 m, 0.005 m, and 0.0025 m. The resulting variations in the added mass, radiation damping, and excitation force coefficients were below 1% across the frequency range, confirming the reliability of the numerical discretization. An example of the numerical model domain and mesh implemented in ANSYS AQWA® is presented in Figure 5. The detailed results of the hydrodynamic coefficients and mesh-convergence verification are presented in Section 3.1. The converged coefficients were subsequently incorporated into the formulation of the equation of motion developed in Section 2.2.2.

2.2.2. Equation of Motion

The system under study, shown in Figure 3, consists of two rigid bodies, namely the WEC and the NSM, identified by points A, B, C, D and E. The nonlinear equation of motion was derived using the Newton–Euler method and expressed in the general form given by Equation (2):
M q ¨ + G = D ,
where M is the equivalent inertia, q the generalized coordinate, G the gyroscopic term, and D the generalized external force. Since the system had a single degree of freedom, the generalized coordinate q corresponded to the rotation angle φ . The gyroscopic and Coriolis effects, represented by G, were null. The mass matrix M and the generalized forces D reduced to a scalar. The equilibrium position was defined by φ = 0 .
The instantaneous arm angle of the WEC with respect to the horizontal is θ = φ + θ 0 . The position r 1 of the center of mass of the WEC was obtained using the center-of-gravity method and located at a fixed distance l c m from the pivot A, with a constant inclination θ 3 , as shown in (3).
r 1 = l c m cos ( φ + θ 0 + θ 3 ) l c m sin ( φ + θ 0 + θ 3 ) ,
where the x-component corresponds to the horizontal direction and the y-component to the vertical.
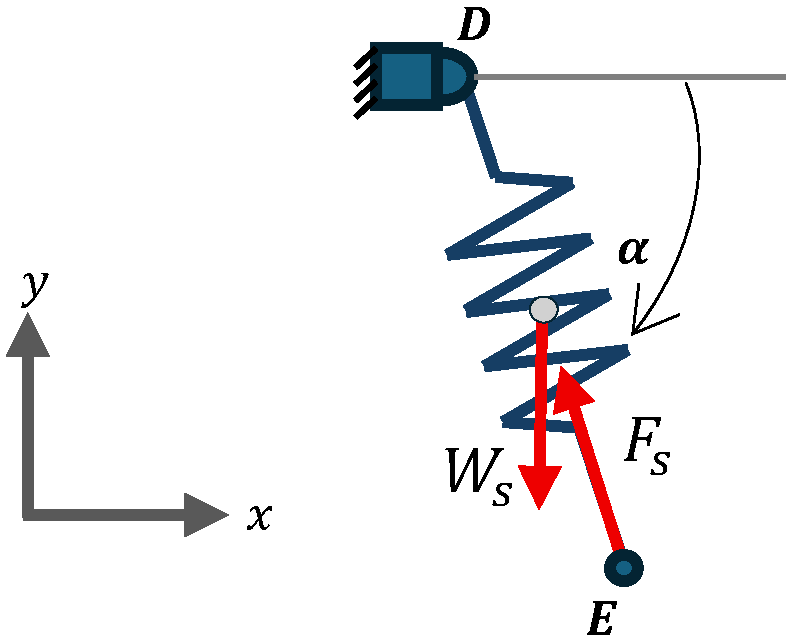
The active forces acting on the system were obtained under the assumption that the WEC submerges under wave excitation. In this configuration, the excitation force F e x c acts downward, corresponding to the instant when the wave trough passes over the buoy. The active forces acting on the WEC are illustrated in Figure 6.
The active forces and moments involved are expressed as shown in (4)–(8).
F h s = ρ g S B y , 0 B y = k h s B y , 0 B y
F r a d = c r a d B ˙ y = c r a d B y φ φ ˙
F e x c = F w a v e cos ( Ω t )
F s = k s l n D E ¯
τ f r i c = τ c A w a v e
where:
F h s : Hydrostatic buoyancy force, proportional to the vertical displacement of the buoy from its equilibrium position [N].
ρ : Water density [kg/m3].
S: Cross-sectional area of the buoy at the water interface [m2].
B y : Vertical position of the buoy along the y-axis; if φ = 0 B y = B y , 0 = 0 [m].
F r a d : Radiation force generated by waves induced by the motion of the WEC [N].
c r a d : Radiation damping coefficient [N·s/m].
Ω : Wave excitation frequency [rad/s].
t: Time [s].
F e x c : Excitation force due to the pressure of incident waves on the buoy surface, normalized by wave amplitude [N/m].
F w a v e : Wave excitation force amplitude, proportional to incident wave height [N/m].
k s : Spring stiffness constant [N/m].
l n : Natural length of the spring [m].
τ f r i c : Normalized dry friction torque or Coulomb damping [N].
τ c : Dry friction torque or Coulomb damping [N·m].
It is important to mention that the friction term τ f r i c was expressed with units of force rather than torque due to the fact that friction torque τ c must be normalized by the wave amplitude A w a v e to remain consistent with the formulation of the excitation force F e x c . Since the wave height varied between tests, this normalization ensured that all excitation-related quantities are expressed in a compatible form with the experimental RAO definition (see Section 2.1.3). Thereby, dimensional coherence was preserved, and direct comparison among tests performed under different wave conditions was possible.
The active force vector f 1 e and the applied moment m 1 e on the WEC are shown in (9).
f 1 e = F s cos α F s sin ( α ) + F h s + F r a d F e x c 0 , m 1 e = 0 0 n 1 .
The angle α present in (9), is an auxiliary angle describing the spring orientation with respect to the horizontal. Under the adopted configuration (see Figure 6), α is negative because the spring is inclined downward from the horizontal. The resulting moment about the center of mass n 1 is shown in (10).
n 1 = F s cos α ( E y r 1 , y ) + F s sin ( α ) ( r 1 , x E x ) + ( F h s + F r a d F e x c ) ( B x r 1 , x ) + τ f r i c .
Applying the Newton–Euler method, the translational and rotational equations follow from (11) and (12), respectively.
m s 1 J T 1 T a s 1 = l c m 2 m s 1 φ ¨ ,
J R 1 T m 1 = I 1 φ ¨ .
Here, J T 1 and J R 1 are the Jacobians of translation and rotation of the WEC. Importantly, m s 1 and I 1 represent the total mass and moment of inertia of the coupled arm–buoy system, defined with respect to its center of mass and accounting for the added mass due to hydrodynamic effects during oscillatory motion. Then, the dynamic equilibrium of the body was written as (13).
J T 1 T f 1 e + J R 1 T m 1 e = F s A E ¯ A D ¯ sin ( φ ) D E ¯ + ( F h s + F r a d F e x c ) B x + τ f r i c .
From here, the main components of the WEC dynamics from (2) are shown in (14) as follows:
M 1 = I 1 + l c m 2 m s 1 , G 1 = 0 , D 1 = F s A E ¯ A D ¯ sin ( φ ) D E ¯ + ( F h s + F r a d F e x c ) B x + τ f r i c .
It is important to highlight that, in this work, the NSM was modeled as the second body in the system. Following the previous methodology, the position of its center of mass is presented in (15).
r 2 = D x + D E ¯ ( φ ) 2 cos α D y + D E ¯ ( φ ) 2 sin α .
The translational and rotational Jacobians are shown in (16)
J T 2 = 1 2 S p cos α α * D E ¯ sin α S p sin α + α * D E ¯ cos α , J R 2 = 0 0 α * ,
with
α * = α φ , S p = D E ¯ φ = A D ¯ A E ¯ sin ( φ ) D E ¯ .
The active forces on the NSM are shown in Figure 7.
They decomposed as
f 2 e = F s cos α F s sin α W s 0 , m 2 e = 0 0 0 .
Applying Newton–Euler method to body 2, neglecting mass and rotational inertia led to Equations (17) and (18).
m s 2 J T 2 T a s 2 = 0 ,
J R 2 T m 2 = 0 .
Then, force equilibrium for the NSM yielded Equation (19).
J T 2 T f 3 e + J R 2 T m 2 e = 1 2 F s S p .
Thus,
M 2 = 0 ,
G 2 = 0 ,
D 2 = F s A E ¯ A D ¯ sin ( φ ) 2 D E ¯ .

2.2.3. Coupled Multibody System

Summing the contributions of both bodies, the terms from (2) are summarized below:
M = M 1 + M 2 , G = G 1 + G 2 = 0 , D = D 1 + D 2 .
Finally, the coupled nonlinear equation of motion is presented in (23).
I 1 + l c m 2 m s 1 φ ¨ = F s A E ¯ A D ¯ sin ( φ ) 2 D E ¯ + ( F h s + F r a d F e x c ) B x + τ f r i c .

2.2.4. Linearization

The nonlinear equation of motion can be linearized by performing a first-order Taylor expansion of all position- and velocity-dependent terms around the static equilibrium configuration ( φ = 0 ). This procedure, known as linearization about the equilibrium point, approximates the system response for small angular perturbations by retaining only the linear terms of the expansion. Following the general formulation the equation of motion, the linearized single-DoF dynamics were expressed as (24).
M φ ¨ + P φ ˙ + Q φ = h ,
where M, P, and Q denote the equivalent inertia, damping, and stiffness coefficients, respectively, evaluated at the equilibrium position, while h represents the external excitation term. After evaluating these terms at φ = 0 , the resulting scalar equation became the equation shown in (25).
I 1 + l c m 2 m s 1 φ ¨ + c r a d B x , 0 2 φ ˙ + k h s B x , 0 2 k s l n D E ¯ 0 A D ¯ A E ¯ 2 D E ¯ 0 φ = F e x c B x , 0 .
Equation (25) represents the small-angle linearized dynamics of the coupled WEC-NSM system. The first term corresponds to the total inertia of the buoy–arm assembly, the second to the radiation damping, and the third to the effective stiffness combining hydrostatic and elastic contributions. The excitation force on the right-hand side term is expressed in its normalized form, consistent with the experimental RAO definition. Dry friction torque is addressed separately in the following section. It is also noted that the sign of the excitation term was taken as positive to ensure positive response amplitudes and facilitate comparison with the measured data.
Under harmonic excitation, the response amplitude is given by (26).
φ = H M Ω 2 Q 2 + Ω 2 P 2 .

2.2.5. Friction

As indicated by vibration theory [18], if the dry friction force is small compared to the amplitude of the excitation force, the approximate solution can be obtained by means of an equivalent viscous damping relation. In other words, if τ f r i c < 4 H / π , it can be assumed that dry friction can be represented as an equivalent rotational viscous damping of the form given by Equation (27).
c φ , eq = 4 τ f r i c π Ω φ .
Because c φ , eq depends on the response amplitude φ , the value of the equivalent damping was found iteratively. The procedure used is presented as follows:
  • Initialize φ ( 0 ) with the linear response (without friction).
  • Compute c φ , eq ( k ) using Equation (27).
  • Update the response using:
    φ ( k + 1 ) = H ( M Ω 2 Q ) 2 + Ω ( P + c φ , eq ( k ) ) 2 .
  • Repeat until | φ ( k + 1 ) φ ( k ) | is less than a specified tolerance, in this case 10 6 .
The process converged rapidly since the equivalent damping stabilizes as frictional and viscous dissipation become balanced.
Subsequently, to implement this formulation, the equivalent friction torque τ c was obtained through an iterative process aimed at matching the theoretical and experimental responses of the WEC. Several candidate values of τ c were analyzed while ensuring compliance with the theoretical condition τ f r i c < 4 H / π , which guarantees the validity of the equivalent viscous formulation. In the configuration including the nonlinear stiffness mechanism, τ c was increased by 20% to account for additional contact between the spring and its guiding pin, which introduces further energy dissipation; this heuristic adjustment was been motivated by evident frictional effects observed during assembly and testing and provided satisfactory agreement with the experimental data in the subsequent analysis.

2.2.6. Nonlinear Stiffness Mechanism Configuration

From the linearized equation of motion (25), the total stiffness force of the system can be expressed as (29)
k h s B x , 0 2 k s l n D E ¯ 0 A D ¯ A E ¯ 2 D E ¯ 0 φ = k h s B x , 0 2 k N S M φ .
Here, the first term corresponds to the hydrostatic restoring effect, while the second term represents the negative stiffness generated by the pre-compressed spring. This relationship shows that by varying k s or l n , the equivalent stiffness of the system can be adjusted, reducing the natural frequency of the WEC toward the desired excitation frequency. However, if the damping is high, this tuning effect becomes difficult to observe experimentally, although the underlying physical principle remains valid.
Based on this analysis, the geometry of the nonlinear stiffness mechanism was defined considering the construction constraints and the expected dynamic behavior of the WEC. The anchor points D and E, which determine the position and orientation of the spring, were selected following a practical configuration inspired by Têtu et al. [12]. The natural length of the spring, l n , was determined from the ratio between the compressed and natural lengths, defined as the nonlinearity coefficient γ [11]. For this study, a value of γ = 0.35 was adopted, corresponding to a strongly nonlinear regime. The final values of l n and the spring stiffness k s were established considering the availability of commercial components and the mechanical limitations of the prototype, as summarized in Table 3.

3. Results and Discussion

This section presents the hydrodynamic analysis of the system, followed by the experimental results obtained from the scaled WEC model tested with and without the NSM. Finally, the experimental response is compared with the theoretical prediction derived from the linearized equation of motion presented in Section 2.

3.1. Hydrodynamic Coefficients

Figure 8 presents the hydrodynamic coefficients obtained from ANSYS AQWA®, together with the results of the mesh-convergence analysis performed to ensure numerical consistency. The added mass m add , radiation damping c rad , and excitation force F wave were computed for a frequency range of 0.7–1.5 Hz. The variations between consecutive mesh refinements were below 1% across the entire frequency range, confirming the reliability of the selected discretization. The increase in radiation damping c rad with frequency, together with the hinge dry friction modeled as equivalent viscous damping, anticipates a broadened (low-Q) resonance rather than a sharp peak within the tested band. This trend is consistent with the experimental observations discussed in the following section.
As expected for a pitching system, the added mass exhibits a decreasing trend with frequency, indicating a reduced inertial contribution at higher frequencies. Conversely, the radiation damping increases with excitation frequency, reflecting stronger wave radiation effects near resonance. In contrast, the excitation force amplitude decreases monotonically with frequency, indicating that the system is mainly excited by longer waves (low-frequency components), which is consistent with the hydrodynamic behavior of PAs.

3.2. Theoretical-Experimental Comparison

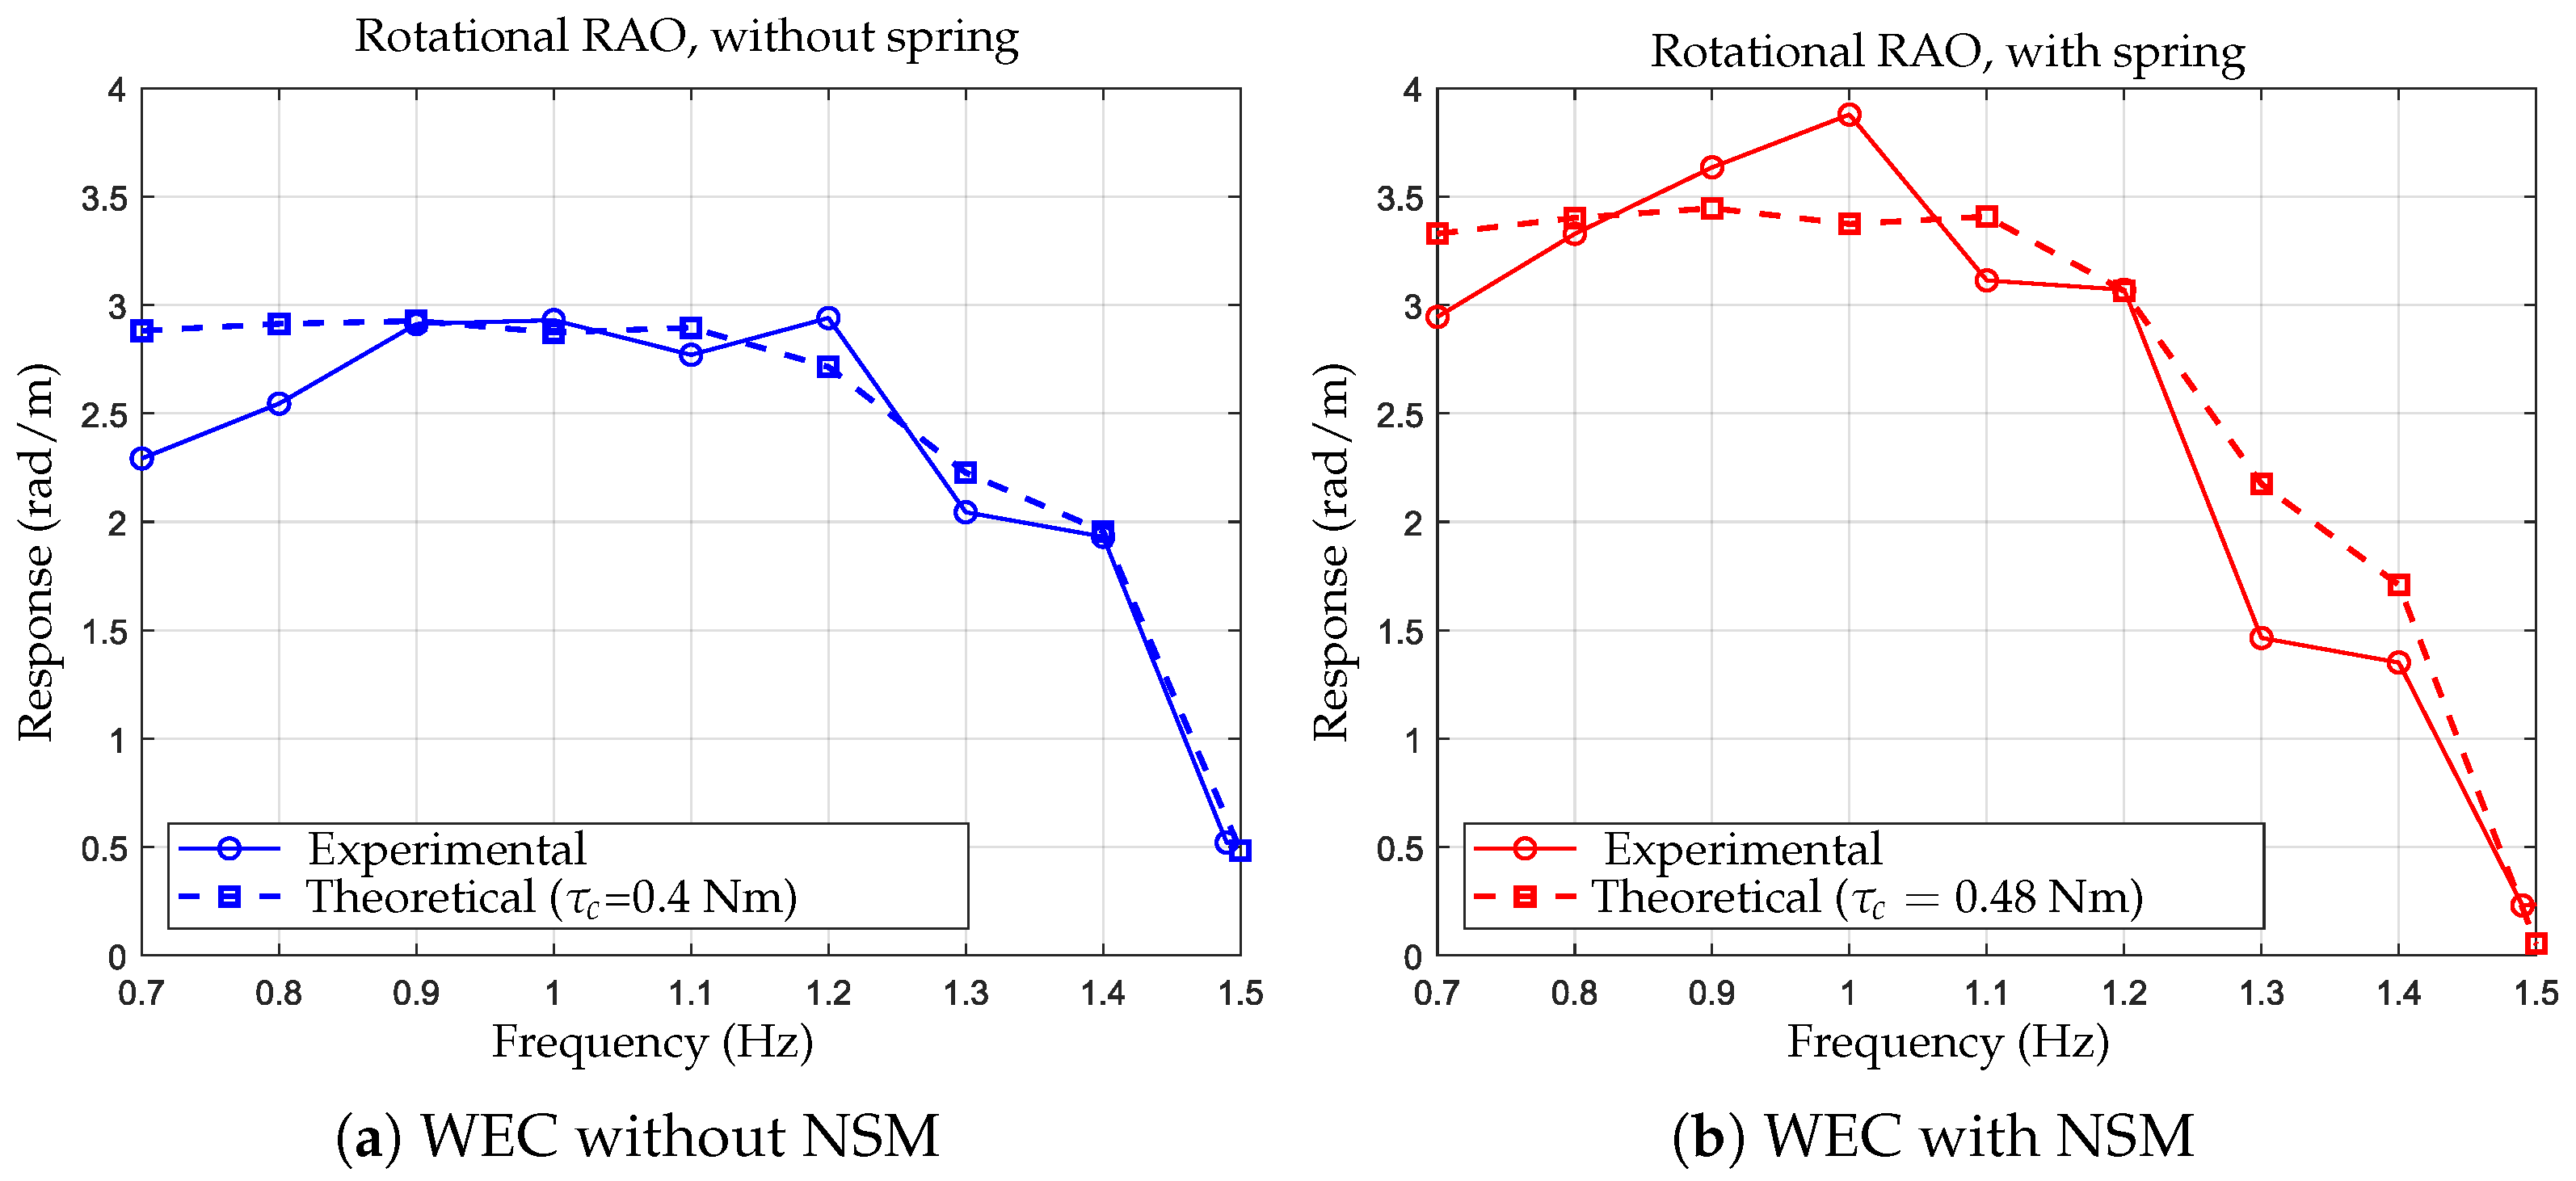
Figure 9a shows the rotational RAO of the WEC in the free configuration (without the nonlinear stiffness mechanism), whereas Figure 9b corresponds to the configuration with the NSM installed. In both cases, the theoretical prediction obtained from the linear hydrodynamic model (Section 2.2.3) is included for comparison with the experimental data.
The rotational RAO of the WEC in the free configuration (without the nonlinear stiffness mechanism) is shown in Figure 9a. The response remains comparatively uniform between 0.8 and 1.2 Hz, forming a resonant plateau instead of a narrow peak. The amplitude reaches values on the order of 2.94 rad/m at 1.2 Hz, and decays for higher frequencies, which is consistent with increased radiative losses and effective damping. This broadband response indicates a reduced sensitivity to small detuning in excitation frequency.
When the pre-compressed spring is installed (Figure 9b), the RAO also exhibits a broadband character, without a single sharp resonant peak in the explored range. A moderate amplification is observed in the mid-band ( 0.8 1.1 Hz), with maximum amplitudes approaching 3.87 rad/m at 1.0 Hz, i.e., higher than the free configuration in that interval. Above ∼1.2 Hz the response with NSM decays more steeply, which is consistent with both higher radiative damping and the additional dissipation inferred from friction at the hinge. Overall, the NSM improves the dynamic sensitivity in the practically relevant band, but owing to the increased effective damping does not produce a pronounced resonant peak.
The linear hydrodynamic model (25) coupled with the nonlinear stiffness defined in (29) reproduces the overall magnitude and flatness of the experimental RAO in the 0.8 1.1 Hz band when hinge dry friction is represented via equivalent viscous damping (iterative procedure in Section 2.2.3). The identified friction torques used for matching, τ c 0.40 Nm (free) and τ c 0.48 Nm (with NSM) explain the observed low-Q response. Minor discrepancies at the band edges (below 0.8 Hz and above 1.1 Hz) can be attributed to amplitude-dependent stiffness and non-ideal friction, which are not fully captured by the linearization around small angles. The experiments confirm a broadband enhancement with the NSM in the mid-band rather than a shift to a narrow resonance, in line with the combined effects of radiation damping and frictional dissipation.
The experimental results are compared to assess the change in the system response after the incorporation of the NSM. The analysis of the experimental RAO shows that the inclusion of the NSM does not produce a uniform increase in the response across all excitation frequencies. As observed in Figure 9, the rotational response increases significantly for frequencies below 1.2 Hz, where the system with NSM exhibits larger amplitudes than the baseline configuration. In this range, for the tests between 0.7 and 1.1 Hz, the average response increases by 25.76 % , and the maximum enhancement occurs around 1.0 Hz, with an increase of 32.36 % . However, for excitation frequencies above 1.2 Hz, the opposite trend is observed: the response with NSM progressively decreases.
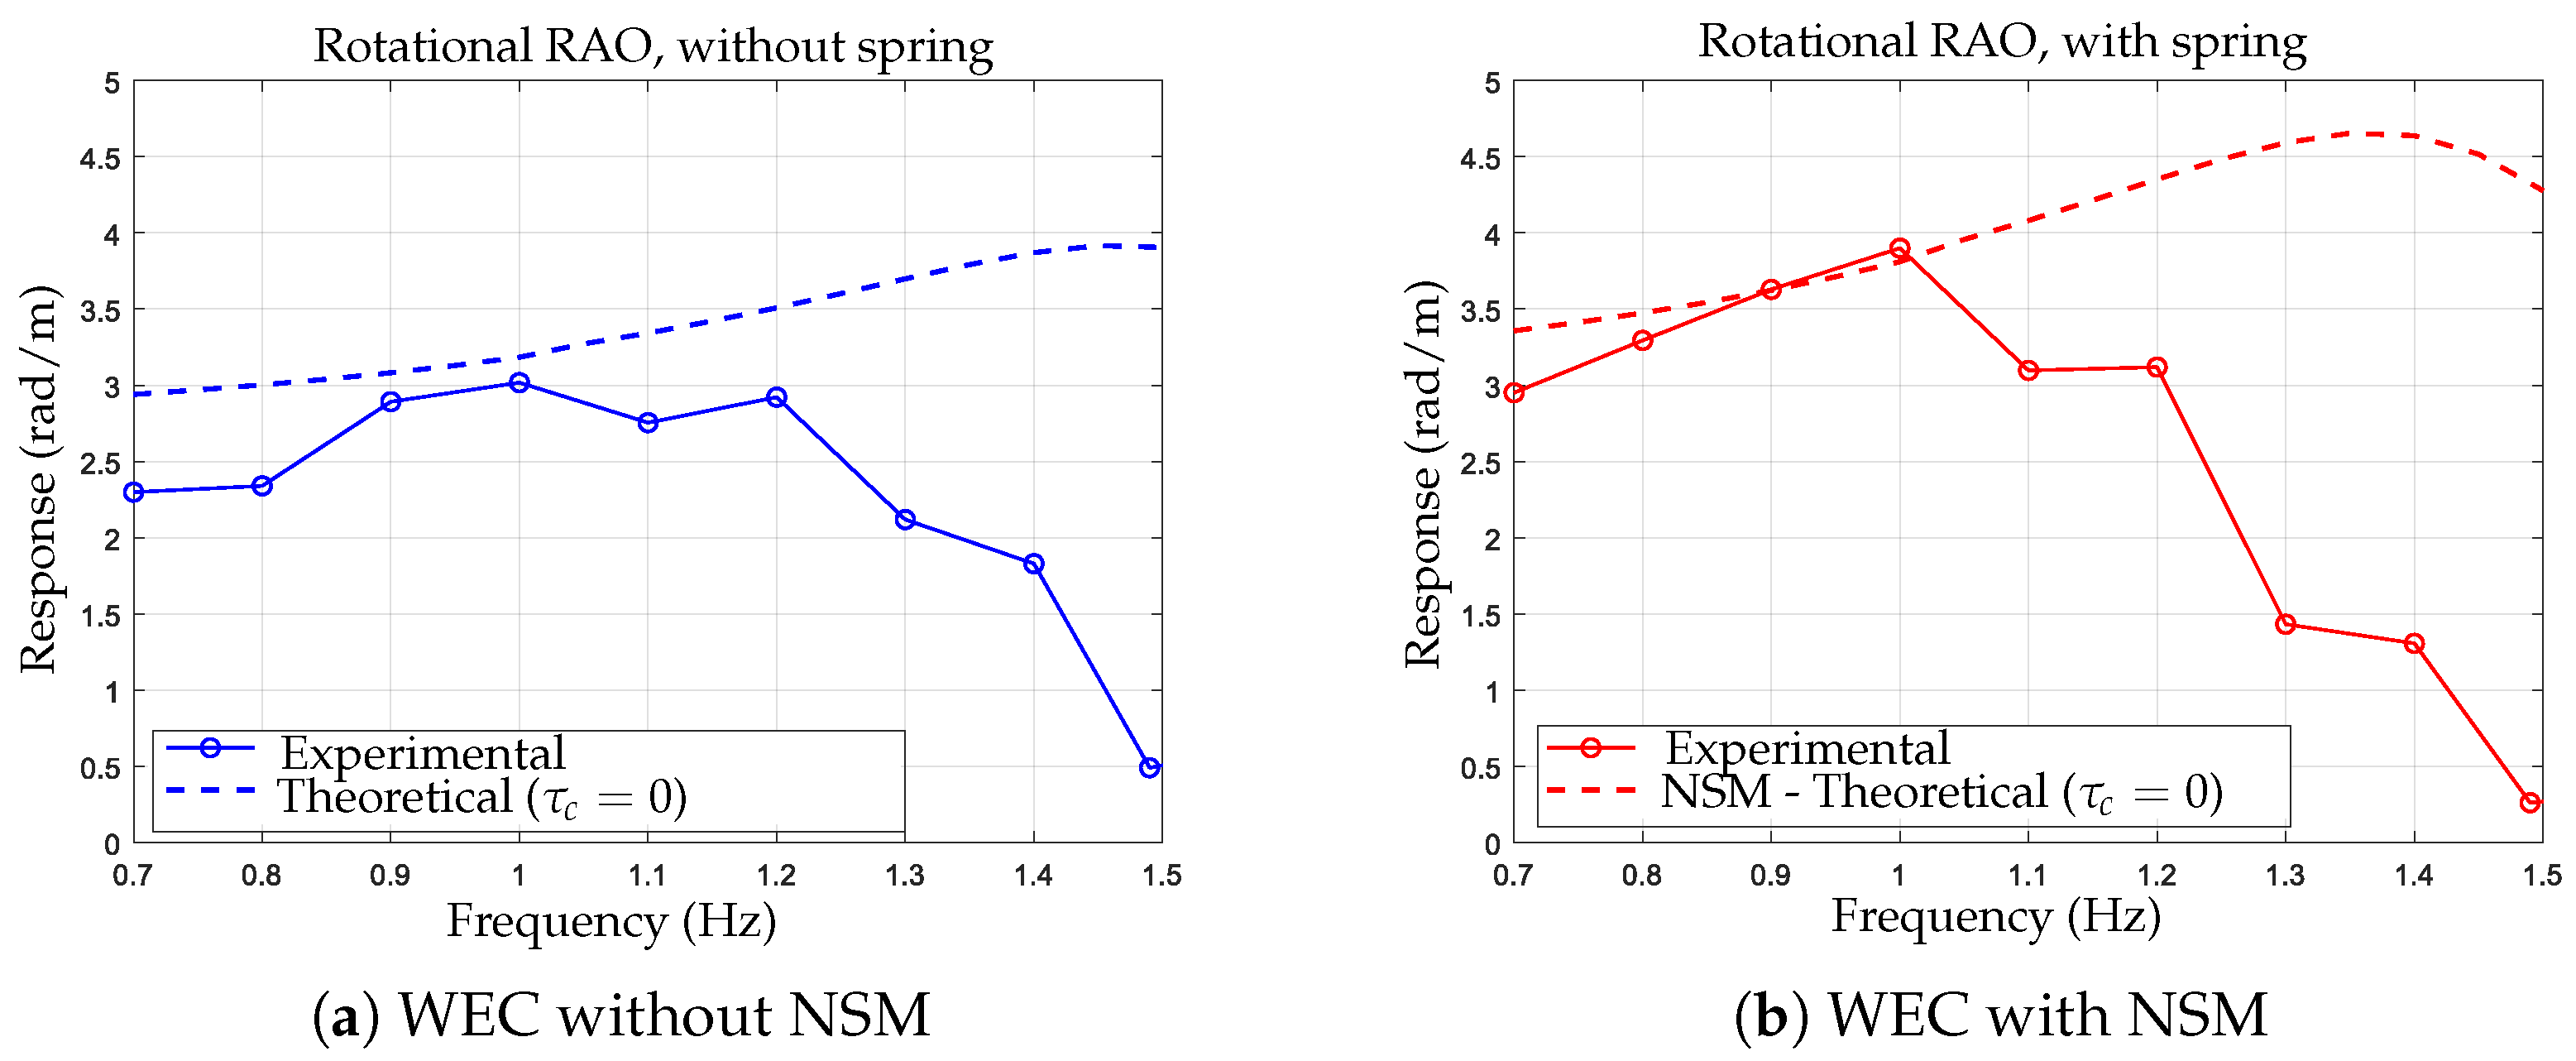
On the other hand, Figure 10 compares the experimental rotational RAO with the theoretical prediction obtained from the linear hydrodynamic model excluding frictional effects. In this case, the predicted amplitudes are systematically higher than the experimental measurements across the entire frequency range. The theoretical curve exhibits a sharp resonance peak near 1.3 Hz (Figure 10b), which is not observed experimentally. This overestimation of the response amplitude confirms that dry friction and other dissipative mechanisms play a significant role in the dynamic behavior of the system. When the equivalent viscous damping associated with hinge friction is incorporated, the predicted RAO aligns much more closely with the experimental data (see Figure 9).
Finally, the theoretical–experimental correspondence is quantified for the four analyzed cases: with and without NSM, and with and without the inclusion of the dry friction model, respectively. The root mean square error (RMSE) values between the experimental and theoretical RAO are summarized in Table 4. It is observed that, when the friction model is incorporated, the theoretical results exhibit a markedly improved agreement with the experimental data. This improvement highlights the relevance of accounting for the dissipative effects induced by dry friction.

4. Conclusions

This study presented a comparative analysis of a pitching point-absorber WEC equipped with a nonlinear stiffness mechanism, combining experimental measurements and linear hydrodynamic modeling. The main conclusions are as follows: (i) The WEC exhibits a broadband response in the 0.7 1.2 Hz range governed primarily by radiation damping and hinge dry friction, which control the overall dynamic behavior. (ii) The inclusion of the pre-compressed spring enhances the mid-frequency response by approximately 25–30%. (iii) Although the linear model captures the main dynamics, residual discrepancies at the band edges indicate the influence of nonlinearities not included in the present formulation. These effects are associated with amplitude-dependent stiffness and non-ideal mechanical damping.
Overall, the results demonstrate that integrating a nonlinear stiffness mechanism constitutes an effective passive strategy to improve the broadband dynamic performance of oscillating WECs and provides a foundation for future full-scale design optimization. Future work will extend the present approach to time domain simulations incorporating amplitude-dependent stiffness and friction, and will evaluate the influence of the NSM under irregular sea states.

Author Contributions

Conceptualisation, F.G.P., C.V. and B.N.; Data curation, F.G.P., C.V., B.N., C.C., V.B., G.T., T.K., B.C. and M.H.; Formal analysis, F.G.P., C.V., B.N., C.C., V.B., G.T., T.K., B.C. and M.H.; Investigation, F.G.P., C.V. and B.N.; Methodology, F.G.P., C.V. and B.N.; Software, F.G.P., C.V. and B.N.; Supervision, F.G.P., C.V. and M.H.; Validation, F.G.P., C.V., B.N. and V.B.; Visualisation, F.G.P., C.V., B.N., C.C., V.B., G.T., T.K., B.C. and M.H.; Writing—original draft, F.G.P., C.V., C.C., V.B. and B.N.; Writing—review and editing, F.G.P., C.V., B.N., C.C., V.B., G.T., T.K., B.C. and M.H. All authors have read and agreed to the published version of the manuscript.

Funding

This research was partially funded by ANID Vinculación Internacional FOVI240018 and by Universidad del Bio-Bio internal project IN2360424.

Data Availability Statement

The original contributions presented in the study are included in the article, further inquiries can be directed to the corresponding author.

Acknowledgments

We thank the Group of Renewable Ocean and Wave Energy GROW-E, UBB, the Department of Mechanical Engineering UBB. We would like to recognizance the financial support of the Chilean National Agency for Research and Development ANID, Vinculación Internacional, project FOVI240018. This work was also supported by the Chilean National Agency for Research and Development ANID Project EQM170065.

Conflicts of Interest

The authors declare no conflicts of interest.

Abbreviations

The following abbreviations are used in this manuscript:
WECWave Energy Converter
NSMNonlinear Stiffness Mechanism
PAPoint Absorber
RAOResponse Amplitude Operator
FFTFast Fourier Transform
RMSERoot Mean Square Error

References

  1. Chen, C.; Pinar, M.; Stengos, T. Renewable energy and CO2 emissions: New evidence with the panel threshold model. Renew. Energy 2022, 194, 117–128. [Google Scholar] [CrossRef]
  2. Ramos, V.; Giannini, G.; Calheiros-Cabral, T.; López, M.; Rosa-Santos, P.; Taveira-Pinto, F. Assessing the effectiveness of a novel WEC concept as a co-located solution for offshore wind farms. J. Mar. Sci. Eng. 2022, 10, 267. [Google Scholar] [CrossRef]
  3. Guo, B.; Wang, T.; Jin, S.; Duan, S.; Yang, K.; Zhao, Y. A review of point absorber wave energy converters. J. Mar. Sci. Eng. 2022, 10, 1534. [Google Scholar] [CrossRef]
  4. Pecher, A.; Kofoed, J.P. Handbook of Ocean Wave Energy; Springer: Cham, Switzerland, 2016. [Google Scholar]
  5. Falnes, J. Ocean Waves and Oscillating Systems; Cambridge University Press: Cambridge, UK, 2002. [Google Scholar]
  6. Schubert, B.W. Performance enhancement of submerged wave energy converters using nonlinear stiffness. Appl. Ocean Res. 2021, 112, 102663. [Google Scholar]
  7. Zhang, X.; Zhang, H.; Zhou, X.; Sun, Z. Recent advances in wave energy converters based on nonlinear stiffness mechanisms. Appl. Math. Mech. 2022, 43, 1081–1108. [Google Scholar] [CrossRef]
  8. Wu, Z.; Levi, C.; Estefen, S.F. Wave energy harvesting using nonlinear stiffness system. Appl. Ocean Res. 2018, 74, 102–116. [Google Scholar] [CrossRef]
  9. Todalshaug, J.; Steinnásgeirsson, G.; Hjálmarsson, E.; Maillet, J.; Möller, P.; Pires, P.; Guerinel, M.; Lopes, M. Tank testing of an inherently phase controlled Wave Energy Converter. In Proceedings of the 11th European Wave and Tidal Energy Conference (EWTEC), Nantes, France, 6–11 September 2015. [Google Scholar] [CrossRef]
  10. Khasawneh, M.A. Exploiting Non-Linearity to Improve the Performance of Point Wave Energy Absorbers. Ph.D. Thesis, ProQuest Dissertations Publishing, Ann Arbor, MI, USA, 2023. [Google Scholar]
  11. Xiao, L.; Zhang, X.; Yang, J. Numerical study of a wave energy converter with nonlinear snap-through stiffness in regular waves. In Proceedings of the 24th International Ocean and Polar Engineering Conference (ISOPE), Busan, Republic of Korea, 15–20 June 2014; pp. 883–890. [Google Scholar]
  12. Têtu, A.; Ferri, F.; Kramer, M.B.; Todalshaug, J.H. Physical and mathematical modeling of a wave energy converter equipped with a negative spring mechanism for phase control. Energies 2018, 11, 2362. [Google Scholar] [CrossRef]
  13. Younesian, D.; Alam, M.R. Multi-stable mechanisms for high-efficiency and broadband ocean wave energy harvesting. Appl. Energy 2017, 197, 292–302. [Google Scholar] [CrossRef]
  14. Zhang, X.; Tian, X.; Xiao, L.; Li, X.; Chen, L. Application of an adaptive bistable power capture mechanism to a point absorber wave energy converter. Appl. Energy 2018, 228, 450–467. [Google Scholar] [CrossRef]
  15. Pierart, F.G.; Campos, P.G.; Basoalto, C.E.; Rohten, J.; Davey, T. Experimental Implementation of Reinforcement Learning Applied to Maximise Energy from a Wave Energy Converter. Energies 2024, 17, 5087. [Google Scholar] [CrossRef]
  16. McCarthy, J.; Ringwood, J.V. Modelling of friction and nonlinear damping in wave energy devices. J. Ocean Eng. Mar. Energy 2020, 6, 291–305. [Google Scholar]
  17. Pierart, F.G.; Fernandez, J.; Olivos, J.; Gabl, R.; Davey, T. Numerical Investigation of the Scaling Effects for a Point Absorber. Water 2022, 14, 2156. [Google Scholar] [CrossRef]
  18. Rao, S.S. Harmonically excited vibration. In Mechanical Vibrations, 5th ed.; Pearson Education: Upper Saddle River, NJ, USA, 2011; pp. 113–180. [Google Scholar]
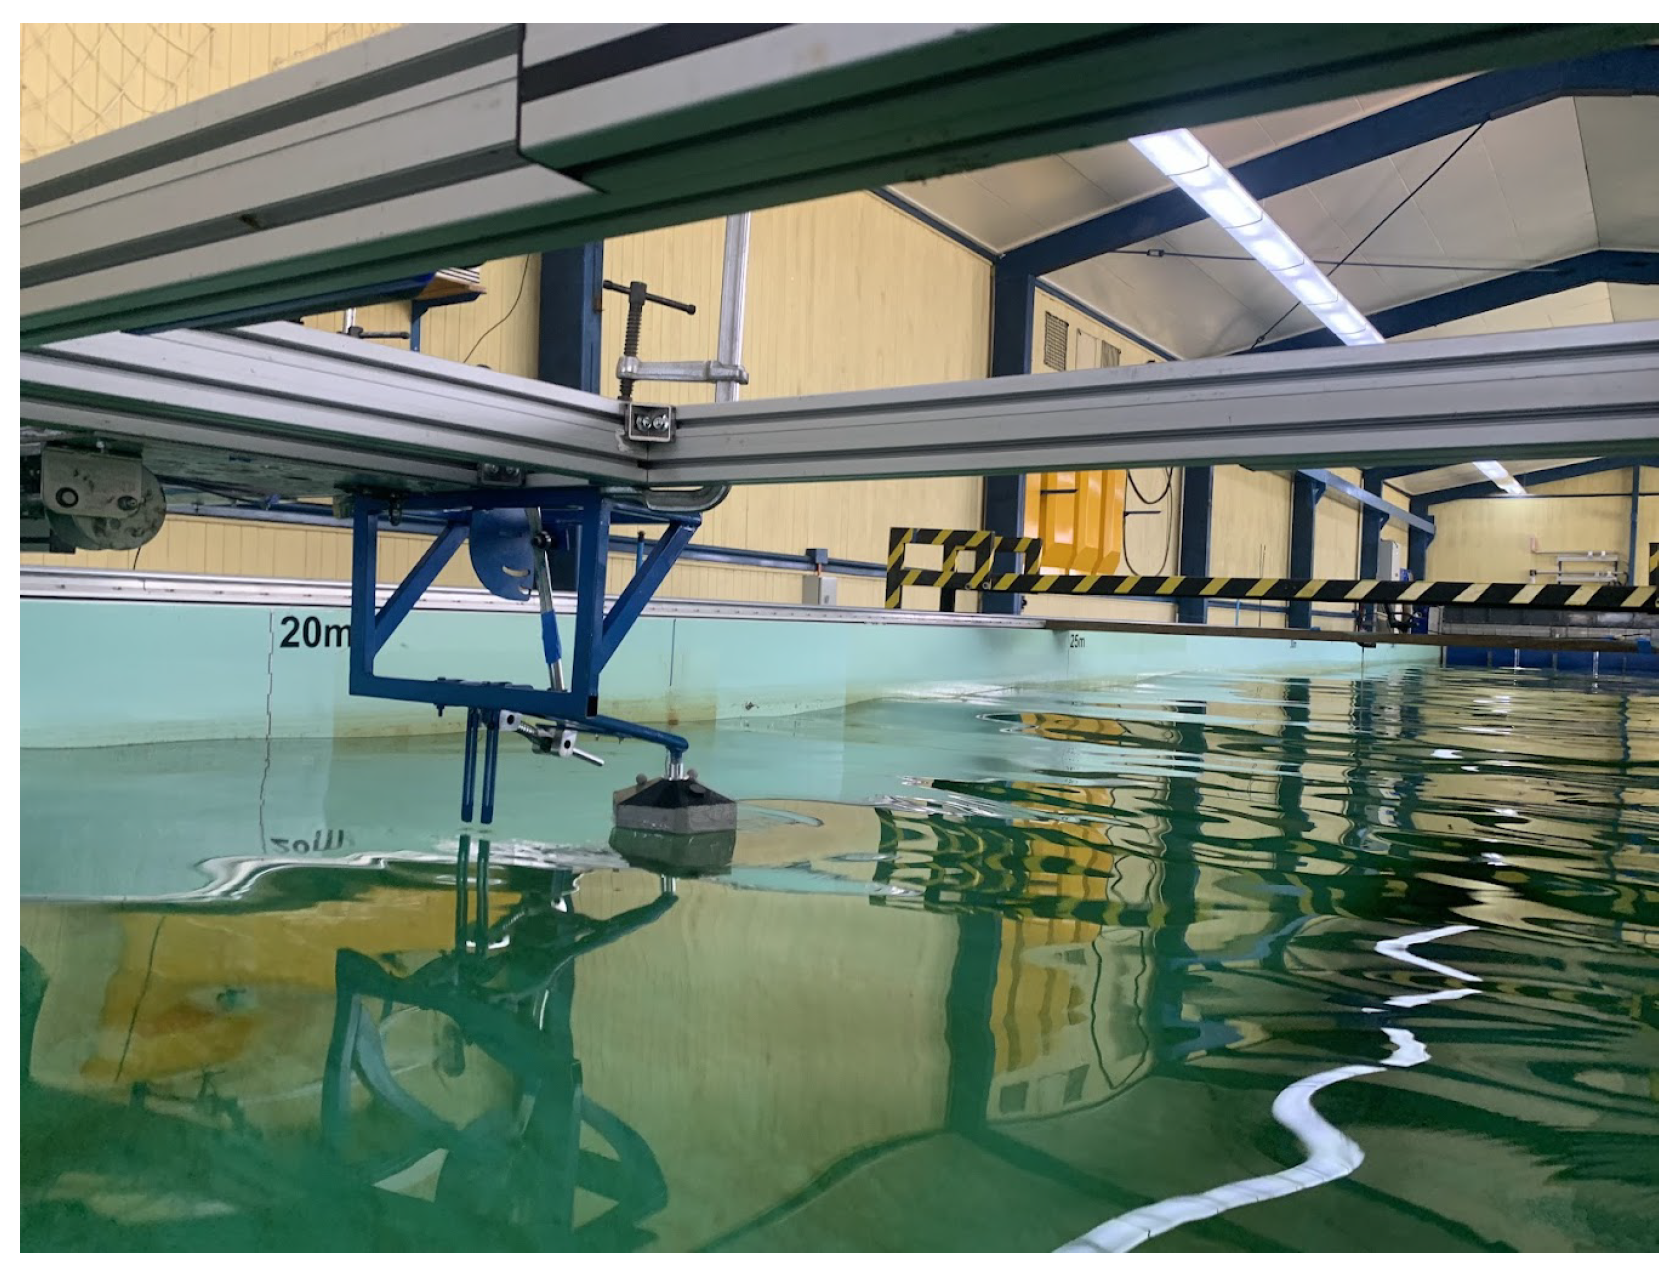
Figure 1. Scaled WEC model installed in the CEH–UACh wave tank.
Energies 18 06022 g001
Figure 2. Lafkenewen WEC at full scale.
Energies 18 06022 g002
Figure 3. Diagram of the scaled WEC with the NSM inspired by the proposed configuration of Têtu et al. [12].
Energies 18 06022 g003
Figure 4. Buoy dimensions in mm.
Energies 18 06022 g004
Figure 5. Example of the simulation performed in ANSYS AQWA®, showing the meshed geometry and pressure distribution on the WEC.
Energies 18 06022 g005
Figure 6. Active forces acting on the WEC.
Energies 18 06022 g006
Figure 7. Active forces on the spring (NSM).
Energies 18 06022 g007
Figure 8. Hydrodynamic coefficients and mesh-convergence analysis obtained from ANSYS AQWA® for four different element sizes expressed in meters.
Energies 18 06022 g008
Figure 9. Comparison between experimental and theoretical RAO for the WEC with and without the nonlinear stiffness mechanism, considering friction effects.
Energies 18 06022 g009
Figure 10. Comparison between experimental and theoretical RAO for the WEC with and without the nonlinear stiffness mechanism, without considering friction effects.
Energies 18 06022 g010
Table 1. Geometric and dynamic properties of the scaled WEC.
PropertyDescriptionValueUnit
m arm Mass of the lever arm and equipment1.216kg
m buoy Mass of the buoy0.864kg
V buoy Buoy volume0.0032m3
SBuoy cross-sectional area0.0314m2
θ 0 Initial inclination angle−0.20rad
A C ¯ Distance between points A and C0.421m
C Q ¯ Distance between points C and Q0.031m
Q B ¯ Distance between points Q and B0.041m
Table 2. Wave parameters used in the experimental campaign.
Excitation Frequency, f (Hz)Wavelength, λ (m)Wave Height H (m)
0.73.18630.1115
0.82.43950.0854
0.91.92750.0675
1.01.56130.0546
1.11.29030.0452
1.21.08420.0379
1.30.92390.0323
1.40.79660.0279
1.50.69390.0243
Table 3. Parameters of the nonlinear stiffness mechanism.
PropertyDescriptionValueUnit
A D ¯ Distance between pivot A and point D0.223m
A E ¯ Distance between pivot A and point E0.314m
l n Natural length of the spring0.260m
k s Spring stiffness430N/m
Table 4. RMSE between experimental and theoretical RAO [rad/m].
ConfigurationWithout Friction ModelWith Friction Model
Without NSM1.3100.256
With NSM2.0020.360
Disclaimer/Publisher’s Note: The statements, opinions and data contained in all publications are solely those of the individual author(s) and contributor(s) and not of MDPI and/or the editor(s). MDPI and/or the editor(s) disclaim responsibility for any injury to people or property resulting from any ideas, methods, instructions or products referred to in the content.