Abstract
Wastewater treatment plants (WWTPs) are critical infrastructures that account for a significant share of global electricity, with aeration alone often responsible for over half of the total demand. Reducing the energy intensity of blower operation is, therefore, essential for sustainable and resilient WWTP management. This study presents a modeling and simulation framework for optimizing parallel blower operation in grit chamber aeration system. The framework integrates a modular structure with a blower model, a distribution network model, and an optimization layer that work together to capture equipment performance, simulate hydraulic interactions, and determine energy-optimal operating strategies under process and safety constraints. Two optimization strategies are compared: a heuristic grid search and a Safe Bayesian Optimization (SBO) method. Both algorithms enforce vendor surge and overheat limits, network pressure constraints, and process requirements. Simulation campaigns under representative demand scenarios show that both approaches achieve feasible operating points, while SBO consistently demonstrates higher energy savings and substantially faster runtime. Overall, the findings highlight the potential of data-driven optimization for achieving efficient and safe blower control, with reduced computation time making progress for real-time supervisory optimization in WWTPs.
1. Introduction
Water is a fundamental resource for human well-being, economic development, and ecosystem services. As scarcity intensifies due to population growth, urbanization, and climate change, the reuse of every possible drop within the urban water cycle becomes more and more important. Wastewater Treatment Plants (WWTPs) are central to this objective [1]; they are considered critical infrastructures that make possible the safe treatment of urban and industrial waters, consuming more than 5% of global energy [2]. Global assessments highlight that the role and load of wastewater treatment will continue to expand, with an expected increase of 24% by 2030 and 51% by 2050 [3]. Addressing this challenge in a sustainable way requires improvement in the persistent gap between process performance and energy efficiency [4].
WWTPs are considered to be among the most energy-intensive infrastructures where electricity is consumed by pumps, mixers, blowers, and ancillary systems. From these energy-consuming components, aeration processes are consistently reported as the dominant load, often accounting for more than 52% of a plant’s total electricity use [5]. This high energy demand directly increases operational costs and contributes to indirect greenhouse gas emissions in power systems that remain reliant on fossil fuels. Moreover, disruptions, that could be physical, cyber–physical, or linked to energy supply shortages, can quickly compromise public health and environmental safety [6]. A recent study demonstrates the importance of integrating stochastic and interoperable simulation frameworks to prepare decision makers for the strategic management of critical infrastructures [7]. Therefore, enhancing the energy efficiency and resilience of wastewater treatment plants is not only an environmental priority but also an economic and security necessity.
Wastewater treatment plants (WWTPs) are typically organized into sequential treatment phases, as shown in Figure 1, each of which plays a distinct role in safeguarding effluent quality and environmental protection. The preliminary treatment stage uses screens, grit chambers, and grease traps to remove large solids and inert materials. Aerated grit chambers and grease traps further enhance particle separation and minimize odors by injecting air during the process. The primary treatment phase, centered on sedimentation in clarifiers, could also include surface aeration to control scum accumulation and reduce septic conditions. In the secondary treatment, which is dominated by biological processes, aeration becomes indispensable: activated sludge systems and biological reactors rely on oxygen transfer to sustain microbial communities that degrade organic matter and nutrients. Even in the tertiary and advanced treatment stages, aeration can appear again, for instance, in nitrification–denitrification processes, polishing ponds, or advanced oxidation systems, where oxygen availability influences both chemical and biological reactions. Thus, although the aeration basin is traditionally identified as the major energy hotspot, aeration requirements are embedded across multiple treatment stages [8].
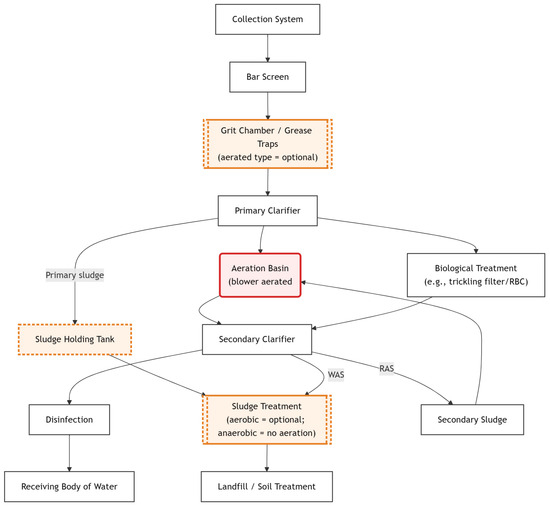
Figure 1.
Schematic representation of a wastewater treatment plant with aeration processes indicated.
This pervasive reliance on oxygen supply underscores both the technical necessity of aeration for treatment performance and its centrality to the overall energy footprint of WWTPs. A broad range of studies have investigated strategies to optimize aeration efficiency. On the process side, approaches include operation at reduced dissolved oxygen (DO) set-points, ammonia-based aeration control (ABAC), intermittent or step-feed aeration, and the use of advanced selectors to lower overall oxygen demand [9]. On the equipment side, advances such as high-efficiency blowers with variable-speed drives, fine-bubble diffuser systems with optimized layouts and maintenance practices, and real-time airflow distribution control across treatment basins have been widely reported [10]. Increasingly, these process and equipment measures are being integrated under advanced control paradigms, including robust proportional–integral–derivative (PID) and feedforward strategies, model predictive control (MPC), soft sensors for ammonium and oxygen uptake rate, and plant-wide supervisory optimization frameworks, all designed to balance effluent quality objectives with energy efficiency [11].
Most of the existing strategies for energy reduction in wastewater treatment plants concentrate heavily on dissolved oxygen (DO) control at the process level [10]. While improved DO regulation can indeed reduce oxygen demand, these methods often overlook the fact that the largest share of energy is consumed by the blowers themselves, whose efficiency strongly depends on their operating points, load sharing, and parallel coordination [12]. In practice, multiple industrial blowers operate in parallel in these plants. The overall energy efficiency depends not just on the amount of oxygen supplied but also on which blowers are running. It also depends on how airflow is distributed among them and whether each blower is working within its optimal efficiency range. It is important to address these aspects and to consider that energy savings achieved through oxygen-level optimization may be undermined if blower operation drifts away from efficiency islands. There is a pressing need for strategies that explicitly target the control and optimization of blower operation, coordinating the number of active units and their load distribution in real time [13]. Such approaches could enable WWTPs to simultaneously maintain effluent quality and achieve substantial reductions in energy use by embedding equipment-level optimization into plant-wide control frameworks.
With wastewater services expected to expand significantly, reducing the energy intensity of treatment processes has become a pressing priority. Conventional dissolved oxygen (DO) set-point control, while effective for biological regulation, does not directly address the dominant energy burden of blower operation. To overcome this limitation, the present study introduces a modeling and simulation framework that combines detailed equipment models with optimization methods to jointly manage variable oxygen demand and the coordinated operation of parallel blowers. The framework explicitly integrates blower efficiency characteristics together with vendor-defined surge and overheat constraints, ensuring that operating points remain confined to safe and energy-efficient regions. Airflow requirements are dynamically distributed across available blowers, thereby minimizing throttling losses and inefficiencies associated with parallel operation. To cope with influent variability and changing environmental conditions, data-driven forecasting of oxygen demand is employed, enabling adaptive adjustment of blower schedules. By embedding detailed equipment physics into an optimization-driven supervisory layer, the approach provides a structured pathway to reduce energy consumption while maintaining effluent quality and operational stability. In addition, the study draws on recent advances in Safe Bayesian Optimization [14], highlighting the potential of such methods for enabling real-time supervisory control under strict safety constraints. The contribution of this work consists of introducing a simulation-based framework that integrates detailed blower performance maps, hydraulic network modeling, and safety-constrained optimization to support energy-aware coordination of parallel blowers under variable demand. Furthermore, it delivers a comparative assessment of grid search and Safe Bayesian Optimization (SBO), quantifying their energy-saving potential.
1.1. Literature Review
Improving the energy efficiency of aeration in WWTPs has long been a central research focus due to its dominant share in overall power demand. Early investigations concentrated mainly on process-level dissolved oxygen (DO) control to avoid oversupply of oxygen while safeguarding effluent quality. Classical approaches such as reduced DO set-points, intermittent aeration, and ammonia-based aeration control (ABAC) demonstrated measurable energy savings at full-scale facilities [9,15]. Despite their effectiveness in lowering oxygen demand, these strategies often overlooked the performance characteristics of the aeration hardware itself, where most of the energy losses occur.
On the equipment side, the introduction of high-efficiency turbo blowers equipped with variable-frequency drives (VFDs) and improved diffuser layouts has been widely reported to reduce specific energy consumption [10,16]. Additional contributions targeted distribution losses; for example, the most-open-valve (MOV) strategy was adopted to minimize throttling effects across branch valves [17]. Advanced supervisory-level control schemes based on model predictive control (MPC), soft-sensor-assisted feedback, and hybrid rule-based systems have further enhanced DO stability and lowered power use in activated sludge basins [11,18]. However, many of these approaches remain site-specific and do not generalize well to the coordinated control of multiple parallel blowers operating under nonlinear efficiency curves and safety limits such as surge and overheat boundaries.
Recent studies emphasize the need to integrate blower performance maps with hydraulic network models to better capture the interaction between aeration equipment and distribution systems. This body of work has explored advanced strategies, ranging from reinforcement learning-based aeration control to energy-aware flow-control methods for parallel blowers. In the meantime, the growing adoption of data-driven approaches is opening new opportunities for real-time supervisory control under strict safety constraints [19].
Despite these advances, the literature still lacks plant-deployable frameworks that unify detailed blower performance modeling, network hydraulics, and optimization under operational uncertainty. For instance, ref. [20] demonstrated that advanced hybrid (LSTM–Fuzzy/Decision Tree) and AI-driven control systems can substantially improve dissolved oxygen regulation and energy efficiency in full-scale wastewater treatment plants. However, their approach is primarily limited to process-level control and does not integrate detailed blower hardware modeling, network hydraulic dynamics, or coordinated optimization of multiple blowers under plant-wide constraints. At the same time, as emphasized by Mannina et al. [21], there is a critical need for comprehensive, plant-wide frameworks that holistically optimize the interplay between plant hydraulics, aeration hardware, and supervisory control under operational uncertainty. The present study addresses this gap by proposing a modular modeling and simulation (M&S) framework that integrates both heuristic grid search and Safe Bayesian Optimization (SBO) strategies, explicitly enforcing surge and overheat constraints while coordinating parallel blower operation in a representative grit chamber aeration system.
The heuristic grid search strategy employed involves discretizing the decision space of blower operational settings and exhaustively evaluating combinations to identify those that optimize energy efficiency while respecting constraints. This approach is straightforward and guarantees coverage of the search space but can become computationally prohibitive as the dimensionality increases.
In contrast, Safe Bayesian Optimization (SBO) provides a more efficient, probabilistic framework that constructs a surrogate model of the objective function, using Gaussian processes to predict performance and quantify uncertainty. SBO iteratively selects new candidate solutions by balancing exploration of uncertain regions with exploitation of known high-performing areas. Crucially, it embeds safety constraints by excluding candidate settings predicted to violate surge or overheat limits, ensuring that optimization steps are conservatively confined within operationally safe regions.
Compared to previously used methods in the literature, which largely focus on process-level control without integrating detailed blower performance and hydraulic dynamics or use unconstrained optimization approaches, this study couples a modular simulation of blower operation and network hydraulics.
1.2. Research Objectives and Contributions
The primary objective of this study is to establish a robust, scalable modeling and simulation (M&S) framework that unifies detailed blower performance modeling, aeration network hydraulics, and real-time optimization for energy-efficient operation of wastewater treatment plant (WWTP) aeration systems. The framework is explicitly designed for practical, plant-wide deployment; it captures both the physical and operational complexity of multi-blower configurations. Furthermore, it incorporates vendor-validated surge and overheat constraints for blower performance.
Key contributions of this work include (i) the development of a modular M&S platform that links high-fidelity blower maps, quadratic hydraulic loss modeling, and constraint-aware supervisory optimization within a single simulation environment; and (ii) the demonstration of Safe Bayesian Optimization (SBO) in direct comparison with heuristic grid search, quantifying gains in energy savings and runtime efficiency. By addressing the persistent gap, this study advances both the methodology and practical implementation of data-driven aeration control.
This manuscript is organized as follows: Section 2 describes the case study system and modeling approach, Section 3 reports the comparative results and sensitivity analyses of the proposed optimization strategies, Section 4 discusses practical implications, limitations, and further research needs, and Section 5 concludes with key findings and perspectives for the adoption of smart, energy-aware control in modern WWTPs.
2. Materials and Methods
2.1. Case Study Context: Grit Chamber Aeration in WWTPs
The present study focuses on a representative wastewater treatment plant (WWTP) configuration where grit chambers are equipped with aeration facilities to ensure the effective removal of sand, grease, and inert solids. The configuration with grit chambers equipped with aeration and multiple parallel tanks fed by centrifugal blowers through a common air distribution header is consistent with widely adopted engineering practices for medium to large wastewater treatment plants. The centrifugal blowers are connected to a common air distribution header, enabling parallel operation and simultaneous airflow delivery to multiple grit chambers. This configuration allows for flexible blower staging and load sharing, optimizing energy use while maintaining reliable aeration performance across the grit aeration system. As described in Metcalf & Eddy’s Wastewater Engineering: Treatment and Resource Recovery (5th Edition), aerated grit chambers utilizing multiple tanks and centralized blower systems are recognized as standard approaches for effective grit removal and for stabilizing influent loads prior to downstream biological treatment. In this specific facility, aeration is supplied by three centrifugal blowers connected to a common air distribution header that feeds multiple grit tanks. The key parameters and operating characteristics are summarized in Table 1.

Table 1.
Key design and operating parameters of the case study’s grit aeration system.
Under standard operating policies, one or two blowers are run in parallel while the third is maintained as standby capacity, ready to take over during maintenance or load peaks. This configuration reflects standard industrial practice, in which redundancy is built in to guarantee operational reliability, yet it simultaneously raises complex challenges related to the efficient coordination of parallel blower operation, equitable load distribution, and overall energy performance.
The grit chambers precede the primary sedimentation stage and, therefore, handle highly variable influent conditions, with flow rates strongly dependent on diurnal and seasonal cycles. These characteristics make the system an ideal case study for developing and testing advanced energy optimization strategies. The approach adopted in this study relies on modeling and simulation techniques [22] that integrate a detailed blower model, an air distribution network model, and an optimization layer. These components work together to capture the coupled behavior of equipment and process dynamics, as will be further described in the following sections.
2.2. Blower System Modeling
The blower system is the primary energy consumer in the grit chamber aeration line, and its accurate modeling is fundamental to the analysis. Centrifugal blowers generate the pressure required for grit chamber aeration by imparting kinetic energy to the air through a rotating impeller. Air enters axially at the impeller eye and is accelerated radially outward by the impeller vanes; the high-velocity stream is then decelerated in the diffuser and volute sections, where velocity pressure is progressively converted into static discharge pressure.
The blower model was developed to reproduce the relationships between discharge pressure, airflow rate, and rotational speed (Figure 2). Two main modeling approaches are typically considered: physics-based models and data-driven numerical approximations. Physics-based models require detailed design parameters of the blower and can capture operating behavior with high fidelity, but such data are often unavailable. Data-driven approaches instead rely on manufacturer performance maps. Among these, polynomial fitting is widely used to approximate the pressure–flow curve, with scaling laws applied to generate additional curves at varying speeds [16]. This approach is computationally efficient and only requires standard data sheet values. Another option is the table-lookup method, which interpolates between measured curves. While this can provide higher accuracy, it is computationally more demanding and, therefore, less suited for long simulations. For this study, polynomial approximation was adopted, as it offered a good compromise between accuracy and computational efficiency. To quantitatively assess this choice, the fitted polynomial curve was compared against the original vendor-supplied pressure data for the full operating range. The mean absolute error (MAE) between the polynomial predictions and the vendor data was 0.91 kPa with a maximum deviation of 1.82 kPa. These results correspond to deviations within a 5% tolerance across the blower’s operating range, thus confirming that the polynomial fit provides sufficient accuracy for system-level simulation and optimization. Manufacturer-provided blower maps, including pressure–flow characteristics at multiple speeds and power–flow–speed relations, served as the reference dataset for the modeling process.
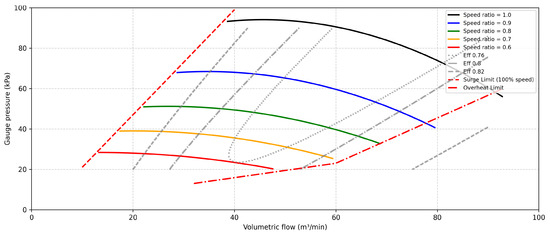
Figure 2.
Polynomially fitted performance map of the blower showing the relationship between gauge pressure and volumetric flow across multiple speed ratios (0.6–1.0). Solid curves denote different operating speeds, gray lines indicate iso-efficiency boundaries (), and dashed red lines represent the surge and overheat limits, collectively defining the safe operating envelope for the blower.
A critical operational constraint of centrifugal blowers is surge, an instability that occurs at low-flow conditions when the pressure generated by the impeller exceeds the amount that can be sustained by the system. Surge events can cause large flow reversals, vibrations, and potentially catastrophic mechanical failure, especially in single-stage high-speed machines. To avoid operating near this unstable region, manufacturers define a surge line on the performance map and often recommend a conservative surge-avoidance margin that limits the low-flow operating range. Modern control schemes enhance safety either by keeping the operating point above a predefined surge-avoidance line or by implementing incipient-surge detection, which monitors inlet and outlet pressure fluctuations and reacts rapidly to stabilize the flow [23]. In the present study, the blower model reproduces the head–flow–efficiency relationships from vendor curves and incorporates surge limits so that the subsequent optimization respects both efficiency range and stability constraints during parallel operation.
In addition to the surge margin, the blower model must respect the vendor-defined overheat limit, which constrains operation to regions where discharge temperatures remain within allowable bounds. Exceeding this limit can accelerate material degradation, reduce bearing seal life, and, in severe cases, cause thermal shutdowns. For this reason, the overheat curve provided in the Performance Data Sheet (PDS) is enforced in the model as a hard constraint. Any operating point that falls beyond this boundary is considered infeasible, ensuring that simulated blower schedules remain consistent with safe thermal operating conditions.
The representative demand scenarios for the simulations were derived from the operating range specified in the manufacturer’s performance curves for the blowers. These curves define the relationship between airflow capacity, pressure, and power consumption under various operating conditions. The selected demand scenarios, thus, cover the full range of blower operational capacities as recommended by the manufacturer, including typical, peak, and minimal airflow and pressure conditions.
Since the PDS performance curves are referenced to nominal inlet conditions, the blower model applies affinity-law corrections combined with a density-ratio adjustment to capture off-design operating conditions. Specifically, pressure rise scales with the square of the speed and volumetric flow with the speed itself, while power varies with the cube of the speed [23]. To account for deviations in inlet air density due to changing temperature and pressure, these corrected values are multiplied by the ratio of actual to nominal density.
This correction procedure ensures that the blower model remains valid under realistic ambient variations and provides accurate operating characteristics when embedded in the system-level simulation. The resulting model allows blower operation to be simulated in both steady-state and dynamic scenarios, enabling the optimization layer to identify energy-efficient set-points while maintaining safe operation.
2.3. Air Distribution Network Modeling
The grit aeration system consists of a header and branch piping network delivering air from the blowers to multiple grit tanks. The network is modeled using fluid mechanics principles, specifically the Darcy–Weisbach equation for pressure losses along pipes. The operating point of the aeration system is determined by the intersection between the system load curve and the blower characteristic . The load curve, defined by the hydraulic resistance of the header and piping network, relates the required pressure rise to the delivered flow. Under quasi-steady conditions, it is well approximated by a quadratic law:
where accounts for static back-pressure and fixed losses, while k is an aggregate resistance coefficient representing pipe friction, fittings, and valve settings [24]. The blower curve expresses the pressure–flow relationship at a given rotational speed N, and the intersection of the two curves yields the equilibrium operating condition .
A sensitivity analysis was performed to quantify the influence of the aggregate resistance coefficient (k) on model performance. The analysis consisted of systematically perturbing the value of k by ±5% within a plausible range and assessing the corresponding effects on key model outputs, specifically pressure and flow predictions. Model accuracy was evaluated using standard error metrics, including mean absolute error (MAE), root mean square error (RMSE), and standard deviation, to capture both average and dispersion effects. Confidence intervals were computed to assess the precision of error estimates. Additionally, statistical significance was tested using t-test to compare the mean error against zero, and an F-test was applied to verify homogeneity of variances across scenarios. These procedures align with best practices in wastewater modeling sensitivity analysis, as outlined in the literature [25]. This combined methodology provides a robust basis to evaluate both the magnitude and statistical reliability of the model’s response to variations in k, supporting subsequent interpretation of results and prioritization for calibration.
An increase in rotational speed shifts the blower curve upward according to the turbomachinery affinity laws, thereby moving the operating point toward higher flow. Ambient variations in density are captured through density-ratio corrections, ensuring that the model remains consistent under off-design inlet temperature and pressure conditions.
For multiple blowers operating in parallel, the system curve remains unchanged, while the aggregate blower characteristic follows flow additivity at a common discharge pressure:
The resulting operating point is given by the intersection of with the system curve . For identical blowers running in hydraulically symmetric branches at a common speed , the flow is partitioned nearly uniformly across units, with deviations attributable to manufacturing tolerances and network asymmetries.
By combining this blower–system interaction with the distribution model based on Darcy–Weisbach losses and valve characteristics, the framework captures the nonlinear dependencies between blower operation, network hydraulics, and downstream aeration demand. This enables the evaluation of energy-optimal set-points while enforcing surge, overheat, and network pressure constraints.
2.4. Optimization Framework
At the highest level, the proposed framework incorporates an optimization layer that coordinates blower operation and airflow distribution across the grit tanks. This layer is responsible for identifying energy-efficient set-points while ensuring that operational safety and process requirements are satisfied. The optimization problem is formulated over two categories of decision variables: (i) the on/off states of the blowers and (ii) their operating speeds, expressed as normalized speed ratios relative to nominal values. Distribution valve settings are also included, ensuring that the optimization accounts for both equipment- and network-level interactions.
The formal objective is to minimize the total electrical power consumption augmented by operational penalties, as given by
subject to process and safety constraints:
Here, penalizes frequent blower switching, penalizes large ramping steps in blower speed, and are weights setting their relative importance. The feasible set A is structurally simple: a hyper-rectangular domain defined by vendor specifications and operational ranges (speed bounds, surge/temperature/vibration limits, and availability exclusions). This makes feasibility checks computationally trivial.
At each control cycle, the optimizer receives as inputs the grit tanks’ air demand D, blower availability status (from SCADA/PLC or operator input), and loss coefficients of the distribution network. From these, the quadratic system curve as reported in (3) is assembled and intersected with the aggregated blower characteristics (affinity-scaled, density-corrected). A pressure projection step scales all active blower speeds by a factor to enforce compliance with the header pressure set point.
Two solution strategies were implemented and tested comparatively. The first is a heuristic grid search with feasibility pruning, which explicitly enumerates small candidate sets of duty units (typically one or two blowers, with a third in standby) and sweeps a discretized speed grid,
For each candidate, blower maps are evaluated, the header pressure projection is applied, and infeasible points (violating surge, overheat, or demand satisfaction) are discarded. The minimizer of (4) over the feasible set is then selected. This strategy is robust and near-global, though its runtime increases with the discretization resolution.
The second approach is Safe Bayesian Optimization (SBO), which treats the objective in (4) as a black box: nonlinear, non-convex, and without analytic gradients. SBO constructs a Gaussian Process surrogate of using a radial basis function (RBF) kernel and iteratively proposes new evaluations using the Expected Improvement (EI) acquisition function. Safety is guaranteed by restricting candidates to the feasible domain, with surge and overheat envelopes explicitly enforced. A minimum of five warm-up samples are collected before applying an early-stopping rule, reducing unnecessary evaluations.
The comparative use of grid search and SBO highlights a key trade-off. Grid search provides a transparent and exhaustive baseline, valuable for benchmarking and validation. SBO, on the other hand, achieves sample-efficient refinement and is scalable to real-time deployment, especially under drifting or uncertain conditions. Together, these results demonstrate how the same problem formulation can be solved by two distinct strategies, enabling both accuracy and adaptability to be assessed under consistent assumptions.
Both optimization methods were implemented in Python 3.10.9 within the same simulation platform, integrating blower performance maps, affinity and density corrections, and the network model. Penalty terms from (4) are enforced consistently, and feasibility checks guarantee safe operation across all scenarios.
2.5. Simulation Environment
The system has been built within a Python-based simulation environment that brings together all the key components in one framework. It combines the blower performance module, based on vendor curves, with a network flow solver that uses the Darcy–Weisbach formulation to capture nonlinear pressure–flow interactions. On top of this, different optimization routines are embedded along with interfaces for visualization and data logging. A Tkinter GUI is employed to provide interactive control and deliver clear graphical output, as illustrated in Figure 3.
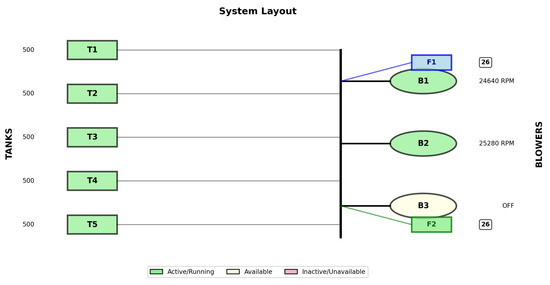
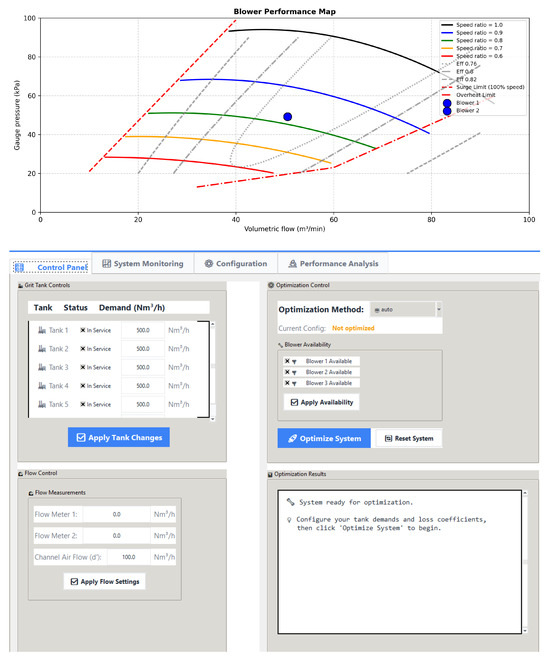
Figure 3.
Interface of the simulation environment: (top plot) shows the system layout, (middle plot) shows blower operating points, and (bottom plot) displays the control panel for tank demand, blower availability, optimization control, and results.
To evaluate the proposed framework, simulation campaigns were carried out across multiple demand scenarios, with the simulation outputs rigorously validated against tabulated performance data provided by the blower manufacturer. This validation process ensured that the computed power consumption was closely aligned with vendor-supplied power–flow–speed relationships across its operating range. The simulation results focused on power consumption improvements, enabling quantification of potential energy savings and providing a comprehensive evaluation of system performance across a range of operating conditions.
3. Results
The comparative evaluation of grid search (GS) and Safe Bayesian Optimization (SBO) was performed on vendor-specified operating points scaled to represent both single- and dual-blower demand scenarios. Across all tested demand levels, both optimization approaches consistently generated feasible operating set-points that satisfied the system requirements. In every case, the air demand imposed by the grit tanks was met, header pressure was maintained within the prescribed tolerance band, and blower operation remained within the safety boundaries defined by the manufacturer including surge and overheat limits. The blower power consumption model employed in this study has been validated against manufacturer-provided tabulated data and performance curves for a realistic representation of blower operation under varying airflow conditions. The reported percentage of energy savings corresponds to the kilowatt-hours (kWh) saved per operational scenario, based on power consumption calculations derived from manufacturer data.
Table 2 reports the measured energy savings, runtimes, and evaluation counts for each representative scenario. GS, being exhaustive, evaluates every candidate combination on a predefined grid of blower speeds. This makes it reliable for identifying near-global optima in single-blower cases but leads to rapid combinatorial growth as the number of active blowers increases. For example the single-blower low-demand case required only 9 evaluations and ran in about 1 s whereas the dual-blower low-demand case already needed nearly 100 evaluations with a runtime of about 20 s. In the triple-blower high-demand configuration the search expanded to 260 evaluations and the runtime rose to above 60 s, and at very high demand the runtime reached 72 s with 280 evaluations.
Table 2.
Performance comparison of grid search (GS) and Sequential Bayesian Optimization (SBO) across example scenarios.
SBO avoided this scaling penalty by sampling the decision space adaptively. It converged in fewer than 35 evaluations even in the most demanding triple-blower scenarios and kept runtimes below 11 s while maintaining energy savings comparable to GS. A notable case is the dual-blower low-demand scenario where SBO achieved 32.8 % energy saving compared with 28.0 % for GS yet required only one-quarter of the runtime (4.8 s vs. 19.9 s). The computational complexity of the algorithms differs with system size. Grid search (GS) shows exponential increases in runtime, from about 1 s with a single blower to over 70 s for three blowers, highlighting combinatorial scaling challenges. Sequential Bayesian Optimization (SBO), by contrast, scales more gracefully, with runtimes growing modestly from 3 to 10 s, indicating a more computationally feasible approach for complex systems.
Considering the full set of operating scenarios reported in Table 2, the performance comparison between GS and SBO reveals a broadly similar behavior in terms of achievable energy savings, with GS reaching values in the approximate range of 25–33% and SBO achieving comparable figures across all cases. Both approaches, therefore, demonstrate the capability to identify operating points that substantially reduce power consumption relative to baseline vendor specifications while still meeting the fundamental process and safety requirements of the aeration system.
The most evident distinction between the two strategies lies in the computational effort required to obtain these solutions. While GS explores the search space through exhaustive enumeration of discrete speed combinations, SBO relies on an adaptive sampling process that narrows the exploration to the most promising regions of the feasible set. This difference becomes increasingly important as the number of active blowers grows and the dimensionality of the problem expands. The data in Table 2 illustrate that GS experiences a sharp increase in runtime as additional blowers are brought online, while SBO maintains a relatively stable computational footprint even under more demanding conditions.
The two methods demonstrate closely comparable energy-saving performance, suggesting that either approach could offer significant operational benefits when integrated into supervisory control frameworks. However, the consistently shorter runtime of SBO opens the road for practical deployment in scenarios that demand frequent re-optimization, such as adapting to diurnal load fluctuations or reacting to changes in equipment availability. This computational efficiency opens new possibilites for faster decision-making, reduced overhead for plant automation systems, and a faster response to real-time operational variability, thereby supporting the transition toward fully automated, data-driven blower management strategies.
4. Discussion
This study confirms the potential of data-driven optimization methods to achieve both efficient and robust supervisory control of aeration blowers. The comparative evaluation of grid search (GS) and Safe Bayesian Optimization (SBO) shows that modern optimization approaches can deliver substantial reductions in blower energy use while maintaining safe operating limits, even when demonstrated within a simplified simulation framework [26].
The energy savings as reported in Table 2 are comparable to those documented in previous investigations focused on both equipment-level and process-level optimization strategies. Early studies centered on dissolved oxygen process control typically reported energy reductions ranging from single-digit to low double-digit percentages [9,15]. In contrast, more recent developments, particularly supervisory and AI-driven control strategies, have demonstrated energy savings of up to 25–30% in full-scale applications [18,20]. However, such approaches often lack the incorporation of detailed blower performance mapping or operational safety constraints, which could limit their adaptability in coordinated, multi-blower contexts [21].
The current framework represents the aeration distribution network through a single aggregate resistance coefficient k, which aggregates the combined effects of pipe friction, local head losses due to bends, fittings, and distributed losses across the header and branch piping. This simplification makes the system curve easy to couple with blower performance maps and keeps the optimization tractable but inevitably abstracts away real-plant hydraulic complexity such as asymmetric branch geometries, valve nonlinearities, and transient operating phenomena.
The sensitivity analysis of the aggregate resistance coefficient k was evaluated using standard error metrics and statistical tests. The mean absolute error (MAE) of 1.89 and root mean square error (RMSE) of 2.87 reflect a moderate discrepancy between modeled and expected values across tested scenarios, while the standard deviation (0.88) quantifies the variability of this error. The 95% confidence interval for the error estimate spans from approximately 1.29 to 2.48, indicating reasonable precision in the system’s pressure–flow predictions given assumed network simplifications.
Statistical testing substantiates these findings: the t-test yields a statistic of 6.46, considerably higher than the critical value (0.96), and leads to rejection of the null hypothesis, confirming that the mean error is significantly different from zero. The F-test result (0.89) compared to critical upper and lower bounds further confirms that the variance of errors remains stable, suggesting consistent performance across multiple realizations. As a result, the framework can be considered robust to moderate fluctuations in k, though the rejection of the zero-mean error hypothesis implies that further calibration or refinement may still be required for highly accurate real-plant replication.
A further limitation is the lack of experimental validation. Access to plant-level operational data is still pending, which prevents calibration of the hydraulic network and comparison of the simulation against measured flows, pressures, and power consumption. An essential next step would be to calibrate the k coefficient and, where possible, replace it with branch-specific loss coefficients derived from the measurements. While a specific calibration protocol is not yet established due to current data limitations, future work would involve collaboration with the plant operators to collect datasets with appropriate sampling frequencies and measurement resolutions. Thus, the calibration protocol would include iterative tuning of the loss coefficients to better capture the hydraulic resistance characteristics in different branches, complemented by comprehensive sensitivity analyses to prioritize influential parameters. Such calibration could allow the framework to evolve from a vendor data-driven simulation to a validated simulation of the real facility [27].
Regional and national differences in wastewater treatment simulation frameworks arise from differences in regulatory requirements, infrastructure configurations, energy costs, environmental conditions, operational protocols, and influent characteristics; underscoring the necessity of adaptable frameworks [8]. However, the proposed system is inherently modular and designed for calibration and validation against site-specific datasets, enabling tailored adjustment of critical components, such as blower performance curves, hydraulic network representations, operational constraints, and demand profiles. This makes it easier to align with diverse regional and national conditions, thereby enhancing its applicability and robustness across varied operational settings.
Despite these constraints, the comparative study of GS and SBO remains informative. GS offers an exhaustive baseline that identifies near-optimal points in simple cases but scales poorly as the number of blowers or grid resolution grows. SBO, by contrast, consistently achieved similar or better energy-saving outcomes with far fewer evaluations and much shorter runtimes. Its ability to sample the decision space adaptively rather than exhaustively enabled it to find smoother and more efficient operating trajectories [26].
The significant reduction in computational effort with Safe Bayesian Optimization (SBO) enables its integration into supervisory control systems where frequent re-optimization is necessary, such as during diurnal demand changes or variable blower availability. SBO’s ability to converge within seconds allows direct embedding into existing SCADA and PLC infrastructure, facilitating near-real-time adjustments of blower speeds and airflow distribution with minimal computational load. This responsiveness supports a more agile, data-driven equipment-level optimization that can dynamically complement traditional dissolved oxygen control strategies, enhancing both operational efficiency and energy savings in wastewater treatment plants.
5. Conclusions
This study introduced a modeling and optimization framework for energy-efficient coordination of parallel blowers in grit chamber aeration, integrating performance maps, turbomachinery laws, and safety constraints. Comparative evaluation demonstrated that Safe Bayesian Optimization achieves comparable or superior energy savings to grid search but with significantly fewer evaluations and shorter runtimes, indicating strong potential for near-real-time supervisory control. While the current hydraulic model uses a simplified aggregate resistance coefficient pending plant-level calibration, the framework’s modularity facilitates site-specific adaptation and future refinement. This work lays the foundation for embedding data-driven blower optimization within wastewater treatment supervisory loops, with ongoing efforts focused on experimental validation and enhanced hydraulic fidelity to enable the transition from simulation to operational deployment. Such advances hold promise for more agile, energy-efficient aeration control that can complement traditional strategies.
The system presented here offers promising application prospects in optimizing energy usage and operational safety in wastewater treatment plants, particularly in managing blower coordination for grit chamber aeration. The approach described could open the road for further implementations of supervisory control tools within existing wastewater plant infrastructure. Its modular design could potentially allow for scaling to different plant configurations and operational scenarios, enabling adaptive blower management in real time.
Author Contributions
Conceptualization, L.C., M.G., M.M., X.S. and V.S.; Methodology, L.C., M.G., M.M., X.S. and V.S.; Software, L.C., M.G., M.M., X.S. and V.S.; Writing—original draft, L.C., M.G., M.M., X.S. and V.S.; Writing—review & editing, L.C., M.G., M.M., X.S. and V.S. All authors have read and agreed to the published version of the manuscript.
Funding
This research received no external funding.
Data Availability Statement
The data presented in this study are available on request from the corresponding author.
Conflicts of Interest
Author Marina Massei was employed by S4F SIM4Future. The remaining authors declare that the research was conducted in the absence of any commercial or financial relationships that could be construed as a potential conflict of interest.
Abbreviations
The following abbreviations are used in this manuscript:
| WWTP | Wastewater Treatment Plant |
| DO | Dissolved Oxygen |
| VFD | Variable-Frequency Drive |
| MOV | Most-Open-Valve strategy |
| MPC | Model Predictive Control |
| PID | Proportional–Integral–Derivative control |
| M&S | Modeling & Simulation |
| GS | Grid Search |
| SBO | Safe Bayesian Optimization |
| GP | Gaussian Process |
| EI | Expected Improvement (acquisition function) |
| SCADA | Supervisory Control and Data Acquisition |
| PLC | Programmable Logic Controller |
| PDS | Performance Data Sheet (vendor blower curves) |
| ABAC | Ammonia-Based Aeration Control |
| MAE | Mean Absolute Error |
References
- Chaitanya Varma, V.K.; Rathinam, R.; Suresh, V.; Naveen, S.; Satishkumar, P.; Abdulrahman, I.S.; Salman, H.M.; Singh, P.; Kumar, J.A. Urban waste water management paradigm evolution: Decentralization, resource recovery, and water reclamation and reuse. Environ. Qual. Manag. 2023, 33, 523–540. [Google Scholar] [CrossRef]
- Magni, M.; Jones, E.R.; Bierkens, M.F.P.; van Vliet, M.T.H. Global energy consumption of water treatment technologies. Water Res. 2025, 277, 123245. [Google Scholar] [CrossRef] [PubMed]
- Qadir, M.; Drechsel, P.; Jiménez Cisneros, B.; Kim, Y.; Pramanik, A.; Mehta, P.; Olaniyan, O. Global and regional potential of wastewater as a water, nutrient and energy source. Nat. Resour. Forum 2020, 44, 40–51. [Google Scholar] [CrossRef]
- Bruzzone, A.G.; Sinelshchikov, K.; Gotelli, M.; Monaci, F.; Sina, X.; Ghisi, F.; Cirillo, L.; Giovannetti, A. Machine Learning and Simulation Modeling of Large Offshore and Production Plants to Improve Engineering and Construction. Procedia Comput. Sci. 2025, 253, 3318–3324. [Google Scholar] [CrossRef]
- Gandiglio, M.; Lanzini, A.; Soto, A.; Leone, P.; Santarelli, M. Enhancing the Energy Efficiency of Wastewater Treatment Plants through Co-digestion and Fuel Cell Systems. Front. Environ. Sci. 2017, 5, 70. [Google Scholar] [CrossRef]
- Bruzzone, A.G.; Sinelshchikov, K.; Giovannetti, A.; De Paoli, A.; Ferrari, R.; Tarone, F.; Piticchio, L. Digital Twin for Pilot Plant for Water Treatment. In Proceedings of the 10th International Workshop on Simulation for Energy, Sustainable Development & Environment (SESDE 2022), Rome, Italy, 19–21 September 2022. [Google Scholar] [CrossRef]
- Bruzzone, A.G.; Massei, M.; Gotelli, M.; Giovannetti, A.; Martella, A. Sustainability, Environmental Impacts and Resilience of Strategic Infrastructures. In Proceedings of the 11th International Workshop on Simulation for Energy, Sustainable Development & Environment, 20th International Multidisciplinary Modeling & Simulation Multiconference (SESDE 2023), Athens, Greece, 18–20 September 2023. [Google Scholar]
- Fernandes, J.; Ramísio, P.J.; Puga, H. A Comprehensive Review on Various Phases of Wastewater Technologies: Trends and Future Perspectives. Eng 2024, 5, 2633–2661. [Google Scholar] [CrossRef]
- Song, X.; Li, P.; Zhang, B.; Yu, K.; Zhang, D.; He, Y. Realization approaches for constructing energy self-sufficient wastewater treatment plants: A review. Carbon Neutrality 2025, 4, 21. [Google Scholar] [CrossRef]
- Jamaludin, M.; Tsai, Y.-C.; Lin, H.-T.; Huang, C.-Y.; Choi, W.; Chen, J.-G.; Sean, W.-Y. Modeling and Control Strategies for Energy Management in a Wastewater Center: A Review on Aeration. Energies 2024, 17, 3162. [Google Scholar] [CrossRef]
- Hvala, N.; Vrečko, D.; Cerar, P.; Žefran, G.; Levstek, M.; Vrančič, D. Energy Cost Optimisation in a Wastewater Treatment Plant by Balancing On-Site Electricity Generation with Plant Demand. Water 2025, 17, 1170. [Google Scholar] [CrossRef]
- Chen, Y.; Zhang, H.; Yin, Y.; Zeng, F.; Cui, Z. Smart energy savings for aeration control in wastewater treatment. Energy Rep. 2022, 8, 1711–1721. [Google Scholar] [CrossRef]
- Wang, J.; Bai, W.; Muttaqi, K.; Sutanto, D. Improving aeration efficiency in wastewater treatment systems through collaborative reinforcement learning: A multi-objective approach to overshoot and settling time reduction. J. Water Process Eng. 2025, 77, 108420. [Google Scholar] [CrossRef]
- Krishnamoorthy, D. ECCBO: An Inherently Safe Bayesian Optimization with Embedded Constraint Control for Real-Time Optimization. IFAC-PapersOnLine 2025, 152, 103467. [Google Scholar]
- Gu, Y.; Li, Y.; Yuan, F.; Yang, Q. Optimization and control strategies of aeration in WWTPs: A review. J. Clean. Prod. 2023, 418, 138008. [Google Scholar] [CrossRef]
- Pöyry, L.; Ukkonen, P.; Mulas, M.; Mikola, A. Modelling solution for estimating aeration energy of wastewater treatment plants. Water Sci. Technol. 2021, 84, 3941–3951. [Google Scholar] [CrossRef] [PubMed]
- Ribes, J.; Serralta, J.; Ruano, M.V.; Robles, Á.; Ferrer, J. Widening the applicability of most-open-valve (MOV) strategy for aeration control at full-scale WWTPs by combining fuzzy-logic control and knowledge-based rules. Preprints 2022, 4288187. [Google Scholar] [CrossRef]
- Monday, C.; Zaghloul, M.S.; Krishnamurthy, D.; Achari, G. A Review of AI-Driven Control Strategies in the Activated Sludge Process with Emphasis on Aeration Control. Water 2024, 16, 305. [Google Scholar] [CrossRef]
- Chen, K.; Wang, H.; Valverde-Pérez, B.; Zhai, S.; Vezzaro, L.; Wang, A. Optimal control towards sustainable wastewater treatment plants based on multi-agent reinforcement learning. Chemosphere 2021, 279, 130498. [Google Scholar] [CrossRef]
- Xiong, Z.; Cheng, L.; Yunus, A.I.; Jian, D.; Zhang, X.; Igou, T.; Tong, S.; Chen, Y. Machine Learning-Assisted Expert Control in Wastewater Aeration Treatment Process Application. ACS ES&T Eng. 2025. [Google Scholar] [CrossRef]
- Mannina, G.; Alliet, M.; Brepols, C.; Comas, J.; Harmand, J.; Heran, M.; Kalboussi, N.; Makinia, J.; Robles, Á.; Rebouças, T.F.; et al. Integrated membrane bioreactors modelling: A review on new comprehensive modelling framework. Bioresource Technol. 2021, 329, 124828. [Google Scholar] [CrossRef]
- Bruzzone, A.G.; Massei, M.; Reverberi, A.; Cardelli, M.; di Matteo, R.; Maglione, G.L. Simulation of Power Plant Environmental Impacts within the Extended Marine Framework. Chem. Eng. Trans. 2017, 61, 1261–1266. [Google Scholar]
- Pöyry, L. Modelling Wastewater Aeration System and High-Speed Turbo Blower for Energy Efficiency Improvements. Master’s Thesis, Aalto University, Espoo, Finland, 2020. [Google Scholar]
- White, F.M. Fluid Mechanics, 8th ed.; McGraw-Hill Education: New York, NY, USA, 2016. [Google Scholar]
- Cosenza, A.; Mannina, G.; Vanrolleghem, P.A.; Neumann, M.B. Variance-based sensitivity analysis for wastewater treatment plant modelling. Sci. Total Environ. 2014, 470–471, 1068–1077. [Google Scholar] [CrossRef] [PubMed]
- Mahdavian, S.A.; Mohamadian, M.; Zeydabadi Nejad, H. An Energy Efficient Approach for Flow Control of Parallel Blowers. In Proceedings of the 2012 IEEE International Conference on Environment and Electrical Engineering (EEEIC), Venice, Italy, 18–25 May 2012; pp. 373–378. [Google Scholar] [CrossRef]
- Lazić, A.; Larsson, V.; Nordenborg, Å. Energy savings potential of new aeration system: Full-scale trials. Water Pract. Technol. 2012, 7, wpt2012098. [Google Scholar] [CrossRef]
Disclaimer/Publisher’s Note: The statements, opinions and data contained in all publications are solely those of the individual author(s) and contributor(s) and not of MDPI and/or the editor(s). MDPI and/or the editor(s) disclaim responsibility for any injury to people or property resulting from any ideas, methods, instructions or products referred to in the content. |
© 2025 by the authors. Licensee MDPI, Basel, Switzerland. This article is an open access article distributed under the terms and conditions of the Creative Commons Attribution (CC BY) license (https://creativecommons.org/licenses/by/4.0/).