Abstract
Compressed carbon dioxide energy storage (CCES) has emerged as a promising solution for long-duration energy storage owing to its high energy density, adaptability to diverse environments, and compatibility with carbon capture technologies. This study develops a dynamic MATLAB 2024a/Simscape model for a 10 MW × 8 h gas–liquid CCES (GL-CCES) system featuring two-stage compression and two-stage expansion. Constant-pressure operation is maintained by check and throttle valves at the boundaries of the high-pressure tank. After startup, all system variables except those associated with the storage tank stabilize rapidly. The analysis reveals several critical dynamic phenomena: (1) a persistent mass-flow imbalance between charging and discharging processes under constant-pressure operation; (2) distinct phase transitions within the high-pressure tank that produce inflection points in thermodynamic evolution; and (3) strong ambient-temperature sensitivity that dictates system stability and efficiency boundaries. The system achieves a round-trip efficiency of 70.52% at 25 °C, which decreases to 67.01% at 21 °C. More importantly, the dynamic energy density (5.15 kWh m−3) is only 12.7% of the steady-state reference value. These results demonstrate the feasibility of GL-CCES for large-scale, long-duration energy storage, while also highlighting its pronounced sensitivity to ambient conditions, underscoring the need for optimized design and adaptive operational strategies.
1. Introduction
Economic growth and technological progress have long relied on the large-scale consumption of fossil fuels [1]. However, extensive fossil fuel use has given rise to increasingly severe environmental challenges, including global warming, acid rain, and extreme weather events [2]. Accelerating the substitution of fossil fuels with renewable energy is therefore recognized as a critical strategy for achieving sustainable development. Renewable resources such as solar, wind, and ocean energy are abundant, clean, and environmentally benign, making them attractive alternatives [3]. However, their inherent intermittency and unpredictability hinder a continuous and stable electricity supply [4]. Under these circumstances, energy storage technologies are indispensable for mitigating renewable fluctuations and enhancing the stability and flexibility of power systems [5].
A wide range of energy storage technologies has been developed, including pumped hydro storage, compressed air energy storage (CAES), heat pump storage, and electrochemical storage [6,7]. Among these, CAES has attracted considerable interest owing to its low cost, operational stability, and siting flexibility [8,9]. However, its relatively low energy density imposes significant limitations. Although liquefaction or supercritical conversion of compressed air can improve storage density, these methods substantially increase system complexity and investment cost [10,11]. By contrast, CO2 exhibits higher density than air under identical conditions and readily transitions among gaseous, liquid, and supercritical phases [12]. Leveraging these properties, compressed carbon dioxide energy storage (CCES) has emerged as a promising technology with the potential to simultaneously enhance energy density and system efficiency.
Several comparative studies have confirmed that CCES outperforms CAES. Li et al. [13] reported that CCES achieves a 9.55% improvement in cycle efficiency and a 16.55% cost reduction, although equipment cost remains a critical issue. Zhang et al. [14] compared low-temperature CCES (LT-CCES) with low-temperature CAES (LTA-CAES) using both conventional and advanced exergy analyses, showing that LT-CCES achieves an exergy efficiency of 56.28%, compared with 63.93% for LTA-CAES, with intrinsic component losses dominating both systems. He et al. [11] demonstrated that integrating CCES with a cogeneration unit substantially enhances system performance, increasing power generation efficiency, power variation ratio, and energy storage density from 47.21%, 12.51%, and 0.99 kWh/m3 to 63.07%, 19.51%, and 1.32 kWh/m3, respectively. Hu et al. [15] proposed integrating supercritical CCES (SC-CCES) with coal-fired units equipped with carbon capture. In this configuration, captured CO2 serves as the working fluid, eliminating the need for low-pressure gas storage facilities and significantly enhancing peak-shaving flexibility and depth. Under pure energy storage conditions, the coupled system reduced coal consumption by 52.1 kg/kWh during peak shaving and achieved a round-trip efficiency of 70.1%. Zhang et al. [16] employed zeolite 13X for adsorption-based storage of low-pressure CO2, which replaced conventional storage tanks and increased energy storage density. Simulation results indicated that the adsorption system achieved a round-trip efficiency of 89.19% and an energy storage density of 6.29 kWh/m3.
CCES configurations can be classified by the storage state of CO2. In addition to the conventional gas–gas CCES (GG-CCES) system [17], researchers have developed gas–liquid CCES (GL-CCES) and liquid–liquid CCES (LL-CCES), where CO2 is liquefied and stored in energy tanks [12,18]. The primary motivation of these configurations is to enhance energy storage density. Among them, GL-CCES is generally regarded as offering superior thermo-economic performance, considering capital investment and manufacturing complexity, and has therefore attracted substantial attention [19]. Favorable performance of GL-CCES was demonstrated by Li et al. [19], who proposed three distinct sliding pressure ranges and developed quasi-dynamic models for each principal component. Their analysis indicated that when the storage pressure range is maintained between 0.1–0.25 MPa, the round-trip efficiency of GL-CCES reaches 56.53%, with a total investment cost of $16.85 × 10⁷ and a payback period of approximately 6.75 years. A comprehensive study on a three-stage compression/expansion GL-CCES system was conducted by Zhao et al. [20] and a round-trip efficiency of 71% and a levelized cost of electricity of $0.1252/kWh were reported under charging and discharging pressures of 8 MPa and 6 MPa, respectively. Zhang et al. [21] integrated CAES with GL-CCES by placing the flexible gas holder of GL-CCES within the air chamber of CAES. This configuration enabled isobaric CAES operation while markedly reducing the size requirement of the flexible gas holder; however, it also increased the total gas storage volume to 1.27 times that of the conventional CAES system. Furthermore, Li et al. [22] proposed the integration of GL-CCES with a CO2 heat pump and a data center to form a comprehensive energy system. In this design, CO2 was stored in liquid form on the low-pressure side and in gaseous form on the high-pressure side. Simulation results showed that the single-stage and two-stage compression/expansion CCES systems achieved round-trip efficiencies of 56.94% and 55.85%, respectively, while the heat pump attained a coefficient of performance (COP) of 7.22, providing 5000 kW of cooling capacity for the data center.
Most existing studies have relied on steady-state modeling to analyze CCES systems. This approach has been applied to system parameter design [23], energy conversion and exergy destruction analysis [24], techno-economic evaluation [25], and performance optimization [26], thereby providing a theoretical foundation for CCES development. However, steady-state modeling is highly idealized, as it neglects unavoidable dynamic phenomena such as load variations, transient phase changes in working fluids, and equipment response delays [27]. These dynamic effects can significantly influence actual system performance but cannot be captured by steady-state methods. Consequently, the development of dynamic models for CCES systems is urgently needed to investigate the impact of system dynamics on performance. Several studies have already initiated progress in this direction. Hao et al. [28] proposed a homogeneous non-equilibrium liquid storage tank model for GL-CCES. Using MATLAB 2024a/SIMULINK, a modular modeling approach was adopted to construct the dynamic system. Their results indicated that the discharged liquid CO2 underwent successive transitions from a subcooled state to a saturated state and then to a two-phase flow state, with subcritical-to-critical transitions occurring under specific pressure differences. Zhang et al. [29] developed a two-stage compression/expansion CCES model and demonstrated that CO2 mass flow rate, heat exchanger pinch temperature, and tank volume strongly influence system efficiency and storage density. Hou et al. [27] analyzed three liquid CCES systems using a non-steady-state model and concluded that synchronous pressure–temperature fluctuations dominated system response, with constant-pressure operation ensuring greater continuity than sliding-pressure operation. Zhang et al. [30] studied a binary-mixture CCES and found that while efficiency decreased by up to 11.97%, compressor performance and system stability improved. Guo et al. [31] proposed a supercritical CCES storing CO2 at pseudo-critical temperature, which extended discharge duration from 0.96 h to 3 h and increased round-trip efficiency to 69.32%. Wang et al. [32] designed a supercritical CCES integrated with coal-fired units and introduced a dual-control strategy, which achieved the fastest load-following response. Yang et al. [33] examined charging/discharging insufficiency and reported that system efficiency fell to 57.78% and energy density declined to 196.60 kJ·m−3, below design values. Jiang et al. [34] compared single- and two-stage adiabatic supercritical CCES, demonstrating that the single-stage system performed better, with optimization improving efficiency to 63.35% and reducing exergy destruction by 10.37 percentage points.
Existing studies have demonstrated that CCES has strong potential to mitigate the intermittency of renewable energy and to facilitate the transition toward cleaner energy systems. Among its variants, GL-CCES is particularly attractive owing to its higher storage density and favorable thermo-economic performance. Nevertheless, several critical research gaps remain. First, the internal dynamics of the high-pressure storage tank—the core component of GL-CCES—remain poorly understood, particularly in their interaction with overall system behavior. Second, the influence of ambient temperature on key components such as the storage tank, cold reservoirs, and heat exchangers has been rarely investigated. Third, although flow-rate fluctuations during charging and discharging have been observed, adaptive regulation strategies to address them are largely absent.
To fill these gaps, this study develops a dynamic modeling framework for GL-CCES and systematically evaluates its transient and environmental characteristics. Specifically, the phase-transition mechanism of CO2 within the high-pressure tank is clarified, the impact of ambient temperature on system performance is assessed, and corresponding mitigation strategies are proposed. In addition, an adaptive regulation framework is designed to mitigate flow-rate mismatches between charging and discharging by integrating temperature-dependent speed control with operation-mode optimization.
This study makes three main contributions to the dynamic research of CCES:
- A dynamic model of GL-CCES is established, revealing the influence of transient phase transitions of CO2 in the high-pressure tank on overall system dynamics.
- The effects of ambient temperature on heat exchangers, turbomachinery, and overall performance are systematically examined, providing a theoretical basis for system optimization under different climatic conditions.
- An adaptive regulation strategy is proposed to balance flow-rate mismatches between charging and discharging, thereby improving operational stability and efficiency.
2. System Description and Assumptions
Based on the typical gas–liquid type CCES cycle configuration proposed by Liu et al. [35], Figure 1 illustrates the schematic of the two-stage compression/two-stage expansion gas–liquid compressed carbon dioxide energy storage (GL-CCES) system investigated in this study. The GL-CCES system mainly comprises a flexible gas storage tank, a high-pressure liquid storage tank, a condenser, an evaporator, two hot-water tanks, two cold-water tanks, two compressors, two expanders, and four heat exchangers. The flexible gas holder allows constant-pressure storage of CO2 in the gaseous state at ambient temperature and pressure.
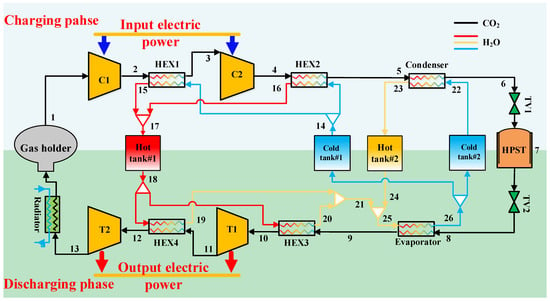
Figure 1.
Schematic diagram of the gas–liquid type compressed carbon dioxide energy storage (GL-CCES) system with two-stage compression and two-stage expansion.
During the charging (storage) process, CO2 is first compressed in Compressor 1 to an intermediate pressure and cooled in Heat Exchanger 1, where the compression heat is transferred to water and stored in Hot Tank 1. The CO2 is then further compressed in Compressor 2 and cooled in Heat Exchanger 2. The resulting high-pressure supercritical CO2 passes through the condenser, where it is liquefied and subsequently stored in the high-pressure liquid tank via a check valve.
During the discharging (release) process, liquid CO2 from the high-pressure tank is throttled through a regulating valve and enters the evaporator, where it absorbs heat and vaporizes. The vaporized CO2 is then heated in Heat Exchanger 3 by hot water from Hot Tank 1 and expands in Expander 1 to generate power. After reheating in Heat Exchanger 4, it undergoes a second-stage expansion in Expander 2. At this stage, the CO2 temperature exceeds ambient conditions, and the residual heat is released through a radiator before the gas returns to the flexible storage tank.
In the thermal energy storage subsystem, the cold-water tanks provide ambient-temperature water, while all water in the cycle is maintained under high pressure to prevent evaporation in the hot tanks. During charging, Heat Exchangers 1 and 2 are connected to Cold Tank 1 and Hot Tank 1, whereas the condenser is connected to Cold Tank 2 and Hot Tank 2. Cold tanks supply ambient-temperature water, Hot Tank 1 stores high-temperature water, and Hot Tank 2 stores medium-temperature water. During discharging, hot water from Hot Tank 1 supplies Heat Exchangers 3 and 4, and the outlet medium-temperature water is mixed with water from Hot Tank 2 to supply the evaporator. Finally, the cooled water leaving the evaporator is returned to Cold Tank 1 and Cold Tank 2.
3. Mathematical Model
3.1. Steady-State Thermodynamic Modeling
3.1.1. Assumptions for the Steady-State System
To simplify the modeling process and ensure computational feasibility, the following assumptions are adopted [36,37,38]:
- Pressure drops and heat losses in heat exchangers and connecting pipes are neglected.
- The power consumption of pumps, except for the water pump, is neglected.
- CO2 is stored in the gas tank under ambient conditions.
- Charging and discharging processes are assumed to have equal durations.
3.1.2. Thermodynamic Models of Key Components
The thermodynamic performance of the GL-CCES system is formulated based on the first law of thermodynamics and the principle of mass conservation. For components outside the storage tanks, the mass balance is expressed as
where ‘in’ and ‘out’ denote the inlet and outlet of each component.
The compressor power input during the charging process is expressed as [39]
where W (kW), ṁ (kg/s) and h (kJ/kg) represent power, mass flow rate, and specific enthalpy, respectively.
The isentropic efficiency of the compressor is defined as [20]
The power output of the expander is expressed as [39]
The isentropic efficiency of the expander is defined as [20]
The system includes multiple types of heat exchangers, namely coolers, heaters, evaporators, and condensers. Since CO2 undergoes phase transitions within the cycle, its thermophysical properties vary significantly during heat transfer. To address this, a discretization approach is employed instead of the logarithmic mean temperature difference (LMTD) method. Each heat exchanger is divided into several segments, within which the thermophysical properties of CO2 are assumed to be constant. The heat balance of a heat exchanger is expressed as [20]
The throttling process in valves is modeled as an isenthalpic process [3]:
3.2. Dynamic Modeling
3.2.1. Dynamic System Description and Assumptions
In this study, a modular approach is employed to develop the dynamic model of the GL-CCES system. The modeled components include the gas storage tank, compressors, expanders, heat exchangers, liquid tanks, water pumps, check valves, and throttling valves. All component models are implemented in the MATLAB/Simscape platform using customized component functions. After the individual models are constructed, they are integrated according to the designed pipeline layout. The block diagram of the GL-CCES dynamic model is presented in Figure 2, where blue lines denote CO2 two-phase flow channels and yellow lines represent water flow channels.
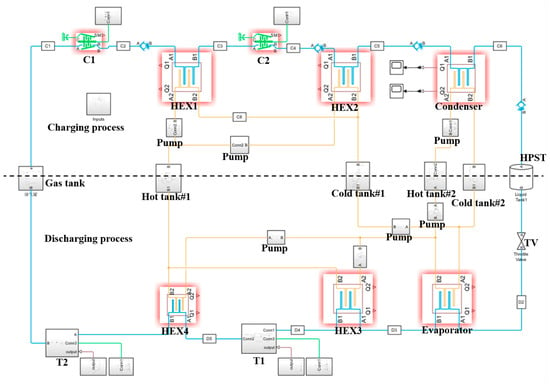
Figure 2.
Block diagram of the GL-CCES dynamic model constructed on the MATLAB/Simscape platform.
The dynamic model was developed in the MATLAB/Simscape environment, which employs an acausal, physical network-based approach to automatically assemble and solve the system of differential–algebraic equations (DAEs). A variable-step solver (ode15s) was configured to ensure numerical stability and computational efficiency for the stiff system. Key components were modeled using established physical methods: turbomachinery performance was interpolated from characteristic maps, heat exchangers were simulated using a segmented discretization approach combined with the effectiveness–NTU method, and the high-pressure storage tank dynamics were resolved by solving ordinary differential equations governing mass and energy conservation. All components are fully coupled through physical ports, forming a closed-loop dynamic feedback network.
The operating principle of the dynamic model is consistent with the description in Section 2. Under sliding-pressure operation, the condenser cannot condense CO2 at low pressure, resulting in gaseous CO2 injection into the high-pressure tank. This condition reduces energy storage density, decreases heat accumulation in Hot Tank 2, and prevents the storage tank from returning to its initial state, thereby degrading system performance. To mitigate this issue, the present system adopts a constant-pressure operation scheme. The charging and discharging processes of CO2 into and from the high-pressure tank are controlled by check valves and throttling valves installed upstream and downstream of the tank, respectively.
During constant-pressure charging, when the inlet pressure is below 7.8 MPa, the check valve remains closed, preventing CO2 between the compressor outlet and the valve inlet from being released. As compression continues, the pressure rapidly rises to 7.8 MPa, at which point the valve fully opens, allowing CO2 to enter the high-pressure storage tank. For constant-pressure discharging, a throttling valve is positioned at the tank outlet. The throttling process is modeled as an isenthalpic expansion. When the inlet pressure exceeds 6.1 MPa, the valve regulates the pressure drop to maintain an outlet pressure of 6.1 MPa; otherwise, sliding-pressure operation is applied. Through the combined regulation of the check and throttling valves, both compressors and expanders can operate stably near their design conditions after transient processes, with compression and expansion ratios kept essentially constant.
To simplify the dynamic model, the following assumptions are made [3,34,35]:
- Heat losses in heat exchangers and pipelines are neglected.
- The power consumption of pumps is neglected.
- Heat exchange between the high-pressure tank and the environment is neglected, and changes inside the tank are treated as adiabatic.
- CO2 in the gas tank is assumed to be stored under ambient conditions, with the gas tank represented by an atmospheric module.
- Ambient temperature and pressure are assumed to be constant throughout the simulation.
3.2.2. Compressor Module
According to Ref. [40], the mathematical model of the centrifugal compressor is expressed through Equations (8)–(16):
where c1, c2, c3 and c4 are intermediate parameters; for the compressor, the value of c4 is set to 0.3; both q values are 1.8; GC and represent the reduced flow rate and reduced rotational speed, respectively; , , and denote the relative reduced flow rate, relative reduced rotational speed, relative pressure ratio, and relative adiabatic compression efficiency, respectively; and refers to the rotational speed of the compressor.
Based on these equations and the design parameters, the compressor performance map is obtained, as shown in Figure 3. The map illustrates the relationships among corrected speed, pressure ratio, isentropic efficiency, and corrected mass flow rate. A surge line is introduced to prevent backflow of the working fluid, while a choke line is defined to avoid excessive energy loss, thereby constraining compressor operation within a safe region [41]. At constant corrected speed, the pressure ratio decreases as the corrected mass flow rate increases, whereas at constant mass flow rate, the pressure ratio rises with rotational speed. For a given corrected speed, the mass flow rate is bounded: excessively low values induce surge, while excessively high values lead to choke. Both conditions are undesirable in practice and simulation. Figure 3 presents the performance curves for corrected speeds in the range of 800–1020 rpm. Over sufficiently broad speed ranges, the isentropic efficiency curves form closed loops bounded by the surge and choke lines. At the design point, the corrected speed is 1000 rpm, the pressure ratio is 8.83, the corrected mass flow rate is 37.96 kg/s, and the isentropic efficiency reaches its maximum design value of 0.85.
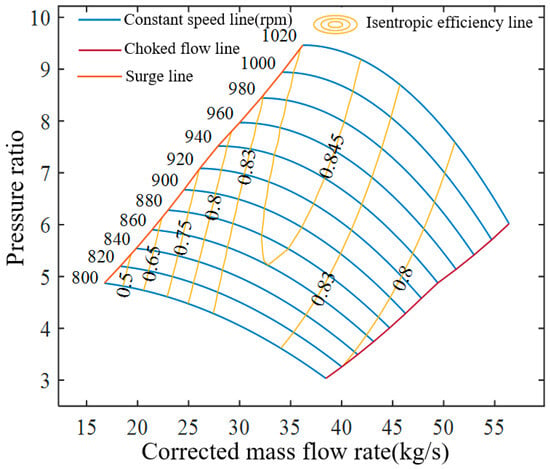
Figure 3.
Compressor performance map.
3.2.3. Expander Module
According to Ref. [40], the mathematical model of the expander is described by Equations (17)–(21):
where denotes the relative reduced flow rate; is the relative adiabatic efficiency; is the relative reduced rotational speed; is the relative pressure ratio; and are the reduced flow rate and reduced rotational speed, respectively.
The expander performance map derived from these equations and the design parameters is shown in Figure 4, corresponding to a pressure ratio range of 5.8–10.5. At the design point, the expander operates at a corrected speed of 3600 rpm, with a pressure ratio of 7.81, a corrected mass flow rate of 37.96 kg/s, and an isentropic efficiency of 0.88.
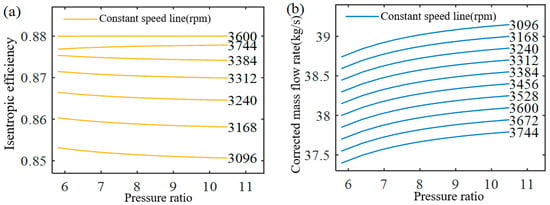
Figure 4.
Expander performance map. (a) Relationship between isentropic efficiency and pressure ratio at different constant speeds; (b) Relationship between corrected mass flow rate and pressure ratio at different constant speeds.
Figure 4a illustrates the relationship among corrected speed, pressure ratio, and isentropic efficiency. Within the specified pressure ratio range, efficiency remains nearly constant at 0.88 when the corrected speed is 3600 rpm. Although efficiency decreases at lower pressure ratios, such conditions fall outside the operating range of the present system and are therefore omitted. In general, efficiency declines when the corrected speed is below 3600 rpm at high pressure ratios, or above 3600 rpm at low pressure ratios. Figure 4b shows the relationship among corrected speed, pressure ratio, and corrected mass flow rate. Along iso-speed lines, the mass flow rate increases with pressure ratio. Conversely, at constant pressure ratio, higher corrected speed corresponds to a greater mass flow rate.
3.2.4. Heat Exchanger Module
Heat exchangers in the GL-CCES system are modeled using the built-in “System-Level Condenser Evaporator (2P-TL)” module in MATLAB/Simscape. This module applies a discretization method, dividing the flow path into three segments, each consisting of a hot side, a cold side, and a separating wall. For any segment, the mass and energy conservation equations of the working fluids are expressed as
where Qi represents the heat flux transferred from the wall of the i-th segment to the fluid; it is positive for the cold side and negative for the hot side.
In this study, CO2 is used as the storage medium and water as the thermal storage medium. Their heat balance equations within the heat exchangers are
Water remains in the liquid phase throughout charging and discharging, while CO2 may undergo phase transitions: gaseous on the low-pressure side and liquid or two-phase on the high-pressure side. If the fluid on either side of segment i is superheated vapor or subcooled liquid, the average heat transfer coefficient is given by
where a = 0.023, b = 0.8, and c = 0.33.
If CO2 is in the two-phase region, the average heat transfer coefficient must be multiplied by a correction factor [42]:
The average Reynolds number in segment i is calculated as
A pressure drop inevitably occurs during heat transfer, which can be expressed as
In this study, pressure drops in heat exchangers are neglected in steady-state modeling, while a nominally small pressure drop is incorporated in dynamic modeling. Under design conditions, the pressure drop across each heat exchanger is set to 1 kPa.
3.2.5. High-Pressure Tank Module
During the charging process, high-pressure liquid CO2 from the condenser is stored in an artificial tank and subsequently supplied to the evaporator during discharging. Considering the tank volume as the control volume, the mass conservation equation is expressed as [43]
Assuming the high-pressure tank is perfectly adiabatic, heat exchange with the environment is neglected. The corresponding energy conservation equation is [43]
where m is the mass of CO2 in the tank, u is specific internal energy, and h is specific enthalpy.
3.2.6. Thermophysical Property Module
Thermodynamic calculations require accurate thermophysical properties, including pressure (p), specific internal energy (u), specific volume (v), specific entropy (s), temperature (T), kinematic viscosity (γ), thermal conductivity (k), and Prandtl number (Pr).
In the GL-CCES system studied here, a low-pressure flexible storage tank operates at atmospheric pressure (0.1 MPa). However, the default CO2 property file in MATLAB/Simscape only covers the range 0.55–50 MPa, which excludes the system’s operating conditions. The lower bound of 0.55 MPa is determined by the CO2 triple-point pressure (0.518 MPa), as the predefined two-phase property tables omit solid-phase states.
To enable accurate calculations under the designed conditions, customized CO2 property tables were generated. Properties in the range of 0.07–0.6 MPa were obtained using the refpropm function in MATLAB, while those in the range of 0.6–9 MPa were derived using the two Phase Fluid Tables function linked to the REFPROP database. Moreover, because CO2 exhibits steep property gradients near the critical point, a denser distribution of data points was specified in the range of 6–9 MPa to ensure numerical accuracy.
3.3. Model Validation
3.3.1. Validation of the Steady-State Model
To evaluate the reliability and accuracy of the steady-state thermodynamic model of the GL-CCES system, this study adopts the design conditions and system parameters reported by Liu et al. [35] as reference. Typical design conditions and system parameters reported therein are adopted as baseline input values. The main design parameters, including environmental conditions, isentropic efficiencies of turbomachinery, terminal temperature differences in heat exchangers, operating durations, and CO2 charging/discharging pressures, are summarized in Table 1.

Table 1.
Design parameters of the GL-CCES system.
The simulated temperatures and pressures at key state points of the GL-CCES system are compared with the reference values, with relative errors listed in Table 2. All deviations are below 0.4%, and most values fall within ±0.3%. The smallest deviation is only 0.001%, confirming that the steady-state model of the GL-CCES system achieves excellent accuracy.

Table 2.
Comparison of state-point parameters of the GL-CCES system between simulation and reference values.
In addition to state-point validation, system-level performance indicators of the GL-CCES system were also examined, including volumetric energy density, mass flow rate, and round-trip efficiency (RTE). The comparison between simulated and reference values is shown in Table 3. All relative errors are below 0.3%. In particular, the predicted RTE and energy density demonstrate excellent agreement with the literature, confirming that the steady-state model reliably captures the overall performance of the GL-CCES system.

Table 3.
Comparison of overall performance indicators of the GL-CCES system.
3.3.2. Validation of the Dynamic Model
The dynamic model of the GL-CCES system was simulated under the same design parameters and boundary conditions as the steady-state model. Under constant-pressure operation, state-point parameters gradually stabilized after the initial start-up phase. The average values during the stable period were extracted as the dynamic simulation results and compared against the steady-state design values. The relative errors are summarized in Table 4. The results indicate that the stabilized values from the dynamic simulation are in close agreement with the steady-state design values, and all deviations are within ±0.4%. The outlet temperatures on both sides of the heat exchanger model were validated using benchmark data from Ref. [44]. Figure 5 shows that the dynamic responses agree well with the literature results, with a relative error of less than 0.05%. This confirms that the GL-CCES dynamic model achieves high accuracy and reliably captures both transient and steady-state characteristics.

Table 4.
Comparison of state-point parameters between dynamic simulation and steady-state design values of the GL-CCES system.
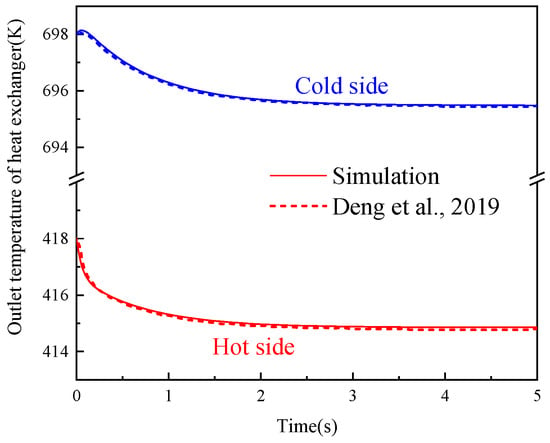
Figure 5.
Dynamic model validation of the hot side and cold side outlet temperatures of the heat exchanger [44].
4. Dynamic Characteristics of the GL-CCES System
4.1. Dynamic Characteristics During the Charging Process
Figure 6 presents the transient responses of key operating parameters of the GL-CCES system during the charging stage, including mass flow rate, compressor power, outlet pressure and temperature, and heat exchanger outlet temperatures. As shown in Figure 6a, the mass flow rate varies significantly with time. Following the 100 s compressor start-up, the flow rate rises to a peak of 43.39 kg/s at 212 s before decreasing to a stable value of approximately 37.66 kg/s. Since only two compressors provide the driving power during charging, the mass flow rate is primarily governed by compressor operating parameters. The stable value of 37.66 kg/s is slightly lower than the design value of 37.96 kg/s, mainly due to the four check valves in the storage-stage model. This effect will be further analyzed in conjunction with the discharging process.
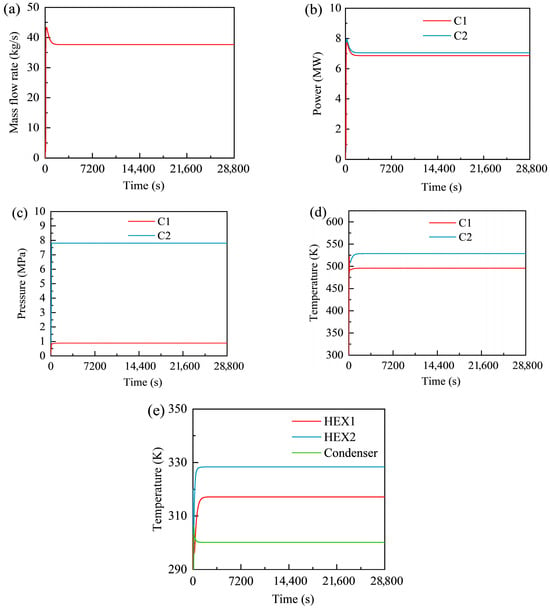
Figure 6.
Transient responses of the GL-CCES system during the charging process: (a) mass flow rate; (b) compressor power; (c) compressor outlet pressures; (d) compressor outlet temperatures; (e) heat exchanger outlet temperatures.
As shown in Figure 6b, the power outputs of the two-stage compressors follow a consistent trend with the mass flow rate. At approximately 212 s, the first-stage and second-stage compressors reach maximum shaft powers of 7.727 MW and 7.942 MW, respectively, before gradually decreasing to stable values of about 6.861 MW and 7.047 MW. These trends confirm that flow variation is largely influenced by the compressors as the driving source. The slight differences in shaft power arise from the different inlet temperatures (298.15 K for the first stage and 317.15 K for the second stage), despite identical design pressure ratios, isentropic efficiencies, and mass flow rates. Neglecting the small relative errors (<0.4%) between the simulated and design values, this explanation is consistent with Equation (2).
As shown in Figure 6c, the compressor outlet pressures rapidly stabilize at 0.884 MPa and 7.805 MPa for the first and second stages, respectively. The second-stage outlet pressure stabilizes more quickly, reaching 7.8 MPa at around 118 s and immediately leveling off, forming a “right-angle” transition. This behavior results from the constant-pressure setting of the final check valve: when the inlet pressure is below 7.8 MPa, the valve remains closed, causing CO2 to accumulate and compress until the pressure reaches the threshold. Once the inlet pressure exceeds 7.8 MPa, the valve opens fully, allowing CO2 to charge into the storage tank with minimal overshoot.
As shown in Figure 6d, the compressor outlet temperatures take longer to stabilize compared with pressures. The outlet temperature of the second-stage compressor is higher than that of the first stage, primarily due to the difference in their inlet temperatures.
Finally, Figure 6e shows the CO2 outlet temperatures of the heat exchangers during the charging process. The outlet temperatures of Heat Exchangers 1 and 2 and the condenser stabilize at 317.146 K, 328.375 K, and 300.154 K, respectively. Notably, after the initial 100 s of compressor start-up, the outlet temperatures of Heat Exchangers 1 and 2 gradually increase, while that of the condenser decreases. This is because the condenser initially operated under poor conditions with limited heat transfer capacity.
4.2. Dynamic Characteristics During the Discharging Process
Figure 7 presents the transient responses of key operating parameters of the GL-CCES system during the discharging stage, including mass flow rate, heat exchanger outlet temperatures, expander power, and expander outlet pressures and temperatures. The results illustrate the system’s transition from start-up to steady operation throughout the 8 h discharge process.
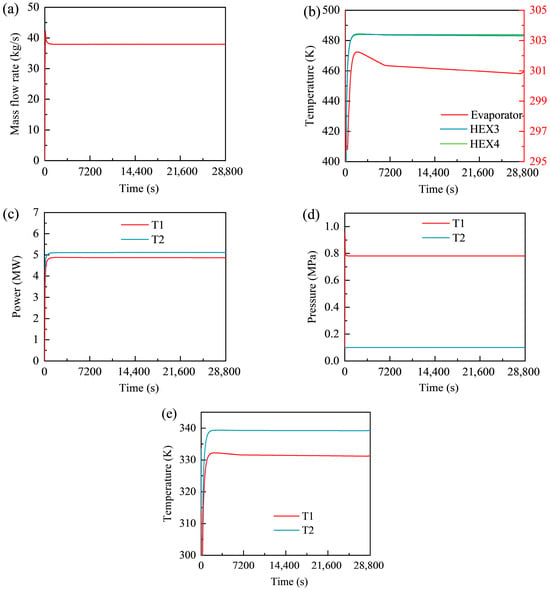
Figure 7.
Transient responses of the GL-CCES system during the discharging process: (a) mass flow rate; (b) heat exchanger outlet temperatures; (c) expander power output; (d) expander outlet pressures; (e) expander outlet temperatures.
As shown in Figure 7a, the mass flow rate increases sharply after the 100 s start-up, reaching a peak of 42.167 kg/s at 106 s, before stabilizing at approximately 37.93 kg/s. This value is nearly identical to the design specification (37.96 kg/s) and slightly higher than the stabilized flow during charging (37.66 kg/s). The difference arises because, unlike in charging, the discharge process does not require check valves to prevent backflow, allowing CO2 to flow naturally from the high-pressure to the low-pressure side.
The outlet temperature profiles of the heat exchangers are shown in Figure 7b. The first- and second-stage exchangers exhibit nearly overlapping curves, stabilizing at 483.610 K and 483.877 K, respectively, while the evaporator stabilizes at 300.950 K. The close agreement of the exchanger curves results from their similar design values, identical initial conditions, and shared expander control signals. Interestingly, the “stable” sections show a slight downward trend (within 1.5 K), rather than oscillating around a fixed point. This behavior is attributable to the adiabatic assumption for the high-pressure tank: as CO2 is discharged, its internal enthalpy gradually decreases, lowering the inlet and outlet temperatures of downstream components. A plateau at 295.84 K appears in the evaporator curve during the first 365 s, corresponding to the evaporation temperature of CO2 at the constant-pressure setting of 6.1 MPa. This indicates incomplete evaporation during the initial period until the working fluid fully transitions to the gaseous phase.
The expander output powers are shown in Figure 7c. Both expanders experience rapid initial growth, stabilizing only after approximately 1240 s. The first- and second-stage expanders stabilize at 4.870 MW and 5.114 MW, respectively. Despite identical design parameters, the second stage produces slightly higher power due to small enthalpy differences between the inlet and outlet states, as defined by Equation (4). This result demonstrates that expander performance depends not only on mass flow rate but also on the thermodynamic state variations across stages.
The expander outlet pressures are illustrated in Figure 7d. The second-stage outlet remains constant at 0.1 MPa, consistent with its direct connection to the atmospheric flexible storage tank. By contrast, the first-stage outlet pressure overshoots to 0.95 MPa at 40 s before stabilizing at approximately 0.782 MPa after 270 s. This overshoot occurs because expander speed lags during start-up: at a given mass flow rate, a lower rotational speed reduces the pressure ratio, yielding a higher outlet pressure, consistent with the performance map in Figure 4.
Finally, Figure 7e presents the expander outlet temperature profiles, which follow trends similar to those of the heat exchangers. Both expanders exhibit a rapid rise to near-design values, followed by a gradual decline. The decline is more pronounced in the first stage due to its proximity to the high-pressure tank. In general, components located closer to the tank outlet experience larger temperature drops during discharge. For instance, the tank outlet temperature decreases by 5.0 K compared with 1.2 K at the evaporator and only 0.5 K at Heat Exchanger 3.
4.3. Dynamic Characteristics of the High-Pressure Storage Tank
Figure 8 presents the dynamic behavior of the high-pressure storage tank of the GL-CCES system during charging. The temporal variation of CO2 dryness is shown in Figure 8a. A dryness value of 1 corresponds to pure vapor, 0 to pure liquid, and −1 to the supercritical state above the critical pressure of 7.377 MPa. The initial dryness of 0.0495 decreases over time, reaching 0 at t = 22,455 s, marking the transition from two-phase to liquid. Subsequently, at t = 27,139 s, the value drops to −1 as the pressure exceeds the critical threshold. Figure 8b illustrates the evolution of pressure, specific enthalpy, and temperature. All three parameters rise with similar trends: a gradual increase is followed by a sharp rise in slope after t = 22,455 s. Among them, pressure shows the largest increase (from 6.1 MPa to 7.8 MPa), while enthalpy and temperature rise more modestly. Coupled with the dryness data, this inflection point corresponds to the phase transition in the tank. Figure 8c depicts the variation of CO2 density with time. Because the system operates under constant pressure and, as shown in Figure 7, the mass flow rate stabilizes to a nearly constant value, the density variation is expected to follow a near-linear trend, consistent with the simulation results.
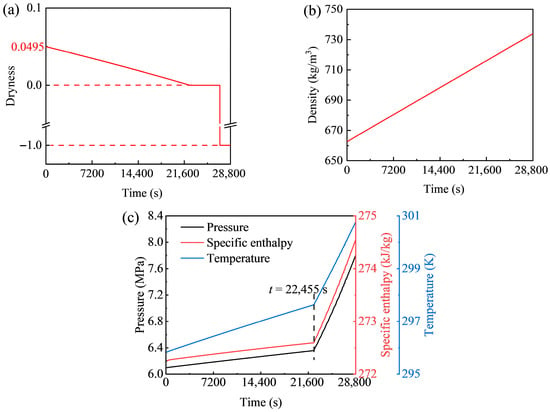
Figure 8.
Dynamic behavior of CO2 in the high-pressure storage tank of the GL-CCES system during charging: (a) dryness, (b) density, and (c) pressure, enthalpy, and temperature versus time.
The corresponding P–h diagram is shown in Figure 9. The trajectory of pressure versus enthalpy approximates a straight line with constant slope. At P = 6.36 MPa (t = 22,455 s), the curve intersects the saturated-liquid line, confirming the phase transition. Because density varies nearly linearly with time, the spacing of isodensity lines reflects the evolution of pressure and enthalpy. The lines are denser in the two-phase region and sparser in the liquid region, indicating slower changes in pressure and enthalpy under two-phase conditions and faster variations in the liquid state.
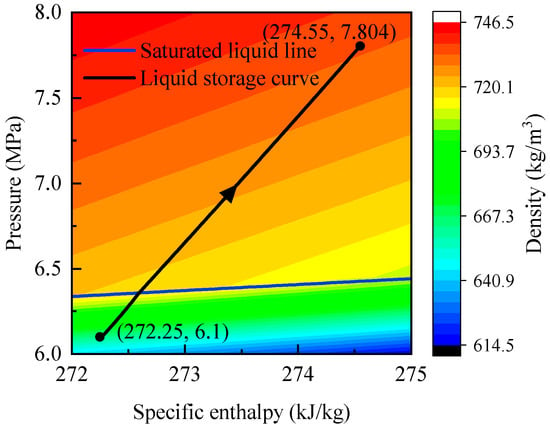
Figure 9.
P–h diagram of CO2 in the high-pressure storage tank of the GL-CCES system during charging.
Since the discharging process also employs constant-pressure control with the same duration and mass flow rate, the dynamic behavior of the high-pressure storage tank is correspondingly analogous. Figure 10 shows the variation of CO2 dryness during discharging, which is approximately the time-mirror image of the charging stage. At t = 6150 s, CO2 transitions from liquid to two-phase. By the end of discharging, dryness reaches 0.0506—slightly higher than the initial charging value of 0.0495 (a relative deviation of 2.22%)—indicating that a small excess of CO2 has been released. At this point, the tank pressure and density are 6.092 MPa and 661.84 kg/m3, both marginally lower than the initial charging values (6.1 MPa and 662.89 kg/m3), further confirming the excess release.
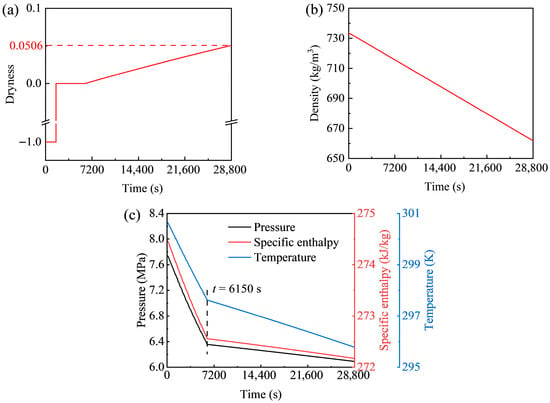
Figure 10.
Dynamic behavior of CO2 in the high-pressure storage tank of the GL-CCES system during discharging: (a) dryness, (b) density, and (c) pressure, enthalpy, and temperature versus time.
As seen in Table 1, due to the four check valves, the stabilized mass flow rate during charging (37.66 kg/s) is slightly lower than during discharging (37.93 kg/s), and (2) the system contains six heat exchangers, each with a CO2 working volume of 8 m3 and initial conditions of 298.15 K and 0.1 MPa. In During both charging and discharging, part of the CO2 remains in the heat exchangers rather than being fully stored in the high-pressure tank or utilized for compression/expansion work.
As shown in Figure 11, the P–h trajectory during discharging mirrors that of charging but in the reverse direction: the process evolves from high-pressure liquid to low-pressure two-phase conditions. The final state at the end of discharging corresponds to 6.09 MPa and 272.17 kJ/kg, values only slightly different from the initial charging conditions (6.1 MPa and 272.25 kJ/kg). This demonstrates that, after a complete charge–discharge cycle, the high-pressure storage tank nearly returns to its initial thermodynamic state.
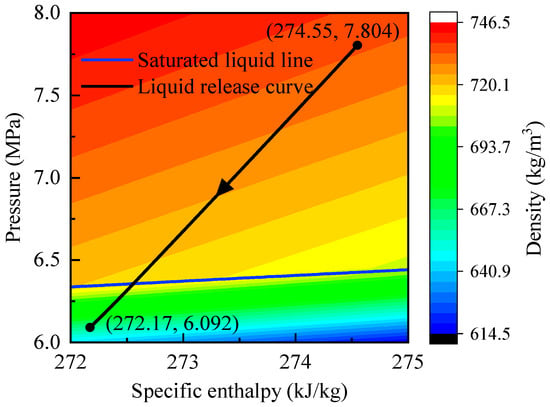
Figure 11.
P–h diagram of CO2 in the high-pressure storage tank of the GL-CCES system during discharging.
4.4. Performance Evaluation Under Design Condition
In the dynamic model of the GL-CCES system under design conditions, both charging and discharging durations are set to 8 h (28,800 s). However, simulation results indicate that excess CO2 is released during discharging. This phenomenon can be attributed to two main factors: (1) the resistance introduced by the check valves reduces the mass flow rate during charging, resulting in insufficient CO2 available for subsequent discharging; and (2) each of the six heat exchanger modules contains a certain CO2 working volume. Since their initial states are defined at ambient temperature and pressure, part of the charged CO2 fills these volumes rather than contributing to useful compression/expansion work. To ensure mass balance over a complete charge–discharge cycle, the condition is imposed that the CO2 density in the high-pressure storage tank must remain greater than or equal to its initial value of 662.89 kg/m3. Accordingly, discharging is terminated once the tank density decreases to this threshold. With the charging duration fixed at 8 h, the effective discharging duration is reduced to 28,377 s.
The round-trip efficiency (RTE) and energy storage density (EVR) are calculated as
Dynamic simulation results of the GL-CCES system yield an RTE of 70.52%, approximately 0.9 percentage points lower than the steady-state simulation value. This discrepancy is expected, as state-point parameters in the dynamic model deviate slightly from those in the steady-state model, leading to lower effective isentropic efficiencies of the compressor and expander. In addition, the dynamic model explicitly accounts for start-up transients, which operate with reduced efficiency.
The energy storage density is calculated as 5.15 kWh/m3, representing only 12.7% of the steady-state value (40.52 kWh/m3). This significant difference arises from modeling assumptions. The steady-state model simplifies the analysis by assuming an isothermal tank, under which CO2 reaches a superheated vapor state at the end of discharging. Maintaining such conditions would require active cooling during charging and heating during discharging, which are difficult to realize in practice. By contrast, the dynamic model assumes an adiabatic tank, in which CO2 remains in a low-quality two-phase state at the end of discharging. This condition necessitates a larger storage volume, thereby reducing the effective energy density.
4.5. Effect of Ambient Temperature on the Performance of the GL-CCES System
Ambient temperature directly affects the temperatures of the low-pressure flexible storage tank and the two cold-water tanks in the GL-CCES system. In the model, these are set equal to the ambient value (298.15 K, or 25 °C under design conditions). To evaluate its influence, the ambient temperature varied from 15 to 27.5 °C while all other design parameters were kept constant. Except for round-trip efficiency (RTE), all performance indicators of the GL-CCES system are reported as average values during the stable operating stage after start-up.
4.5.1. Effect on Turbomachinery
Figure 12 shows the effect of ambient temperature on the turbomachinery performance of the GL-CCES system, including mass flow rate, outlet pressure, outlet temperature, shaft power, and isentropic efficiency. The results reveal strong coupling between ambient conditions and the thermodynamic behavior of compressors and expanders. As shown in Figure 12a, mass flow rates during both charging and discharging decrease as ambient temperature rises. The reduction is more pronounced during charging, whereas the discharging mass flow rate tends to stabilize. The two values converge only at the design ambient temperature of 25 °C.
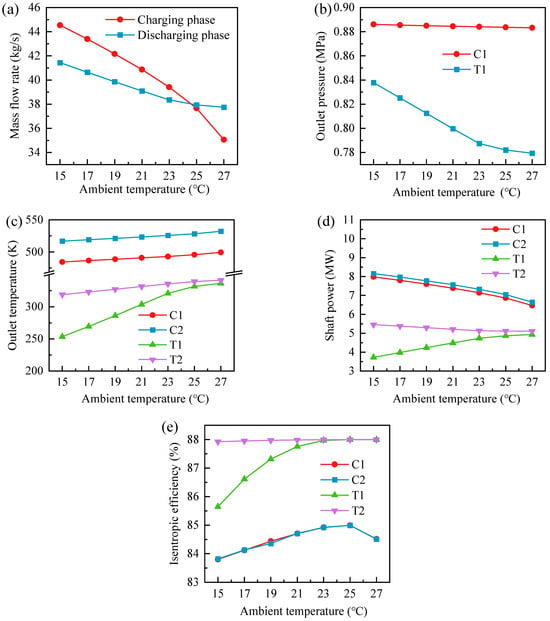
Figure 12.
Effect of ambient temperature on turbomachinery performance of the GL-CCES system: (a) mass flow rate; (b) outlet pressure; (c) outlet temperature; (d) shaft power; (e) isentropic efficiency.
For the first-stage compressor of the GL-CCES system, the inlet temperature equals the ambient temperature, with the inlet pressure fixed at 0.1 MPa. For the second stage, the inlet temperature equals the outlet temperature of HX1 (see Figure 13c), while the inlet pressure approximates the outlet pressure of the first stage (Figure 12b). Thus, the second-stage inlet pressure is largely unaffected by ambient temperature, and its outlet pressure is maintained at 7.8 MPa. As a result, compression ratios of both stages remain nearly constant. However, as ambient temperature increases, the corrected speeds of the compressors decrease, leading to lower corrected mass flow rates (see Figure 4). Because constant-speed lines exhibit quadratic behavior, this reduction becomes increasingly significant at higher temperatures, making the actual mass flow rate even more sensitive. The discharging CO2 mass flow rate is governed by the expanders. Although corrected mass flow rates increase slightly with ambient temperature, changes in their inlet conditions—particularly the inlet temperatures of HX3 and HX4 (Figure 13c) and the inlet pressure of the second-stage expander (Figure 12b)—result in an overall decline. Notably, at 27.5 °C, compressors operating at rated speed can no longer achieve the total pressure ratio required for constant-pressure operation in the GL-CCES system.
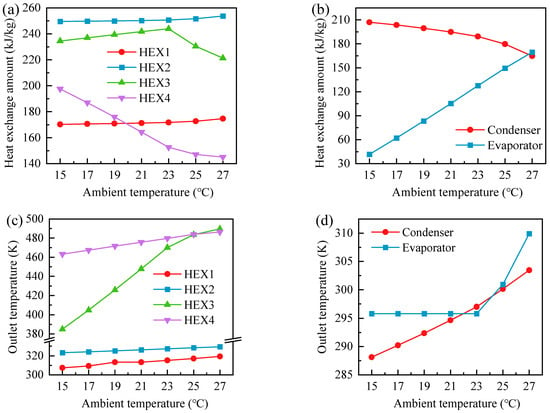
Figure 13.
Heat transfer characteristics of the GL-CCES system: (a) HX1–HX4 heat transfer rates; (b) condenser and evaporator heat transfer rates; (c) outlet temperatures of HX1–HX4; (d) outlet temperatures of the condenser and evaporator.
Figure 12b shows outlet pressure trends of Compressor 1 (C1) and Turbine 1 (T1). The C1 outlet pressure decreases slightly (0.886 → 0.883 MPa), while the T1 outlet pressure exhibits a sharper decline, especially below 23 °C. Consequently, compressor pressure ratios remain almost unchanged, whereas the first-stage expansion ratio increases with ambient temperature and the second-stage expansion ratio decreases.
As shown in Figure 12c,d, outlet temperatures of all turbomachinery increase with ambient temperature. Compressor and second-stage expander shaft powers decrease consistently with mass flow rate, while the first-stage expander shaft power increases. This occurs because the enthalpy difference between inlet and outlet rises more rapidly than the reduction in flow rate, driven by the higher expansion ratio at elevated temperatures.
The isentropic efficiencies of compressors and expanders in the GL-CCES system are presented in Figure 12e. Both compressors exhibit similar trends: efficiency first increases and then decreases, peaking at 84.99% near 25 °C. The second-stage expander maintains nearly constant efficiency (87.9–88%), while the first-stage expander efficiency increases with ambient temperature up to about 23 °C, after which both expanders converge toward ~88%. This behavior reflects the role of corrected speed: at fixed rotational speed (3600 rpm), efficiency remains near maximum when the inlet temperature drives corrected speed close to its rated value.
4.5.2. Effect on Heat Exchanger Performance
Figure 13 presents the heat transfer rates of unit-mass CO2 in HX1–HX4, the condenser, and the evaporator of the GL-CCES system, together with the corresponding CO2 outlet temperatures. As shown in Figure 13a, HX1 and HX4 exhibit similar heat transfer rates, while HX2 and HX3 follow comparable trends. During charging, HX1 and HX2 show gradually increasing heat transfer rates with rising ambient temperature. Although the cold-tank water temperature also increases, the compressor outlet temperature rises even more sharply (see Figure 12), thereby slightly enlarging the CO2–water temperature difference and enhancing heat transfer.
In contrast, HX3 demonstrates a non-monotonic response: its heat transfer rate first increases and then decreases. The initial increase is attributed to the moderate rise in hot-water temperature in Hot Tank 1, while the CO2 inlet temperature (i.e., the evaporator outlet) remains nearly constant (Figure 13d), yielding a larger temperature difference. Beyond 23 °C, however, the evaporator outlet temperature rises markedly, narrowing the temperature difference and reducing the heat transfer rate. HX4, on the other hand, shows a monotonic decline with ambient temperature due to the significant variation in its cold-side CO2 inlet temperature (i.e., the first-stage expander outlet).
As illustrated in Figure 13b, the condenser heat transfer rate decreases slightly with ambient temperature, whereas the evaporator heat transfer rate increases more sharply. This difference arises because the condenser inlet temperature (HX2 outlet) varies only modestly compared with the cold-tank water temperature, while the evaporator benefits from higher hot-water inlet temperature combined with a nearly constant CO2 inlet temperature of 295.82 K, corresponding to the evaporation point at 6.1 MPa. Consequently, the evaporator heat transfer rate rises monotonically with ambient temperature. At low ambient temperatures, however, evaporation becomes incomplete. For instance, at 15 °C the evaporator heat transfer rate is only 41.68 kJ/kg, insufficient for full vaporization. Detailed state-point analysis further confirms that this limitation is compounded by system configuration. Under steady discharging at 15 °C, the mixed water temperature supplied to the evaporator (300.53 K) is lower than the hot-tank temperature (303.37 K) due to mixing with cooler streams, thereby reducing heat transfer effectiveness. Although this configuration is intended to recover waste heat from HX3 and HX4—beneficial at the design point of 25 °C—it degrades evaporator performance under low-temperature conditions.
Figure 13c shows the outlet temperatures of HX1–HX4. HX1 and HX2, acting as coolers during charging, exhibit relatively low outlet temperatures, while HX3 and HX4, serving as heaters during discharging, show higher values. In all cases, outlet temperatures rise with ambient temperature, reflecting increases in their corresponding inlet temperatures. Notably, HX3 displays more pronounced variation below 23 °C, primarily due to its strong coupling with evaporator performance.
Finally, Figure 13d highlights that the condenser outlet temperature increases monotonically with ambient temperature, whereas the evaporator outlet temperature remains fixed at 295.82 K up to 23 °C, after which it rises sharply. This plateau corresponds to the evaporation temperature at 6.1 MPa, indicating incomplete evaporation below 23 °C. Although the outlet temperature remains constant within this plateau, the CO2 enthalpy and vapor quality increase with ambient temperature, leading to improved evaporation completeness at higher temperatures.
4.5.3. Effect on Overall System Performance
Figure 14 summarizes the influence of ambient temperature on the overall performance of the GL-CCES system. Although the total compressor power reaches its minimum and the total expander power reaches its maximum at 27 °C (see Figure 12d), the mismatch in mass flow rates between charging and discharging grows significantly with increasing temperature (see Figure 12a). Under fixed charging duration, this mismatch directly limits the available discharging time, which decreases sharply as ambient temperature rises, as shown in Figure 14a. Consequently, despite the higher instantaneous expander power at elevated temperatures, the total expansion work declines. At 27 °C, the expansion work falls to its lowest value of 265.52 GJ, while the maximum expansion work of 290.26 GJ is achieved at 21 °C. This highlights that the absolute energy recovery capability of the GL-CCES system is constrained not only by turbomachinery performance but also by the dynamic balance between charging and discharging mass flows.
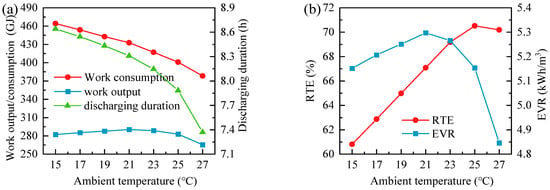
Figure 14.
Effect of ambient temperature on the overall performance of the GL-CCES system: (a) network input/output per cycle and discharging duration; (b) round-trip efficiency and energy storage density.
As illustrated in Figure 14b, the round-trip efficiency (RTE) of the GL-CCES system increases with ambient temperature up to 25 °C, reaching a peak of 70.52% at the design condition, but declines thereafter. The initial improvement arises because higher ambient temperature slightly reduces compression work while maintaining sufficient expansion performance. Beyond 25 °C, however, compressor flow limitations and shortened discharging duration dominate, leading to a decrease in both expansion work and RTE. Since the tank volume is constant across all simulations, the energy storage density (EVR) is directly proportional to the total expansion work and therefore exhibits a similar trend. The maximum EVR of 5.30 kWh/m3 occurs at 21 °C, whereas the minimum of 4.85 kWh/m3 is observed at 27 °C, where the RTE also falls to 70.2%, slightly below the design-point value.
Overall, these results reveal a trade-off between RTE and EVR: efficiency is optimized at moderate-to-high ambient temperatures, whereas energy density benefits from cooler conditions. Therefore, adaptive operational strategies—such as flexible compressor control and optimized heat exchanger management—are essential to mitigate ambient sensitivity and maximize the practical performance of the GL-CCES system.
4.6. Comparison with Other Dynamic CCES Systems
This study further demonstrates the performance advantages of the proposed system by comparing it with recently published dynamic simulation studies on CCES. As shown in Table 5, under design conditions, the round-trip efficiency of the proposed system reaches 70.52%, outperforming the GL-CCES system (61.69%) reported by Hao et al. [28] and the SC-CCES system (60.26%) reported by Jiang et al. [34]. Moreover, thanks to the constant-pressure control strategy adopted in this work, the system achieves a stable power output during discharge, with an average discharge power of 9.984 MW, significantly enhancing power quality and grid compatibility.

Table 5.
Comparison of overall performance indicators of the CCES system.
In terms of energy storage density, the system proposed in this study shows significant improvement compared to the GL-CCES configuration by Hao et al., though it remains lower than the SC-CCES system reported by Jiang et al. This can be attributed to the lower operating pressure range (6.1–7.8 MPa) of the high-pressure storage tank (HPST) in the GL-CCES architecture of this study, compared to the 20–40 MPa range in Jiang et al.’s work. Additionally, the flexible gas holder on the low-pressure side also limits further enhancement of the overall energy storage density. However, the incorporation of the flexible gas holder brings a distinct advantage that is difficult to achieve in SC-CCES systems—stable constant-pressure storage of CO2 on the low-pressure side, thereby ensuring system pressure controllability and operational stability throughout the cycle.
The core innovation of this study lies in the integration of a constant-pressure control strategy with dynamic simulation modeling, successfully realizing a GL-CCES system that combines high round-trip efficiency with stable power output for large-capacity, long-duration discharge. This provides an important reference for the design and optimization of CCES systems in practical engineering applications.
5. Conclusions
For large-scale, long-duration energy storage applications, this study develops and validates a dynamic MATLAB/Simscape model of a gas–liquid compressed carbon dioxide energy storage (GL-CCES) system against steady-state benchmarks. Using this model, the transient behaviors and environmental sensitivities of the GL-CCES system are systematically analyzed. The main findings are summarized as follows:
- In the adiabatic high-pressure storage tank, CO2 undergoes distinct phase transitions between two-phase and pure-liquid states, leading to inflection points in the temporal evolution of pressure, temperature, and specific enthalpy. Parameter variations are faster in the liquid region and slower in the two-phase region.
- At elevated ambient temperatures, the two-stage compressors of the GL-CCES system cannot sustain the required pressure ratio, resulting in operational failure unless compensated by increased rotational speed. At lower ambient temperatures, the evaporator suffers from reduced heat transfer effectiveness despite its enhanced design configuration, causing significant efficiency losses.
- Under the design ambient temperature of 25 °C, the GL-CCES system achieves a maximum RTE of 70.52%, slightly lower than the steady-state design value, while the energy storage density is only 5.15 kWh/m3 (12.7% of the steady-state assumption). By comparison, the maximum energy storage density of 5.30 kWh/m3 occurs at 21 °C, but with a reduced RTE of 67.01%.
Overall, these results demonstrate that while the GL-CCES system shows strong potential for large-scale, long-duration energy storage, its performance is highly sensitive to ambient conditions. Beyond the specific findings of this study, CCES technology demonstrates broader prospects due to several inherent advantages: (1) its high energy density compared to conventional compressed air systems makes it suitable for space-constrained applications; (2) the natural compatibility with carbon capture technologies creates potential for integrated energy–carbon management systems; and (3) the thermal storage integration capability provides opportunities for polygeneration and industrial waste heat utilization. Adaptive control strategies—such as adjusting compressor rotational speed or optimizing evaporator operation—are therefore essential to ensure stable operation and maximize practical efficiency.
This study establishes a dynamic model for the GL-CCES system and reveals its core dynamic characteristics. However, some limitations persist, pointing toward valuable future research directions. Firstly, the model simplified pressure drops in heat exchangers and pipeline heat losses to focus on the primary system-level dynamics. Secondly, the control strategy was based on basic operational principles without advanced optimization. Finally, the analysis assumed a constant ambient temperature.
Building upon these findings and limitations, future work will focus on (1) developing hybrid “sliding–constant pressure” operation strategies to reduce throttling losses while maintaining high condenser efficiency; (2) implementing advanced control algorithms to ensure compressors and expanders operate near their peak isentropic efficiency under variable conditions; and (3) optimizing system configuration, such as introducing three-way valves, to mitigate evaporator performance degradation at low ambient temperatures.
Author Contributions
Conceptualization, Z.L. and K.L.; methodology, Z.L., X.Z. and C.W.; software, Z.H.; validation, S.W.; formal analysis, G.C. and S.W.; investigation, X.Z., G.C., S.W. and C.W.; resources, Z.H.; data curation, G.C. and S.W.; writing—original draft preparation, X.Z., G.C. and C.W.; writing—review and editing, T.D.; visualization, Z.H.; supervision, Z.L., K.L. and T.D.; project administration, X.Z. and C.W. All authors have read and agreed to the published version of the manuscript.
Funding
This research was funded by State Key Laboratory of Clean and Efficient Turbomachinery Power Equipment grant number (No. A1228112).
Data Availability Statement
During the preparation of this work, the authors used ChatGPT4 to improve the clarity and language quality of the manuscript. After applying this tool, the authors carefully reviewed and revised the text to ensure accuracy, coherence, and appropriateness. The authors accept full responsibility for the content of the final manuscript.
Conflicts of Interest
Author Xianbo Zhao, Shan Wang, Zhiming Li, Kui Luo were employed by the Dongfang Electric Corporation Dongfang Turbine Co. The remaining authors declare that the research was conducted in the absence of any commercial or financial relationships that could be construed as a potential conflict of interest.
Nomenclature
| CCES | Compressed CO2 Energy Storage | D | Characteristic length |
| CAES | Compressed Air Energy Storage | S | Flow area |
| GL-CCES | Gas–Liquid Compressed CO2 Energy Storage | μ | Dynamic viscosity |
| CCUS | Carbon Capture, Utilization, and Storage | CZ | Correction factor in the two-phase region |
| W | Power | v | Specific volume |
| ṁ | Mass flow rate | x | Dryness |
| h | Specific enthalpy | ΔP | Pressure drop |
| Heat transfer rate | J | Pressure drop coefficient | |
| η | Efficiency | ṁ0 | Laminar threshold of mass flow rate |
| T | Temperature | RTE | Round-trip efficiency |
| P | Pressure | EVR | Energy density |
| G | Corrected mass flow rate | Subscripts | |
| Relative corrected mass flow rate | in | Inlet | |
| n | Rotational speed | out | Outlet |
| N | Corrected speed | is | Isentropic process |
| Relative corrected speed | C | Compressor | |
| ε | Pressure ratio | T | Turbine/Expander |
| Relative pressure ratio | i | i-th stage | |
| Relative efficiency | valve | Valve | |
| u | Specific internal energy | CO2 | Carbon dioxide |
| ρ | Density | H2O | Water |
| V | Volume | d | Design |
| M | Mass | wall | Wall |
| UA | Overall thermal conductance | SV | Saturated vapor |
| Re | Reynolds number | SL | Saturated liquid |
| Pr | Prandtl number | in | Inlet |
| k | Thermal conductivity | HPST | High-pressure storage tank |
| K | Geometric factor |
References
- Yang, X.; Yu, J.; Guo, Z.; Jin, L.; He, Y.-L. Role of porous metal foam on the heat transfer enhancement for a thermal energy storage tube. Appl. Energy 2019, 239, 142–156. [Google Scholar] [CrossRef]
- Leal, V.M.; Ribeiro, J.S.; Coelho, E.L.D.; Freitas, M.B.J.G. Recycling of spent lithium-ion batteries as a sustainable solution to obtain raw materials for different applications. J. Energy Chem. 2023, 79, 118–134. [Google Scholar] [CrossRef]
- Zhao, P.; Xu, W.; Zhang, S.; Gou, F.; Wang, J.; Dai, Y. Components design and performance analysis of a novel compressed carbon dioxide energy storage system: A pathway towards realizability. Energy Convers. Manag. 2021, 229, 113679. [Google Scholar] [CrossRef]
- Zhao, P.; Dai, Y.; Wang, J. Design and thermodynamic analysis of a hybrid energy storage system based on A-CAES (adiabatic compressed air energy storage) and FESS (flywheel energy storage system) for wind power application. Energy 2014, 70, 674–684. [Google Scholar] [CrossRef]
- Chaychizadeh, F.; Dehghandorost, H.; Aliabadi, A.; Taklifi, A. Stochastic dynamic simulation of a novel hybrid thermal-compressed carbon dioxide energy storage system (T-CCES) integrated with a wind farm. Energy Convers. Manag. 2018, 166, 500–511. [Google Scholar] [CrossRef]
- Li, P.; Hu, Q.; Li, G.; Wang, B.; Bai, Y.; Han, X.; Han, Z. Research on thermo-economic characteristics of a combined cooling, heating and power system based on advanced adiabatic compressed air energy storage. J. Energy Storage 2022, 47, 103590. [Google Scholar] [CrossRef]
- Zhang, M.; Shi, L.; Hu, P.; Pei, G.; Shu, G. Carnot battery system integrated with low-grade waste heat recovery: Toward high energy storage efficiency. J. Energy Storage 2023, 57, 106234. [Google Scholar] [CrossRef]
- Baghalnezhad, M.; Salehi, G.; Mirabdolah Lavasani, A.; Vahabi, M.; Nimafar, M. Decision study and optimization of an innovative three-state multigeneration process using solar energy and compressed air energy storage: A data-driven scenario. Appl. Therm. Eng. 2024, 256, 124069. [Google Scholar] [CrossRef]
- Rahimimotlagh, Z.; Ahmadi, A. Energy, exergy, exergoeconomic and exergoenvironmental analysis and optimization of combined solar, SRC cycles with compressed air energy storage (CAES) and methane production system. Energy Convers. Manag. 2024, 317, 118855. [Google Scholar] [CrossRef]
- Guizzi, G.L.; Manno, M.; Tolomei, L.M.; Vitali, R.M. Thermodynamic analysis of a liquid air energy storage system. Energy 2015, 93, 1639–1647. [Google Scholar] [CrossRef]
- He, T.; Cao, Y.; Si, F. Thermodynamic analysis and optimization of a compressed carbon dioxide energy storage system coupled with a combined heating and power unit. Energy Convers. Manag. 2023, 277, 116618. [Google Scholar] [CrossRef]
- Wu, C.; Wan, Y.; Liu, Y.; Xu, X.; Liu, C. Thermodynamic simulation and economic analysis of a novel liquid carbon dioxide energy storage system. J. Energy Storage 2022, 55, 105544. [Google Scholar] [CrossRef]
- Li, H.; Ding, R.; Su, W.; Lin, X.; Guan, S.; Ye, Q.; Zheng, Z.; Wang, J. A comprehensive performance comparison between compressed air energy storage and compressed carbon dioxide energy storage. Energy Convers. Manag. 2024, 319, 118972. [Google Scholar] [CrossRef]
- Zhang, Y.; Yao, E.; Wang, T. Comparative analysis of compressed carbon dioxide energy storage system and compressed air energy storage system under low-temperature conditions based on conventional and advanced exergy methods. J. Energy Storage 2021, 35, 102274. [Google Scholar] [CrossRef]
- Hu, D.; Zhao, M.; Zhang, C.; Zhu, Y.; Xu, Y.; Shen, G.; Chen, H. Performance analysis of coal-fired power plant with carbon capture integrated with a supercritical compressed carbon dioxide energy storage system. Energy 2025, 336, 138342. [Google Scholar] [CrossRef]
- Zhang, T.; Qin, S.; Wei, G.; Xie, M.; Peng, Y.; Tang, Z.; Sun, Q.; Du, Q.; Feng, D.; Gao, J.; et al. Thermodynamic analysis of a novel trans-critical compressed carbon dioxide energy storage system based on 13X zeolite temperature swing adsorption. Energy 2023, 282, 128399. [Google Scholar] [CrossRef]
- Chen, K.-Q.; Pu, W.-H.; Zhang, Q.; Xing, X.-L.; Xiong, C.; Guo, M.-D. Thermodynamic and Economic Assessment on the Supercritical Compressed Carbon Dioxide Energy Storage System coupled with Solar Thermal Storage. J. Energy Storage 2021, 41, 102959. [Google Scholar] [CrossRef]
- Zheng, L.; Li, Y.; Mao, Y.; Xue, X.; Xu, G.; Lin, X. Thermodynamic and economic analyses of a novel liquid carbon dioxide energy storage system incorporated with a coal-fired power plant. Energy 2025, 325, 136212. [Google Scholar] [CrossRef]
- Li, H.; Su, W.; Dai, H.; Lin, X.; Ding, R.; Wang, J.; Guan, S.; Zheng, Z.; Ye, Q. Thermo-economic analysis on the gas-liquid compressed carbon dioxide energy storage under different sliding pressure ranges of low-pressure gas storage. J. Energy Storage 2025, 134, 118167. [Google Scholar] [CrossRef]
- Zhao, R.; Liu, Z. Thermo-economic performance of a compressed CO2 energy storage system with a flexible gas holder. J. Energy Storage 2023, 60, 106675. [Google Scholar] [CrossRef]
- Zhang, Y.; Liu, J.; Yin, S.; Su, C.; Liu, Z. Design and performance analysis of a novel compressed air-liquid CO2 energy storage. Energy Convers. Manag. 2024, 301, 118068. [Google Scholar] [CrossRef]
- Li, F.; Xing, L.; Su, W.; Lin, X.; Liang, Y.; Shi, W. An idea to construct integrated energy systems of data center by combining CO2 heat pump and compressed CO2 energy storage. J. Energy Storage 2024, 75, 109581. [Google Scholar] [CrossRef]
- Qiao, L.; Pu, W.; Wu, B.; Liu, R.; Song, N. Performance study of a supercritical carbon dioxide energy storage system with non-uniform graded compression heat recovery. Energy 2024, 313, 133876. [Google Scholar] [CrossRef]
- Yari, M.; Khodaei, E.; Nami, H. Techno-economic assessment of a low-carbon solar-assisted compressed air energy storage system integrated with calcium looping carbon capture. Appl. Therm. Eng. 2025, 279, 127869. [Google Scholar] [CrossRef]
- Ma, H.; Liu, Z. Techno-economic assessment on a multi-stage compressed carbon dioxide energy storage system with liquid storage. Energy Rep. 2022, 8, 11740–11750. [Google Scholar] [CrossRef]
- Zhang, Y.; Liang, T.; Yang, K. An integrated energy storage system consisting of Compressed Carbon dioxide energy storage and Organic Rankine Cycle: Exergoeconomic evaluation and multi-objective optimization. Energy 2022, 247, 123566. [Google Scholar] [CrossRef]
- Hou, K.; Guo, J.; Liu, X.; Lv, K.; He, M. Dynamic characteristics and performance analysis of typical liquid carbon dioxide energy storage systems. Energy 2025, 336, 138463. [Google Scholar] [CrossRef]
- Hao, Y.; Xu, X.; Wang, F.; Wang, Y.; Du, J.; Wu, C.; Li, Q. Dynamic characteristics of gas-liquid type compressed CO2 energy storage system with focus on high-pressure liquid energy release process. Energy 2025, 316, 134502. [Google Scholar] [CrossRef]
- Zhang, Y.; Wu, Y.; Yang, K. Dynamic characteristics of a two-stage compression and two-stage expansion Compressed Carbon dioxide energy storage system under sliding pressure operation. Energy Convers. Manag. 2022, 254, 115218. [Google Scholar] [CrossRef]
- Zhang, Y.; Shen, X.; Tian, Z.; Kan, A.; Gao, W.; Yang, K. A step towards dynamic: An investigation on a carbon dioxide binary mixtures based compressed gas energy storage system using energy and exergy analysis. Energy 2023, 282, 128415. [Google Scholar] [CrossRef]
- Guo, Y.; Xu, J.; Yu, X.; Sun, E.; Xie, J.; Liu, G. Optimization of dynamic compressed CO2 energy storage system: The role of supercritical fluid properties. Energy 2025, 328, 136417. [Google Scholar] [CrossRef]
- Wang, D.; Han, X.; Si, L.; Zhou, Y. A coordinated control strategy and dynamic characteristics of coal-fired units coupled with the S-CO2 energy storage cycle. Appl. Energy 2024, 372, 123812. [Google Scholar] [CrossRef]
- Yang, D.L.; Tang, G.H.; Sheng, Q.; Li, X.L.; Fan, Y.H.; He, Y.L.; Luo, K.H. Effects of multiple insufficient charging and discharging on compressed carbon dioxide energy storage. Energy 2023, 278, 127901. [Google Scholar] [CrossRef]
- Jiang, J.; Zhang, B.; Chen, W.; Zhang, X.; Li, D.; Li, J.; Li, H.; Xue, X. Investigation and optimization of the thermal performance of compressed supercritical CO2 energy storage system based on dynamic modeling and transient simulation. Renew. Energy 2025, 238, 121966. [Google Scholar] [CrossRef]
- Liu, Z.; Yan, X.; Wang, S.; Wei, X.; Zhang, Y.; Ding, J.; Su, C. Performance of compressed CO2 energy storage systems with different liquefaction and storage scenarios. Fuel 2024, 359, 130527. [Google Scholar] [CrossRef]
- Zhao, P.; Xu, W.; Gou, F.; Fan, G.; Wang, J. Performance analysis of a self-condensation compressed carbon dioxide energy storage system with vortex tube. J. Energy Storage 2021, 41, 102995. [Google Scholar] [CrossRef]
- Liu, Z.; Liu, Z.; Xin, X.; Yang, X. Proposal and assessment of a novel carbon dioxide energy storage system with electrical thermal storage and ejector condensing cycle: Energy and exergy analysis. Appl. Energy 2020, 269, 115067. [Google Scholar] [CrossRef]
- Yan, X.; Ding, J.; Zhang, Y.; Zhang, Y.; Liu, Z. Thermodynamic evaluation on a new CO2 energy storage system assisted by adsorption bed. J. Energy Storage 2023, 61, 106775. [Google Scholar] [CrossRef]
- Zhang, Y.; Yang, K.; Hong, H.; Zhong, X.; Xu, J. Thermodynamic analysis of a novel energy storage system with carbon dioxide as working fluid. Renew. Energy 2016, 99, 682–697. [Google Scholar] [CrossRef]
- Guo, H.; Xu, Y.; Zhang, Y.; Liang, Q.; Tang, H.; Zhang, X.; Zuo, Z.; Chen, H. Off-design performance and an optimal operation strategy for the multistage compression process in adiabatic compressed air energy storage systems. Appl. Therm. Eng. 2019, 149, 262–274. [Google Scholar] [CrossRef]
- Yu, W.; Wang, S.; Liu, C.; Li, Q.; Xu, X. Study on the thermal stability of a new siloxane working fluid modified by octamethyltrisiloxane and its application potential in organic Rankine cycle. Energy 2025, 320, 135017. [Google Scholar] [CrossRef]
- Cavallini, A.; Zecchin, R. A Dimensionless Correlation for Heat Transfer in Forced Convection Condensation; Begell House Inc.: Danbury, CT, USA, 1974. [Google Scholar]
- Yang, K.; Zhang, Y.; Li, X.; Xu, J. Theoretical evaluation on the impact of heat exchanger in Advanced Adiabatic Compressed Air Energy Storage system. Energy Convers. Manag. 2014, 86, 1031–1044. [Google Scholar] [CrossRef]
- Deng, T.; Li, X.; Wang, Q.; Ma, T. Dynamic modelling and transient characteristics of supercritical CO2 recompression Brayton cycle. Energy 2019, 180, 292–302. [Google Scholar] [CrossRef]
Disclaimer/Publisher’s Note: The statements, opinions and data contained in all publications are solely those of the individual author(s) and contributor(s) and not of MDPI and/or the editor(s). MDPI and/or the editor(s) disclaim responsibility for any injury to people or property resulting from any ideas, methods, instructions or products referred to in the content. |
© 2025 by the authors. Licensee MDPI, Basel, Switzerland. This article is an open access article distributed under the terms and conditions of the Creative Commons Attribution (CC BY) license (https://creativecommons.org/licenses/by/4.0/).