1. Introduction
The global transformation and enhancement of the energy structure necessitate the effective production and exploitation of renewable energy, which is essential for attaining the strategic objectives of carbon peak and carbon neutrality. Hydropower, being the most technologically advanced and adaptable renewable energy source, serves as a crucial foundation in this shift. Due to its distinctive structural benefits, Pelton turbines are extensively utilized in harnessing hydraulic resources in high-head and low-flow scenarios, functioning as essential apparatus in hydropower facilities for producing high-value energy. The runner, a crucial pressure-bearing and energy-converting element, directly converts the kinetic energy of water into mechanical energy while functioning continuously under highly intricate loading situations. The dependability of its mechanical performance fundamentally dictates the operational efficiency, safety, stability, and longevity of the complete machine.
Misalignment of nozzles in Pelton turbines, typically resulting from installation discrepancies or silt erosion, often results in operating under non-optimal conditions. In recent years, other research has examined similar issues from diverse angles. Deng H et al. [
1] demonstrated that jet eccentricity caused by nozzle misalignment, utilizing a Volume of Fluid (VOF) two-phase flow model and the Shear Stress Transport (SST)
k-ω turbulence model, leads to a significant increase in the axial force on the runner and heightened pressure fluctuations. Simin Y et al. [
2] utilized the Navier–Stokes equations and the SST
k-ω turbulence model to elucidate the jet deflection flow characteristics of a Pelton turbine deflector during emergency load rejection using CFD simulations. Haoru Z et al. [
3] employed both experimental and numerical approaches to clarify the flow evolution mechanism within the runner, demonstrating that energy conversion efficiency peaks when the jet strikes the bucket vertically, and delineated a topological structure of this phenomenon. Semlitsch B et al. [
4] utilizing the VOF method and the SST
k-ω turbulence model, were the pioneers in illustrating that minor inflow disturbances from penstock bends substantially influence jet quality in a Pelton turbine manifold, and identified that secondary flows can alleviate the impact of flow imbalance between nozzles on jet deflection. Yexiang X et al. [
5] elucidated the impact of bucket quantity on hydraulic efficiency by three-dimensional unsteady numerical simulations. Gao J et al. [
6] examined the transition process of an ultra-high-head Pelton turbine, uncovering the intricate internal flow mechanics and dynamic hydraulic properties during significant variations in nozzle opening and closure using theoretical analysis and numerical simulations. Guo T et al. [
7] elucidated the flow loss patterns in the water supply components of a four-nozzle Pelton turbine, utilizing entropy generation theory. Khan F et al. [
8] discovered via CFD simulations that the implementation of a tangential flow deflector in Pelton turbines facilitates swift power control, diminishes the optimal efficiency point load, and proficiently mitigates the sluggish response constraint associated with needle valve adjustments. Li J et al. [
9] concentrating on a 500 MW-class large Pelton turbine, employed a combined VOF-DPM model with a wear prediction model to ascertain the regions of highest wear rate on the buckets under sediment-laden flow conditions. Liu J T et al. [
10,
11] established a sediment erosion prediction model for the runner under high sediment-laden flow conditions by merging numerical simulations with sediment erosion experiments.
However, a critical gap exists in the literature regarding the detailed mechanical response of the runner structure under these off-design conditions. While computational fluid dynamics (CFD) studies are abundant, the subsequent fluid–structure interaction (FSI) and its impact on stress, strain, and deformation—critical for fatigue life prediction—are not thoroughly investigated for Pelton turbines. Current research on fluid–structure interaction (FSI) in hydraulic turbines mostly concentrates on Francis turbines. Kan K et al. [
12] introduced a multi-scale fluid–structure interaction framework that incorporates millimeter-scale gap flow with a comprehensive shaft system, elucidating the pressure fluctuations and structural response mechanisms of a 710 MW Francis turbine under intricate flow conditions, thus addressing the shortcomings of conventional simplified models. Huang X et al. [
13] utilized a comprehensive three-dimensional fluid–structure interaction method to examine the flow-induced dynamic properties of a 46 MW large Francis turbine across a 25–100% load spectrum, revealing that the position of peak stress on the runner fluctuates with load while remaining significantly beneath the material’s yield threshold. Xia X et al. [
14] identified synchronous frequency and damping splitting in a submerged rotating disk (simulating a high-head runner) by FSI analysis, noting that decreasing the wall distance markedly amplifies this phenomenon. Hu D S et al. [
15] employed an acoustic fluid–structure interaction method to elucidate the effect of gap water thickness on the modal frequencies of the runner and head cover, indicating that gap water elevates the nodal diameter mode frequencies of the runner and induces frequency veering, whereas head cover deformation solely modifies the vibration mode phase. Cui G et al. [
16] utilized a high-precision spectral element approach and a fluid–structure interaction algorithm to clarify the vortex-induced vibration mechanism in the guide vane region. Li L H et al. [
17] examined the correlation between vortex features and stress distribution in the runner under varying guide vane openings at the rated head using fluid–structure interaction numerical modeling. Sun L et al. [
18] discovered through FSI analysis that the runner of a six-nozzle Pelton turbine demonstrates low-frequency global oscillations and high-frequency local vibrations when subjected to high-speed jet impact.
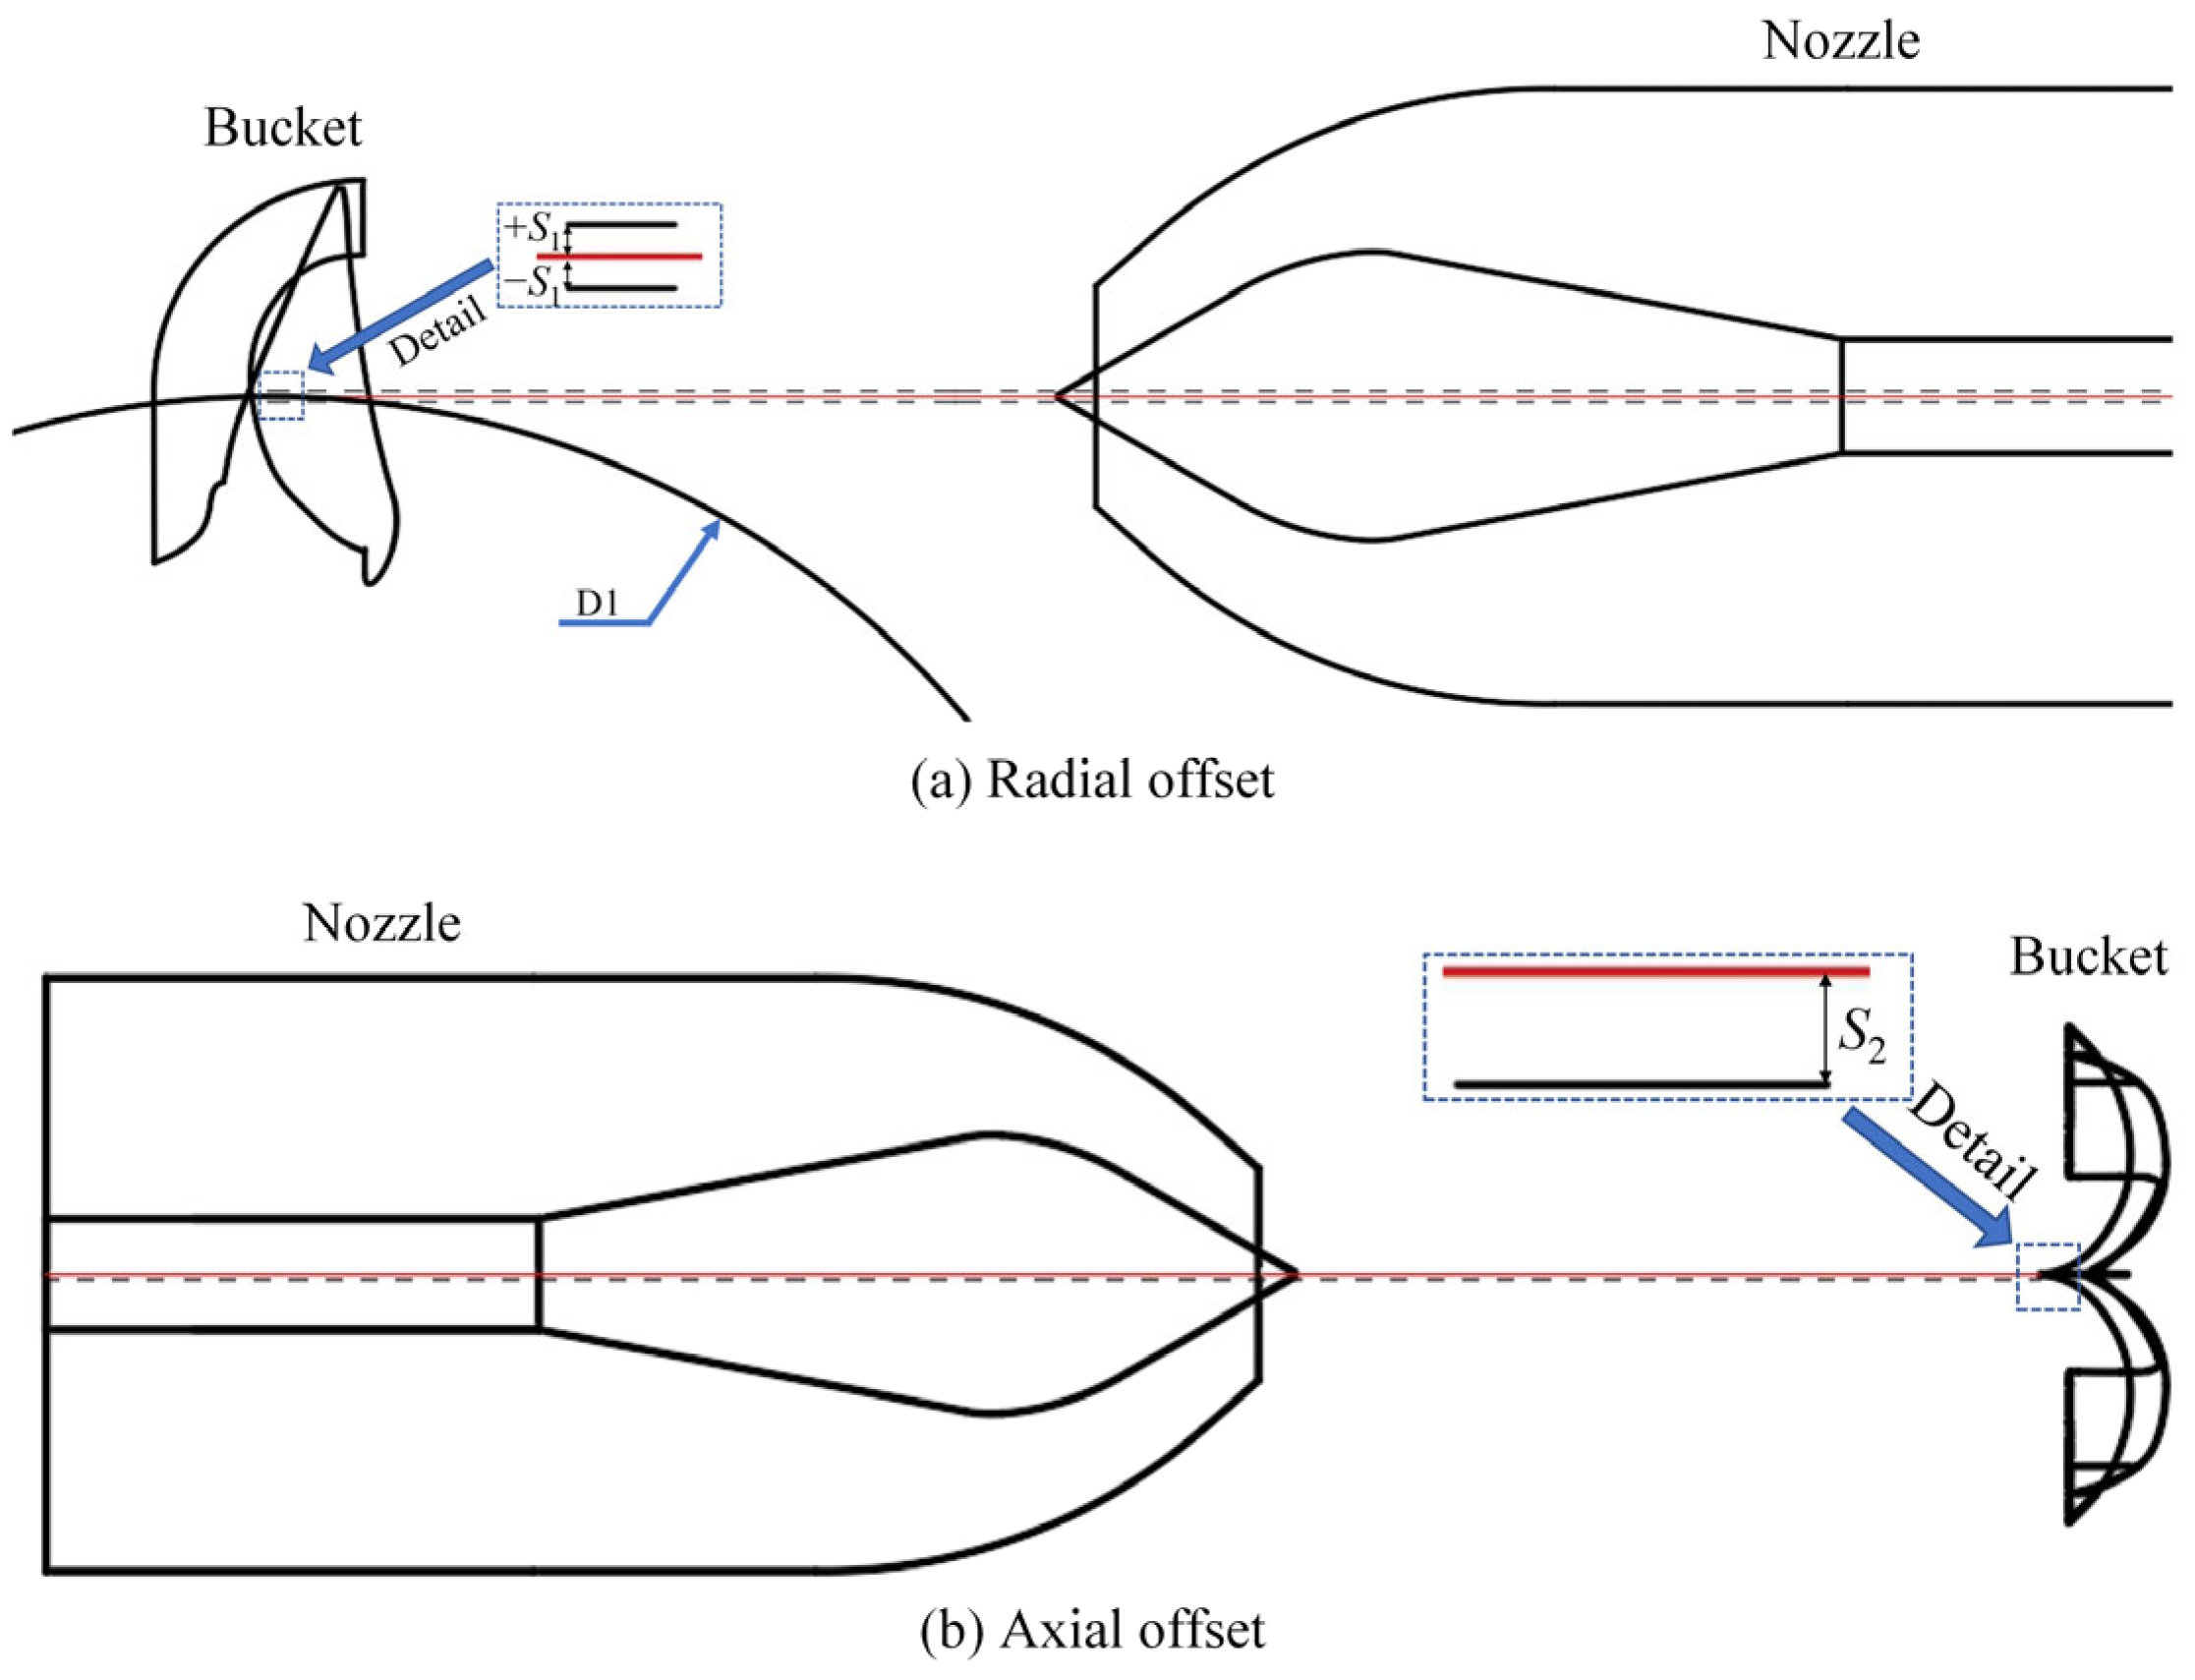
This core of this study lies in the systematic FSI-based investigation of the mechanical characteristics of a Pelton turbine runner under specific jet offset conditions (radial and axial), which are common in practical operation but poorly addressed in existing research. The primary objectives of this study are: (1) to quantify the distribution of Von-Mises stress, strain, and total deformation on the runner surface under unbiased and offset jet conditions; (2) to identify the most critical offset condition leading to stress concentration and potential high-cycle fatigue risk; and (3) to establish a theoretical foundation for the structural enhancement of Pelton turbines operating in misalignment scenarios.
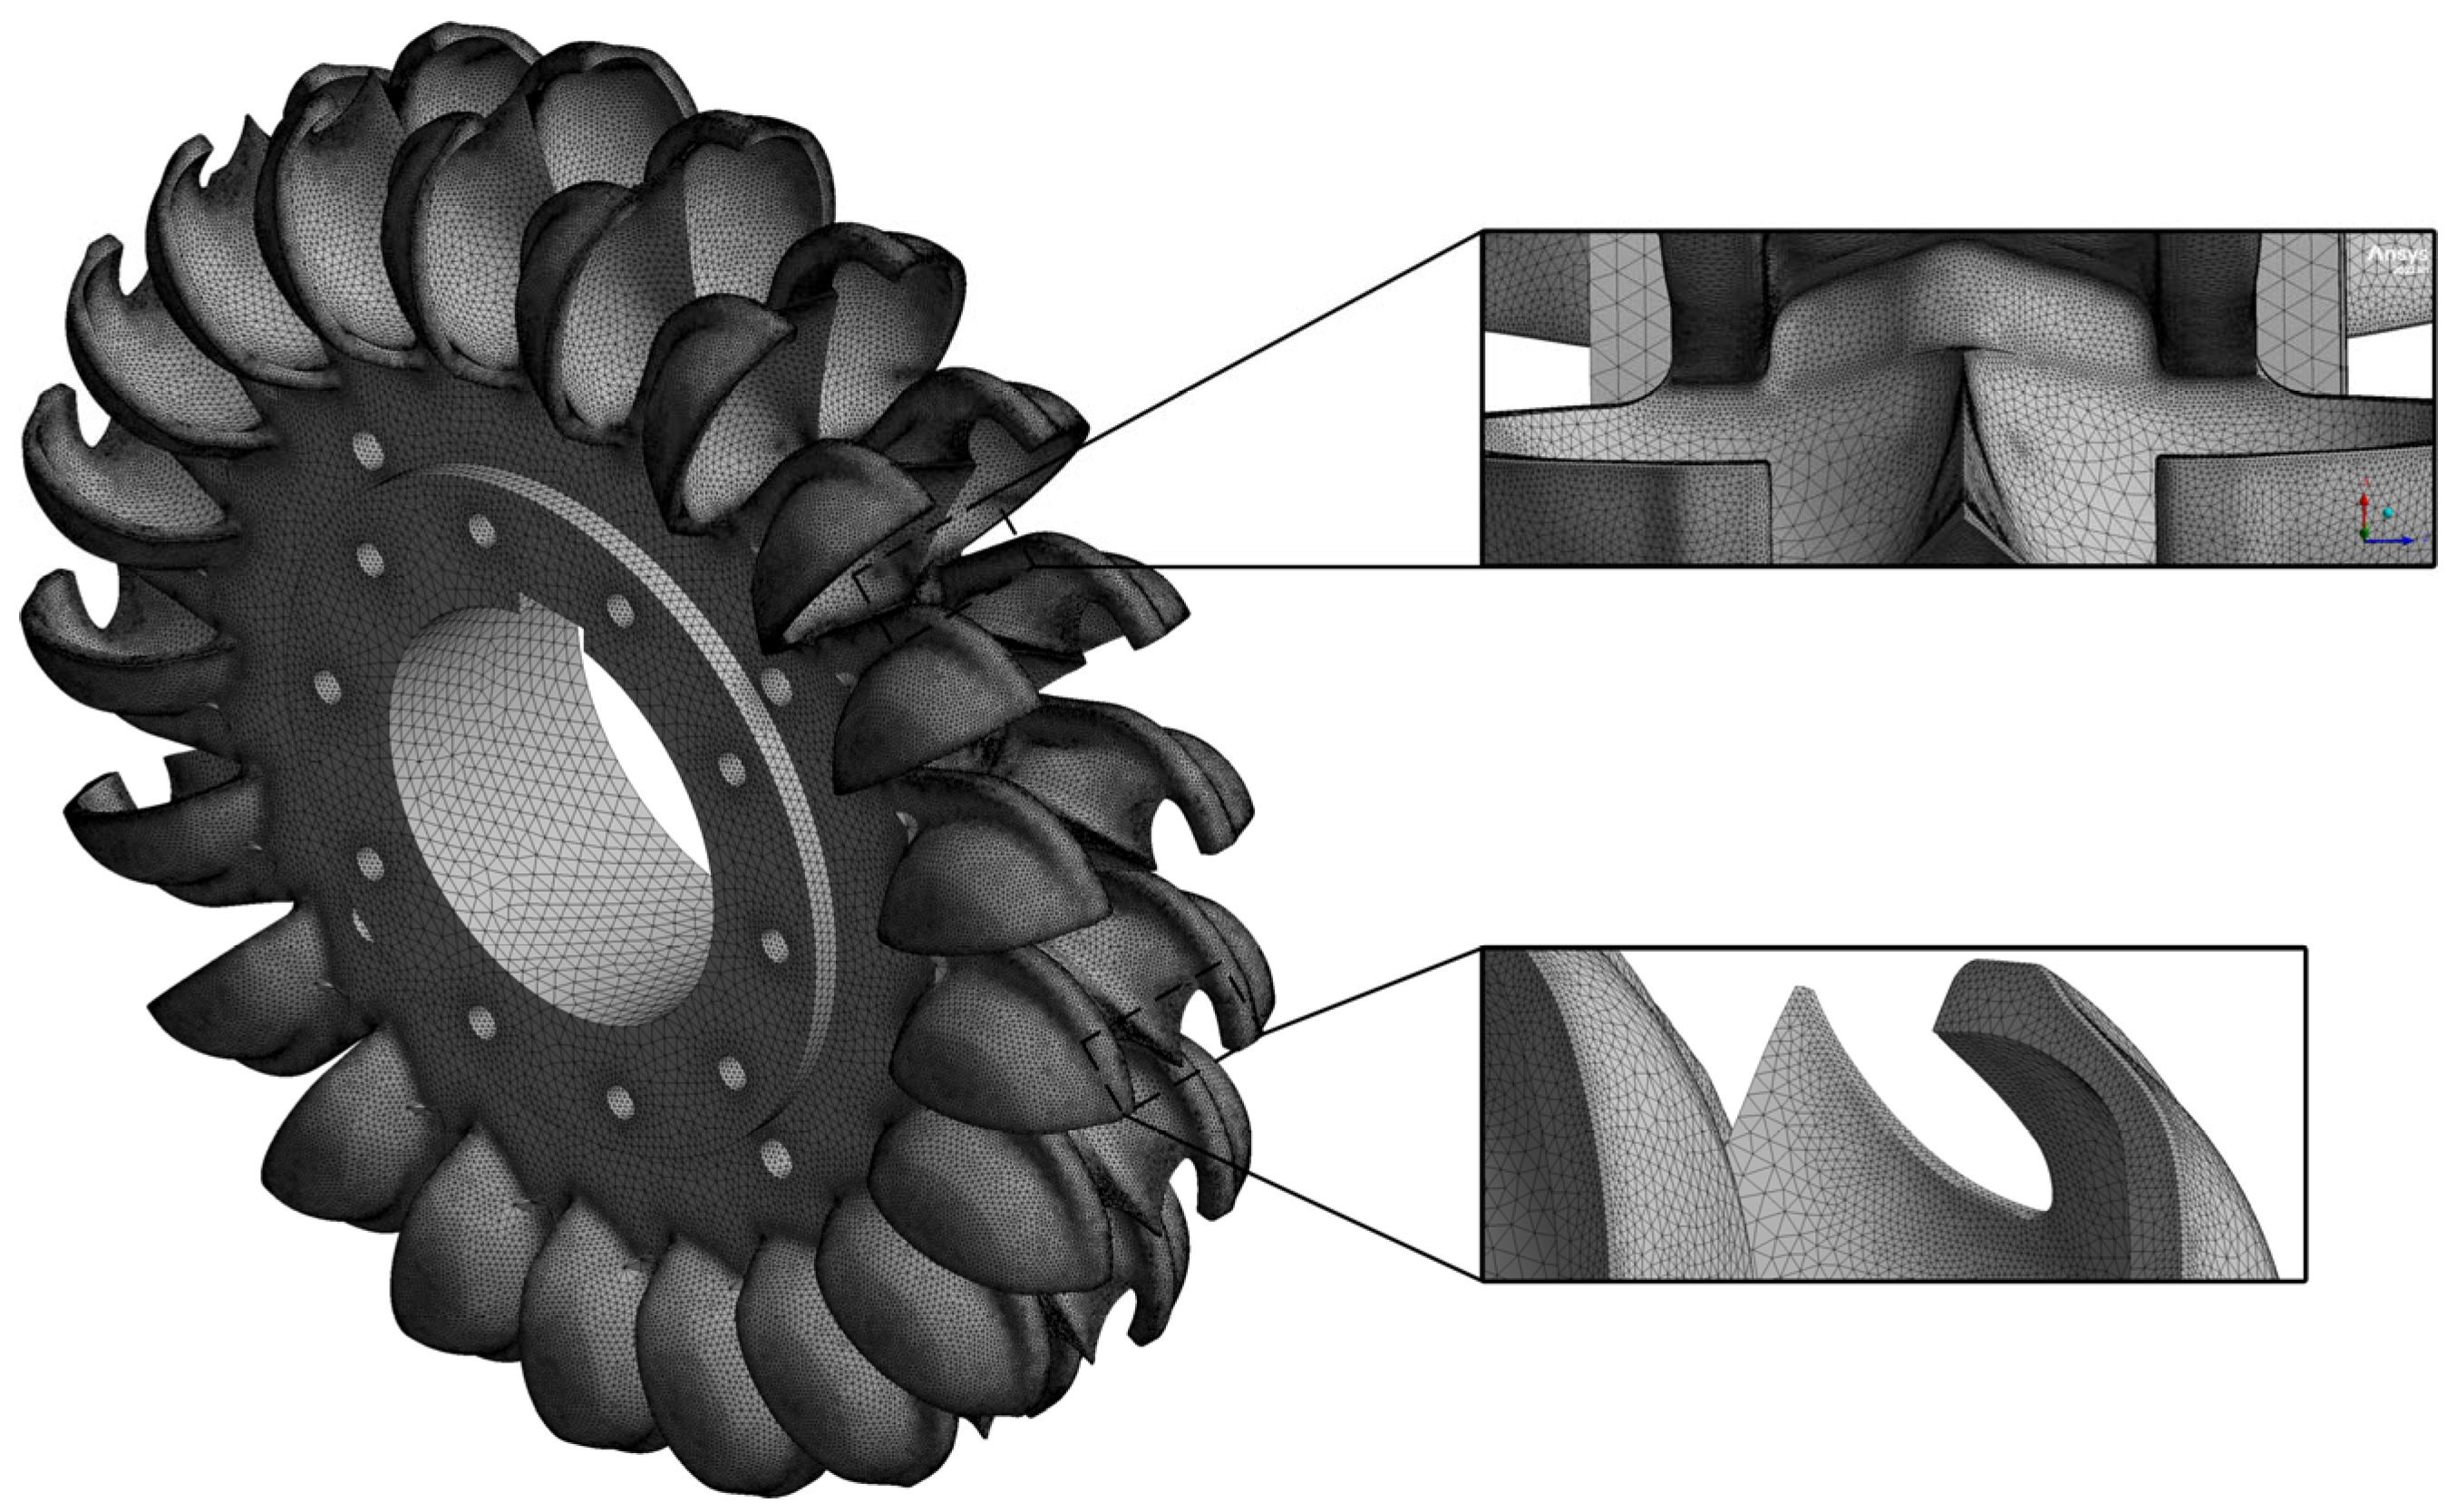
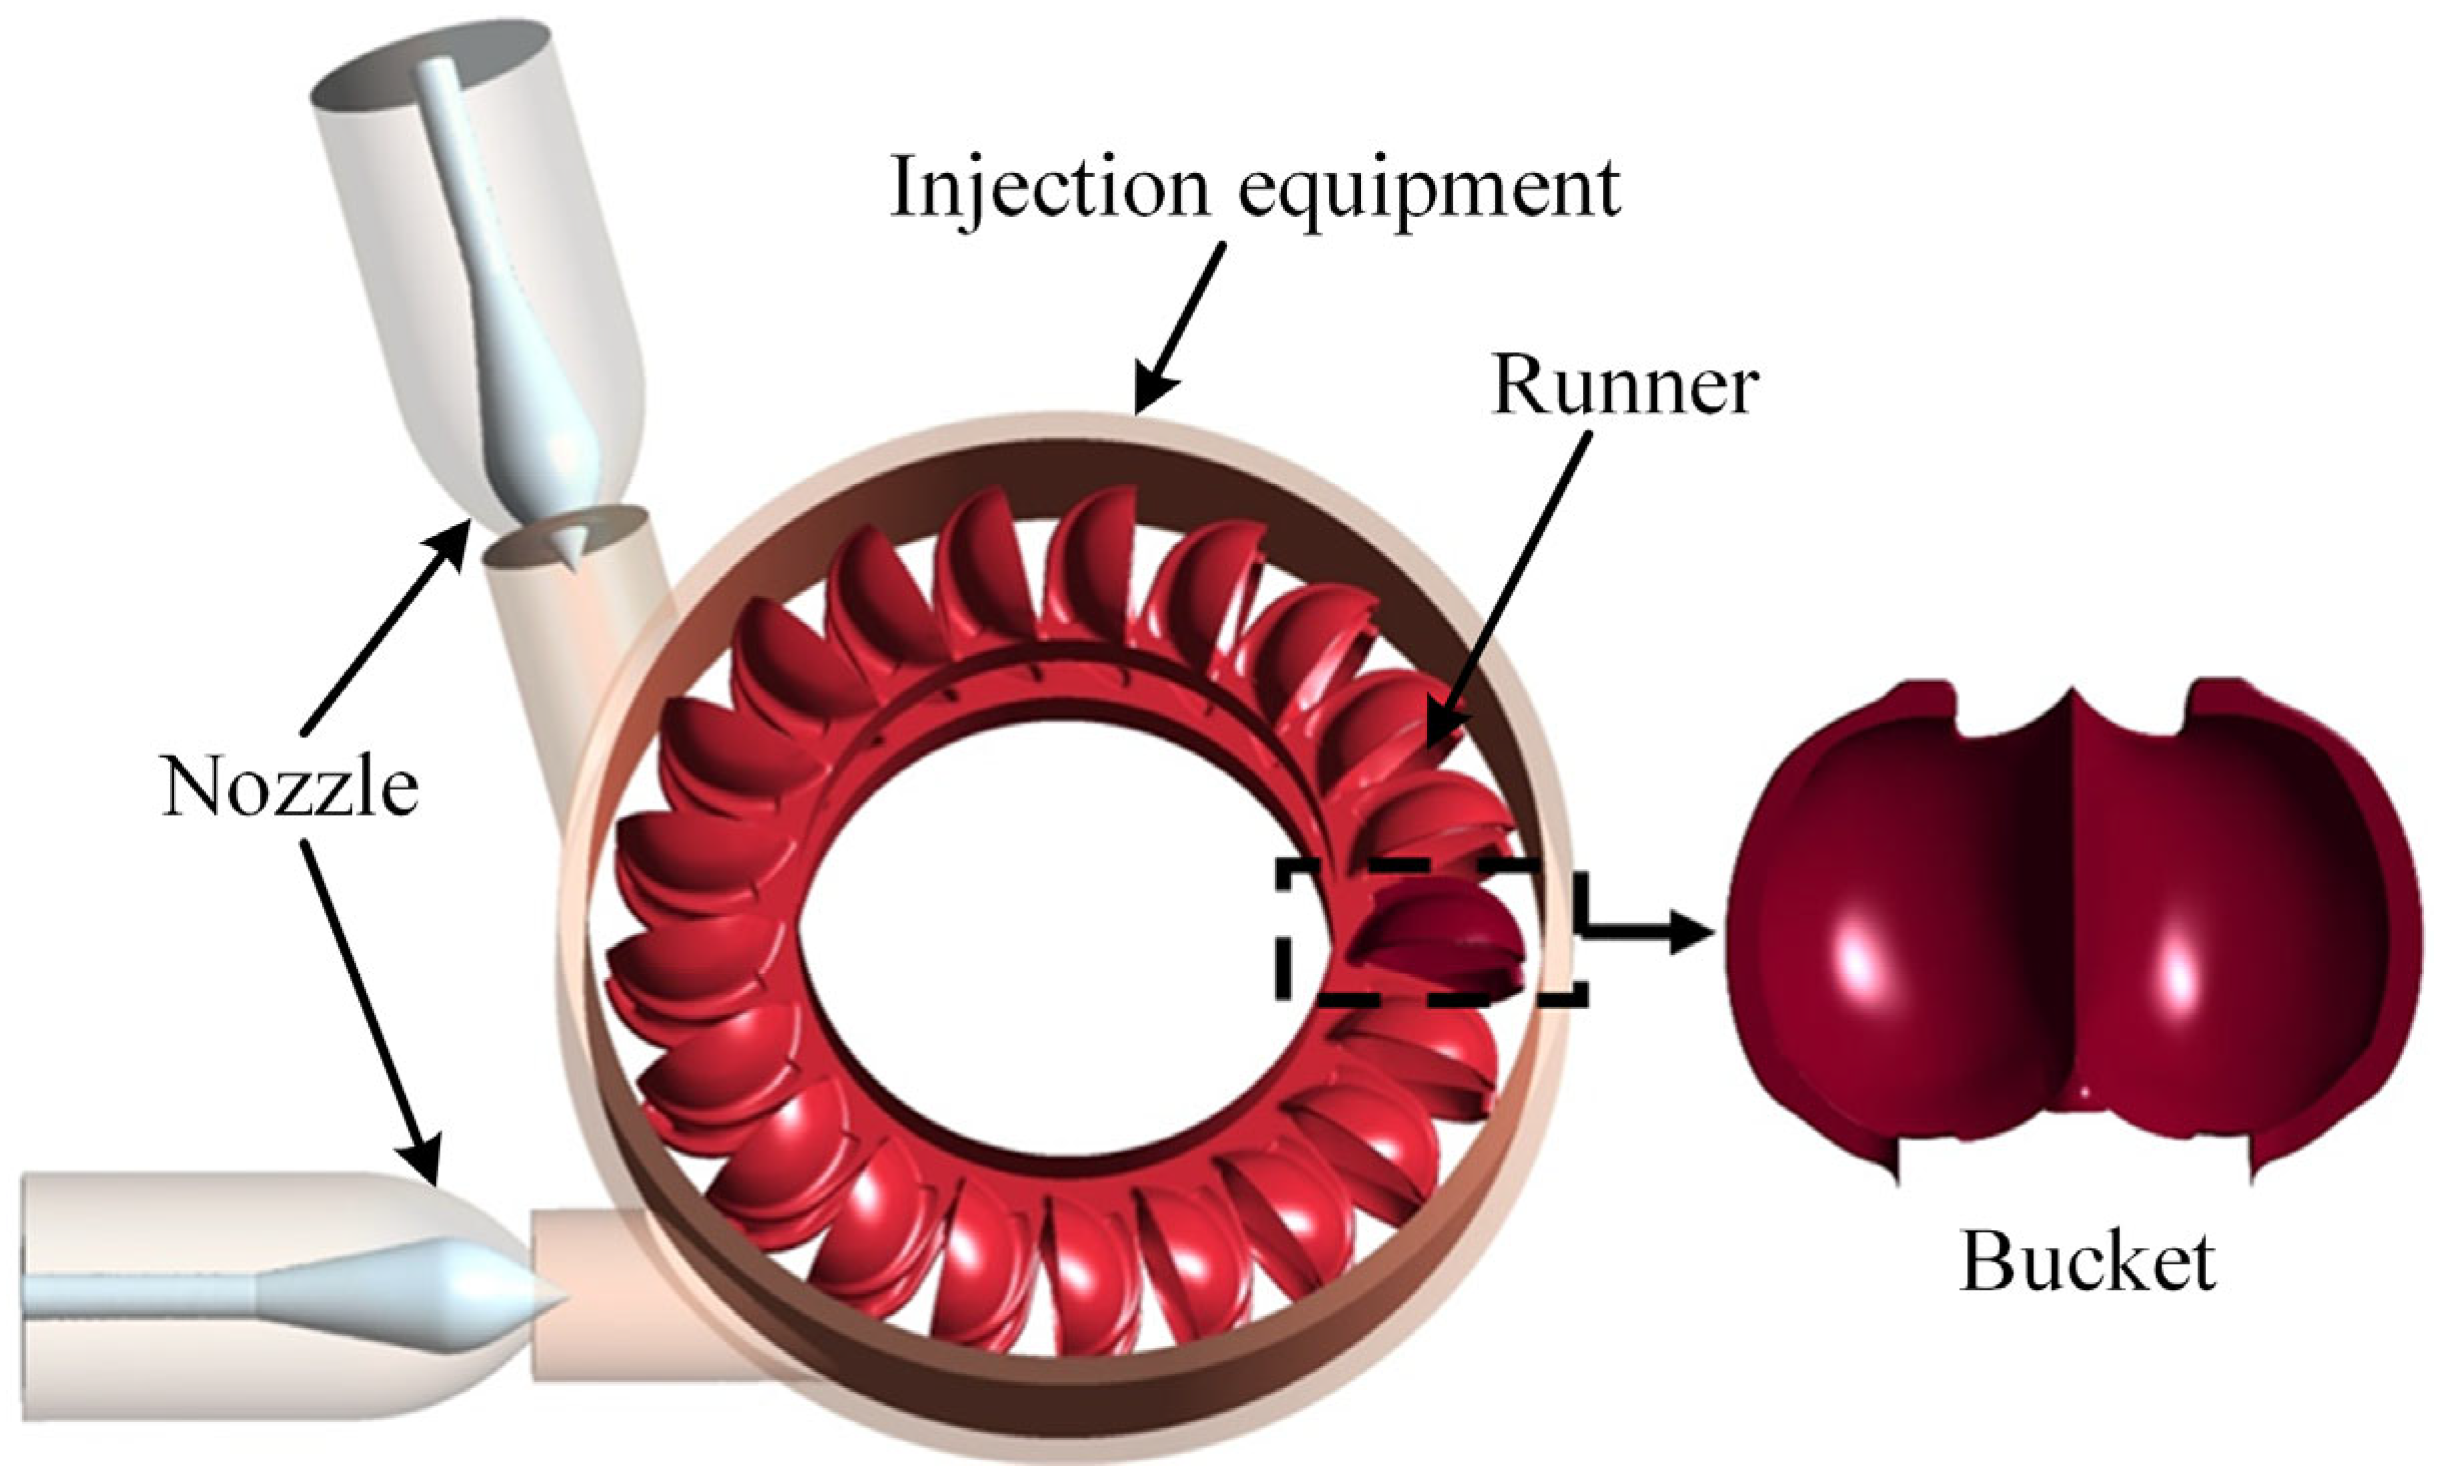
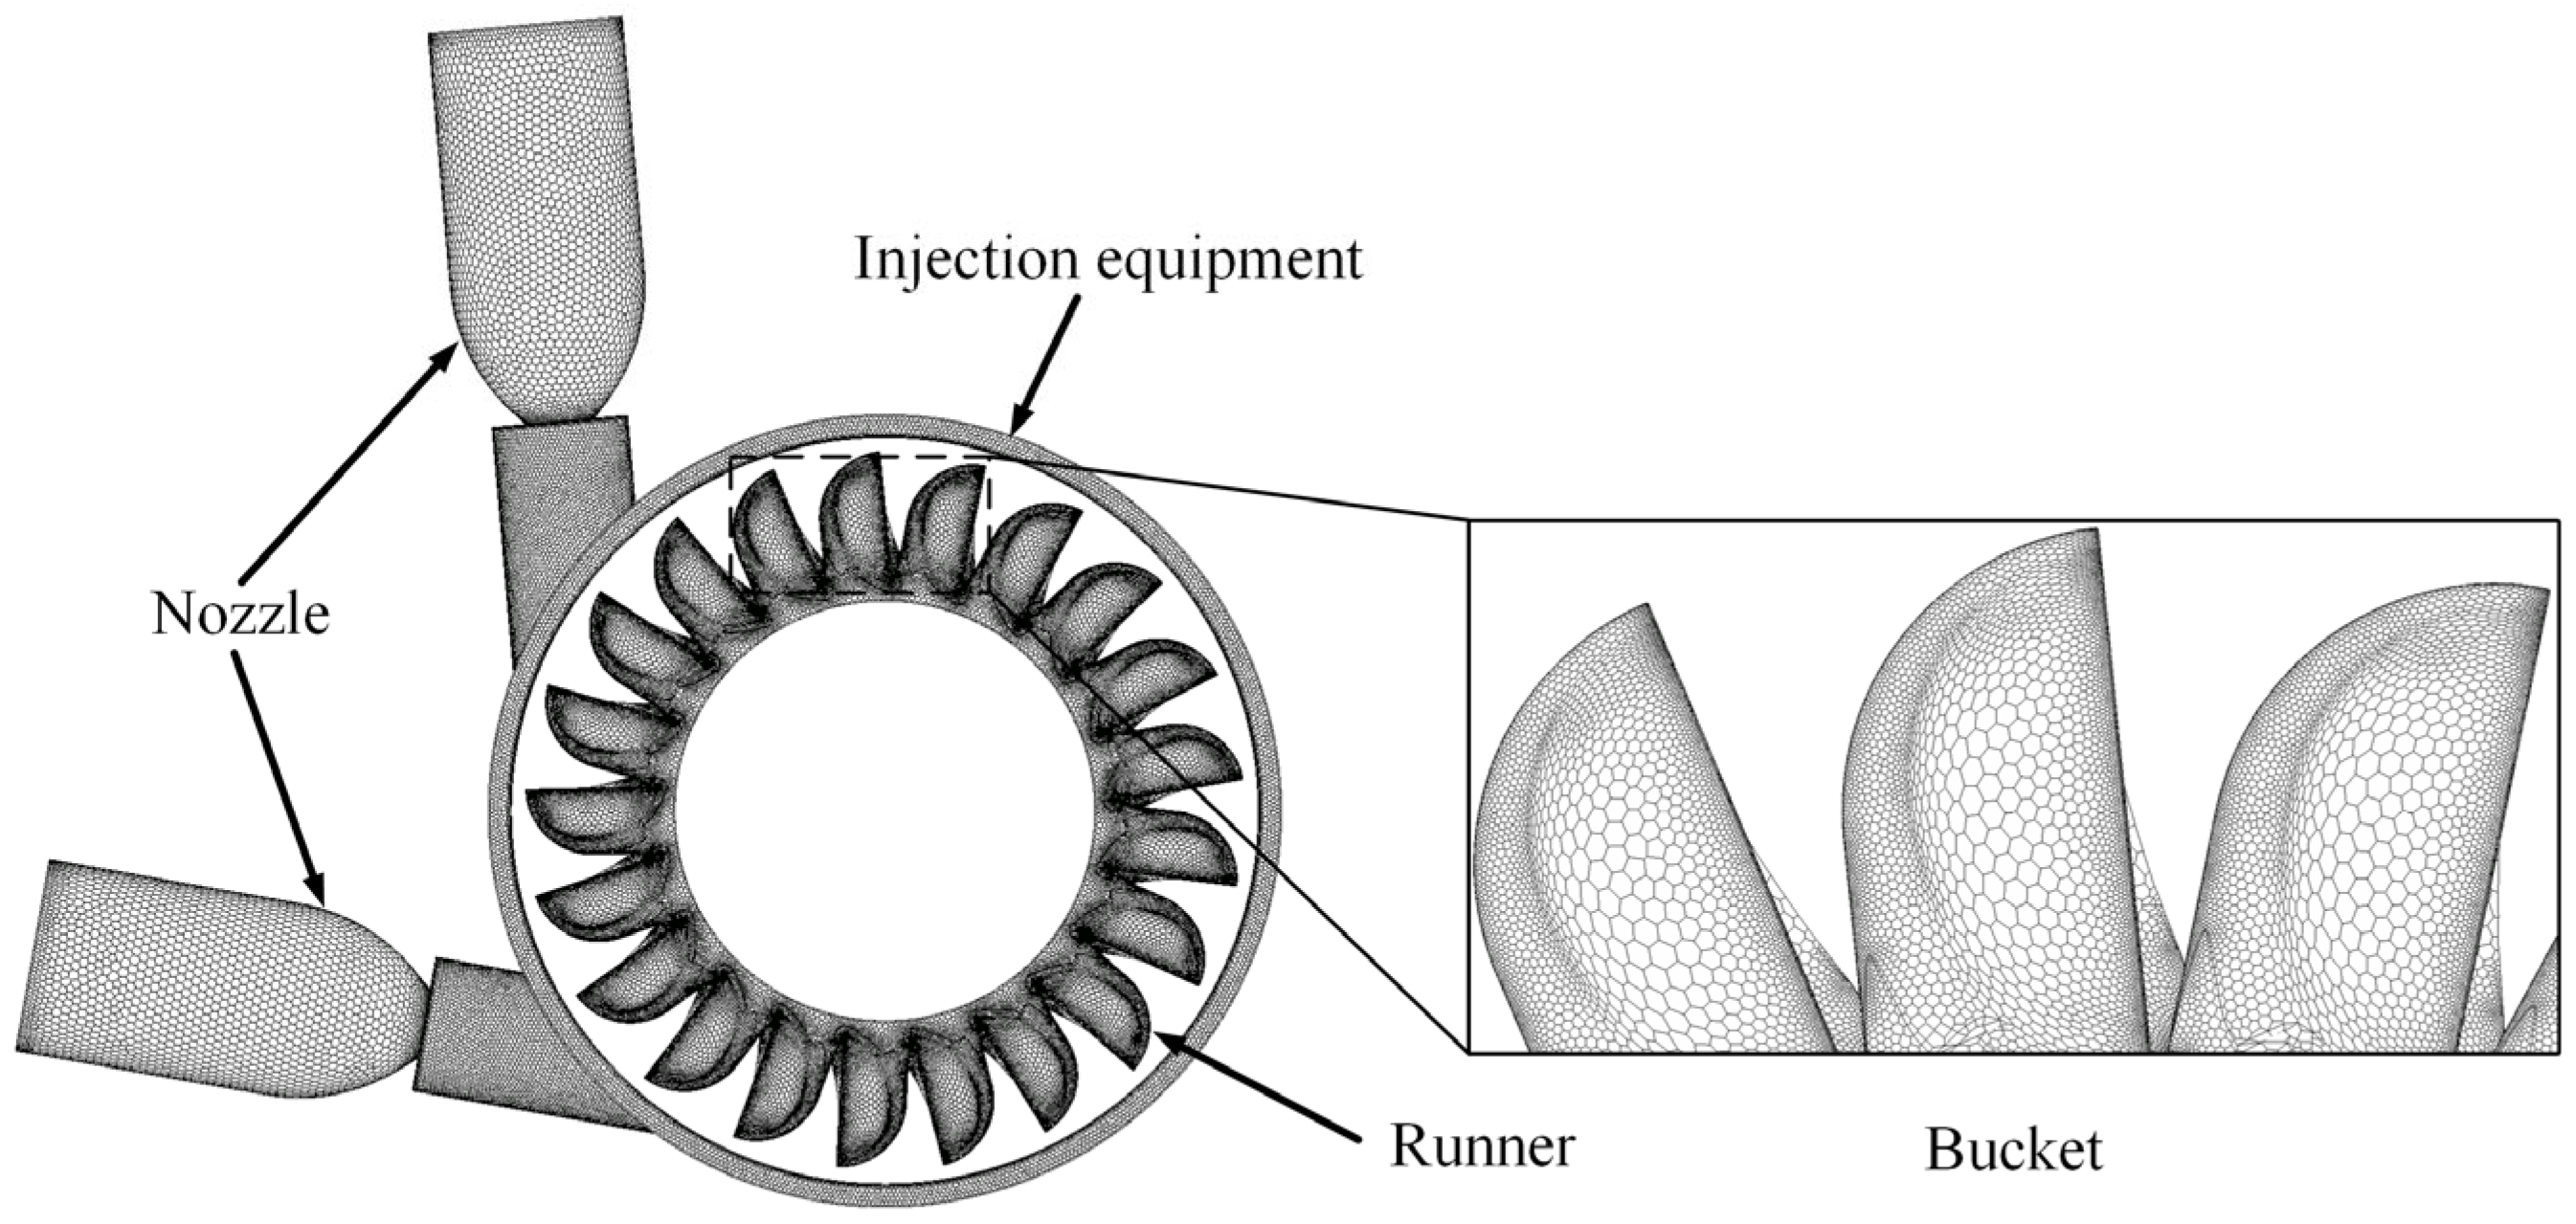
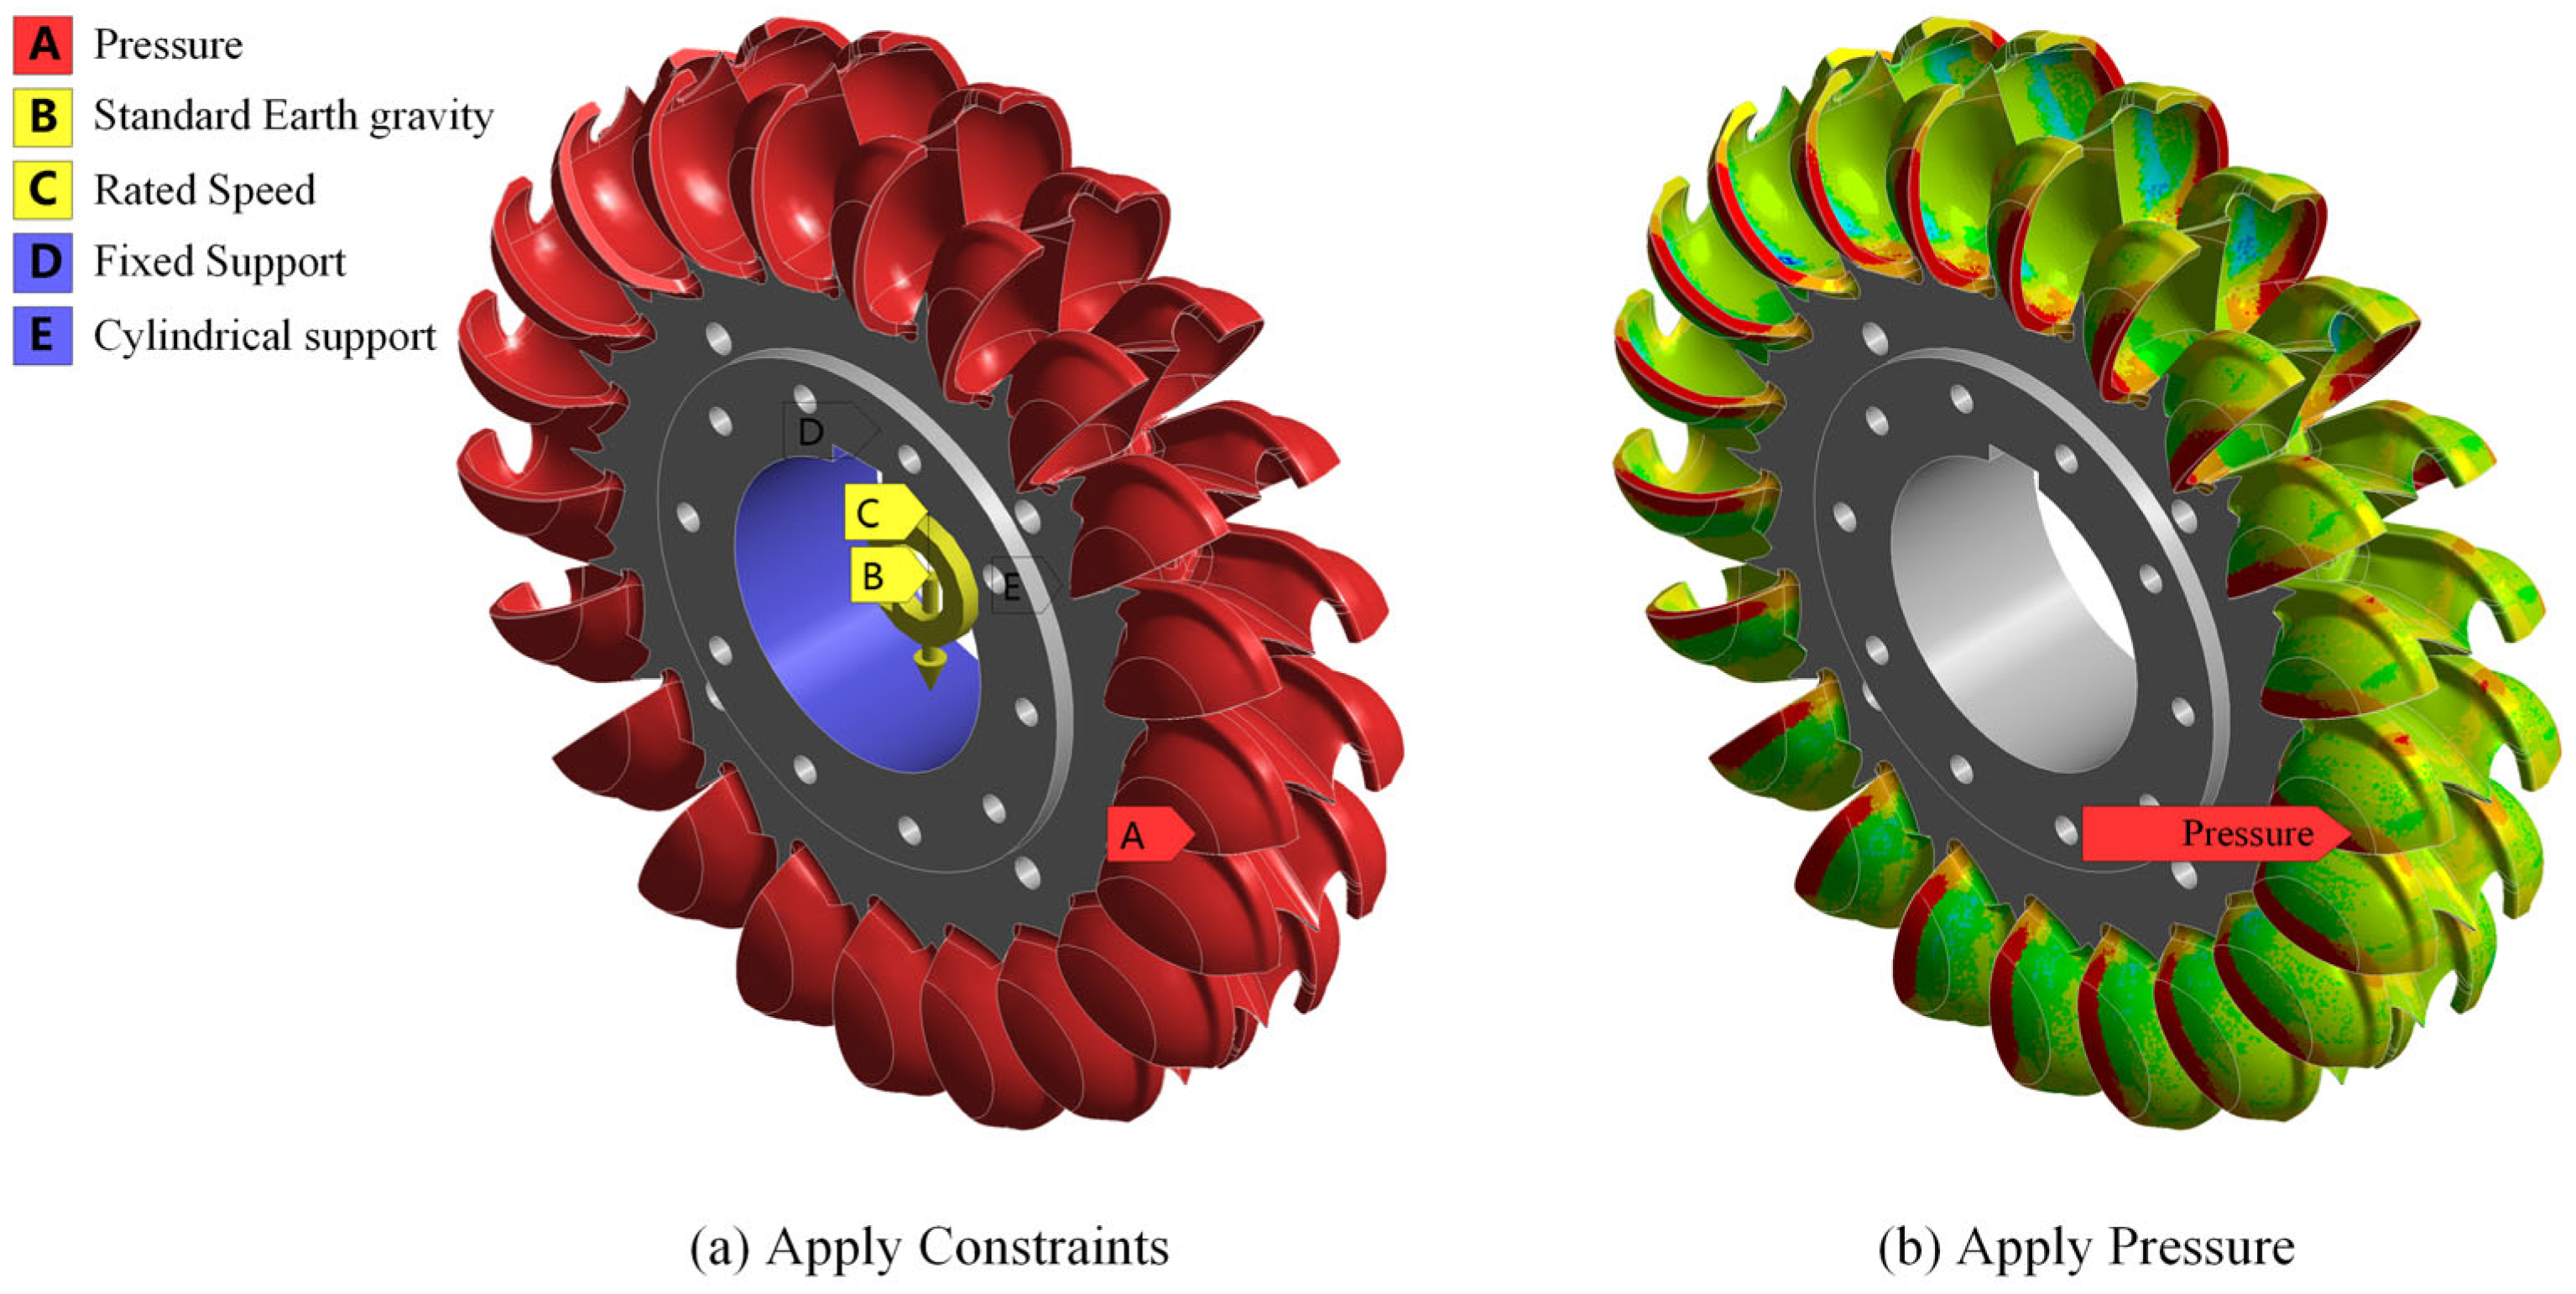
This study focuses on the Pelton turbine of the Shangheba Hydropower Station. To address the prevalent issue of misalignment situations experienced during actual operation, relevant numerical simulation research is undertaken. The workflow involved: (1) developing high-fidelity CFD models of the turbine under four offset conditions to obtain the transient pressure load on the buckets; (2) performing a grid independence study for both fluid and structural domains to ensure solution accuracy; (3) applying the calculated pressure loads, along with centrifugal and gravitational forces, to a finite element model of the runner for static structural analysis; and (4) comparatively analyzing the resulting stress, strain, and deformation fields.
4. Numerical Calculation Results
4.1. Von-Mises Stress Analysis
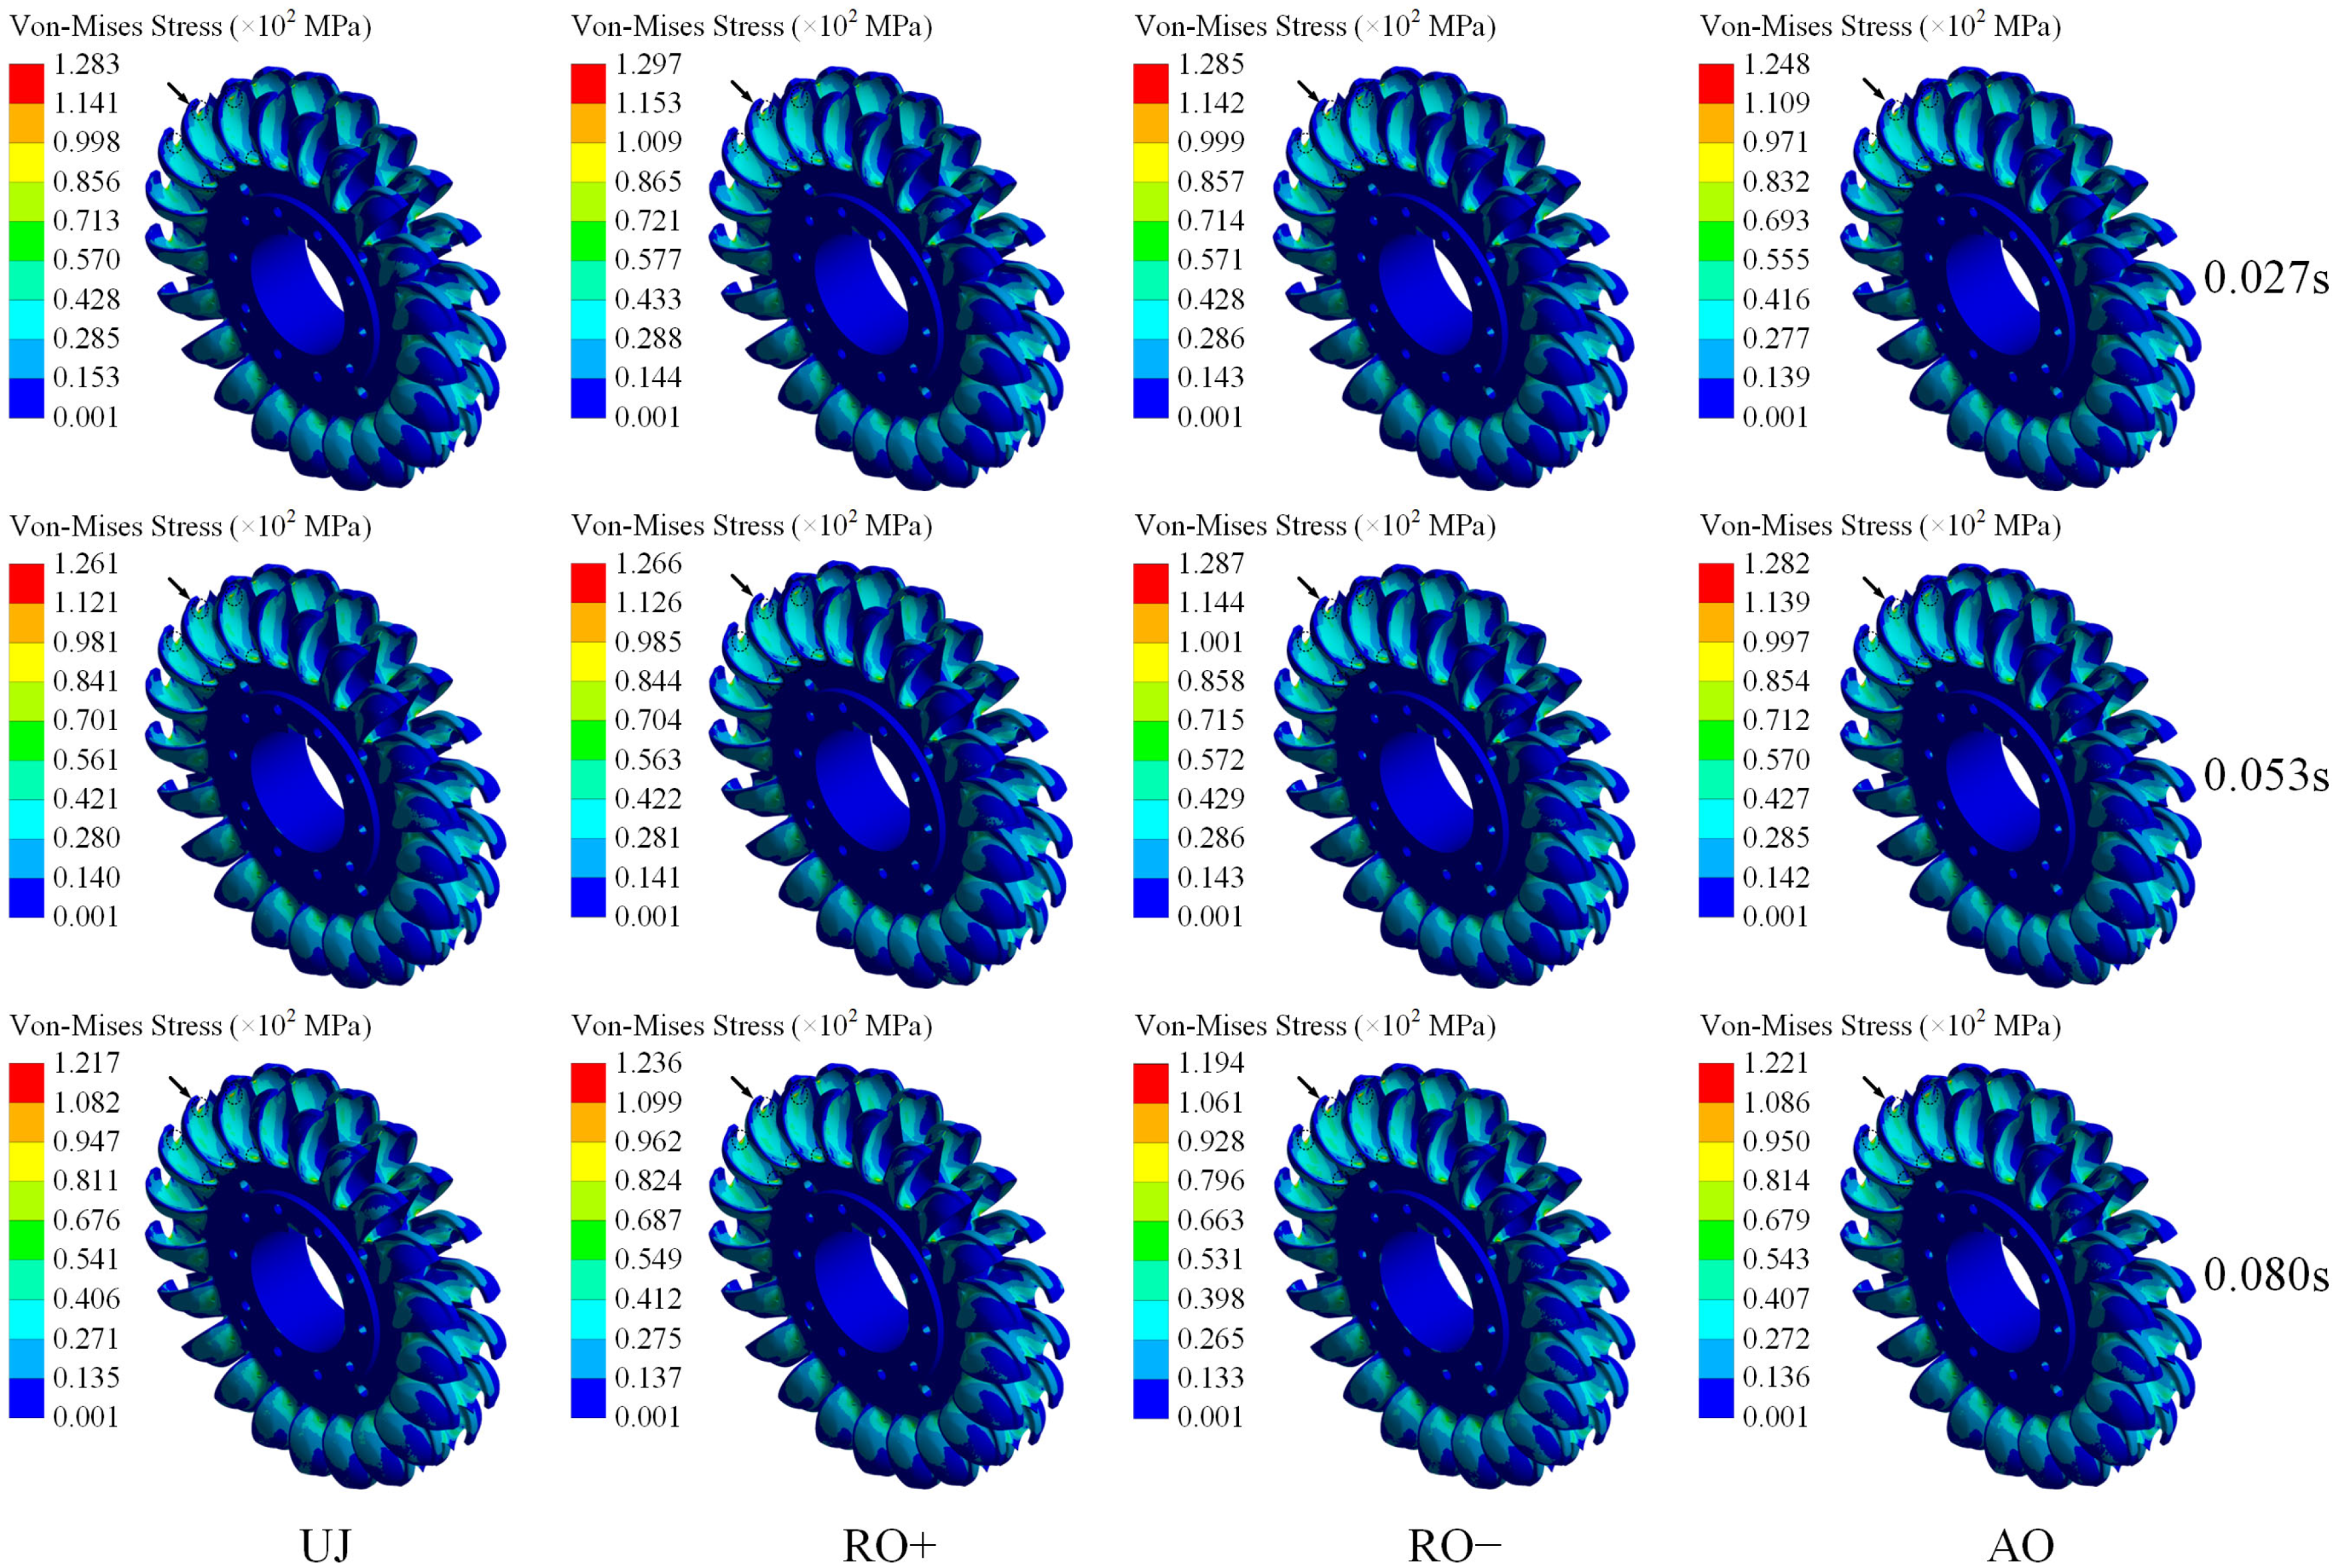
Figure 6 depicts the distribution of Von-Mises stress on the runner surface throughout one cycle under various operating circumstances. The Von-Mises stress is equivalent strain, that is frequently employed to evaluate the yield behavior of materials subjected to multiaxial stress conditions.
Figure 5 illustrates that the maximum Von-Mises stress on the runner surface under various conditions varies from 119.4 MPa to 129.7 MPa, displaying a non-uniform distribution and a pronounced gradient. Stress concentration was predominantly noted in regions directly affected by the jet and at sites with sudden geometrical alterations in the runner structure, such the bucket roots and gaps. These locations are prone to the beginning of fatigue cracks. The offset conditions imposed asymmetric loading on the runner surface, resulting in localized stress concentrations and heightening the probability of fatigue fracture development.
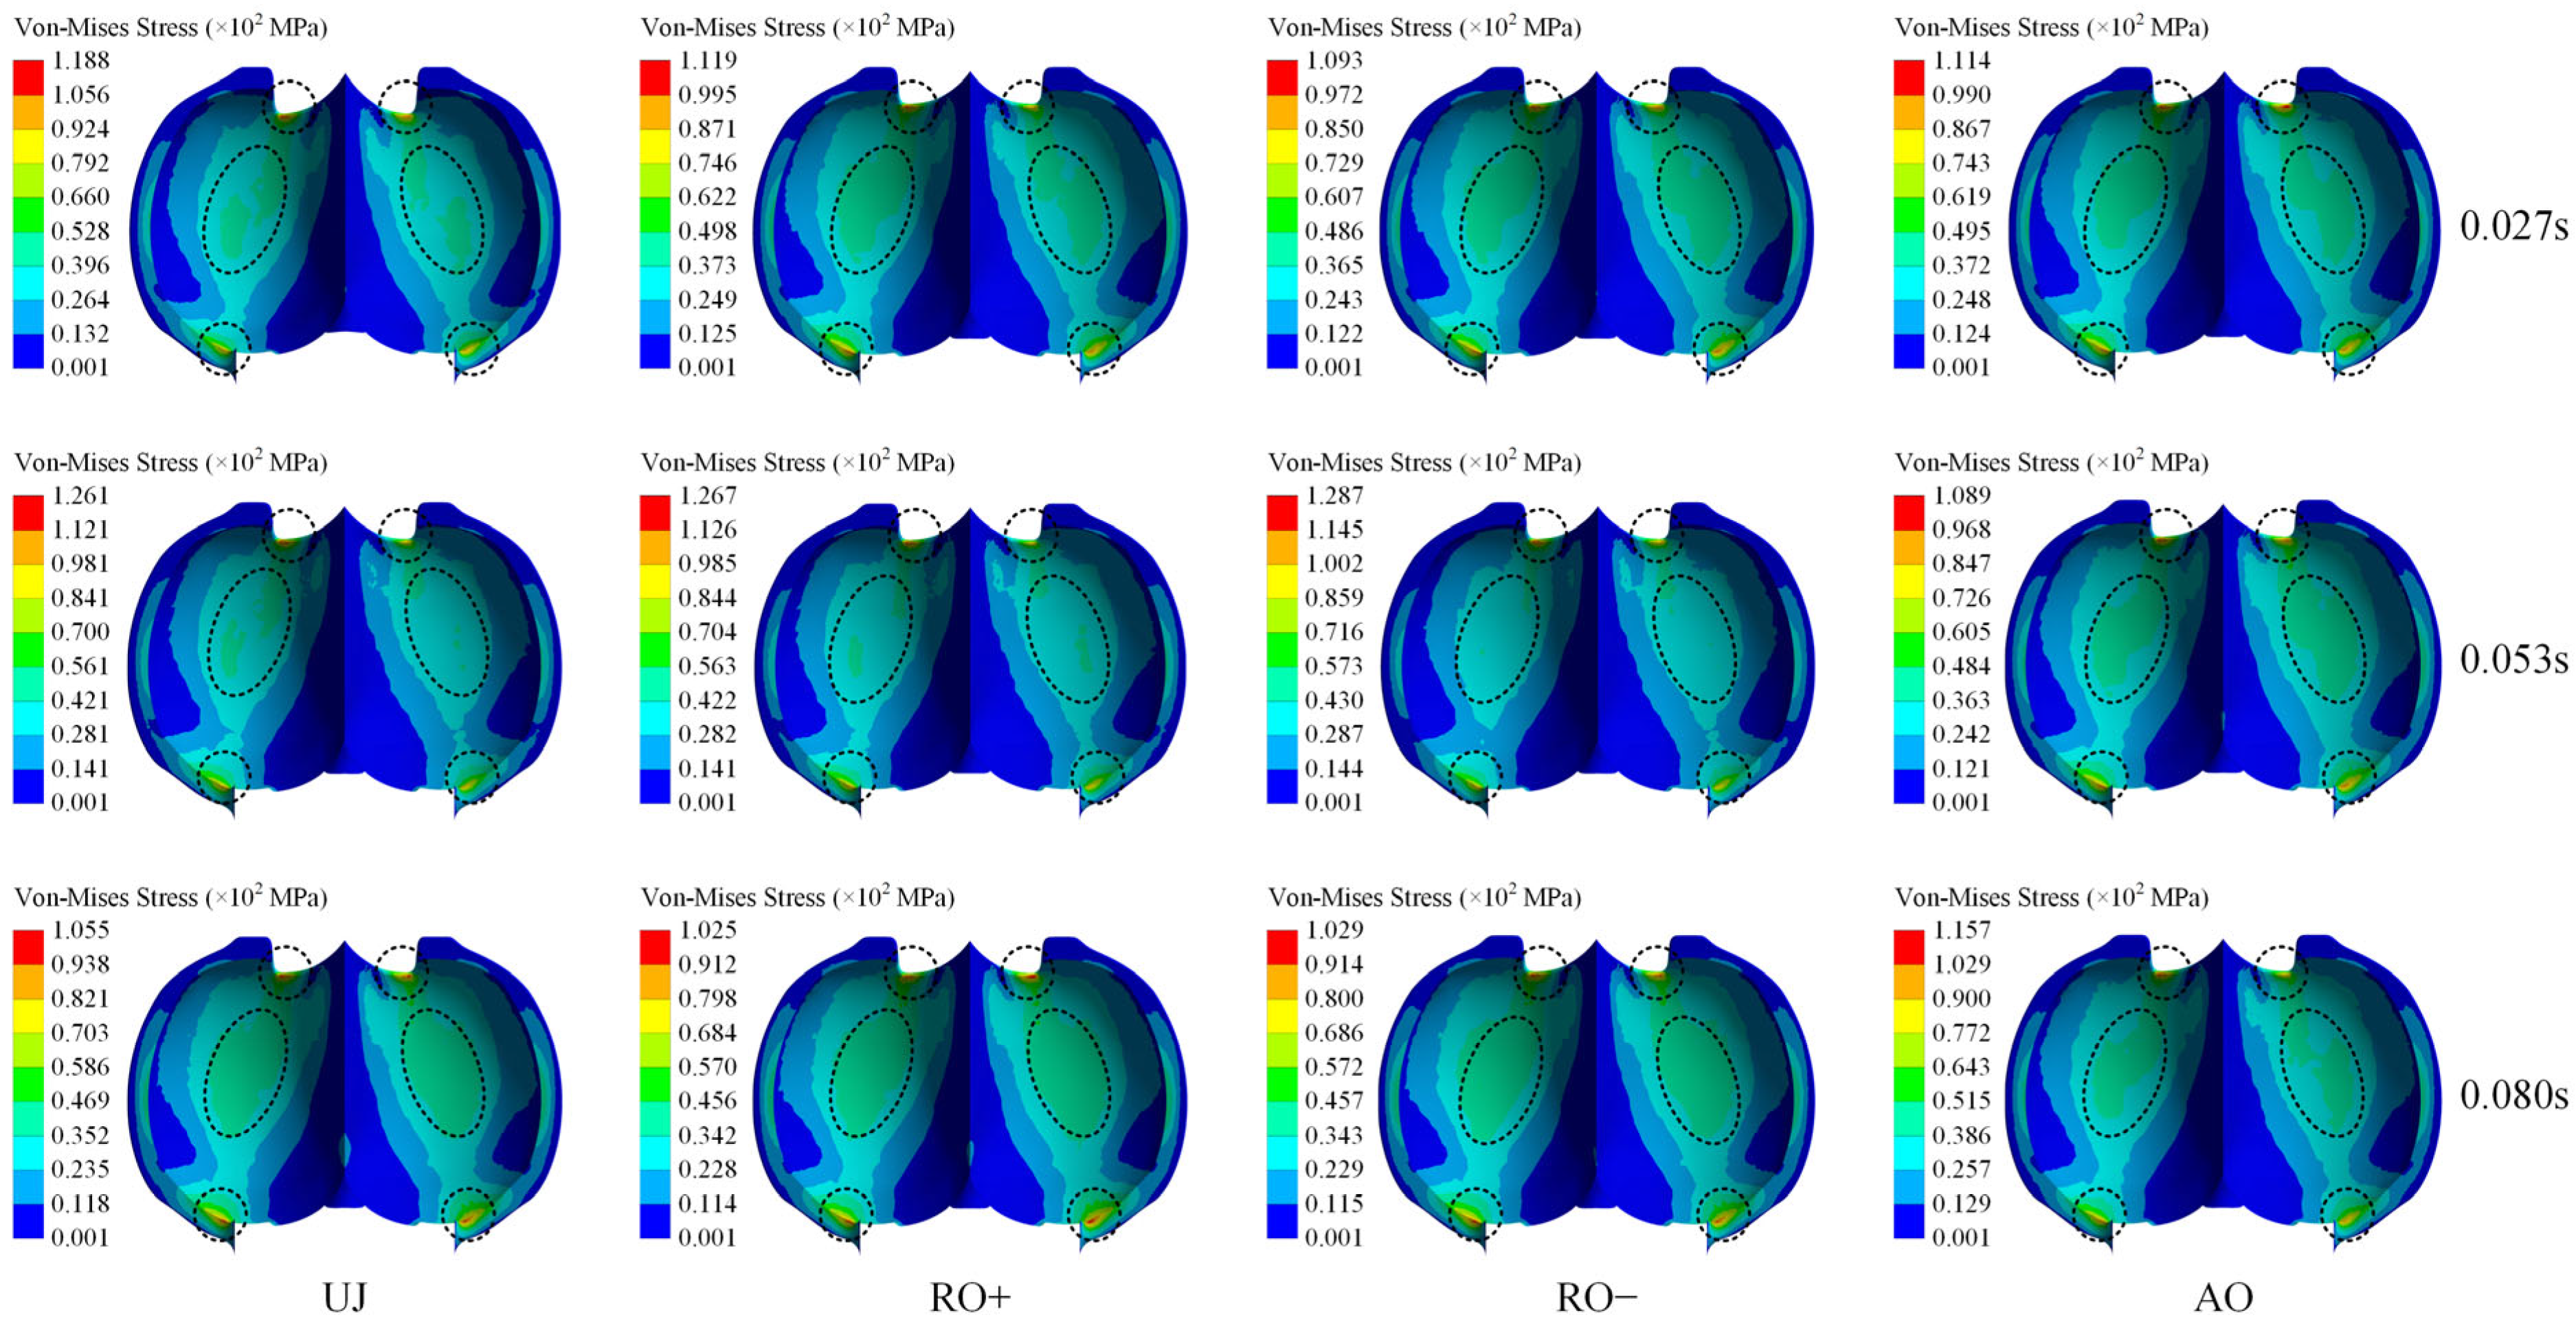
Figure 7 illustrates the distribution of Von-Mises stress on the pressure side of a single bucket across one operational cycle under varying operating conditions.
Figure 6 illustrates that the maximum Von-Mises stress on the bucket surface varies from 102.9 MPa to 128.7 MPa under different situations. The impact energy of the water jet is predominantly absorbed by the pressure side of the bucket, resulting in increased stress levels in this area. High-stress regions are mostly situated on the pressure side surface, the bucket root, the notch, and the mid-section of the trailing edge. Significant stress concentrations are notably present at the bucket root and the notch, mostly because of the intricate geometry and sudden curvature transitions in these regions. Conversely, the splitter demonstrates comparatively low Von-Mises stress. This results from its acute edge, which diminishes the effective impact area for the incoming water jet. Moreover, the flow-separation effect induced by the splitter modifies the flow pattern, channeling the majority of the impact energy towards the pressure side, hence resulting in the development of significant stress concentrations in that area.
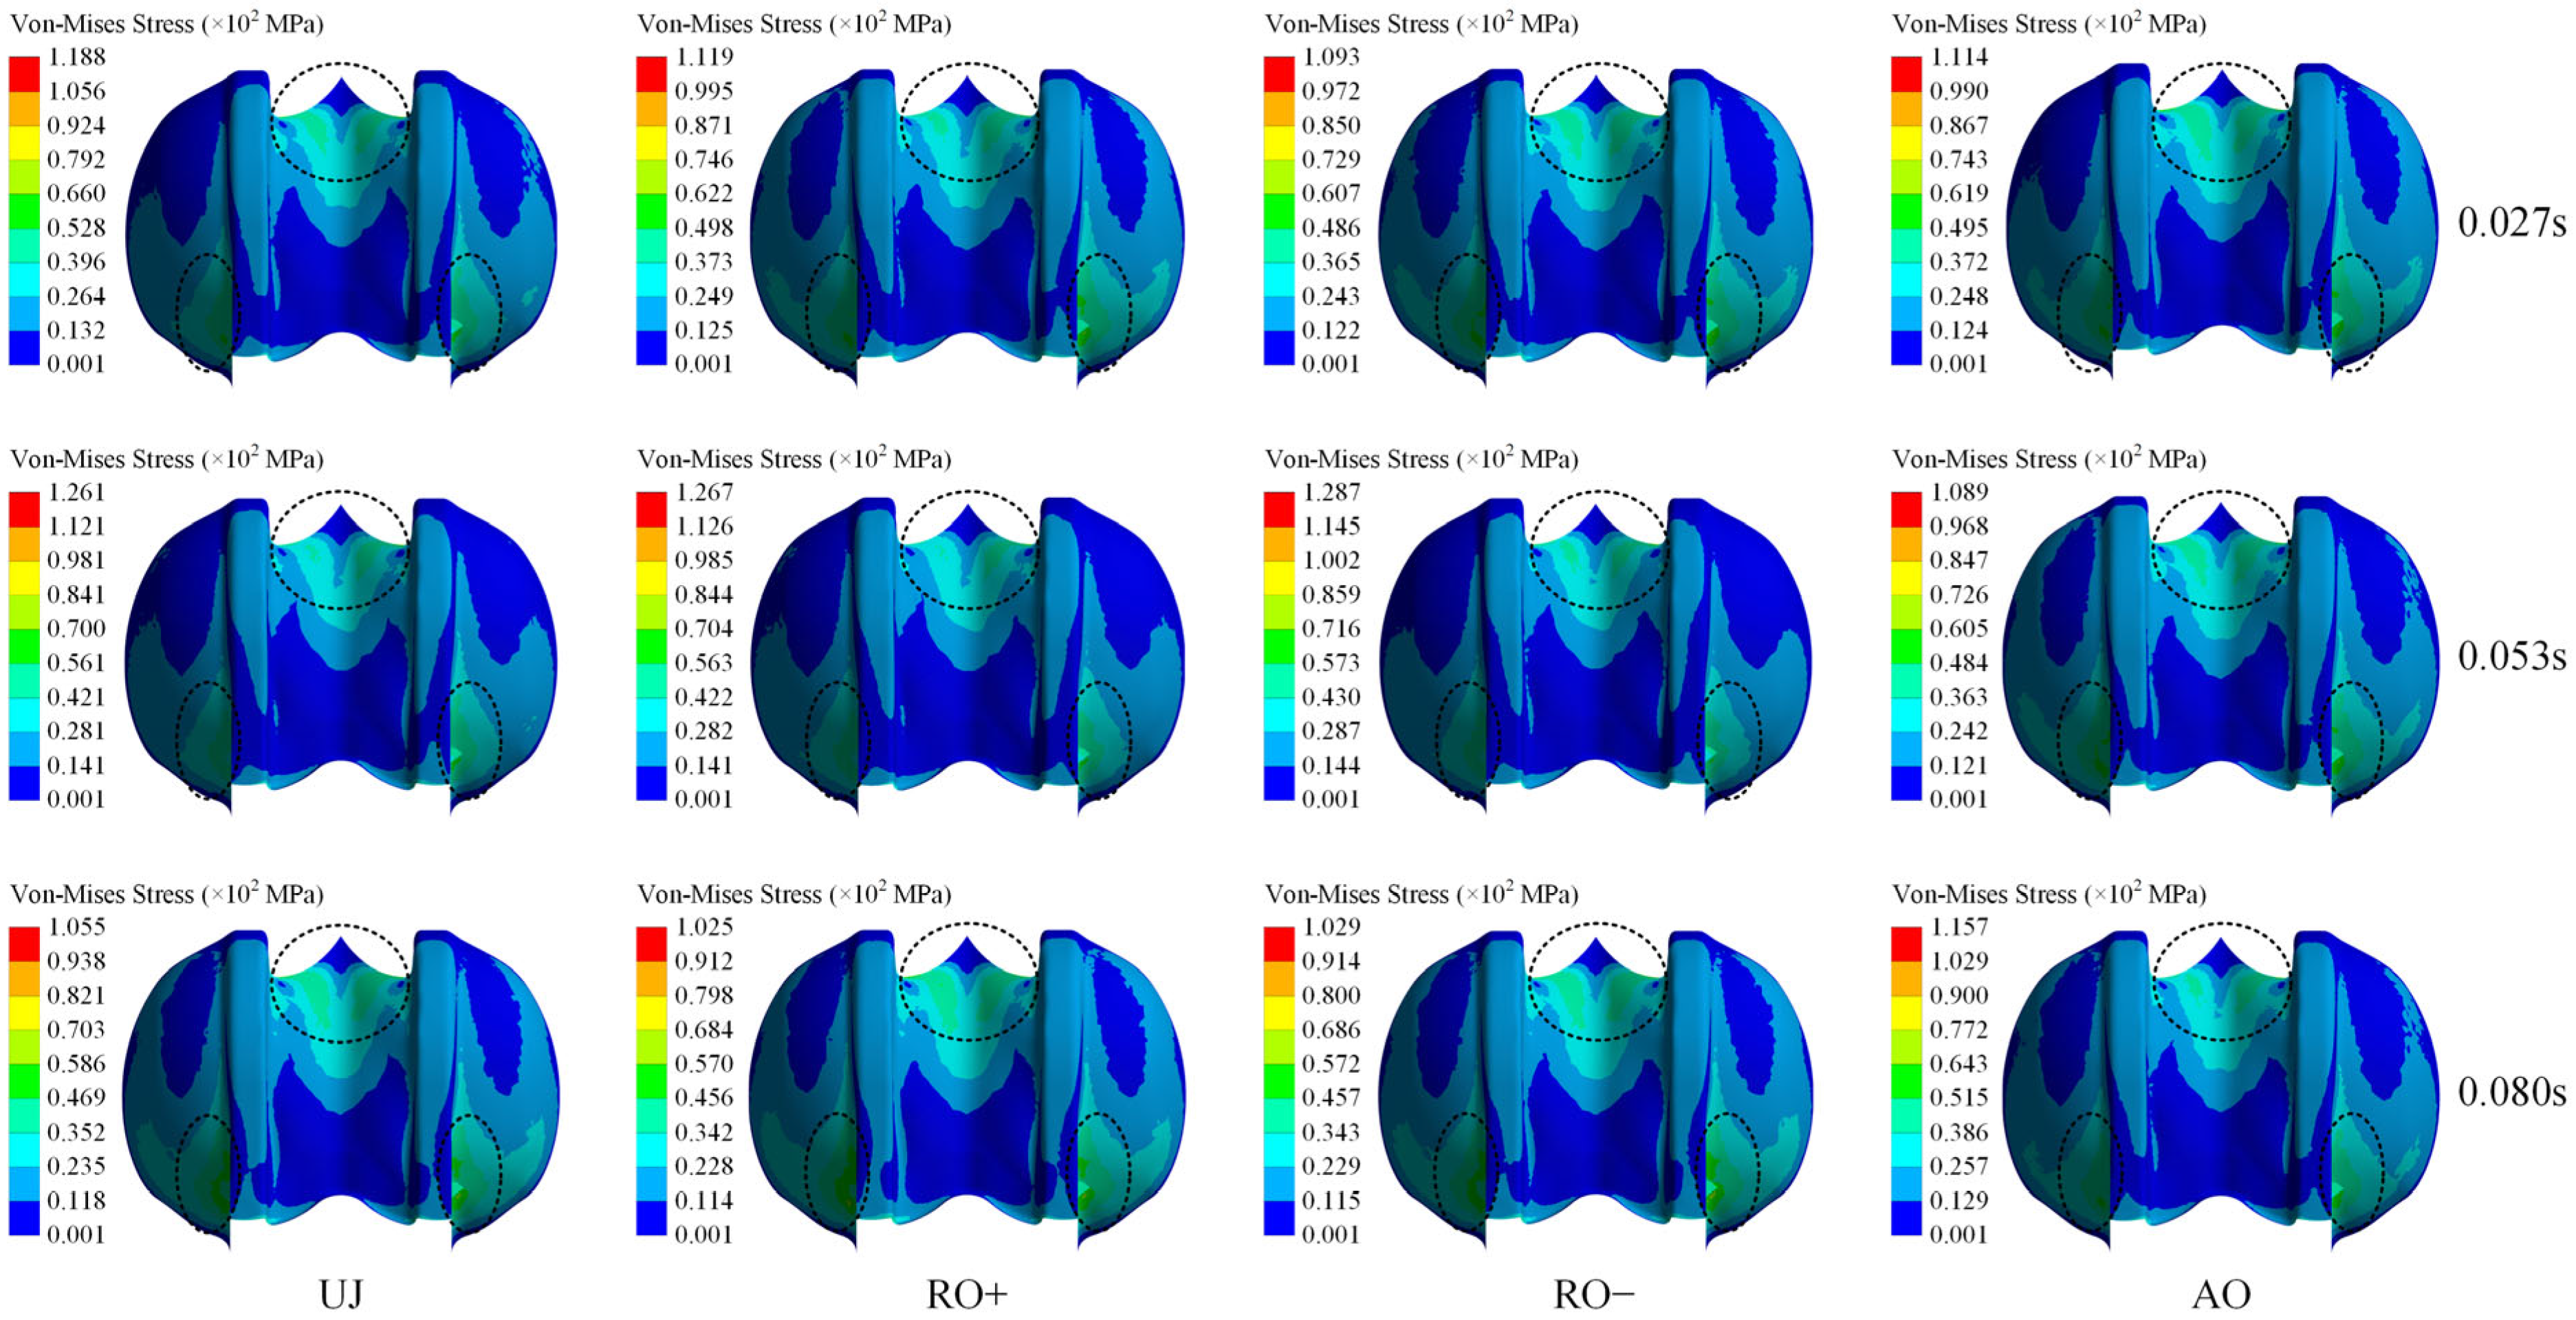
Figure 8 depicts the Von-Mises stress distribution on the suction side of the bucket over one cycle under various operating conditions.
Figure 7 illustrates that the overall Von-Mises stress on the suction side is markedly lower than that on the pressure side under all situations. The stress distribution on the suction side is heterogeneous, displaying a clear gradient, with stress concentrations predominantly located at the tip and root areas. Low-stress regions are predominantly located in the center portion of the suction side at the root, exhibiting a “M”-shaped configuration. Under the UJ, RO+, and RO− circumstances, the stress on the bucket surface initially escalates and subsequently diminishes over time. In the AO condition, the stress maintains a relatively stable distribution.
Table 6 encapsulates the peak Von-Mises stress on the runner surface during one cycle under various operating conditions.
Table 6 indicates that the maximum total Von-Mises stress reaches its peak at 129.7 MPa under the RO+ condition, whereas the minimum value is recorded at 119.4 MPa under the RO− condition. The RO+ condition significantly impacts the overall Von-Mises stress, while the effects of the RO− and AO conditions are comparatively negligible. Moreover, under the UJ, RO+, and RO− conditions, the overall maximum Von-Mises stress exhibits a progressively declining trend over time. Conversely, in the AO situation, the Von-Mises stress first escalates before subsequently diminishing over the cycle.
4.2. Von-Mises Strain Analysis
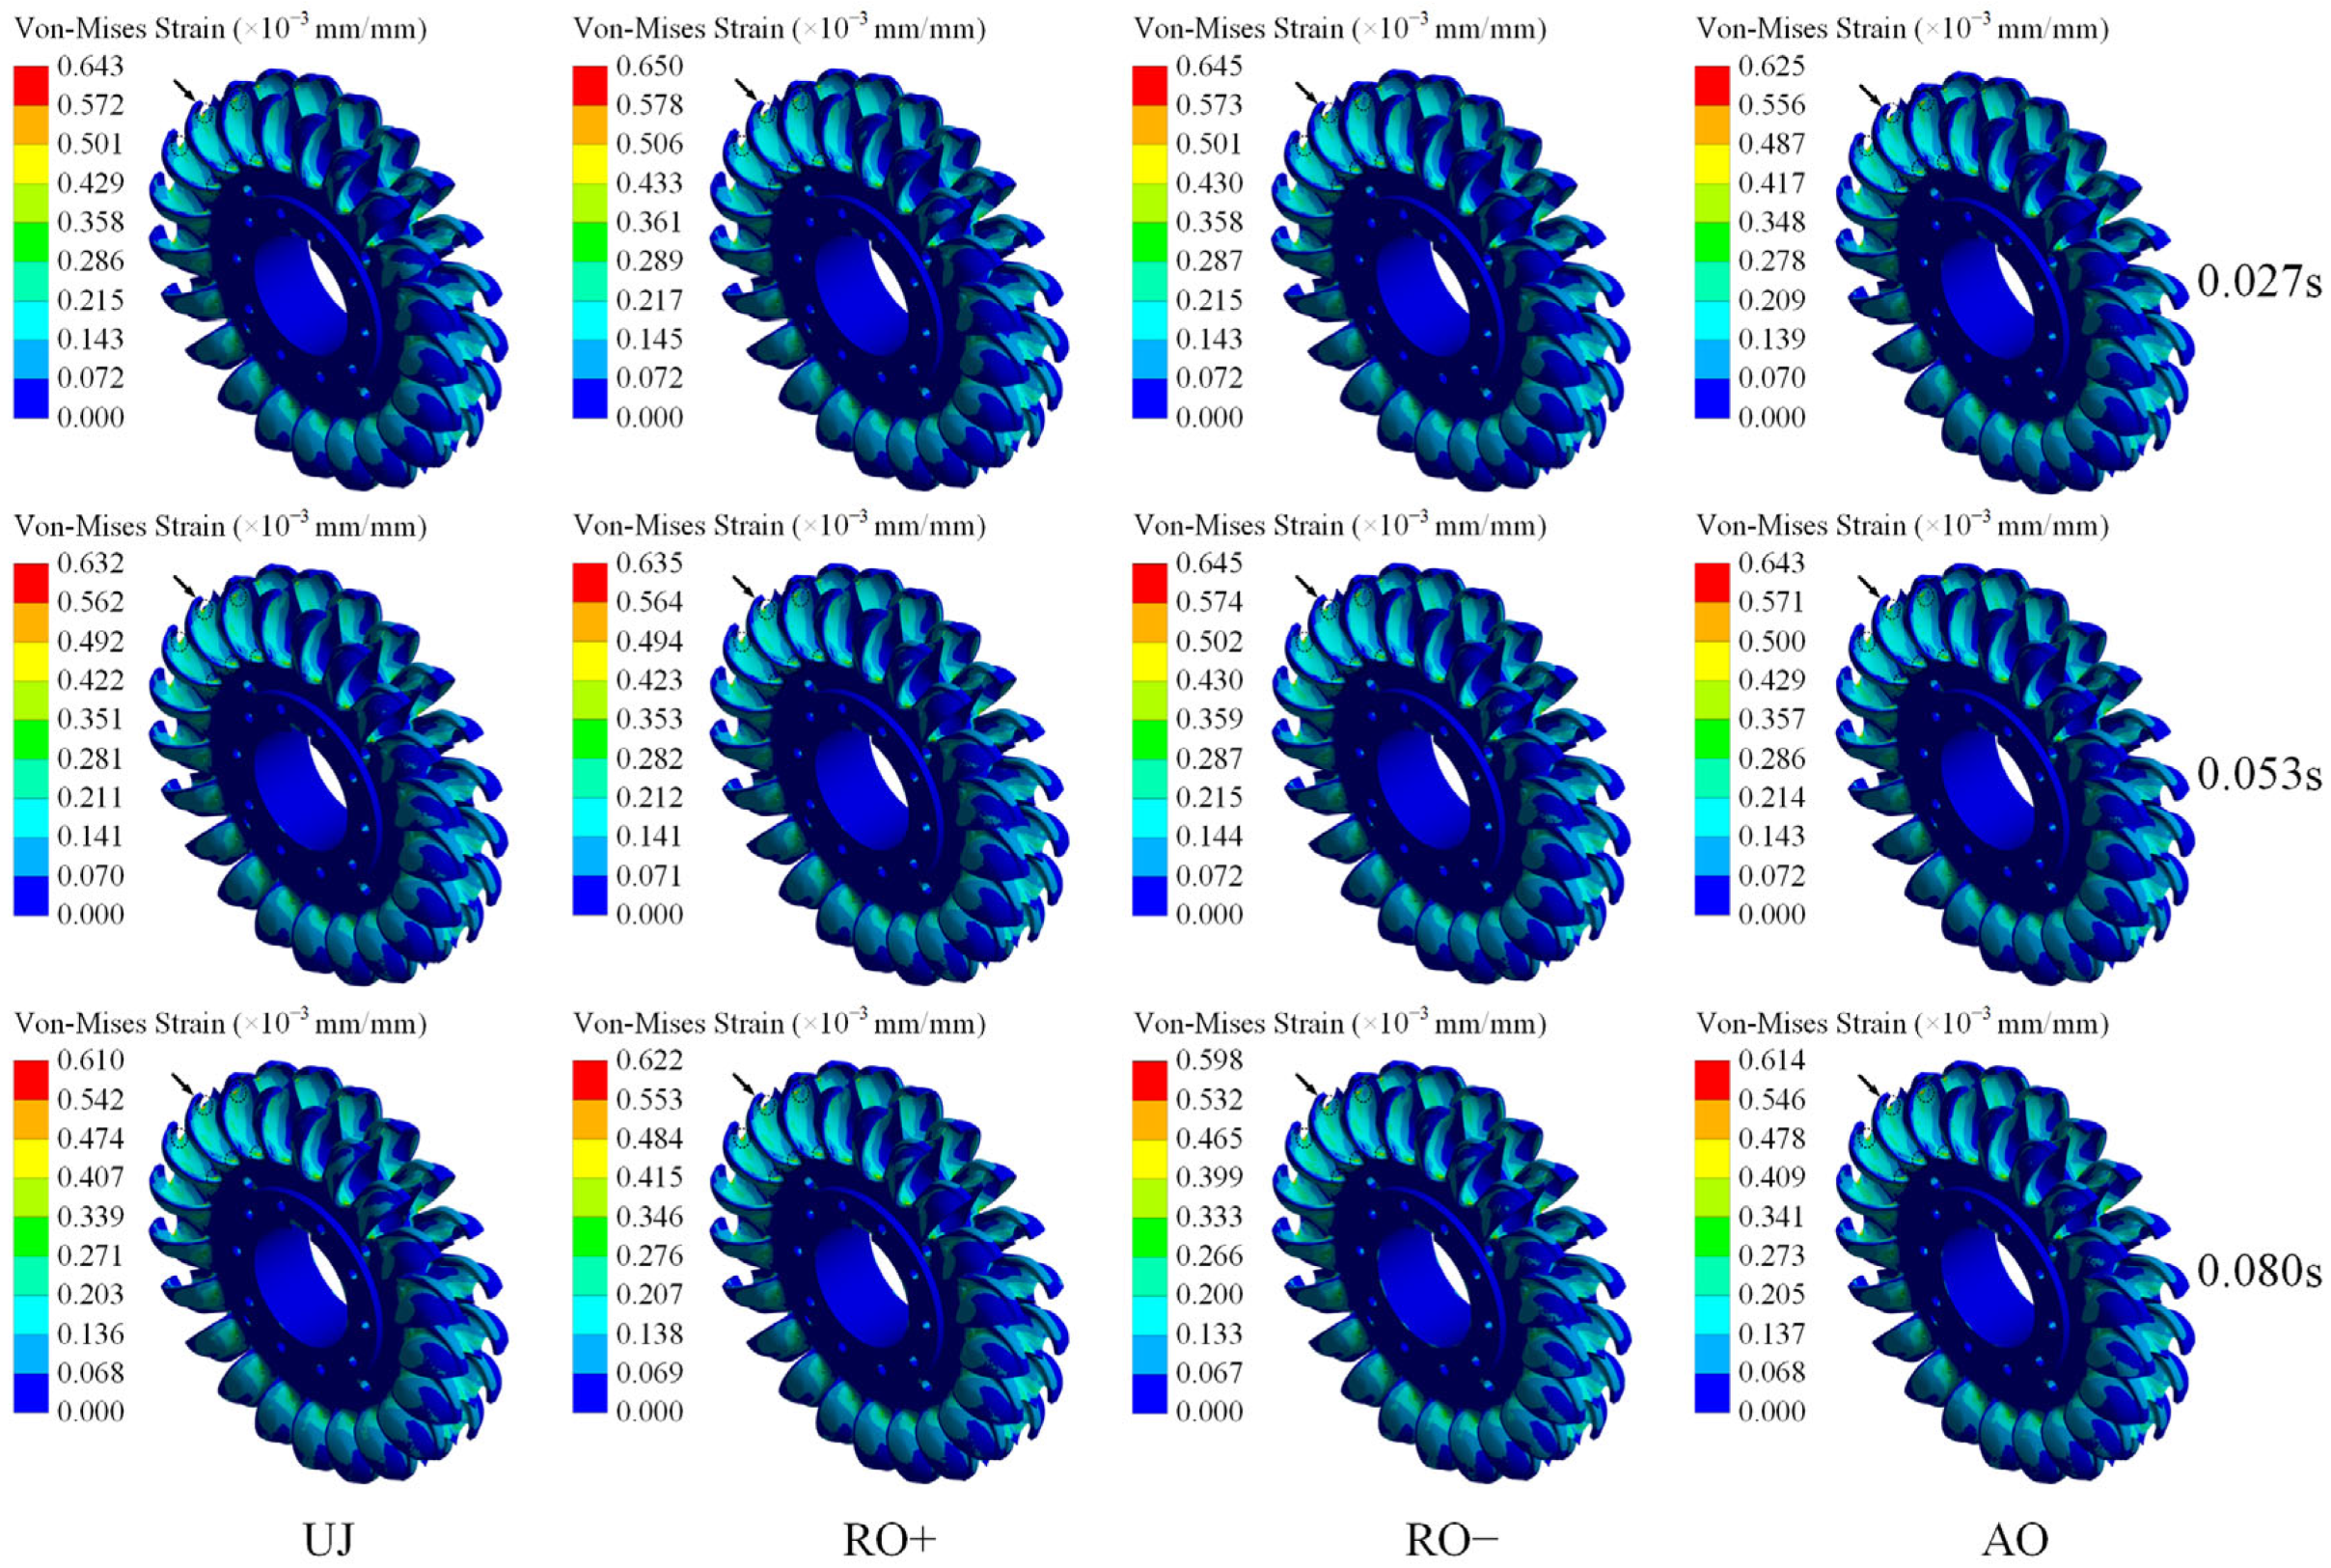
Figure 9 illustrates the distribution of Von-Mises strain on the runner surface throughout one operating cycle under varying working conditions. The Von-Mises strain is a crucial measure for delineating plastic deformation and fatigue damage in materials subjected to complicated stress states.
Figure 8 illustrates that the maximum Von-Mises strain on the runner surface varies between 0.000598 (0.598 × 10
−3 mm/mm) and 0.000650 (0.650 × 10
−3 mm/mm) under different situations. Throughout operation, the distribution of Von-Mises strain aligns closely with that of Von-Mises stress, with elevated strain regions predominantly located at the bucket gap and the junctions between the bucket roots and the hub. These high-strain regions typically align with stress concentration zones and signify probable locations for fatigue fracture formation.
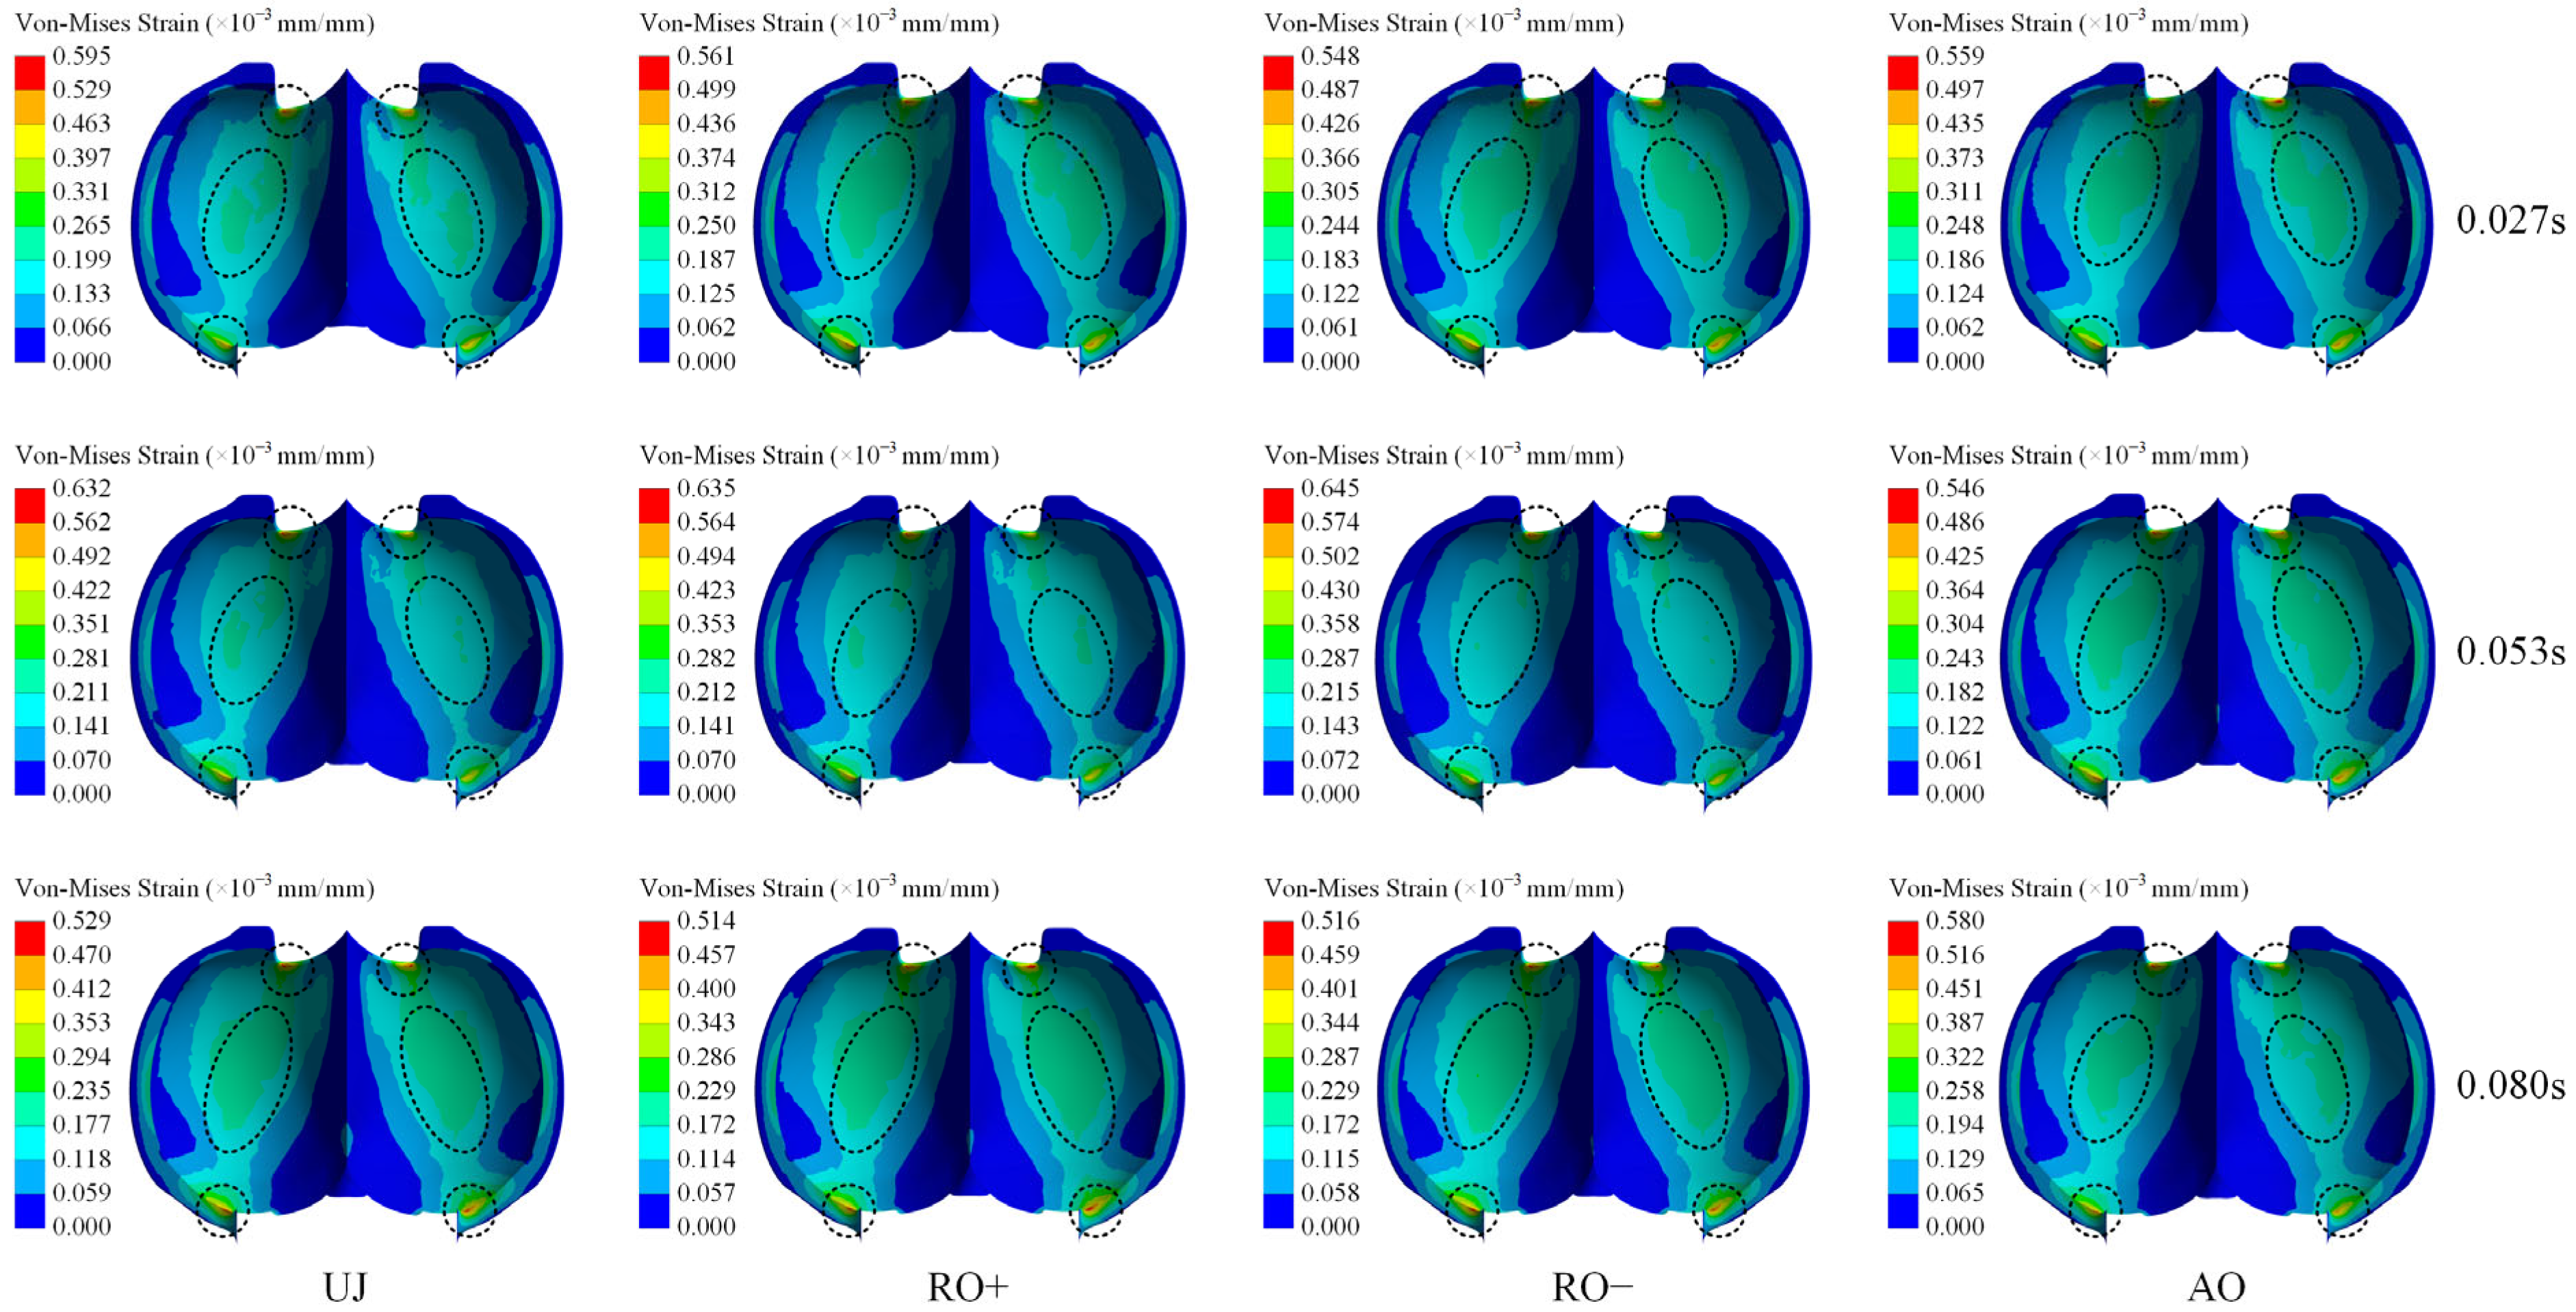
Figure 10 illustrates the Von-Mises strain distribution on the pressure side of the bucket over one cycle under various operating circumstances.
Figure 9 illustrates that the maximum Von-Mises strain on an individual bucket surface varies from 0.000514 (0.514 × 10
−3 mm/mm) to 0.000645 (0.645 × 10
−3 mm/mm) under these conditions. The Von-Mises strain distribution aligns closely with the Von-Mises stress pattern, with peak values observed at the bucket root and notch areas, subsequently followed by the mid-section of the trailing edge. These regions exhibit acute angles and intersections with various curved surfaces, leading to considerable geometric discontinuities that create strain concentration, rendering them vulnerable to the onset of fatigue cracks. Moreover, the entire area from the bucket notch to the root demonstrates a consistently elevated degree of Von-Mises strain. Upon the initiation of a fracture at the notch or root, this region readily promotes crack growth.
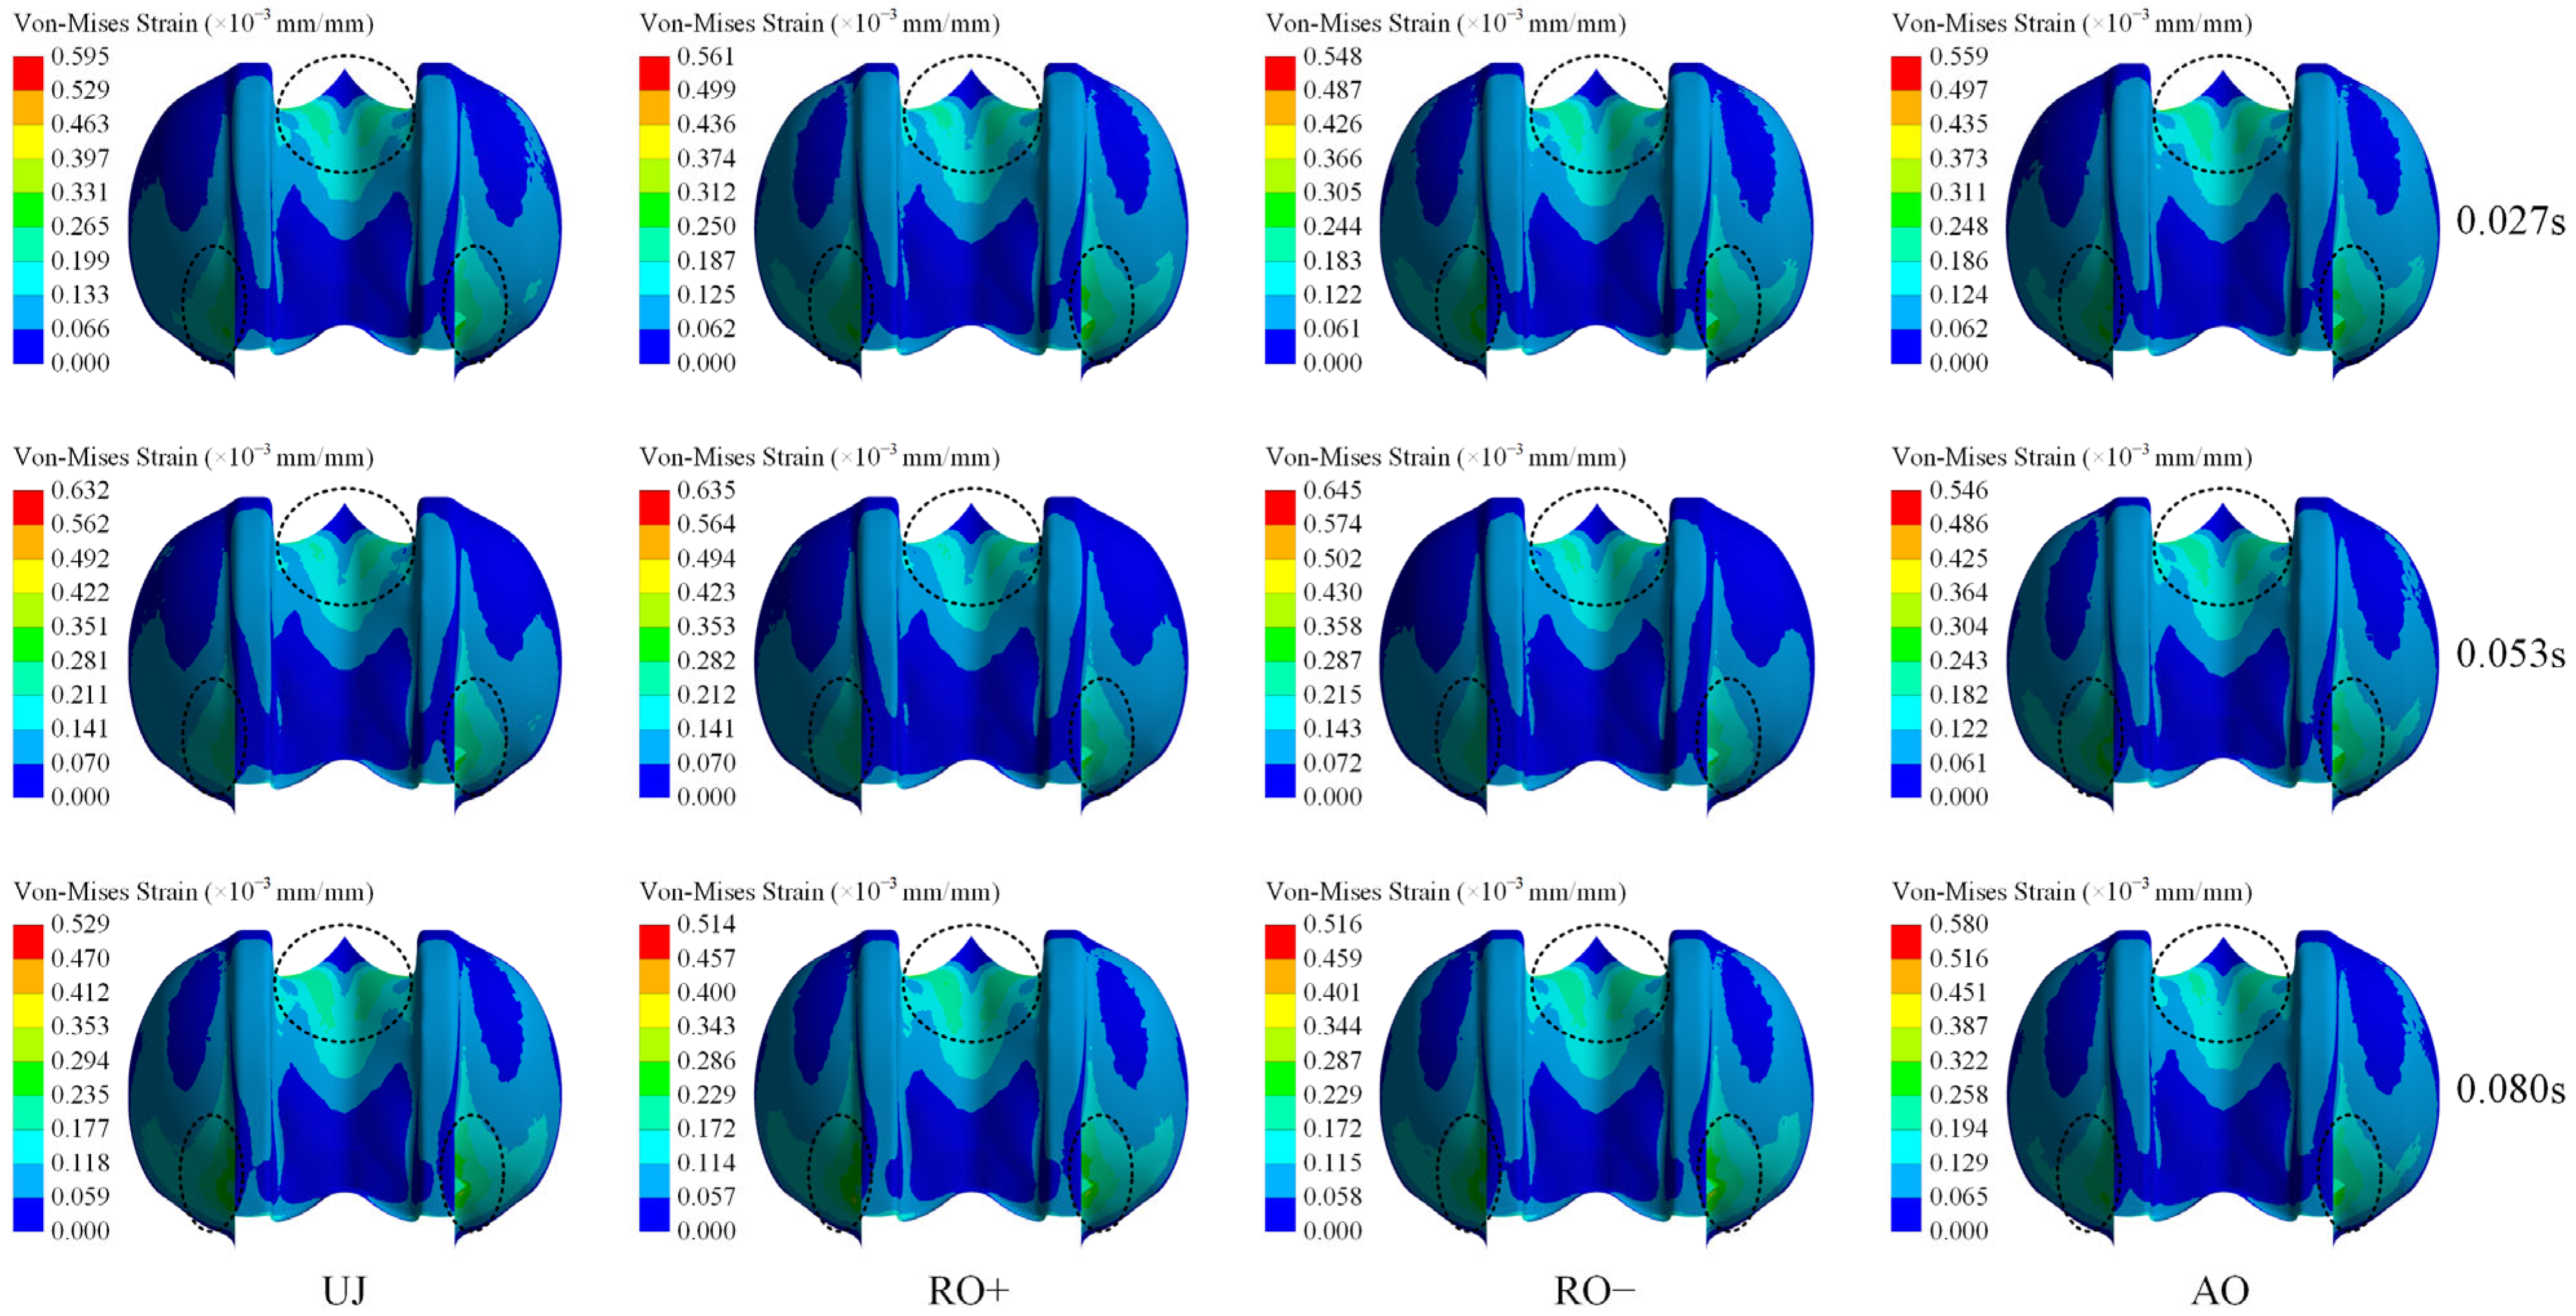
Figure 11 illustrates the Von-Mises strain distribution on the suction side of the bucket throughout one cycle under various operating conditions.
Figure 10 illustrates that the overall Von-Mises strain on the suction side is markedly lower than that on the pressure side under all situations. The Von-Mises strain distribution on the suction side aligns closely with the Von-Mises stress characteristics, exhibiting high-strain regions concentrated near the tip and root areas, while low-strain areas are predominantly situated in the central “M”-shaped region near the hub. Analogous to the Von-Mises stress pattern, under the UJ, RO+, and RO− circumstances, the strain on the bucket surface initially escalates before subsequently diminishing over time. Conversely, under the AO condition, the strain demonstrates relatively minor variations and sustains a more consistent distribution throughout time.
Table 7 delineates the maximum Von-Mises strain on the runner surface throughout one cycle under various operating conditions.
Table 7 illustrates that the maximal Von-Mises strain attains a peak value of 0.000650 (0.650 × 10
−3 mm/mm) under the RO+ condition, whilst the minimum value of 0.000598 (0.598 × 10
−3 mm/mm) is seen under the RO− condition. The findings demonstrate that the RO+ condition exerts the most substantial impact on the Von-Mises strain, while the influences of the RO− and AO conditions are comparatively negligible. Moreover, under the UJ, RO+, and RO− conditions, the overall maximum Von-Mises strain demonstrates a progressively declining tendency over time. Conversely, in the AO condition, the Von-Mises strain first escalates before subsequently diminishing over the cycle.
4.3. Total Deformation Analysis
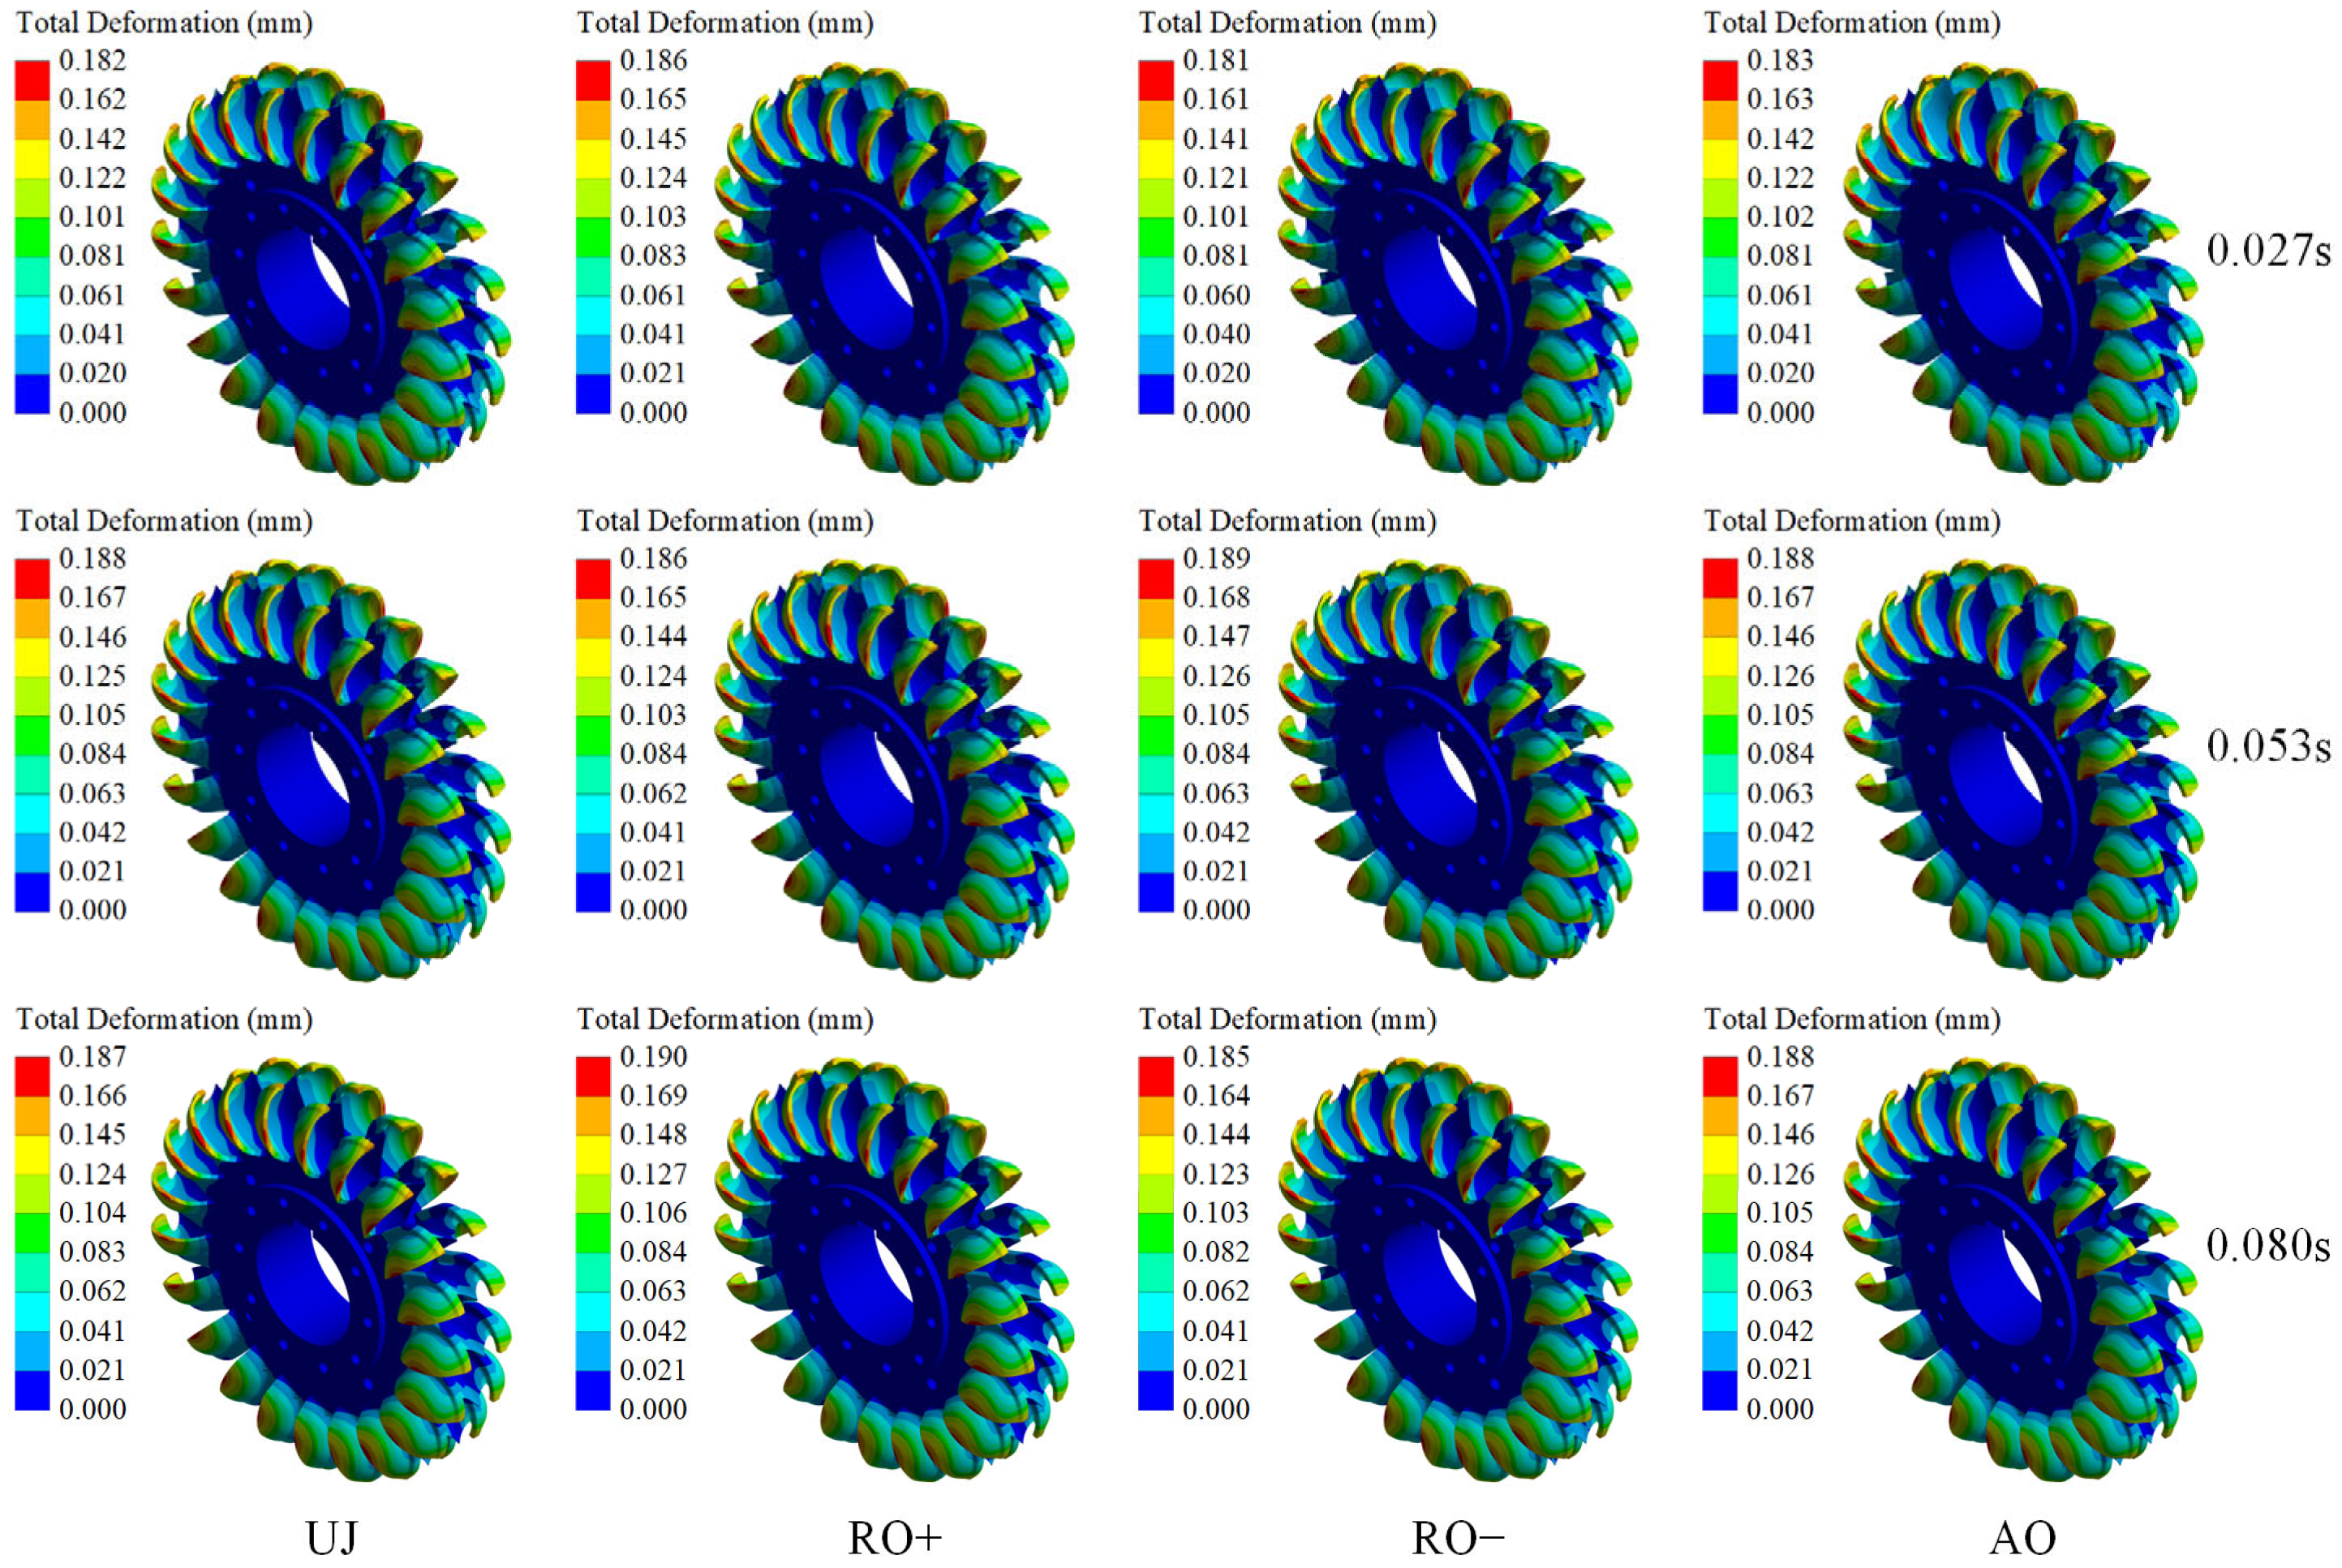
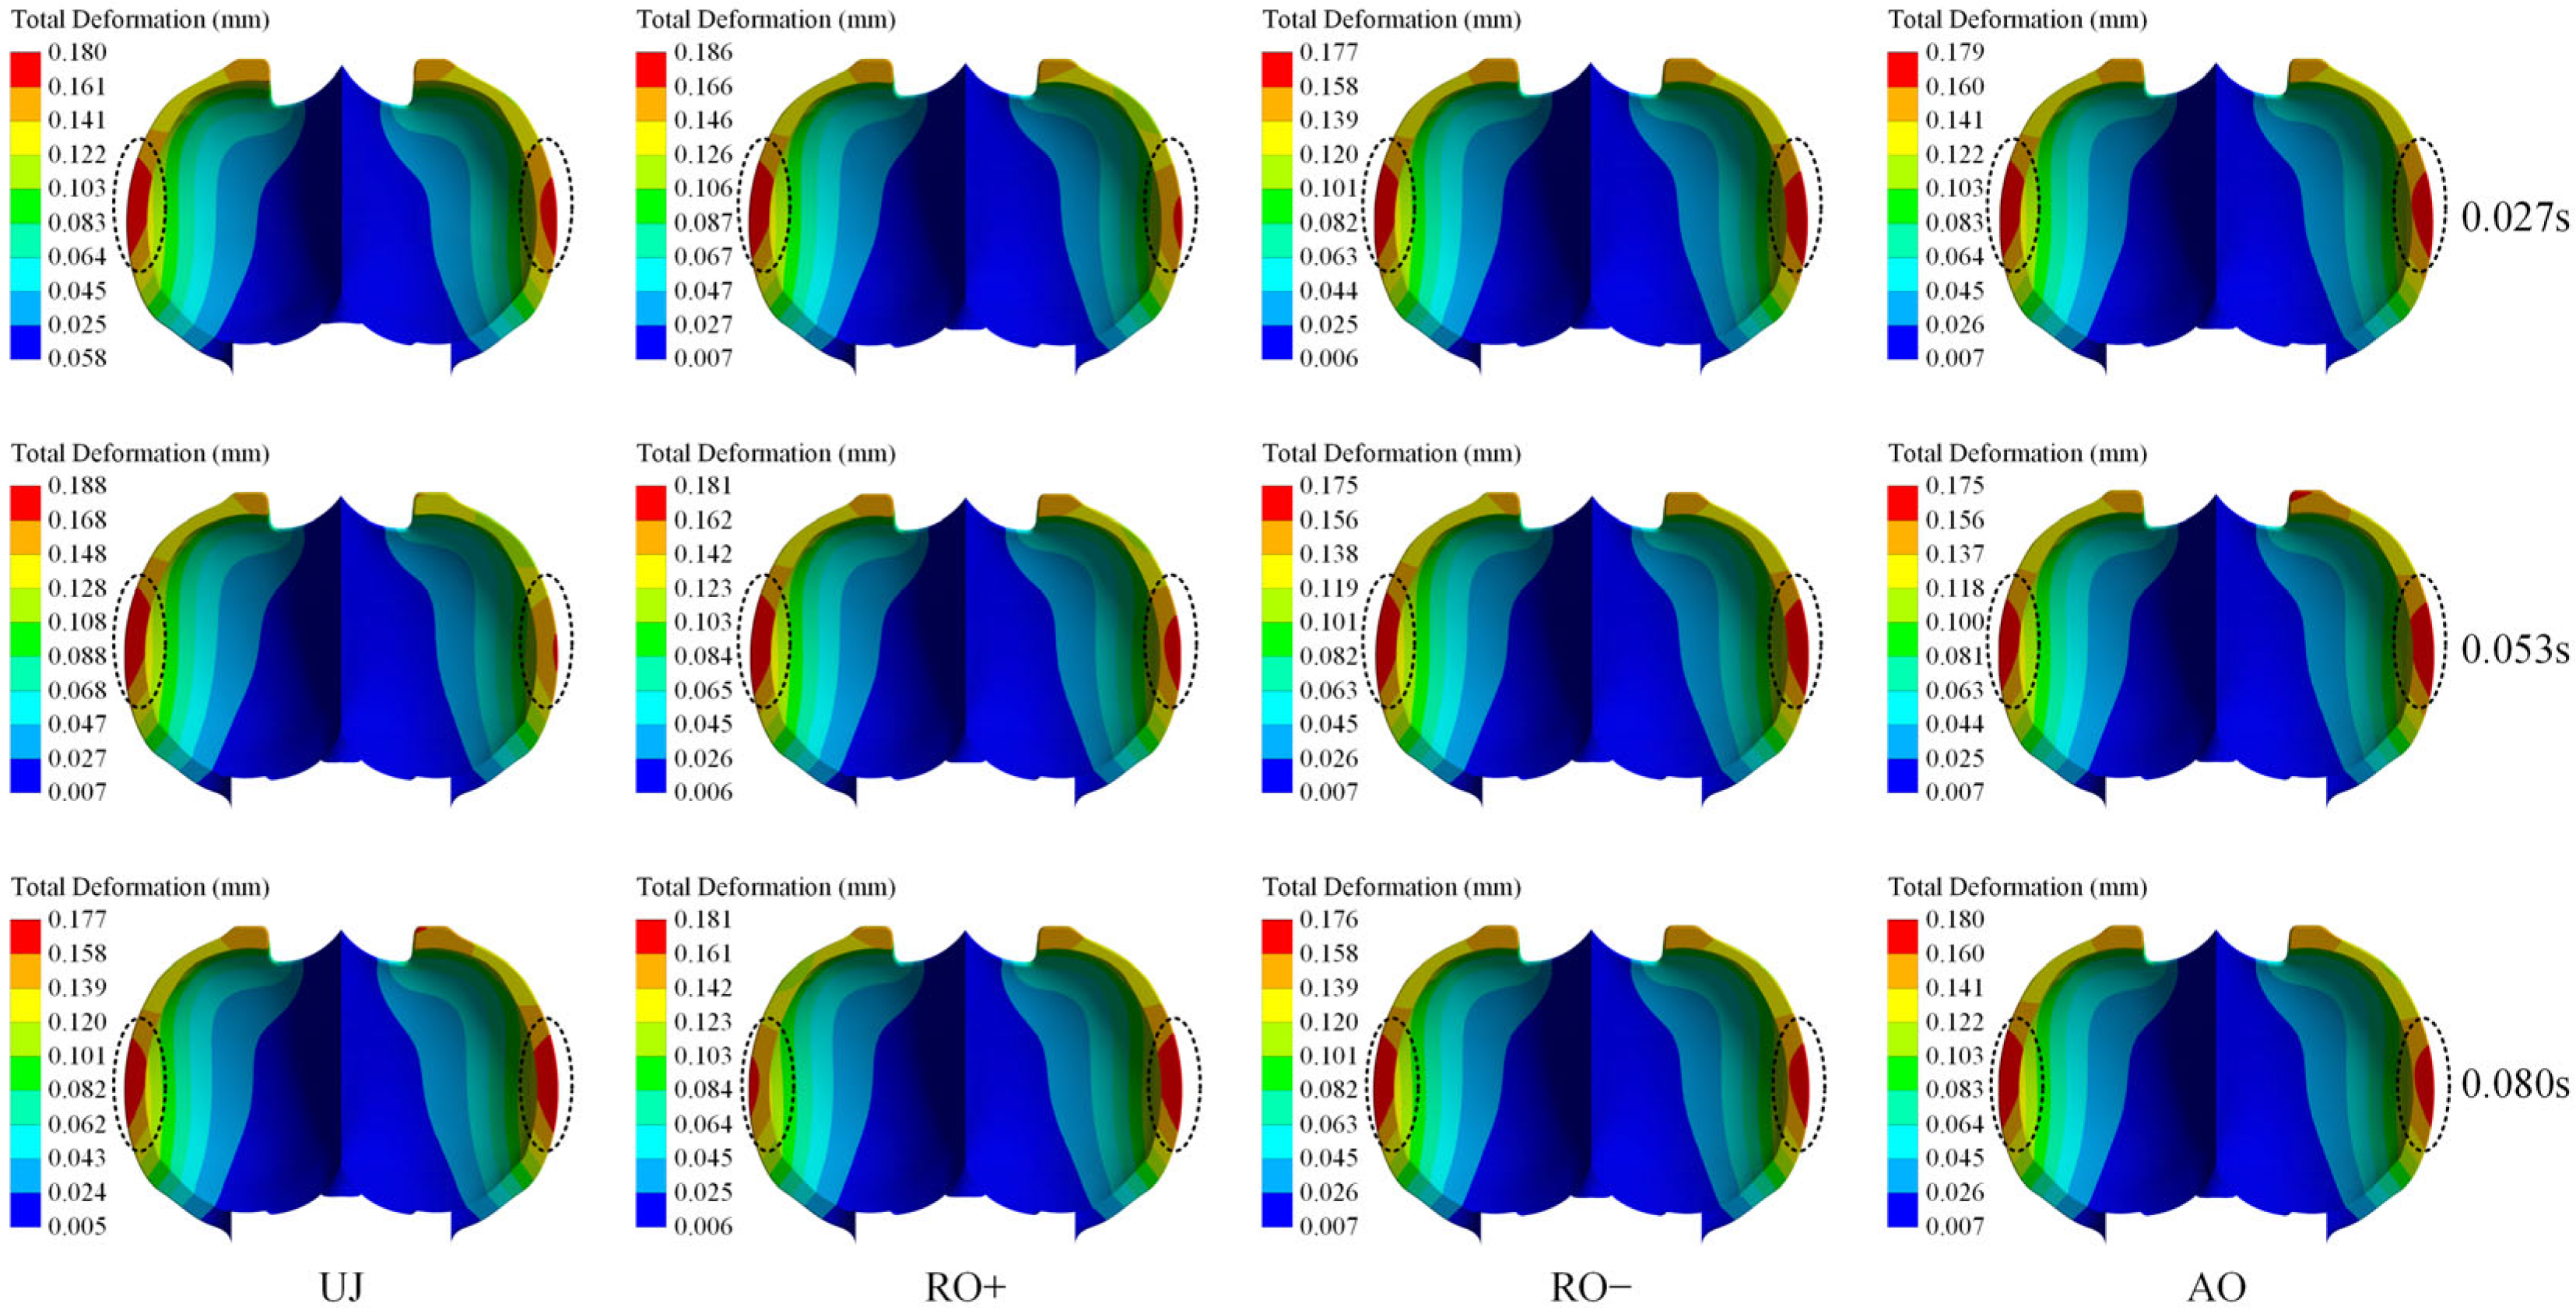
Figure 12 illustrates the comprehensive deformation pattern on the runner surface across a whole operational cycle under varying working conditions.
Figure 11 illustrates that the jet impact pattern is a critical determinant of the maximum deformation magnitude of the runner. The maximum surface deformation varies from 0.181 mm to 0.190 mm across different situations, exhibiting a rather narrow overall range. The deformation is predominantly localized in the trailing edge region, principally due to the synergistic effects of alternating loads, stress concentration, and fluid-induced vibrations encountered during operation.
Figure 13 depicts the comprehensive deformation distribution on the pressure side of the bucket across various operating conditions throughout one cycle.
Figure 12 illustrates that the jet impact pattern affects the extent of total deformation on the bucket surface. Although the overall deformation distribution remains consistent across different conditions, the maximum deformation ranges from 0.175 mm to 0.188 mm, indicating relatively minor variation in overall amplitude. The distortion on the pressure side progressively intensifies from the splitter to the trailing edge, attaining its maximum at the mid-section of the trailing edge. This phenomenon primarily arises from the combined effects of elastic deformation due to jet impact and deformation resulting from rotational centrifugal forces, rendering this location a typical initiation points for fatigue cracks. Additionally, during operation, the deformation distribution on the bucket surface demonstrates a periodic dynamic response under alternating loads, characterized by time-dependent fluctuations in deformation magnitude on both the left and right sides of the bucket.
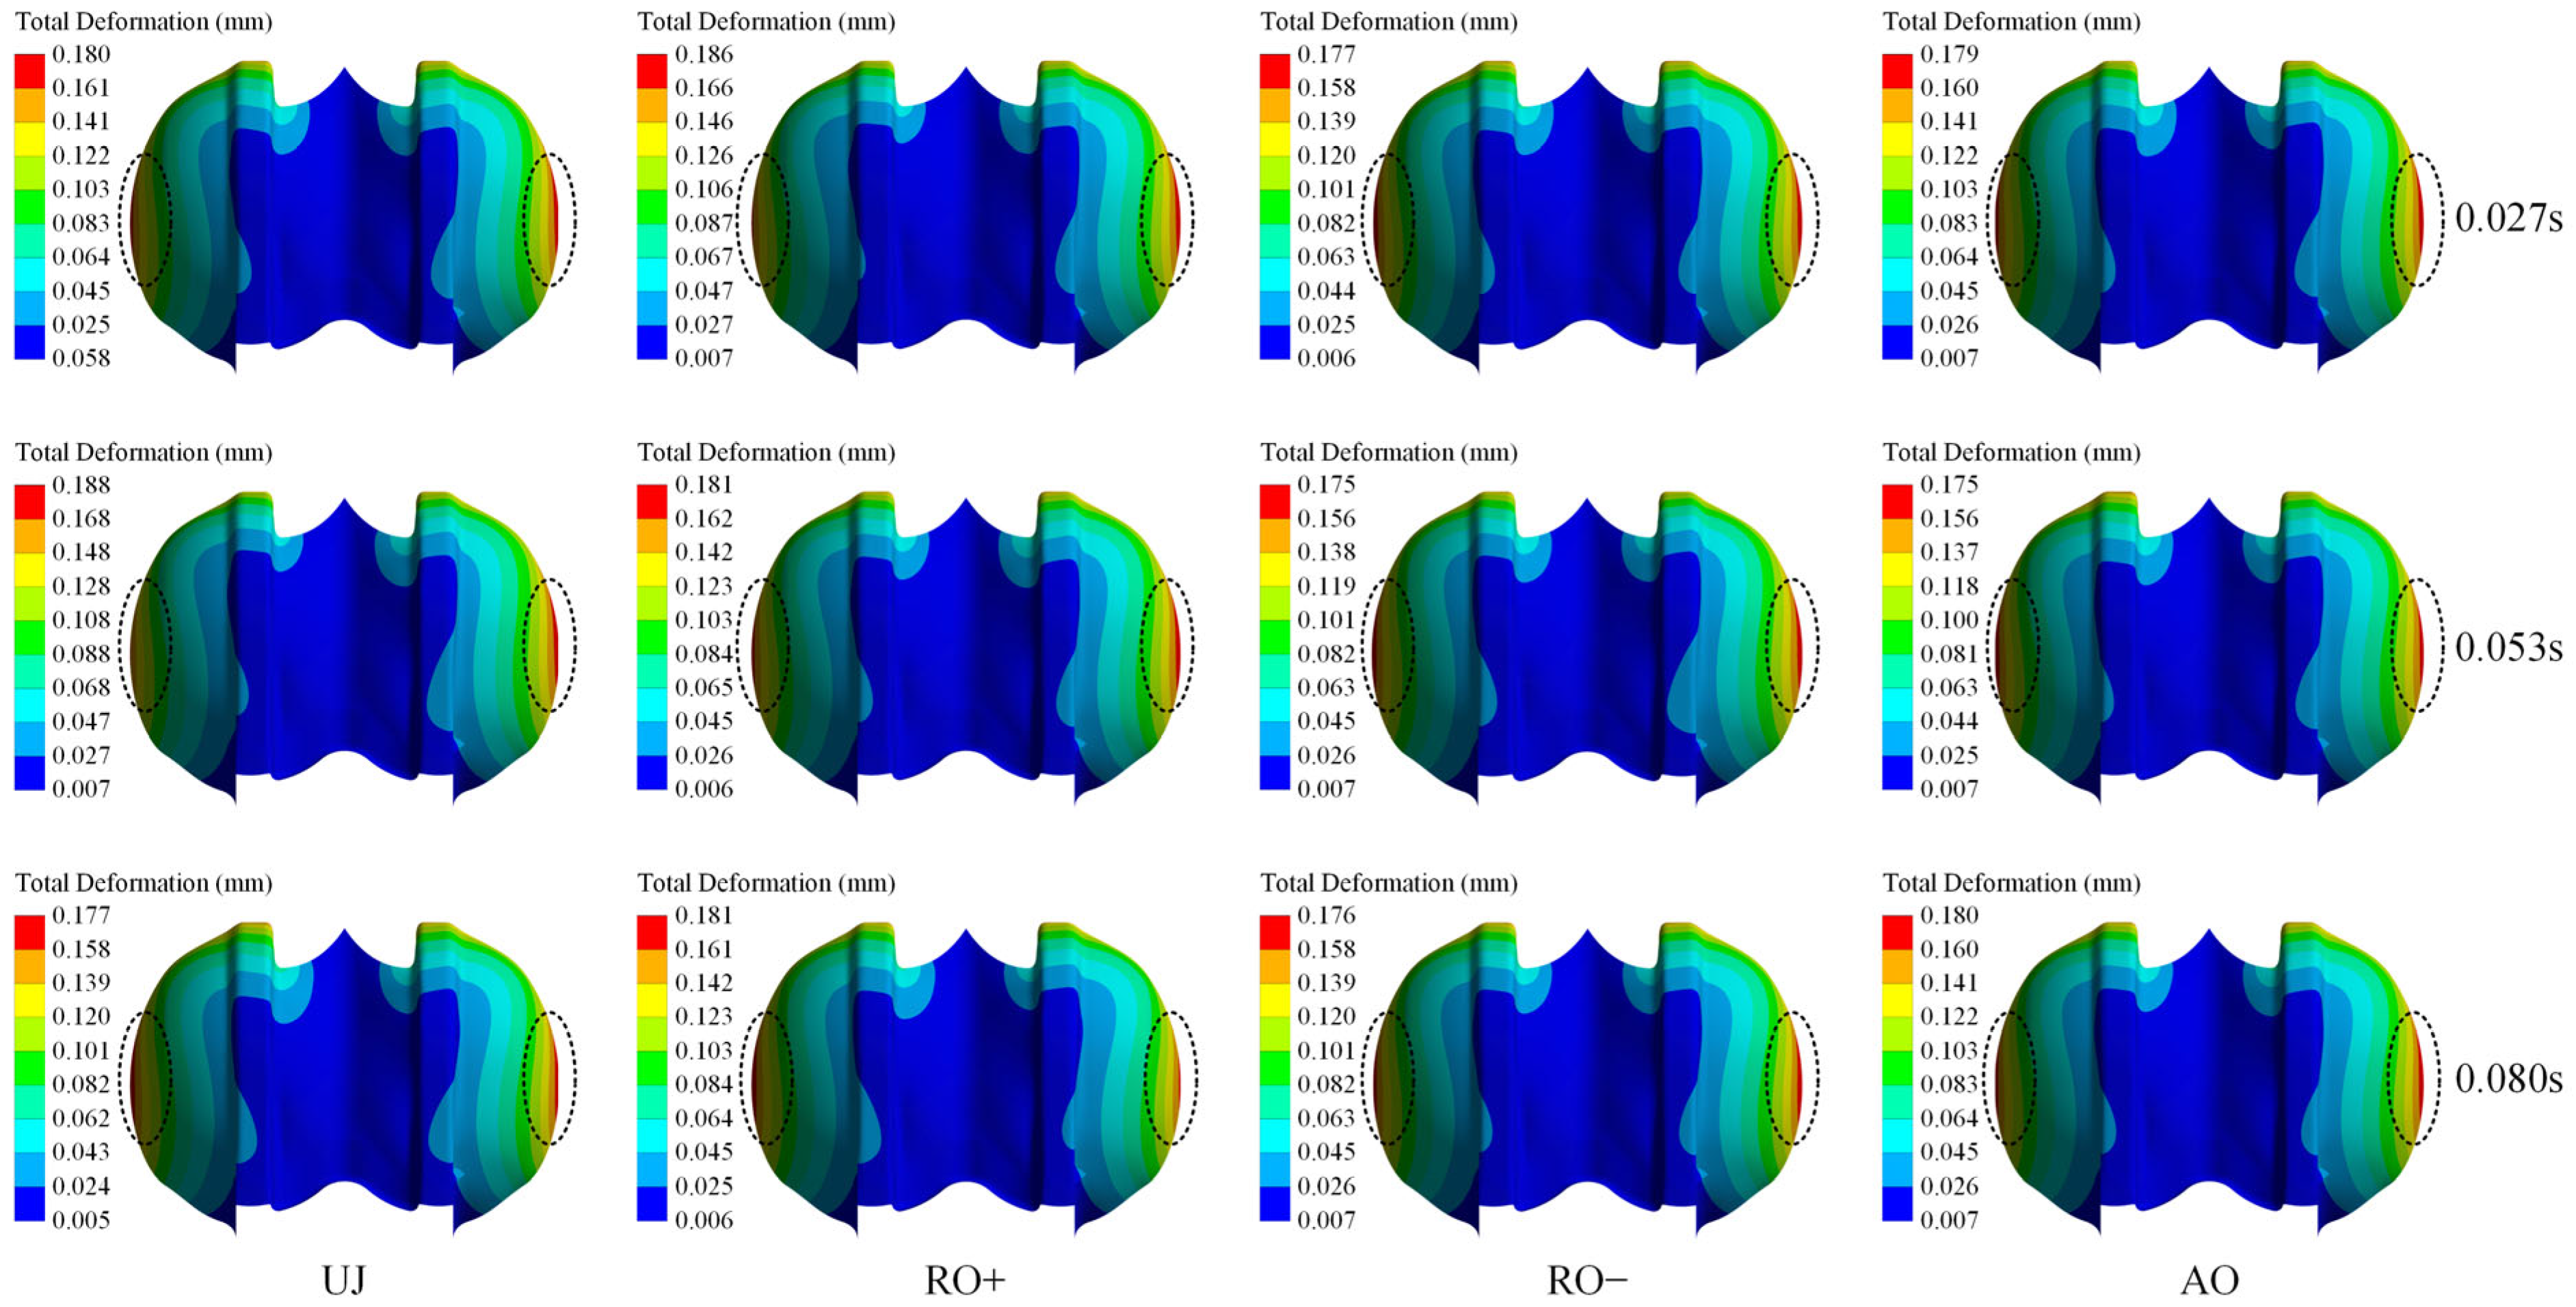
Figure 14 illustrates the comprehensive deformation distribution on the suction side of the bucket throughout one operating cycle under varying working conditions.
Figure 13 illustrates that the overall deformation distribution pattern is largely uniform across different situations, with the deformation magnitude on the suction side constantly smaller than that on the pressure side. The deformation on the suction side exhibits a distribution pattern akin to that observed on the pressure side, progressively intensifying from the central region to the trailing edge, peaking at the mid-section of the trailing edge. Additionally, low-deformation zones are predominantly located in the central area of the bucket, displaying an irregular pentagonal configuration. Under the UJ condition, the total deformation on the bucket surface exhibits an early increase followed by a decline over time, but under the RO+, RO−, and AO conditions, the deformation displays comparatively minor temporal fluctuations and sustains a more stable distribution.
Table 8 displays the maximum overall deformation of the runner surface throughout a single operational cycle under various working conditions.
Table 8 indicates that the highest total deformation peaks at 0.1901 mm under the RO+ condition, whereas the minimum value is 0.1811 mm under the RO− condition. The findings demonstrate that the RO+ condition exerts the most substantial impact on overall deformation, whereas the influences of the RO− and AO conditions are comparatively negligible. Moreover, under the UJ and RO− conditions, the maximum total deformation initially ascends and thereafter descends with time, whereas under the RO+ and AO conditions, it exhibits a consistently increasing trend.
4.4. Differences Among the Offset Conditions
A comparative analysis of the four operating conditions reveals distinct mechanical loading patterns on the runner. The key differences are primarily driven by the alteration of the jet impact location relative to the bucket’s structurally critical zones and the direction of the centrifugal force field:
Radial Offset+ (RO+): This condition proved to be the most severe. The outward displacement of the jet directs the high-impact force towards the bucket notch and the outer sections of the root. These regions inherently have lower bending stiffness and are more susceptible to stress concentration. Furthermore, the centrifugal force acting on the bucket material increases with the radius, meaning the RO+ condition applies its highest load in a region already experiencing higher centrifugal tensile stress, creating a synergistic effect that exacerbates the total stress.
Radial Offset− (RO−): In contrast to RO+, the inward jet displacement (RO−) often results in lower maximum stress compared to both UJ and RO+ conditions (e.g., 119.4 MPa vs. 129.7 MPa at t = 0.080 s). This is because the jet impacts closer to the hub, where the structural support is stronger and the local bending moment induced by the jet is reduced. Additionally, the centrifugal stress component at this smaller radius is lower.
Axial Offset (AO): The axial shift in the jet creates a less asymmetric load in the radial plane compared to the RO conditions. The stress distribution becomes more uniform across the width of the bucket, but the imbalance along the axis leads to elevated stress on one side of the bucket root and trailing edge. However, the temporal variation in stress in the AO condition is the most stable, as indicated by the narrow range (124.8 MPa to 128.2 MPa, a variation of 2.7%) in
Table 6. This suggests a consistent, though off-center, loading pattern throughout the interaction cycle.
Undeflected Jet (UJ): The UJ condition serves as the baseline, producing a symmetrical and predictable stress pattern. However, even under this ideal condition, significant stress concentrations exist at the root and notch due to geometric discontinuities. The stress under UJ shows a clear decreasing trend as the bucket moves away from the jet (from 128.3 MPa to 121.7 MPa).
4.5. Comparison with the Literature and Discussion
To validate the reliability of our numerical model and contextualize our findings, a comparison with relevant published studies is presented. The maximum Von-Mises stress observed in our study under the RO+ condition (129.7 MPa) is consistent in order of magnitude with FSI results reported for other turbine types under off-design conditions. For instance, Huang X et al. [
13] reported peak stresses in a Francis turbine runner significantly below the material’s yield threshold, which aligns with our observations where the maximum stress is well within the yield strength of ZG06Cr13Ni4Mo. However, the critical finding of our work is the significant stress concentration at the bucket notch and root under offset conditions, which is a specific vulnerability for Pelton runners not extensively discussed in prior FSI literature.
The identified risk of high-cycle fatigue under RO+ condition corroborates the findings of Deng H et al. [
1], who reported increased axial forces and pressure fluctuations due to jet eccentricity. Our study quantitatively extends this by demonstrating how these hydraulic excitations translate into mechanical stress concentrations.
The deformation magnitudes (0.18–0.19 mm) are plausible for a runner of this size under hydrodynamic loading. The fact that the RO+ condition consistently resulted in the highest stress, strain, and deformation underscores the critical nature of radial jet offset towards the bucket outer edge.
5. Conclusions
This study systematically examines the impact of offset conditions on the mechanical properties of a Pelton turbine runner through fluid–structure interaction numerical simulations, elucidating the stress, strain, and deformation response patterns of the runner under varying offset conditions. The primary conclusions are as follows:
(1) Operation under offset conditions modifies the stress distribution on the runner surface. The peak Von-Mises stress is localized in regions with geometric discontinuities, including the jet impact zone, bucket roots, and trailing edges, exhibiting stress levels between 119.4 MPa and 129.7 MPa. The RO+ condition demonstrates the highest peak stress of 129.7 MPa, signifying its most detrimental impact on the structural integrity of the runner.
(2) The Von-Mises strain distribution of the runner exhibits a significant correlation with the stress distribution, with areas of strain concentration similarly positioned between the bucket roots and trailing edges. Although the maximum Von-Mises stress (129.7 MPa) is below the yield strength of ZG06Cr13Ni4Mo (typically > 550 MPa), the stress concentration at the bucket notch and root under RO+ condition significantly increases the risk of high-cycle fatigue, which is a typical failure mode under cyclic loading even in the elastic regime. The highest Von-Mises strain in the RO+ condition is 0.000650 (0.650 × 10⁻³ mm/mm), indicating that the runner is more susceptible to plastic deformation and fatigue damage in this scenario.
(3) Offset conditions affect the deformation characteristics of the runner. The greatest deformation varies from 0.181 mm to 0.190 mm, predominantly located in the trailing edge area. The RO+ condition produces the most deformation, and its dynamic response characteristics suggest that this region is more prone to fatigue fracture development due to the interplay of alternating loads and fluid-induced vibrations.
(4) The findings have direct practical implications. They underscore the necessity of strict tolerances and precise alignment during installation, particularly to avoid radial offsets toward the bucket’s outer edge (RO+). Furthermore, inspection and maintenance protocols can be optimized by focusing on the identified high-stress regions. The quantitative data provided can serve as the input for high-cycle fatigue analysis to predict the runner’s service life under such off-design conditions.
(5) This study, based on one-way FSI and linear-elastic material modeling, lays a solid foundation. Future research should focus on: (a) Fatigue life prediction using the obtained stress data to estimate the number of cycles to failure. (b) Investigating the effects of two-way FSI for cases with larger deformations. (c) Experimental validation using strain gauges on a prototype or model turbine to corroborate the numerical findings. (d) Extending the analysis to include sediment erosion effects coupled with mechanical fatigue.
