Abstract
The decline in the injectivity of injection wells is a serious problem in geothermal systems. In this article, we analyse the mechanisms responsible for the reduction in permeability in Lower Jurassic sandstones during the injection of cooled formation brine. Flow experiments were conducted on rock cores using three types of brines with varying degrees of contamination. The studies included microscopic analysis, scanning electron microscopy (SEM) and mercury intrusion capillary pressure (MICP) before and after the experiments. The results showed that the main factor in the decrease in permeability is the formation of a filter cake from secondary iron minerals on the front surface of the core. Filter cake formation was observed in all samples, with ferrous sediment penetrating to a maximum depth of 1.5 cm from the core front. In addition, the mobilisation of clay particles was observed, which accumulate in pore constrictions, causing additional flow restriction. Mercury porosimetry revealed significant increases in hysteresis values in the front zone (from 16.5 to 42%), indicating complex pore connectivity changes without substantial porosity reduction. The rate of injectivity decline correlates strongly with the fluid flow velocity. The results of the study provide a scientific basis for optimising reinjection processes in geothermal systems and developing strategies to prevent formation damage.
1. Introduction
Replacing conventional energy sources, i.e., those derived from the combustion of fossil fuels, is difficult, among other things, due to the instability of energy supplies from environmentally friendly alternatives. It is difficult to predict the amount of energy obtained from the sun or wind, which necessitates the construction of energy storage facilities or the maintenance of some fossil fuel-fired power plants. Geothermal energy guarantees an uninterrupted supply of energy, regardless of the time of day, season or weather conditions. An advantage contributing to the development of geothermal energy is its low impact on the surrounding environment. Although geothermal projects offer promising prospects for renewable energy production, it should be noted that they still involve certain investment and operating costs. It is therefore crucial to effectively address potential problems at the planning stage and during project implementation. Low-enthalpy geothermal systems use brine from aquifers as an energy carrier. In Poland, environmental regulations require mining companies exploiting thermal waters to utilise them [1]. In the case of highly mineralised water, treatment costs are high and it is more cost-effective to inject cooled brine into the rock mass [2]. For this reason, geothermal installations are usually designed as doublets. In addition to meeting environmental requirements, this solution has a beneficial effect on maintaining the water table and pressure in the rock mass [3].
Despite its significant benefits, brine reinjection also carries risks. The reduction in pressure and temperature during operation and heat extraction leads to changes in the composition and physicochemical parameters of the brine [4]. This is due to the precipitation of dissolved substances and the release of dissolved gas. The conditions in the rock mass also change. The most significant changes include temperature, pressure and flow rate. The effects of these changes are particularly noticeable in the near-wellbore zone of the injection well. Injection of brine containing solid particles leads to pore space clogging, which is the most common cause of loss of absorbency [5]. In addition to compounds precipitated from water, rock debris and fragments of corroded installations are also deposited in the borehole zone [6]. Flow restriction can also occur as a result of particle mobilisation. Particles that are weakly attached to the pore walls can break away and move with the flowing fluid. The flow rate at which this phenomenon occurs is referred to as the critical velocity [7]. The higher the flow rate, the more visible the effect, which is why the area in the immediate vicinity of the injection well is the most vulnerable due to the high flow rate over a relatively small area. In addition to the flow rate, the critical velocity also depends on the pH and mineralisation of the brine. Clay minerals are most susceptible to particle mobilisation, with particular emphasis on kaolinite [8].
Often, over time, the ability to inject cooled brines into the rock mass decreases. This is referred to as a decline in well absorbency. Absorbency is a parameter that characterises injection wells in terms of their injection capacity. It is defined as the ratio of flow rate to increase in pressure in the reservoir [9]. Absorbency depends primarily on the permeability of the rocks and the thickness of the absorbent layer [10]. The flow rate at which water is extracted must be compensated by the same amount of water being injected. The possibility of injecting cooled water into the rock mass therefore defines the exploitation rate, and thus the efficiency of the entire geothermal system. A decrease in absorbency makes it impossible to operate at the assumed efficiency, and the parameters of the elements comprising the system infrastructure become inadequate for the actual operating conditions. This situation necessitates a recalculation of the entire investment. The loss of absorbency is most often due to damage to the pore space and a reduction in the permeability of the reservoir rocks within the injection well. In order to restore absorbency, it is necessary to carry out costly procedures, which usually have a temporary effect. In extreme cases, the loss of water discharge capacity forces the decommissioning of the injection well and the construction of a new one.
In recent years, researchers have conducted studies on the factors affecting well injectivity in geothermal systems. These investigations have focused on the physical and chemical processes occurring near the wellbore. Many studies have examined the impact of mineral precipitation, such as silica, carbonate, barite, or sulphide scaling, as well as the migration and deposition of suspended particles in reinjected fluids [4,11,12,13]. Experimental and modelling work has analysed how fine-particle transport and retention in porous media can reduce permeability and lead to long-term clogging [14]. Other studies have assessed how changes in temperature, pH, and ionic composition can induce local mineral supersaturation and precipitation at the wellbore interface, further affecting injectivity [15].
In Poland, the problem of injectivity decline caused by mineral scaling and particle transport has not been well studied so far. Existing publications on well rehabilitation and geothermal water chemistry [16,17] highlight clogging risks and the use of acidizing treatments, yet comprehensive laboratory and experimental research on mineralization and particle transport under real geothermal conditions is still lacking. This research gap limits the ability to model and forecast injectivity decline and the long-term performance of reinjection operations.
2. Geological Settings
The Polish lowland area can be divided into several significant tectonic units, including the Szczecin–Miechów syncline, the Śródpolskie anticline and the Kościerzyna–Puławy syncline [18] (Figure 1). These are the units with the greatest geothermal potential [19]. They are filled with sediments formed during sedimentation in the so-called Polish Basin, which was created at the beginning of the Permian period as a result of marine transgression. Initially, it was filled with shallow-water marine sediments from the Zechstein, characterised by the presence of evaporites such as rock salt, gypsum and anhydrite. In the Mesozoic, the process of deepening the basin began, which caused a change in the nature of sedimentation. An acceleration of subsidence and the formation of increasingly thicker sediments can also be observed. Clastic formations (conglomerates, sandstones and clays) and carbonate formations (limestones and marls) characteristic of the epicontinental sea began to dominate, with a record of transgressive-regressive cycles in the form of sedimentation changes. The final stage in the evolution of the Polish basin is the inversion of the terrain as a result of tectonic movements during the Laramide phase and the disappearance of marine sedimentation in the Palaeocene [20]. The sediments of the basin are also of economic importance as a source of mineral resources, especially in the case of salt domes formed during tectonic changes at the end of the Mesozoic era [21].
The samples used in the research come from the Lower Jurassic geothermal water level in the Mogilno–Łódź segment (basin), which is the central part of the Szczecin–Miechów syncline. The north-western border of the basin, separating it from the Szczecin–Gorzów segment, is marked by a series of anticlines, known as the Drawno–Poznań fold-fault range, as well as the Luboń–Brzeg fault zone [18] and the Obornik elevation [20]. The southern border of the Mogilno–Łódź Basin and the Miechów Basin is formed by a structure called the Radomsko Folds, also known as the Radomsko or Przedbórz Elevation [18,20]. The Mogilno–Łódź Basin is divided into the wider Mogilno Basin with the Mogilno anticline in its central part and the Łódź Basin [22]. The greatest thicknesses occur in the vicinity of Turek (approximately 3000 m of Cretaceous sediments).
The Polish Lowland is the most promising region for the development of geothermal energy in Poland. This is due to favourable temperatures (exceeding 90 °C in places) and the significant yields of the exploited aquifers. In addition, this region is characterised by little variation in geological structure (compared to the Sudeten or Carpathian regions). The main aquifers are located in the Lower Jurassic and Lower Cretaceous rocks [23]. The first geothermal doublets in the Polish Lowlands began to emerge in the 1990s [24].
The Lower Cretaceous geothermal reservoir is composed of sandstone formations of varying permeability, interbedded with clayey-silty formations. The ceiling of the reservoir reaches from 250 m above sea level in the southern part of the lowlands to 2500 m below sea level in the area north of Konin. The thickness of the aquifer ranges from several to over 300 m. The further away from the centre of the reservoir, the closer the ceiling is to the surface and the thickness of the sediments decreases. Water temperatures in the Lower Cretaceous reservoir rocks are usually up to 40 °C with local temperature increases, e.g., in the vicinity of Konin (up to 90 °C). The mineralisation of the waters in the reservoir is varied and ranges from a few g/dm3 to even 100 g/dm3 in the Szczecin basin [19,25,26]. In the case of the Mogilno–Łódź basin, waters with Na-Ca-HCO3, Na-Cl, Na-Cl-HCO3 and Ca-Na-HCO3 mineralisation types dominate [27].

Figure 1.
Temperature map at a depth of 2000 m in Poland [28].
Figure 1.
Temperature map at a depth of 2000 m in Poland [28].

The Lower Jurassic aquifer layers are dominated by various types of sandstones interbedded with clayey siltstone formations. As in the case of Lower Cretaceous formations, the sandstone layers are sealed with siltstones and mudstones. Due to the diverse and complex tectonic structure, the depth of the Lower Jurassic sediments varies from 1500 m below sea level to as much as 3900 m below sea level in the Mogilno–Łódź basin. Their thickness varies from 10 to over 650 m. Temperatures in this reservoir depend on depth, reaching around 50 °C in the upper parts, while the highest temperatures are found in the geothermal waters in the deeper sandstone layers in the Konin area (over 100 °C) (Figure 1). Similarly to temperature, the degree of mineralisation also depends on depth. In shallow layers, mineralisation is up to 2 g/dm3, while the highest values were recorded in the Łódź Basin (up to 200 g/dm3), although it should be noted that in most of the reservoir it does not exceed 100 g/dm3 [19,25,26]. In the Mogilno–Łódź Basin, these are mainly Na-Cl, Na-Mg-Cl, Ca-Na-Mg-Cl and other waters [27].
Other reservoirs are also found in the Polish lowlands, including Upper Jurassic, Triassic, Permian and Carboniferous reservoirs, but the Lower Jurassic layers have the greatest geothermal potential. They account for almost 50% of the available geothermal energy resources of individual reservoirs in the cumulative thermal water energy resources [19].
Currently, Lower Jurassic waters are used by plants in Pyrzyce (Lias aquifer) and Stargard Szczeciński. Almost from the very beginning of their existence, heating plants have faced complications when injecting cooled thermal water. These facilities have become a testing ground in Poland for solutions to improve absorbency [29,30,31]. In addition, they were gradually transformed from doublets into extensive systems with a predominance of injection wells [32]. Currently, the geothermal installation in Konin, which drilled the Lower Jura level at a depth of ~2600 m TVD, is awaiting commissioning.
Due to documented problems with absorptivity and high temperature potential, rocks and waters of the Lower Jurassic were selected for research.
3. Materials and Methods
3.1. Research Concept
The identification of phenomena occurring in the geothermal system was based on a comparative analysis of rocks and fluids in situ and after flow tests in simulated reservoir conditions. The research scheme involved a thorough analysis of the properties of rocks and reservoir fluids. Before the actual experiments were carried out, SEM, MICP(I) and microscopic analyses were performed, which provided information on the mineralogical composition and filtration parameters of the rocks. An identical set of tests was performed after the flow experiments were completed, and the results obtained were compiled and compared. In the case of MICP tests, in the second stage, material was tested both from the front part of the cylinder (II) and from its end (III) in order to capture potential changes occurring along the length of the cylinder. The porosimetric analyses were performed using an AutoPore V mercury porosimeter (Micromeritics). The instrument and all penetrometers were calibrated using the Silica–Alumina Reference Material (004-16822-00) supplied by the same manufacturer.
The flow tests were performed using DCI’s Core Flood System. The configuration of the set is shown in the diagram (Figure 2). Pressure monitoring was performed using pressure transducers (0–10,000 psi, accuracy: ±0.25% FS, ±25 psi or ±0.17 MPa). Flow rates were controlled by syringe pumps with a flow rate resolution of 0.1 µL/min and a dosing accuracy of ±1%, ensuring precise and stable fluid delivery. The tests were conducted at a constant temperature of 25 °C, applying a sealing pressure equal to the lithostatic pressure, and using system backpressure to maintain a pore pressure corresponding to the reservoir pressure. The experiments were designed to pump brine through the core at a constant flow rate until significant pressure changes were observed. The flow rates were selected to reflect the flow rate that would occur when injecting 150 m3/h of water into the reservoir zone at distances of 0.2 m, 0.4 m, 1 m and 4 m from the borehole wall.
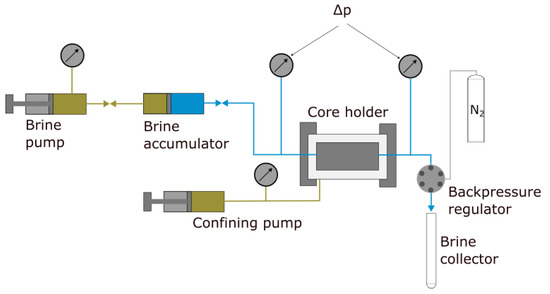
Figure 2.
Flow test setup configuration.
These values were estimated based on the following formulas:
where
Qinj = injection rate
h = thickness of aquifer
φ = porosity
v(r) = fluid velocity
r = distance from the well
vw = flow rate
rw = borehole radius
The above formulas assume that the flow is one-dimensional, radial and uniform along the entire layer. It is commonly used to estimate the local fluid velocity in groundwater injection and exploitation systems, including geothermal systems [33].
The output was selected taking into account the maximum capacity of the production well paired with a single injection well.
3.2. Preparation and Characteristics of the Test Material
Rock material and water from the Lower Jurassic aquifer were used to recreate the phenomena occurring in the absorption well. The plug samples were approximately 8 cm long and 2.5 cm in diameter. The rocks for testing were dried at 105 °C and after cooling their absolute permeability was measured in ambient temperature. They were then saturated with the appropriate brine using the desaturation method.
The mineralisation of the water was 15.04 g/dm3, while the pH measured 6.9, which represents a significant deviation from the in situ pH value of 5.8. The in situ brine contained iron at a concentration of 26.1 mg/dm3, whereas the brine used in the experiments had a considerably lower iron content of 2.71 mg/dm3. Similarly, the strontium content decreased from 82.5 mg/dm3 in the in situ brine to 74.2 mg/dm3 in the laboratory brine. Despite these reductions in iron and strontium concentrations, the major ions such as sodium, potassium, magnesium, and calcium showed no significant changes compared to the reservoir waters, indicating that their concentrations remained stable during sample preparation and handling. This suggests that while certain trace elements were reduced, likely due to oxidation or precipitation during storage and handling, the primary cationic composition of the brine maintained its representativeness of the in situ reservoir fluid. The brine was then decanted. This resulted in type A brine, which was straw-coloured. Next, part of the brine A was left for five weeks for further gravitational purification. After this time, the water was completely clear, while a small amount of ferrous sediment remained at the bottom. The decanted liquid was used in flow tests and designated as brine type B. The last type was brine type C (Figure 3). It was produced by filtering brine B through a rock core during flow tests. Microscopic observations did not reveal any particles larger than 1 µm in any of the brines, but it cannot be ruled out that such particles may have formed as a result of aggregation in later stages. The most important difference concerned the concentration of these particles.
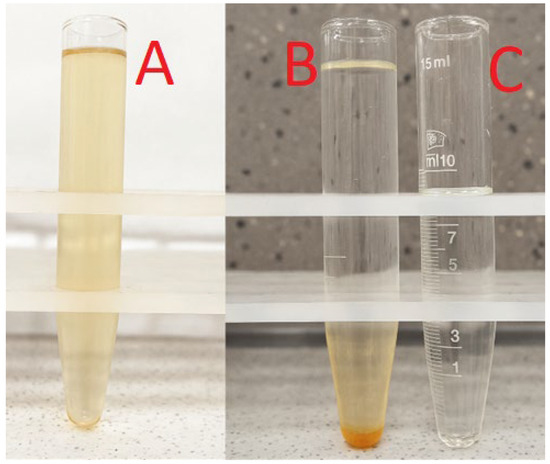
Figure 3.
Brines used in flow tests. From left to right: A, B, C.
The Lower Jurassic sandstones used in the project are characterised by favourable reservoir properties. They are light grey, fine-grained rocks with moderately good grain sorting. According to the classification [34], they are sublitic arenites. The grain skeleton is composed of a predominant amount of moderately rounded quartz grains with a small amount of lithoclasts such as quartzites and detrital chlorites (up to 10% of the skeleton). Accessory muscovite flakes and feldspar fragments are present. The cement is composed mainly of clay minerals (kaolinite dominates), completely filling the pore space between the grains. It seems to fill mainly larger pores, often adjacent to each other. In addition, heavily degraded elements of the carbonate binder and neogenic quartz cement rims around larger grains are visible. The pores in the microscopic image are mainly larger free spaces separated from each other by narrow throats (channels). Their shape is mostly irregular, slightly elongated but without a clear directionality (Figure 4).
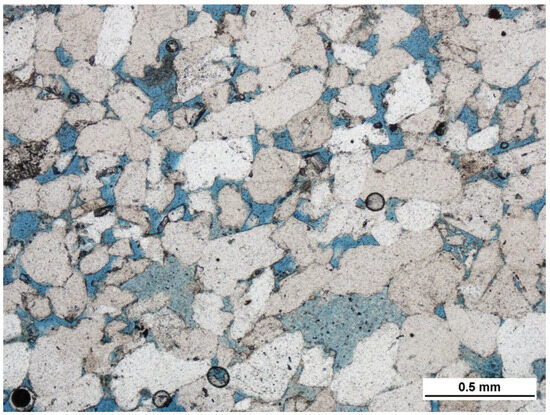
Figure 4.
Microscopic image of a sample of Jurassic sandstone (transmitted light, parallel polarizers) on which flow tests were conducted.
The results of mercury porosimetry (MICP) for samples prior to flow experiments provide more detailed information on the characteristics of the pore space of sandstones (Table 1). The effective porosity ranges from 13.57 to 17.37%. The threshold diameters determining the pore size at which a sudden increase in mercury intrusion into the pore space begins range from 11 to 36 µm. Pores larger than 10 µm dominate and, depending on the sample, may account for up to 70% of all pores. The proportion of pores in the 10–1 range is between 20 and 60%, although it should be noted that most of the samples tested have values closer to the lower range. In the 1–0.1 range, there is a visible decrease in the number of pores, amounting to a maximum of 16%. The proportion of smaller pores does not exceed a few per cent at most and is not of great significance when assessing the reservoir potential of the rock.

Table 1.
Basic data obtained from MICP analysis.
SEM studies on samples prior to brine injection revealed the presence of a number of minerals filling the pore space, ranging from regeneration shells and secondary quartz crystallisation to clay minerals such as kaolinite and, to a lesser extent, chlorite and illite (Figure 5 and Figure 6). In addition, microporosity was observed between kaolinite plates and chlorite flakes.
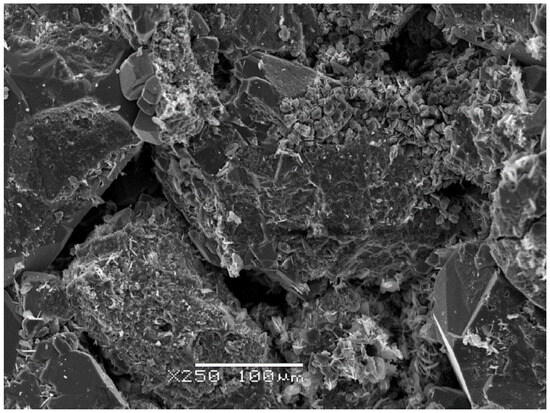
Figure 5.
Pore space, visible free and partially filled pores. The binder contains a clay substance with a kaolinite composition, as well as chlorite and illite.
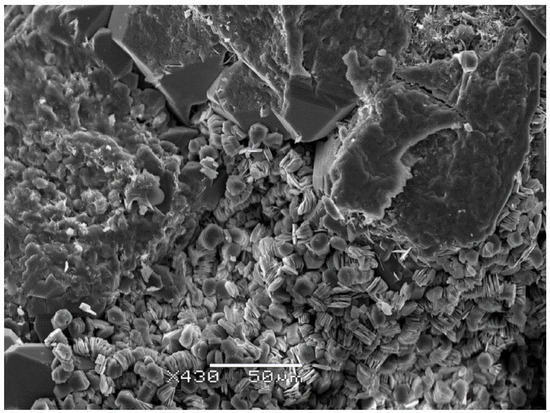
Figure 6.
Pore space filled with kaolinite in the form of pseudohexagonal plates.
4. Results
Seven flow tests were conducted under simulated reservoir conditions. Brine with different concentrations of solids (A, B, C) was injected into the cores at flow rates ranging from 0.02 to 0.4 cm/s (Table 2).
Table 2.
Summary of flow tests performed.
During flow experiments, brine was observed at the outlet of the core flooding system. It was completely transparent and, during cyclic measurements, its pH remained constant at 6.9.
4.1. Analysis of Flow Pressure Changes
The first series of tests focused on the use of brine with a higher solid content. Samples 3 and 7 were selected for the experiments. The pressure increase during pumping is shown in the graph (Figure 7). During pumping through sample 3 of brine A, a steady increase in pressure was observed. After pumping approximately 350 pore volumes, significant pressure fluctuations were observed while maintaining the upward trend. In the next test using sample 7, a steady increase in pressure was initially observed. After pumping approximately 600 pore volumes, it was necessary to take a technical break to refill the tanks with brine. Despite resuming work with the same pumping rate, the pressure increase was much faster. After pumping approximately 900 pore volumes of the core, there was a drastic increase in pressure and intense fluctuations while maintaining an upward trend. This behaviour is attributed to the recurrent and cyclic clogging and subsequent reopening of the flow channels within the porous structure of the sample. The pronounced and abrupt pressure rise, which substantially deviated from the trends observed in other samples, can be explained by the combined effect of employing the brine with the highest level of contamination and the sample characterised by the lowest porosity.
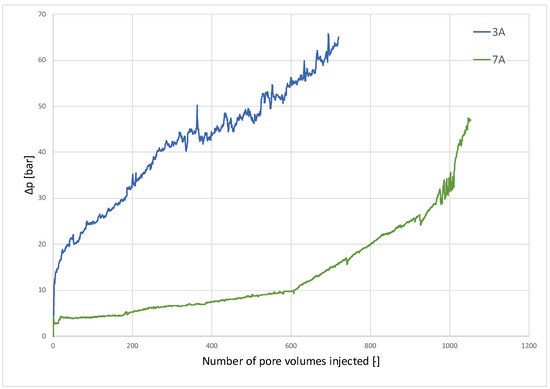
Figure 7.
Graph of pressure changes during brine pumping A.
During experiments using brines with a lower concentration of suspended particles, a steady pressure increase with localised, sudden increases and decreases was observed (Figure 8). This indicates repeated blockages and clogging of the fluid flow paths. The rate of pressure increase is closely correlated with the flow velocity of the brines. This indicates the mobilisation of clay particles as a result of the disturbance of electrostatic forces in the rock medium and, thus, the detachment of clay particles from the grain skeleton. The higher the flow velocity, the faster the increase in pressure at the same volume of pore space pumped through. The second conclusion is the limited influence of particles suspended in the brine. It is important to note that samples 4 and 6 show a similar pressure increase despite different porosities and purity of the brines pumped through them. The graph (Figure 8) shows this in the form of parallel pressure increase curves. A common feature of these samples is their similar flow velocity and pressure increase rate. This suggests that the mobilisation of clay particles dominates over clogging with suspended particles.
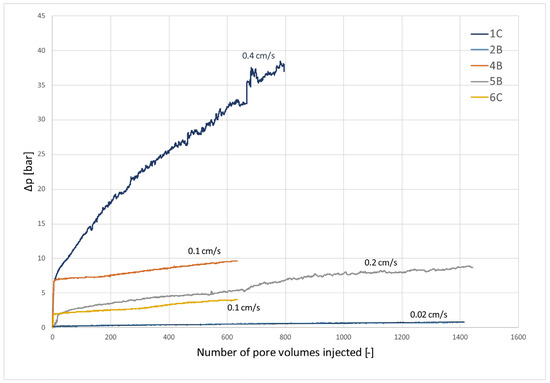
Figure 8.
Graph showing pressure changes during brine pumping B.
4.2. Microscopic and Macroscopic Observations
After completing the experiments, a filter cake consisting of rust-red sediment was observed on the front surface of each core. The photographs (Figure 9, Figure 10, Figure 11 and Figure 12) compare the core before the experiments and three samples through which 4 litres of brines A, B and C were pumped. The thickest layer of sediment was identified on the cores through which brine A was pumped, a smaller amount on the cores through which brine B was pumped, and the smallest amount on the samples through which brine C was pumped.
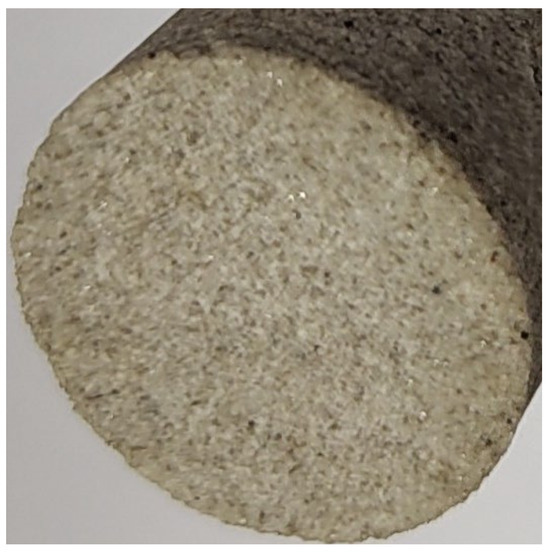
Figure 9.
Core face before pumping.
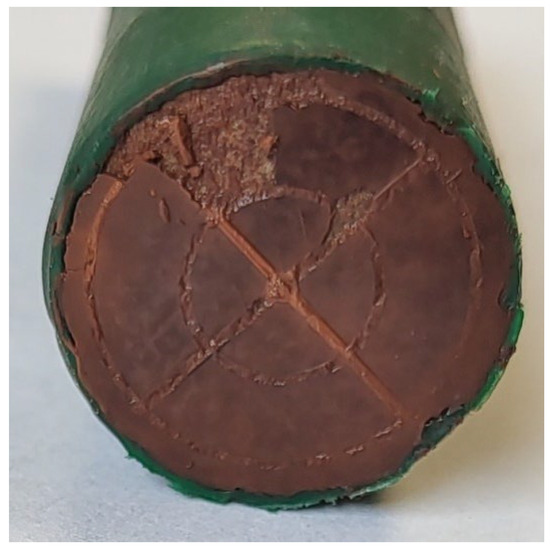
Figure 10.
Core face after pumping brine A.
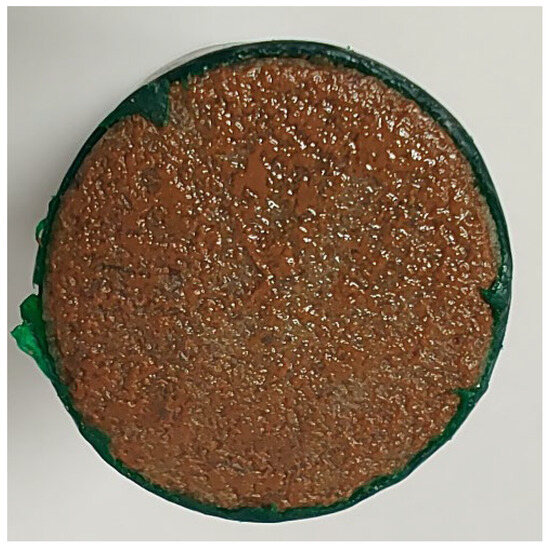
Figure 11.
Core face after pumping brine B.
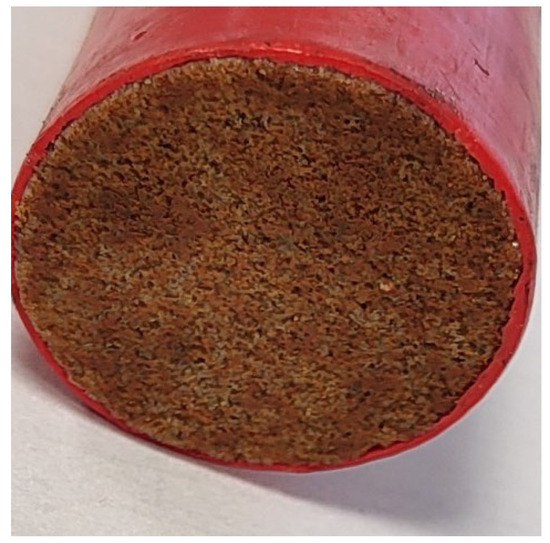
Figure 12.
Core face after pumping brine C.
After cutting the cores along the axis and making thin polished plates from them, it was noticed that the visible layer appears impermeable, significantly hindering the penetration of brine into the core. Ferrous sediment from the brine was observed at a maximum depth of 1.5 cm from the front of the sample. On this basis, the particles suspended in brine C were determined to be secondary, resulting from secondary precipitation due to exposure to atmospheric air. The particles that penetrated the sample settle on the surfaces of quartz grains, accumulating until the pores are completely closed (Figure 13 and Figure 14). As can be seen in the photos, further down the core, the sediment is localised and accumulates. It occurs mainly in narrowings between larger pores or in places with a potential decrease in brine flow velocity, such as pores with closed outlets or depressions in the grain skeleton. Some of the material occurs in the form of round aggregates that have already been deposited in this form (Figure 15). This allows us to conclude that fragments of the originally deposited material were subsequently detached and transported deeper.
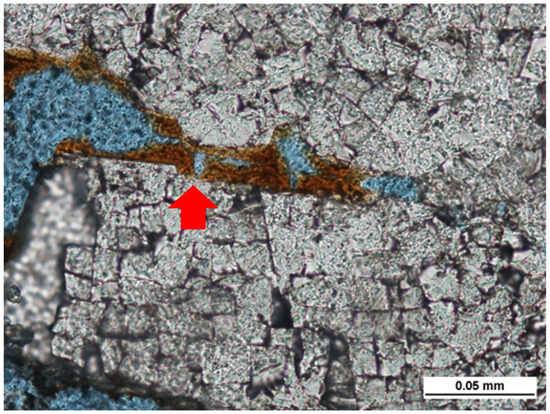
Figure 13.
Microscopic image (transmitted light, without polariser) Mechanism of filter cake build-up in the form of concentric layers (red arrow).
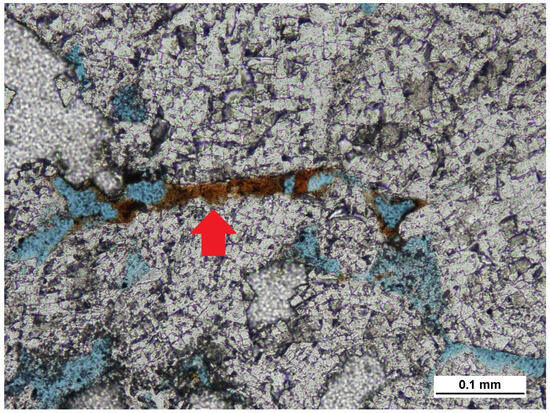
Figure 14.
Microscopic image (transmitted light, without polariser). Blocking of pore throats by iron hydroxide particles (red arrow).
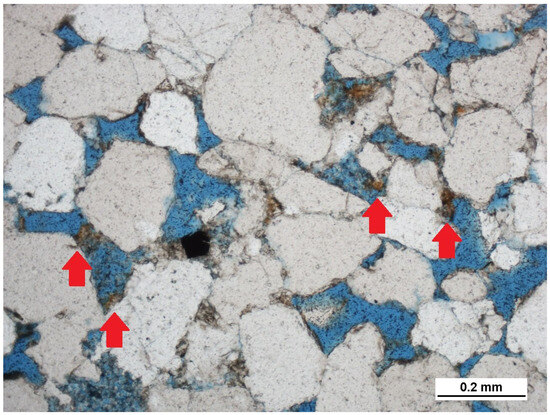
Figure 15.
Microscopic image (transmitted light, without polariser) Redeposition of rusty sediment aggregates (iron hydroxides) (red arrows) in the pores.
4.3. Changes in Pore Structure
In addition to the deposition of iron sediments, it has been observed that the pores and channels formed as a result of brine pressure often take on complex shapes, with numerous branches pointing in different directions or at large angles (Figure 16). This structure may hinder the flow of the medium through the sample. Thin section analysis indicates that several significant changes occur during this process. Brine injection leads to the leaching of some clay minerals (Figure 17), which can then accumulate in pore constrictions [35,36]. At the same time, some grains are released from the grain skeleton and, as they move, can clog the throats connecting the pores.
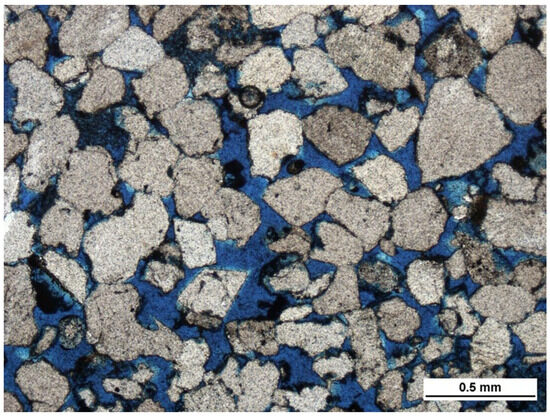
Figure 16.
Microscopic image (transmitted light, without polariser) In the central part of the photograph, a series of pores connected by wide throats can be seen, forming an elongated channel (pseudo-gap).
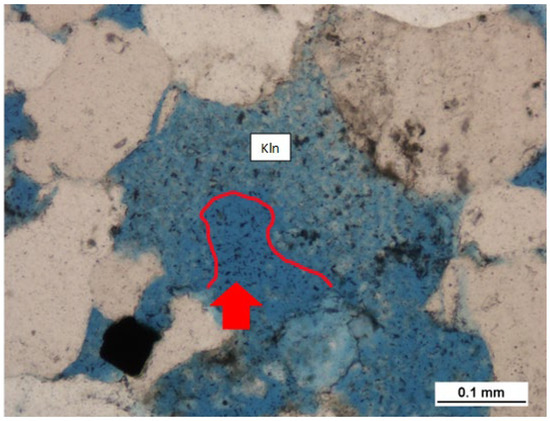
Figure 17.
Microscopic image (transmitted light, without polariser) The pore space is partially filled with kaolinite, and an irregularly round void in the centre of the photograph (red arrow) is noticeable—probably the result of washing out.
This thesis is confirmed by the results of mercury porosimetry tests. The increase in hysteresis values compared to the original state indicates a significant complication of the connections between the pores, which leads to a decrease in permeability without a significant decrease in porosity. The greatest changes occurred in the front (II) part of the cylinder (Table 1). This is caused both by clogging with particles suspended in brine and by the mobilisation of clay particles that make up the rock. In the rear (III) part of the sample, the hysteresis values are not as significant (Figure 18). This suggests that the greatest damage to permeability occurs in the first few millimetres of the reservoir zone. This is also evident in petrographic analyses, where complex multi-channel pores with closed branches were more common in the front zone of the sample. In the case of other parameters characterising the pore space of the rock, no significant and unambiguous changes were noted that could be attributed to brine injection (Figure 19). In most cases, the slight variations in porosity observed in the frontal part of core (II) (Table 1) may result from natural, small-scale changes in the pore microstructure. Where the increase in porosity is more pronounced, it can be associated with the leaching of clay minerals (e.g., prior to the formation of the filter cake), which enlarges pore channels and releases the occupied surface area. Moreover, under elevated brine pressure, secondary fluid invasion into the sample can induce fines detachment and migration as well as internal erosion, resulting in localised opening of pore throats. At the same time, these processes may lead to a situation in which the geometry and connectivity of the pore network become more complex, causing pore-space hysteresis and affecting fluid flow and retention behaviour. In the further part of the sample, a slight decrease in porosity is sometimes observed (Figure 19), which may suggest the relocation or accumulation of a portion of the detached material.
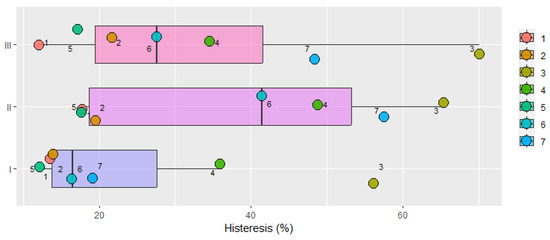
Figure 18.
Distribution of hysteresis results; I—sample before brine injection, II—after brine injection, front part, III—after brine injection, rear part.
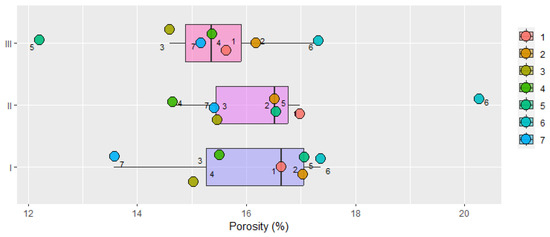
Figure 19.
Distribution of open porosity results; I—sample before brine injection, II—after brine injection, front part, III—after brine injection, rear part.
The SEM analysis after the flow tests focused on examining the rusty sediment formed on the surface of the cores. The analysis showed that at the contact point with sandstone, a deposit in the form of halite encrustation mixed with Fe minerals was formed. Unfortunately, due to the coarse-crystalline halite and xeromorphic form of the minerals, the analysis of the rusty material was difficult. EDS analysis indicated the presence of iron (iron oxides and hydroxides) and magnesium, suggesting the additional precipitation of carbonates such as dolomites and ankerites (Figure 20).
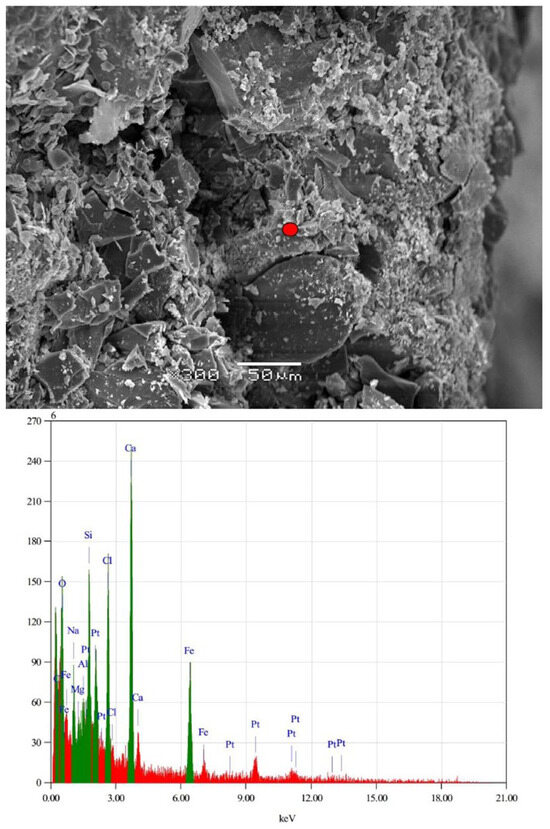
Figure 20.
The SEM image shows newly precipitated halite crystals and iron-rich coatings in direct contact with the sandstone framework. The corresponding EDS spectrum confirms the presence of Na and Cl (halite), Fe and O (iron oxides/hydroxides), Si (quartz), and minor Mg and Al (chlorites). These features indicate that halite and iron-bearing phases precipitated from the injected brine under saline, oxidising conditions, while quartz and chlorites represent components of the original sandstone framework.
5. Discussion
The studies carried out have clearly and indisputably proven that the injection of cooled thermal waters from the Lower Jurassic aquifer leads to damage to the permeability in the near-well zone. This phenomenon occurs as a result of the deposition of suspended particles and the mobilisation of clay particles resulting from the disturbance of electrostatic forces in the medium. The process can be understood as a dual mechanism: deposition of suspended mineral particles combined with mobilisation of clay particles, which further modifies pore structures [9,36]. The intensity increases with the flow velocity. Clay particles detached from the grain skeleton accumulate in pore constrictions, causing local flow blockages. This phenomenon is progressive: the initial restriction of flow increases local velocities, which intensifies further mobilisation and is consistent with clogging theories reported in water and geothermal systems literature [6,9].
These interpretations are supported by experimental observations, where brine injection led to an increase in median hysteresis of approximately 25% compared to the pre-injection values, while median porosity remained nearly unchanged (below 1%). Only in the more distant part of the sample were slight decreases in porosity observed, around 1%. These results are consistent with microscopic observations, which revealed the formation of longer and more tortuous channels due to the mobilisation of clay and mineral particles, but without significant changes in pore volume.
Due to the mineralogical composition consisting predominantly of quartz and clay minerals, no mineral dissolution was observed during the experiments. Additionally, microscopic observations revealed no mineral precipitation. The mineralogical composition of the deposited sediments indicates transport processes of suspended particles rather than complex geochemical processes initiated by changes in thermodynamic conditions during brine cooling. Sediment deposition to a depth of up to 1.5 cm suggests that the damage is not limited to the surface but also extends to the near-wellbore zone.
Delaying and minimising the phenomena described are critical to the long-term efficiency of geothermal systems. Potential mitigation strategies include adjusting the pH of the brine to optimal values and controlling flow velocity to prevent particle mobilisation. The use of specialised inhibitors may also be effective, but requires prior laboratory testing to avoid irreversible damage to the wellbore zone. Further research and modelling of permeability evolution and geochemical interactions are essential for predicting operational outcomes and developing practical guidelines for safe and efficient geothermal exploitation.
6. Conclusions
The research carried out in this study and the analysis of its results allowed us to draw a number of conclusions:
- The identified causes of permeability damage are the synergistic effects of clogging and clay particle mobilisation processes.
- When exploiting lower Jurassic waters, it is recommended to optimise the injection rate and select appropriate filters and inhibitors.
- In order to examine the impact of individual processes in more detail, flow tests using interval pressure measurements, micro-CT scans and computer simulations may be helpful.
- The processes of damage to the near-wellbore zone are multifactorial and may vary in intensity depending on local lithology, which should be taken into account when planning exploitation.
- A decrease in permeability is not always associated with a decrease in porosity; changes in geometry and pore throat clogging are of key importance. In the frontal zone of the sample, the median hysteresis increased from 16.46% to 41.45%, while the median porosity slightly decreased from 16.64% to 16.52%.
- Further research should focus on integrating experimental, field, and modelling approaches to predict the evolution of permeability and optimise geothermal operations. Understanding the interplay of hydrogeological, geochemical, and operational factors is essential for sustainable geothermal energy production.
Author Contributions
Conceptualisation: R.C.-S. and G.L.; formal analysis: Ł.K. and K.N.; investigation and methodology: Ł.K., K.N., R.C.-S. and G.L.; writing—original draft preparation: Ł.K., K.N.; writing—review and editing: Ł.K., K.N., R.C.-S. and G.L.; visualisation: Ł.K. and K.N.; supervision: R.C.-S. and G.L. All authors have read and agreed to the published version of the manuscript.
Funding
The research leading to these results received funding from the Project titled “Analysis of potential factors affecting the decline in injectivity in geothermal wells”, under grant agreement No. DK-4100-8/23.
Data Availability Statement
The data presented in this study are available on request from the corresponding author.
Conflicts of Interest
The authors declare no conflicts of interest.
References
- Ustawa Prawo Wodne. Dz.U. 2017 poz. 1566; The Chancellery of the Sejm of the Republic of Poland: Warsaw, Poland, 2017. [Google Scholar]
- Tomaszewska, B.; Pająk, L. Geothermal water resources management—Economic aspects of their treatment. Gospod. Surowcami Miner.-Miner. Resour. Manag. 2012, 28, 59–70. Available online: https://fbc.pionier.net.pl/en/publication/aa7e72f147257297fb20 (accessed on 28 October 2025).
- Axelsson, G. Modelling Sustainable Geothermal Energy Utilization. In Proceedings of the 53rd SIMS Conference, Reykjavik, Iceland, 4–6 October 2012. [Google Scholar]
- Luo, W.; Kottsova, A.; Vardon, P.J.; Dieudonné, A.C.; Brehme, M. Mechanisms causing injectivity decline and enhancement in geothermal projects. Renew. Sustain. Energy Rev. 2023, 185, 113623. [Google Scholar] [CrossRef]
- Bouwer, H. Artificial recharge of groundwater: Hydrogeology and engineering. Hydrogeol. J. 2002, 10, 121–142. [Google Scholar] [CrossRef]
- Song, W.; Liu, X.; Zheng, T.; Yang, J. A review of recharge and clogging in sandstone aquifer. Geothermics 2020, 87, 101857. [Google Scholar] [CrossRef]
- Sharma, S.K.; Cooney, T.F.; Olson, H. A Research Program for Development and Field Testing of Fiber-Optic Sensors for Monitoring Geological Environments; GHC Bulletin; University of Hawaii at Manoa: Honolulu, HI, USA, 1992. [Google Scholar]
- Bennion, D.B. An Overview of Formation Damage Mechanisms Causing a Reduction in the Productivity and Injectivity of Oil and Gas Producing Formations. J. Can. Pet. Technol. 2002, 41, 29–36. [Google Scholar] [CrossRef]
- Kottsova, A.; Bruhn, D.F.; Saar, M.O.; Veeger, F.; Brehme, M. Clogging mechanisms in geothermal operations: Theoretical examples and an applied study. In Proceedings of the European Geothermal Congress 2022, Berlin, Germany, 17–21 October 2022. [Google Scholar]
- Budak, P.; Szpunar, T. Sposób oceny rozkładu temperatury w produkcyjnym otworze geotermalnym przy dopływie mieszaniny solanki i dwutlenku węgla w zakresie warunków nadkrytycznych. Nafta-Gaz 2021, 77, 446–453. [Google Scholar] [CrossRef]
- Longval, R.; Meirbekova, R.; Fisher, J.; Maignot, A. An Overview of Silica Scaling Reduction Technologies in the Geothermal Market. Energies 2024, 17, 4825. [Google Scholar] [CrossRef]
- Haklıdır, F.S.T.; Balaban, T.Ö. A review of mineral precipitation and effective scale inhibition methods at geothermal power plants in West Anatolia (Turkey). Geothermics 2019, 80, 103–118. [Google Scholar] [CrossRef]
- Martelo, D.; Holmes, B.; Kale, N.; Scott, S.W.; Paul, S. Investigation of Scaling and Materials’ Performance in Simulated Geothermal Brine. Materials 2024, 17, 5250. [Google Scholar] [CrossRef]
- Yang, W.; Chen, M.A.; Lee, S.H.; Kang, P.K. Fluid inertia controls mineral precipitation and clogging in pore to network-scale flows. Proc. Natl. Acad. Sci. USA 2024, 121, e2401318121. [Google Scholar] [CrossRef]
- Gao, B.; Li, Y.; Pang, Z.; Huang, T.; Kong, Y.; Li, B.; Zhang, F. Geochemical mechanisms of water/CO2-rock interactions in EGS and its impacts on reservoir properties: A review. Geothermics 2024, 118, 102923. [Google Scholar] [CrossRef]
- Bielec, B.; Kępińska, B. Testowanie badawcze “miękkiego kasowania” w geotermalnych otworach chłonnych. Zesz. Nauk. Inst. Gospod. Surowcami Miner. I Energią PAN 2012, 71–87. Available online: https://min-pan.krakow.pl/wp-content/uploads/sites/4/2017/12/bielec-kepinska.pdf (accessed on 28 October 2025).
- Cegielska, J.; Kuzik, K.; Żarczyński, A. Geotermia Jako Odnawialne Źródło Energii-Porównanie Składów Wód Geotermalnych z Wybranych Odwiertów w Polsce (Uniejów, Pyrzyce, Mszczonów i Gostynin). Eliksir. Politechnika Łódzka, Wydział Chemiczny, 2021/2022, 11, 12–19. Available online: https://repozytorium.p.lodz.pl/items/519cc751-06d8-47b5-a392-0f990226c40e (accessed on 28 October 2025).
- Żelaźniewicz, A.; Aleksandrowski, P.; Buła, Z.; Karnkowski, P.H.; Konon, A.; Oszczypko, N.; Żaba, J. Regionalizacja Tektoniczna Polski; Polish Academy of Sciences: Wrocław, Poland, 2011. [Google Scholar]
- Hajto, M. Baza zasobowa wód termalnych na Niżu Polskim—Geologiczne i hydrogeologiczne uwarunkowania lokalizacji obszarów perspektywicznych. Geologia 2008, 34, 503–526. [Google Scholar]
- Stupnicka, E.; Stempień-Sałek, M. Geologia Regionalna Polski; University of Warsaw Press: Warszawa, Poland, 2016; pp. 176–228. [Google Scholar]
- Krzywiec, P. Geometria i ewolucja wybranych struktur solnych z obszaru Niżu Polskiego w świetle danych sejsmicznych. Prz. Geol. 2009, 57, 812. [Google Scholar]
- Karnkowski, P.H. Regionalizacja tektoniczna Polski—Niż Polski. Prz. Geol. 2008, 56, 895–903. [Google Scholar]
- Górecki, W.; Szczepański, A.; Sadurski, A.; Hajto, M.; Papiernik, B.; Szewczyk, J.; Sokołowski, A.; Strzetelski, W.; Haładus, A.; Kania, J.; et al. Atlas Zasobów Geotermalnych Formacji Mezozoicznej na Niżu Polskim; Akademia Górniczo-Hutnicza (AGH): Kraków, Poland, 2006. [Google Scholar]
- Bujakowski, W.; Barbacki, A.; Miecznik, M.; Pająk, L.; Skrzypczak, R.; Sowiżdżał, A. Modelling geothermal and operating parameters of EGS installations in the lower triassic sedimentary formations of the central Poland area. Renew. Energy 2015, 80, 441–453. [Google Scholar] [CrossRef]
- Górecki, W.; Hajto, M.; Strzetelski, W.; Szczepański, A. Dolnokredowy oraz dolnojurajski zbiornik wód geotermalnych na Niżu Polskim. Prz. Geol. 2010, 58, 589–593. [Google Scholar]
- Sowiżdżał, A. Potencjał geotermalny zbiorników mezozoicznych Niżu Polskiego do produkcji energii elektrycznej. Tech. Poszuk. Geol. 2016, 55, 105–115. [Google Scholar]
- Sowiżdżał, A.; Hajto, M.; Papiernik, B.; Mitan, K.; Hałaj, E. Możliwości rozwoju sektora geotermii w centralnej Polsce w świetle pogłębionej analizy strukturalno-parametrycznej rejonu niecki mogileńsko-łódzkiej. Tech. Poszuk. Geol. 2017, 56, 1–15. [Google Scholar]
- Szewczyk, J. Geofizyczne oraz hydrogeologiczne warunki pozyskiwania energii geotermicznej w Polsce. Przegląd Geol. 2010, 58, 566–573. Available online: https://yadda.icm.edu.pl/baztech/element/bwmeta1.element.baztech-article-BUS6-0023-0014 (accessed on 28 October 2025).
- Biernat, H.; Kulik, S.; Noga, B. Problemy związane z eksploatacją ciepłowni geotermalnych wykorzystujących wody termalne z kolektorów porowych. Prz. Geol. 2009, 57, 682–688. [Google Scholar]
- Marjanowski, J.; Biernat, H.; Kulik, S.; Nalikowski, A.; Noga, B.; Zieliński, B. Problemy kolmatacji w otworach chłonnych w Geotermii Pyrzyce oraz możliwości ich zapobiegania w wyniku zastosowania metody super miękkiego kwasowania. Instal 2013, 9, 34–38. [Google Scholar]
- Niewiarowski, A. Przyczyny upadku ciepłowni geotermalnej w Stargardzie Szczecińskim. Tech. Poszuk. Geol. 2007, 46, 21–23. [Google Scholar]
- Noga, B. Przegląd konstrukcji dubletów geotermalnych wykonanych na terenie Polski. Instal 2023, 12, 4–8. [Google Scholar] [CrossRef]
- Kottsova, A.; Kong, X.Z.; Zitha, P.L.J.; Bruhn, D.F.; Saar, M.O.; Brehme, M. Experimental Study of the Mineral Precipitation Dynamics During Geothermal Reinjection. In Proceedings of the 49th Stanford Geothermal Workshop, Stanford, CA, USA, 12–14 February 2024. [Google Scholar]
- Pettijohn, F.J.; Potter, P.E.; Siever, R. Sand and Sandstone; Springer: Berlin, Germany, 1972. [Google Scholar]
- Grey, D.H.; Rex, R.W. Formation damage in sandstones caused by clay dispersion and migration. In Clays and Clay Minerals, Proceedings of the Fourteenth National Conference, Berkeley, California; Elsevier: Amsterdam, The Netherlands, 1966; Volume 1, pp. 355–362, 362a, 362b, 363–366. [Google Scholar] [CrossRef]
- Gabriel, G.A.; Inamdar, G.R. An experimental study of fines migration in porous media. SPE J. 1983, 23, 213–220. [Google Scholar]


Disclaimer/Publisher’s Note: The statements, opinions and data contained in all publications are solely those of the individual author(s) and contributor(s) and not of MDPI and/or the editor(s). MDPI and/or the editor(s) disclaim responsibility for any injury to people or property resulting from any ideas, methods, instructions or products referred to in the content. |
© 2025 by the authors. Licensee MDPI, Basel, Switzerland. This article is an open access article distributed under the terms and conditions of the Creative Commons Attribution (CC BY) license (https://creativecommons.org/licenses/by/4.0/).