Abstract
The rapid growth of electric vehicle (EV) charging demand poses significant challenges to distribution networks (DNs), particularly during public holidays when concentrated peaks occur near scenic areas and urban transport hubs. These sudden surges can strain transformer capacity and compromise supply reliability. Fixed soft open points (SOPs) are costly and underutilized, limiting their effectiveness in DNs with multiple transformers and asynchronous peak loads. To address this, from the perspective of power supply companies, this study proposes a mobile soft open point (MSOP)-based approach to enhance the hosting capacity of EV charging stations. The method pre-installs a limited number of fast-access interfaces (FAIs) at candidate transformers and integrates a semi-rolling horizon optimization framework to gradually expand interface availability while scheduling MSOPs daily. An automatic peak period identification algorithm ensures optimization focuses on critical load periods. Case studies on a multi-feeder distribution system coupled with a realistic traffic network demonstrate that the proposed method effectively balances heterogeneous peak loads, matches limited interfaces with MSOPs, and enhances system-level hosting capacity. Compared with fixed SOP deployment, the strategy improves hosting capacity during peak periods while reducing construction costs. The results indicate that MSOPs provide a practical, flexible, and economically efficient solution for power supply companies to manage concentrated holiday charging surges in DNs.
1. Introduction
With the rapid proliferation of electric vehicles (EVs), charging demand within distribution networks (DNs) has been continuously increasing, placing higher operational requirements on the grid [1]. In China, particularly during public holidays, certain transformers with charging stations (CSs) near scenic spots and transport hubs frequently experience concentrated and sudden charging peaks. Such seasonal peaks can lead to significant voltage drops at the end of low-voltage feeders, increased peak-to-valley differences, reduced grid regulation capability, and accelerated equipment aging, posing new challenges to the safe and stable operation of distribution networks [2,3]. Therefore, effectively utilizing distribution network resources to enhance the hosting capacity of EV charging stations and to mitigate the impacts of peak charging load has become a critical issue of concern for both academia and industry.
In response to these challenges, researchers have primarily explored solutions from two complementary perspectives: demand-side management through smart charging strategies, and supply-side enhancement through grid infrastructure upgrades. The former approach aims to reshape charging behavior through economic and control signals, while the latter focuses on strengthening the grid’s physical capacity to accommodate peak loads.
To mitigate the impact of peak charging load from EV charging stations on DNs, existing studies have proposed a variety of strategies from different perspectives. In [4], a bi-level optimization model was developed, where a dynamic real-time pricing mechanism guides users to shift charging demand from peak to off-peak hours, thereby achieving peak shaving and valley filling. In [5], the concept of altruistic charging was introduced by promoting on-board delayed charging functions, allowing users to autonomously adjust charging times and thus disperse peak demand, achieving a short-term reduction in overload rates. Ref. [6] proposed a spatial load-shifting strategy based on real-time grid load levels and EV accessibility, dynamically recommending charging stations located in low-load microgrids to achieve system-wide load balancing. In [7], a water-filling algorithm was employed to coordinate EV charging and discharging by dynamically adjusting the group charging levels; vehicle-to-grid (V2G) discharging is triggered during peak hours while centralized charging is scheduled during off-peak hours, minimizing overall load variance. Ref. [8] investigated a spatial diversion strategy to relieve residential evening peaks, but it simultaneously created new daytime peaks in commercial areas, leaving local feeder overload risks unresolved. Ref. [9] proposed a V2G-based bidirectional charging and discharging strategy guided by time-of-use pricing, in which EVs charge during off-peak hours and discharge during peak hours. Combined with a “green energy priority” charging principle and supported by government subsidies, this approach enables microgrid systems to effectively transfer peak loads. In [10], photovoltaic (PV) generation was considered the primary power source, and a multi-objective optimization algorithm was employed to balance cost and efficiency. By coordinating orderly charging and discharging modes guided by time-of-use pricing (centralized charging during off-peak periods and discharging during peak hours) and optimally sizing PV and storage capacities, the method significantly alleviates peak stress on the grid while enhancing energy utilization. However, its effectiveness is strongly dependent on pricing policies. In [11], a distributed smart charging strategy combined with PV curtailment was adopted to locally reduce the impact of charging peaks on the grid. Furthermore, ref. [12] explored the deployment of PV-storage systems at charging stations, enabling dynamic matching between PV generation and charging demand to smooth the load curve and achieve peak shaving from the supply side, thereby alleviating the stress of high-load conditions.
However, during public holidays, charging demand is generally inelastic and can remain high throughout the day, limiting the effectiveness of price-based measures. For the power grid, the peak of EV charging load mainly depends on the charging power and the aggregated number of EVs, rather than on driving behavior or battery capacity [13]. Therefore, with fewer EVs participating in V2G during these periods, it becomes essential to enhance the supply capability from the grid side to effectively manage sustained peak loads.
To address potential charging load peaks in DNs, previous studies have proposed the deployment of fixed soft open points (SOPs) to regulate power flows among feeders and mitigate local overloads. SOPs are core power electronic devices used in distribution networks, first introduced by Siemens with the SIPLINK in 2001, and since widely adopted to enhance grid resilience and economic performance [14]. Ref. [15] employed SOPs for flexible interconnection of microgrids to improve DN resilience, but their fixed installation schemes lack adaptability to diverse fault scenarios. Ref. [16] combined EV discharging during peak periods with SOP-based cross-feeder power transfer, thereby shifting local peak loads in both temporal (off-peak charging) and spatial (inter-area balancing) dimensions to achieve peak shaving and valley filling. Ref. [17] enhanced the overall hosting capacity of EVCSs using SOP switching, but neglected the asynchrony of feeder peak periods, leading to high construction costs and low utilization rates for the fixed SOPs. Ref. [18] proposed a distributionally robust optimization framework integrating multi-terminal SOPs and EV discharging, prioritizing EV discharge during peaks while leveraging SOPs for cross-feeder balancing. Ref. [19] introduced a hierarchical coordination model of EV aggregators and SOP-based power transfer, which reduced operating costs and improved voltage quality under peak load shocks. Ref. [20] comprehensively considers the topological reconfiguration capability of SOPs and the large-scale V2G characteristics of EVs. By establishing a bi-level optimization model, it jointly optimizes the access configuration of SOPs and the discharge power of EVs, effectively reducing network losses and overall voltage deviations in the distribution system.
However, the traditional fixed deployment of SOPs still faces the following limitations: (1) Insufficient flexibility—SOPs require predetermined installation locations, and once deployed, it is difficult to dynamically adjust their operation in response to real-time system changes (e.g., spatiotemporal migration of EV loads) [21,22]. In contrast, MSOPs, if deployable in a mobile manner, can flexibly respond to sudden power flow congestion or faults. (2) Limited cost-effectiveness—the planning of SOPs relies on long-term static data and cannot fully exploit the “on-demand scheduling” advantage of MSOPs, which may lead to suboptimal investment efficiency under short-term load fluctuation scenarios. With recent progress in the compact topologies of flexible interconnection devices, significant advancements have been made in reducing volume and weight, improving efficiency, and simplifying operation [23]. Against this backdrop, mobile soft open points (MSOPs) have emerged as a promising solution. By being flexibly scheduled across different nodes of a DN, MSOPs provide dynamic support for charging load peaks across multiple feeders and time periods. Ref. [24] integrated SOP modules into mobile energy storage vehicles to achieve short-range interconnection and reduce load loss during extreme disaster scenarios. Ref. [25] proposed a multi-stage mobile scheduling strategy, enabling lightweight vehicle-mounted MSOPs to dynamically switch interconnection positions, overcoming the spatial limitations of fixed SOPs and realizing spatio-temporal source-load complementarity across feeders. However, these approaches did not consider the pre-installation of fast-access interfaces (FAIs), which in practice constrains application to very short inter-transformer distances (typically less than 100 m) and incurs long connection times.
To systematically illustrate the research gaps and position our contribution within the existing literature, a comprehensive comparison of key approaches is presented in Table 1. The table evaluates existing studies based on several critical dimensions: renewable energy integration, PV consumption promotion, charging peak management strategies, SOP utilization, and mobile SOP implementation.

Table 1.
Comparison of Research Approaches.
As evidenced by the comparison, while numerous studies have explored demand-side management and fixed SOP applications, few have addressed the combined challenges of spatio-temporal peak adaptation and mobile grid asset utilization. This gap is particularly relevant for addressing the concentrated and sudden surge charging peaks that frequently occur during holidays in scenic areas and urban transportation hubs in China, where traditional fixed SOPs face limitations of high construction costs and low utilization.
To overcome these limitations, this paper proposes an MSOP-based method to enhance the hosting capacity of charging stations. The proposed approach distinguishes itself by integrating three key innovations: (1) an automatic peak period identification algorithm that adaptively recognizes the asynchronous timing and varying durations of peak demand across different transformers; (2) the pre-construction of partial fast-access interfaces (FAIs) in candidate transformers; and (3) a semi-rolling horizon strategy that realizes progressive interface deployment and flexible MSOP scheduling. Under the premise of satisfying safety constraints and dispatch feasibility, the proposed method maximizes the power supply capacity of charging stations during peak periods and mitigates transformers’ peak load mismatches. The main contributions of this paper are as follows:
- 1.
- An MSOP-based charging station hosting capacity enhancement model is proposed, which dynamically adapts to the heterogeneity of peak load periods across transformers, while integrating progressive FAI deployment with rolling scheduling;
- 2.
- An automatic peak load period identification algorithm is introduced, enabling the model to adaptively recognize different peak duration characteristics among transformers and optimize MSOP dispatch under feasibility constraints;
- 3.
- Case studies demonstrate that the proposed method significantly enhances the hosting capacity of charging stations during peak load periods. Compared with fixed SOP deployment, it reduces construction costs and exhibits higher flexibility and economic efficiency.
2. Overview of the Proposed Method
The structure of SOPs can be categorized into two types: back-to-back (BTB) and series/parallel configurations [14]. A BTB-type SOP typically consists of two AC–DC converters, through which two distribution systems are interconnected via AC–DC–AC power conversion [26]. Therefore, the design of a BTB-type SOP only needs to consider the voltage level and power requirements, without the need to account for phase angle differences [27]. As illustrated in Figure 1, a classical BTB-type SOP is typically connected between two nodes within the DN through AC–DC–AC converters. This configuration enables bidirectional active and reactive power exchange between nodes, thereby improving the system’s flexibility and voltage regulation capability.

Figure 1.
Typical connection configuration of the back-to-back SOP in a distribution network.
The main distinction between SOP and MSOP lies in mobility and deployment. SOP refers to conventional soft open point units widely used in power systems, providing energy management capabilities. MSOP, on the other hand, combines small-capacity SOP units onto a mobile platform, achieving equivalent functionalities while significantly improving deployment flexibility and operational convenience, allowing rapid response and dynamic support across different nodes in the DN.
To address the spatio-temporal coupling complexity in the coordinated scheduling process of MSOP for DNs, this paper proposes a dual-layer coordinated approach that integrates the FAI pre-construction and the MSOP semi-rolling optimization model. This method aims to enhance the carrying capacity of charging stations during critical periods. The overall structure of the proposed method is illustrated in Figure 2.
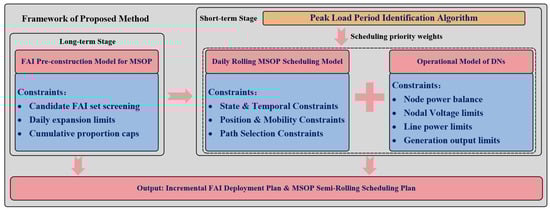
Figure 2.
Framework of the Proposed Method.
Furthermore, a “Peak Load Period Identification Algorithm” is introduced to dynamically detect and annotate peak load periods based on the time series data of transformer loads. The identified results are converted into scheduling priority weights and integrated as input parameters in the optimization model, guiding the MSOP to prioritize deployment and early positioning in high-demand areas.
In the proposed method, the upper-layer model focuses on the long-term planning stage. It establishes a set of candidate accessible edges among transformer nodes and determines the initial pre-construction scheme and subsequent rolling expansion strategy for FAI deployment under budgetary and resource constraints. This layer improves the spatio-temporal accessibility and energy interconnection capability of the distribution network.
The lower-layer model targets the dynamic load fluctuations of charging stations during special periods (e.g., travel peaks during short holidays in China). A semi-rolling optimization scheduling model is developed for the MSOP, which considers the three operational stages—departure, in-transit, and arrival—within each daily optimization window. It jointly incorporates station accessibility, path continuity, and capacity limitations to achieve spatio-temporal coordination and rolling updates of mobile storage resources.
At the modeling level, a multi-layer constraint system is designed:
- The FAI construction constraints include candidate set screening, daily expansion limits, and cumulative proportion caps to ensure the progressive evolution of the network topology;
- The linkage between FAI state variables and access variables constructs dynamic coupling between the physical network and its feasible operational domain;
- The MSOP scheduling model introduces mutually exclusive state and intra-day continuity constraints to maintain a consistent operational logic for the mobile units;
- A penalty function-based rolling window mechanism is adopted to achieve the dynamic relaxation of spatio-temporal constraints and adaptive updating, thus improving computational tractability and online adaptability.
- The electrical operation constraints include nodal power balance and voltage limits, branch power flow constraints, and generation output constraints, ensuring secure and feasible operation within network capacity boundaries.
Overall, the proposed method realizes the integration of spatial structural evolution (FAI expansion) and temporal rolling scheduling (MSOP semi-rolling optimization). It can effectively enhance the carrying capability of charging stations during critical operational periods, improve resource utilization efficiency within the distribution network, and provide a novel approach for intelligent DN scheduling and post-disaster resilience enhancement.
3. Peak Load Period Identification Algorithm
To identify the peak periods of transformers with charging stations, denoted as the set , this section proposes an automated algorithm based on local maxima and peak prominence analysis. The algorithm aims to extract high-load periods from the daily load profiles.
For a given load curve of transformer i on day d, let denote the set of discrete time intervals, and be the predicted load at interval . Key parameters introduced in the peak load period identification include the minimum peak duration , the merging threshold for adjacent peaks , the prominence threshold , and the extension ratio for relative peak values.
The algorithm first identifies local maxima as candidate peaks, then expands each candidate into a continuous peak interval. After merging and filtering, up to three peak intervals are selected for each day. A binary indicator variable is defined, where
This indicator can be directly used in subsequent objective functions to quantify the contribution of peak periods.
The following steps describe the procedure for identifying peak load periods, which is executed daily for each charging station. A binary indicator variable is generated for each identified peak interval (as defined in Equation (1)). The detailed procedure is summarized in Algorithm 1.
- 1.
- Candidate Load Peak Detection: Identify local maxima in and calculate the prominence and peak height for each maximum. Retain only candidates with prominence , forming the candidate peak set .
- 2.
- Peak Interval Expansion: For each candidate peak , extend left and right until the load drops below , yielding a continuous interval . Intervals shorter than are discarded.
- 3.
- Merging and Cleaning: Merge adjacent intervals if the gap between them is less than .
- 4.
- Peak Interval Selection: If the number of remaining intervals exceeds 3, compute the accumulated energy of each interval as follows:and select the top 3 intervals with the highest as the daily peak periods; if there are fewer than 3 intervals, retain all.
- 5.
- Binary Indicator Generation: For the selected intervals , set for the corresponding time slots; all other intervals have .
| Algorithm 1 Peak load period identification algorithm |
| Require: Daily load curve , parameters |
|
4. Charging Station Carrying Capacity Enhancement Model
To maximize the peak load hosting capacity of charging stations within distribution areas, it is necessary to pre-construct a subset of feasible FAIs among candidate feeders and further expand them in subsequent rolling optimization stages. During this process, the following constraints must be satisfied: once constructed, the FAIs cannot be revoked; the number of newly added FAIs per day is limited; and the total number of FAIs cannot exceed a certain multiple of the available MSOP units. These conditions ensure both investment controllability and practical feasibility.
4.1. FAI Pre-Construction Model for MSOP
The FAI pre-construction model for the MSOP is developed based on practical engineering considerations to define the spatial and resource constraints of FAI deployment. This model determines where and when FAI construction can occur and establishes the linkage between the physical network and subsequent MSOP scheduling.
4.1.1. Initial Pre-Construction of FAIs
Let denote the set of transformers, and define the set of candidate FAI pairs as
where represents the engineering distance between transformers u and v, and is the maximum feasible distance for FAI interconnection. This formulation ensures that only technically feasible FAIs are considered, while the condition avoids double counting.
Here we define a binary variable , where indicates that the interface is constructed, and indicates otherwise. To avoid excessive idle FAIs, the total number of pre-constructed FAIs is constrained by
where denotes the set of MSOP units, is the number of MSOPs, and specifies the number of pre-constructed FAIs that can be assigned to each MSOP, thereby ensuring investment efficiency and rational resource utilization.
4.1.2. Rolling Optimization of FAIs and Frozen Constraints
During the rolling optimization stage, incremental construction of FAIs can be performed each day . To model this, an incremental binary variable is introduced, and the actual status of each FAI is determined as
where represents the construction status of FAI on day d. This formulation captures the frozen constraint: once constructed, an FAI cannot be revoked. Specifically, indicates no new FAI is constructed, while denotes the construction of a new FAI.
To control the daily construction workload, the number of newly constructed FAIs per day is constrained by
where denotes the daily upper limit on newly constructed FAIs, preventing excessive daily work.
Meanwhile, the total number of FAIs must not exceed a certain multiple of the total MSOP units
ensuring that the total number of FAIs after rolling expansion remains within a reasonable range.
The construction cost of each FAI is positively correlated with the distance and is defined as
where is the fixed construction cost and is the unit distance cost coefficient.
4.1.3. Transformer Access Capability
A binary variable is defined to indicate whether transformer i has the capability to access an MSOP on day d. This capability is directly related to the construction of FAIs, with the following constraints:
where indicates that at least one FAI connected to transformer i has been constructed on day d, enabling access to an MSOP; indicates that the transformer does not yet have access. These constraints ensure that the FAI construction status and the MSOP access capability of the transformer are logically consistent.
4.2. Daily Rolling MSOP Scheduling Model
This subsection establishes the operational framework for MSOP scheduling over a daily rolling horizon. This model defines the position and state constraints of MSOP units, determines feasible movement and site access, and optimizes route selection under temporal and capacity limitations. It ensures coordinated scheduling and efficient utilization of mobile resources across space and time.
In the daily rolling scheduling of MSOPs, each MSOP is assigned to a transformer with charging station during discrete time intervals of day .
4.2.1. Three-Stage Status Representation
The MSOP’s status is modeled as a three-stage binary variable representing whether its status is before departure, in transit, or after arrival, respectively, as shown in Figure 3. The three stages are mutually exclusive as follows:
ensuring that each MSOP occupies only one state per time interval t.
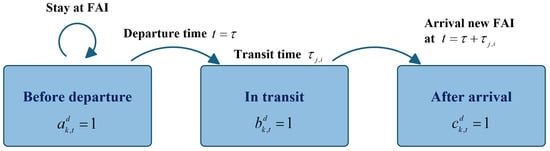
Figure 3.
Illustration of the three-stage status for MSOPs.
4.2.2. MSOP Assignment Constraints
The assignment of MSOP-k to a charging station at time on day is represented by the binary assignment variable , where indicates that MSOP k is scheduled to be at station i during time t on day d. In the MSOP scheduling model, the following constraints must be satisfied to ensure feasible intra-day assignments and movements. Each MSOP can be assigned to at most one station at any given time as follows:
which guarantees that no device occupies multiple stations simultaneously.
An MSOP can only be assigned to a station if that station has access capability
Equation (13) ensures that devices are only scheduled to stations that can host an MSOP.
Furthermore, the assignment variable must be consistent with the intra-day three-stage binary variable (before departure, in transit, or after arrival):
which ensures that a device is only considered to be at a station when it is either in pre-departure or after-arrival status.
4.2.3. Consistency Between Path and Departure Time
To model intra-day movements, we introduce two binary variables: indicates whether MSOP-k departs at time t on day d, and indicates whether it moves from station j to i, where denotes the set of feasible OD pairs in the road network. To ensure logical consistency, the following constraints must hold:
Equations (15) and (16) ensure that each MSOP can select at most one movement path and at most one departure time within a day. Equation (17) strictly binds the path selection to the departure time, requiring that a movement path exists if and only if a departure time is chosen. Finally, Equation (18) further guarantees that when no path is selected, all departure-time variables must remain zero. Together, this set of constraints establishes the logical consistency between migration path selection and departure time determination.
4.2.4. Inter-Day Continuity and Movement Feasibility
To capture daily continuity and movement feasibility, we introduce the binary variables and , denoting the initial and terminal locations of MSOP-k at station i on day d, respectively. The following constraints must be satisfied:
Constraint (19) enforces inter-day continuity, requiring that the terminal location of day d coincides with the initial location of day . Constraints (20) and (21) ensure consistency between initial/terminal daily locations and the MSOP assignment states in the first and last periods. Constraints (22) and (23) restrict movement decisions such that an MSOP can only depart from its initial station and must arrive at its terminal station. In other words, if a movement occurs, it must originate from the current location and simultaneously update the terminal location of the day. Finally, constraints (24) and (25) guarantee that both the departure and arrival stations need to have the necessary access capability. Together, these constraints ensure feasible intra-day scheduling and seamless inter-day operation of MSOPs.
4.2.5. MSOP Transition State Modeling and Sparse Coverage Matrix Linearization
In the MSOP scheduling problem, each MSOP must follow a sequence of mutually exclusive states across time. To accurately capture these state transitions and the time delays induced by travel durations, we introduce sparse coverage matrices that transform nonlinear logical dependencies into linear constraints, thus making the model tractable for MILP solvers.
Specifically, the following sparse matrices are defined:
where denotes the travel time from station j to i, and is the indicator function that equals 1 if the condition is satisfied and 0 otherwise. Intuitively, ensures that once departure occurs at time , the device no longer remains in the pre-departure state thereafter; captures the entire en route interval between departure from j and arrival at i; and specifies the after-arrival state from the moment of reaching the destination. It should be noted that these matrices are not single matrices but a family of sparse matrices indexed by departure time and travel duration , thus encoding all possible temporal transitions.
Based on these definitions, the state transition constraints are formulated as
Constraint (27) states that if the MSOP has not yet departed, it remains in the pre-departure state, and once it departs, it cannot revert to this state in subsequent periods. Constraint (28) ensures that if an MSOP departs from j at time and travels to i, then it remains en route during the interval , during which it is unavailable for supply. Constraint (29) specifies that upon arrival at i, the MSOP switches to the arrival state and remains available for supply in subsequent periods.
In summary, the sparse coverage matrices effectively map the nonlinear logic of departure time, travel duration, and arrival time into linear constraints. Coupled with the departure variables and path variables , this formulation guarantees natural temporal state transitions that respect travel-time requirements, while preserving the linearity of the MILP structure, thereby enabling efficient solution by solvers such as Gurobi.
4.3. Operation Model of Distribution Network (DN)
In this subsection, the operation of a DN is modeled with explicit consideration of MSOP integration. As mobile flow regulators, MSOPs can participate in power supply by adjusting active and reactive power flow at their assignment transformers, which must comply with the operational constraints of DN to ensure security and stability.
4.3.1. Power Balance Constraints
At each transformer and time , the active and reactive power balances [17] are expressed as
where denotes the actual active power supplied at transformer i in the power flow, with representing the minimum guaranteed supply. The terms and represent the adjustments of active and reactive power flows induced by MSOP-k at transformer i. Unlike conventional transformers that only require demand satisfaction, transformers with charging station allow further optimization of supplied power. MSOPs interact with DN at their assignment transformers by reshaping local power flows, and must therefore be explicitly incorporated into the balance equations.
The power flow of each MSOP at its assignment node must respect capacity limits as follows:
Constraints (33) and (34) specify that MSOP-k can only regulate the active and reactive power flows of transformer i when it is assigned at transformer i with the regulation ranges bounded by and . In addition, constraint (35) enforces that the net active power of each MSOP is zero, meaning that MSOP merely redistributes power flows between connected nodes without acting as an independent energy source. This ensures that MSOPs function as flow regulators rather than suppliers.
4.3.2. MSOP-to-DN Mapping
To characterize the correspondence between MSOP locations in the transportation network and nodes in the DN, we map their interactions. Let denote the set of all nodes in the transportation network, and let denote the subset of nodes that are equipped FAIs for MSOP connections. The mapping from transportation nodes to distribution nodes is given by
Equation (36) establishes the mapping of feasible transportation nodes and DN nodes for MSOP connection, while Equation (37) ensures that the flow adjustment of MSOP-k at road node r is equivalently reflected at the corresponding DN node .
4.3.3. Other Operational Constraints
To ensure voltage stability and supply quality, the nodal voltage magnitudes must remain within the permissible range [28]
where is the rated voltage.
Moreover, the voltage drop along each line is modeled by the linearized branch flow equation considering line impedance
where and denote the resistance and reactance of line , respectively. is the set of distribution lines. These constraints guarantee that nodal voltages remain within operational limits while properly reflecting the effect of line impedance.
Line flows are limited by thermal capacities [29]. The active and reactive power flows must satisfy
and the apparent power bound is given by
where is the apparent power capacity of line . These constraints ensure that thermal overloads are avoided and that line utilization remains safe.
The power outputs of distributed generators (DGs) and substations are restricted within their rated capacities and are allowed only when the corresponding nodes are in service as follows:
where is the set of nodes with distributed generation or substations, and are the lower and upper bounds of active power output, and and are the bounds of reactive power output at node i. These constraints guarantee secure and feasible operation of DGs and substations within their technical limits.
To provide a clear and systematic overview of the proposed model, a comprehensive summary of all optimization constraints is presented in Table 2. This table categorizes the constraints into three main groups: FAI pre-construction and expansion (e.g., Section 4.1), MSOP scheduling and mobility (e.g., Section 4.2), and distribution network operation (e.g., Section 4.3).
Table 2.
Summary of optimization model constraints.
This integrated model, though relatively complex, is implemented as a mixed-integer linear programming (MILP) problem. It allows accurate representation of MSOP locations and operating states, captures spatial-temporal coupling between the DN and RN, and coordinates investment and operational decisions within one unified framework. These features together improve the energy supply capability and load carrying performance of charging stations, supporting more efficient system operation.
5. Objective Function
The objective of the proposed model is to strike a balance between infrastructure investment and operational load hosting performance under economic constraints, thereby maximizing the charging supply capability during peak intervals within a rolling framework. In other words, the model aims to keep expansion costs manageable while dispatching MSOPs to satisfy charging demand during peak periods.
5.1. Peak Load Hosting Factor
To evaluate the system’s aggregate ability to accommodate peak demand during identified peak intervals, we define the peak load hosting factor of transformer i on day d in an interval-aggregated form. Specifically, a binary indicator given by the peak detection algorithm is introduced, and the supply–demand balance during the peak interval is constrained as
where denotes the actual supplied load at node i and time t, is the forecasted demand. The left-hand side aggregates the actual supply within the detected peak interval, while the right-hand side represents times the total forecasted demand. The constraint requires that the aggregate supply over the peak interval must be no less than times the forecasted demand.
For compact notation and objective formulation, we define the cumulative forecasted energy during the peak interval as
and the cumulative supplied energy during the peak interval as
thus, Equation (45) can be equivalently written as
5.2. Overload Penalty
For charging stations, when the actual supply exceeds their original hosting capacity, an overload penalty is introduced to suppress overload conditions and ensure secure and stable operation. The overload penalty of transformer with charging station i on day d is defined as
where is the original hosting capacity of station i. This penalty term is incorporated into the objective function to discourage overloading during peak intervals.
5.3. Objective Function
To simultaneously account for the daily rolling investment cost of new FAIs and the system’s peak load hosting capability, the objective function is extended from a single-factor maximization of to a weighted trade-off between hosting capacity and investment cost. Specifically, for each rolling day d, the objective function comprises two components: (i) the peak load hosting factor benefit, calculated as the weighted sum of all charging stations hosting factors during the peak intervals, minus any overload penalties; and (ii) the construction cost associated with newly added FAIs on that day. The overall objective can be formally expressed as follows:
where denotes the importance weight of transformer i on day d, is the overload penalty coefficient, is the weighting factor mapping monetary cost into the same dimension as hosting benefit, is the binary decision for adding a new interface on candidate edge on day d, and denotes the unit construction cost of interface .
The objective function balances daily peak hosting capacity and investment cost by maximizing the weighted sum of peak load hosting factors, minus overload penalties, while accounting for the construction cost of newly added FAIs.
6. Case Study
This section aims to demonstrate the effectiveness of the proposed MSOP-based method for enhancing EV charging station hosting capacity. We first introduce the topology of the test system and the scenario settings, then analyze the characteristics of load peaks and the original hosting capacity. Subsequently, the performance of the proposed method is compared under different schemes, and the experimental results are summarized. The underlying model is formulated as a mixed-integer optimization problem and solved using the Gurobi solver. All experiments are conducted on a computer equipped with an Intel i5-12500H CPU and 16 GB of RAM.
6.1. Test System and Basic Settings
To more clearly illustrate the comparative performance of the proposed method, the test DN topology used in this paper is consistent with that in [17], representing a four-feeder distribution system in China. The system consists of 73 nodes, as shown in Figure 4. The red dashed lines indicate pre-installed MSOP FAIs, and six charging stations are deployed in the system. The transportation network adopts the classical Sioux Falls network [30], as shown in Figure 5, where some nodes geographically correspond to the locations of pre-installed MSOP FAIs in the DN. Each node represents a potential or existing interface where mobile storage units can access the distribution network, and the edges denote the feasible travel paths for MSOP operations. The mapping between the fast-access interfaces (FAIs) in the distribution network and the corresponding nodes in the transportation network is summarized in Table 3. Each entry indicates which two distribution transformers the FAI connects and which traffic system node is used to represent the FAI’s location in the road network.
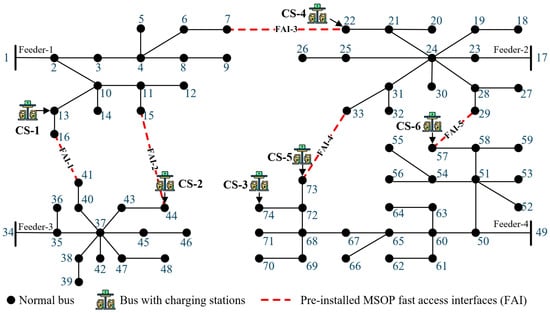
Figure 4.
Illustration of the test distribution network topology.
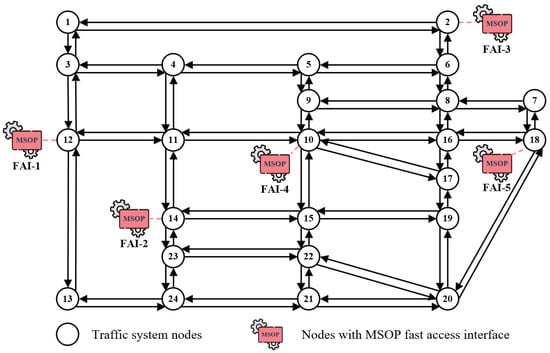
Figure 5.
Illustration of the transportation network topology.
Table 3.
Mapping FAIs, distribution network connections, and road network nodes.
It should be noted that charging stations CS-3 and CS-5 are located on the same feeder, with relatively close geographical positions. Therefore, in this study, only a pre-installed MSOP FAI is built at DN-73, while the scheduling process can still accommodate part of the charging demand at CS-3, enabling cross-station load support. The number of available MSOPs is set as .
6.2. Peak Load Characteristics
In this study, a rolling optimization strategy with daily resolution is adopted, where the day is divided into intervals (i.e., a 15 min sampling interval), and the rolling horizon spans days. First, the peak load periods of the predicted charging demand during holidays are identified. The identification results for each day are shown in Figure 6, and the cumulative predicted energy demand during peak periods for each charging station is listed in Table 4.
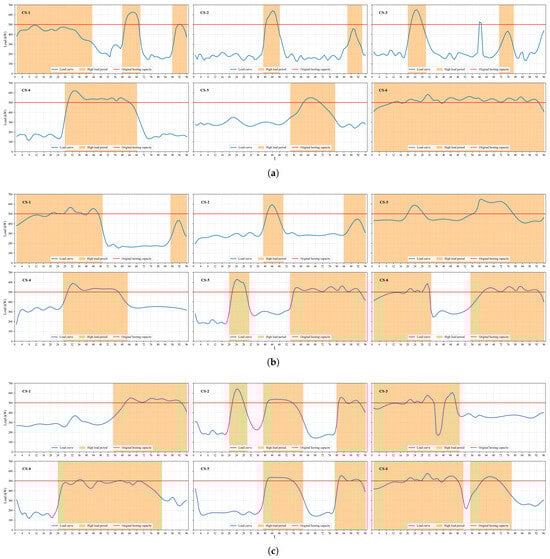
Figure 6.
Detected peak load periods of each charging station for three rolling days. (a) Day 1; (b) Day 2; (c) Day 3.
Table 4.
Cumulative predicted energy demand during peak periods for each charging station.
Taking Charging Station 3 (CS-3) as an example, a short load peak occurs around on the first day; however, due to its short duration, it is not identified by the peak load period identification algorithm as a valid continuous peak period. Moreover, during t = 36–40 on the third day, a load valley is observed, but since it is closely surrounded by two adjacent peak periods, the algorithm still classifies this segment as part of the peak period, reflecting the comprehensive consideration of temporal continuity and dynamic load variations in the identification process.
As shown in the Figure 6, the peak load characteristics vary significantly across different charging stations. While some peak periods overlap, others are misaligned, and the corresponding peak values also differ. Further observations indicate that, without flexible interconnection, certain charging stations may experience sudden load surges during specific periods, exceeding their original hosting capacities. Such load surges may lead to operating conditions beyond the safe limits, thereby jeopardizing system security and stability. Hence, coordinated scheduling of MSOP is necessary to effectively mitigate potential peak load risks and ensure reliable system operation.
6.3. Rolling Scheduling Scheme of MSOP
On the first day (Day 1), the charging stations with longer peak periods are mainly CS-1, 4, and 6. The MSOP-1 is first scheduled to road network node RN-2, where it connects to FAI-3 to provide additional hosting capacity for CS-4. Although CS-1 exhibits a long peak period that results in higher cumulative forecasted load , its demand remains within the initial hosting capacity for most of the time, implying a relatively low security risk. In contrast, CS-4 experiences prolonged overload beyond its initial hosting capacity, which may cause significant operational risks. Therefore, considering the overload penalty, the MSOP-1 is preferentially dispatched to support CS-4.
Meanwhile, CS-6 remains peak load periods almost throughout the day. Hence, another MSOP-2 is dispatched in advance to network node RN-18, connecting to FAI-5 to enhance its hosting capacity. Under this scheduling plan, the two MSOPs effectively interconnect three feeders, thereby fully exploiting the distribution network’s supply capability. Specifically, on the first day, the two MSOPs depart from the warehouse node RN-1 and are routed to RN-2 (corresponding to FAI-3) and RN-18 (corresponding to FAI-5), respectively.
On the second day, based on the load curves and the cumulative forecasted energy demand during peak intervals for each charging station (see Table 4), it can be observed that the load variations at CS-1, -2, -4, and -6 are relatively minor, while CS-5 experiences a slight increase. In contrast, the overall charging demand at CS-3 rises significantly, leading to a sustained peak period that persists throughout the day. Under these conditions, the original MSOP deployment is no longer sufficient to maintain the high supply level required by Station 3. The optimal solution is to establish a new FAI-6 between distribution network node DN-44 and DN-74, and to reschedule the MSOP-1 originally located at RN-2 (connected to FAI-3) to RN-22 (corresponding to the newly constructed FAI-6) in order to support CS-3, as illustrated in Figure 7. It shows the FAI actively deployed on Day 2. Red solid lines represent the FAI connections that are in used, highlighting which interfaces are available for power flow.
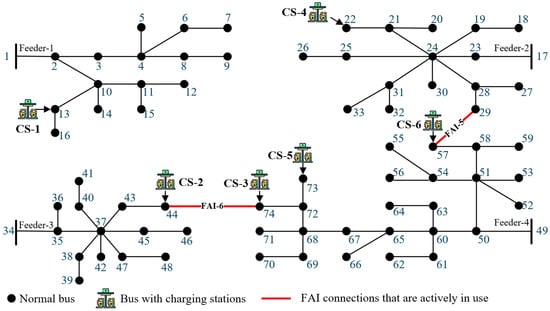
Figure 7.
Illustration of FAI utilization in the distribution network on Day 2.
Meanwhile, MSOP-1 can also provide partial support to CS-5 through the existing distribution lines, with its dispatch route shown in blue in Figure 8. Through the coordinated operation of the two MSOPs, the system’s total hosting capacity increases from the initial 3000 kW to 4588.1 kW, with the most significant improvements observed at CS-3 and -6. Since CS-5 is connected to Feeder-4, which is coupled with Feeder-2 via FAI-5 and with Feeder-3 via FAI-6, the reallocation of active power flows among feeders also leads to a moderate capacity increase for CS-5. However, this improvement is limited by the transformer and line capacity constraints, making the overall enhancement relatively modest compared to that of CS-3 and -6.
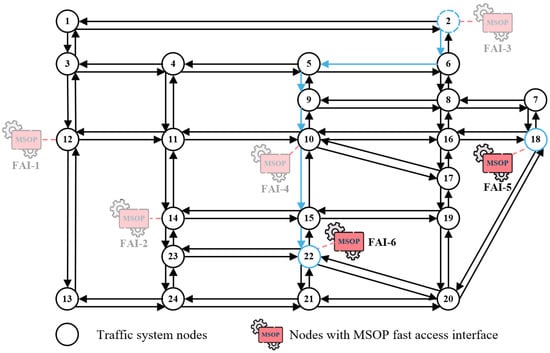
Figure 8.
Dispatch route of MSOPs in the road network on Day 2.
On the third day, the load at CS-1 decreases during the first half of the day and is no longer classified as a peak load period, but rises again in the second half, re-entering the peak period. Meanwhile, the peak load at CS-6 declines slightly in the later half of the day. Consequently, the MSOP-2 initially assigned at RN-18 is rescheduled at to RN-12, where it connects to FAI-1 to support CS-1. Its travel path is RN: 18-16-10-11-12, requiring to reach RN-12 and completing the FAI-1 connection at . The MSOP-1 remains at its previous location from Day 2. Although CS-4 consistently shows relatively high cumulative peak energy demand across the three days, its load rarely exceeds its hosting capacity, meaning that minor active power adjustments at FAI-5 are sufficient to meet its needs. Driven by the penalty terms in the objective function, the MSOPs are always prioritized to support those stations with severe overloads that may pose risks to secure and stable operation. The comparative hosting capacities of the stations over the three days are shown in Figure 9, while the three-day rolling scheduling plan of MSOPs is depicted in Figure 10.
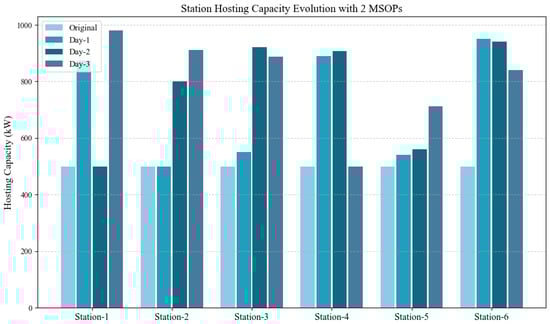
Figure 9.
Comparison of average hosting capacities during the rolling horizon.
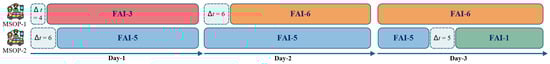
Figure 10.
Scheduling plan of two MSOPs during the rolling horizon.
6.4. Comparison of Different Methods
To verify the advantages of the proposed method, it is compared with the fixed SOP construction approach presented in [17]. The comparison is conducted using three days of load data, where the daily weighting coefficients are adopted as probabilities to construct the input scenarios. Regarding cost assumptions, one MSOP device equipped with three FAIs is considered equivalent in investment to one fixed SOP, serving as a unified benchmark for comparison.
The method in [17] essentially assumes that all charging stations operate under peak load conditions throughout the entire time horizon. Consequently, to enhance the overall hosting capacity, fixed SOPs need to be constructed at FAI-1, FAI-5, and FAI-6. After construction, the total hosting capacity of all charging stations reaches approximately 4479.2 kW. In contrast, under the proposed MSOP-based approach, the total hosting capacity increases to 4588.1 kW. As summarized in Table 5, the results clearly demonstrate that the proposed method, by identifying peak load periods and dispatching MSOPs effectively, not only achieves a higher hosting capacity but also exhibits superior economic performance compared to the conventional fixed SOP planning.
Table 5.
Comparison of construction schemes and hosting capacity between the two methods.
To comprehensively evaluate the performance of the proposed MSOP-based approach, this subsection presents a consolidated analysis of key technical and economic indicators. These metrics are summarized in Table 6.
Table 6.
Summary of key technical and economic indicators.
From a technical perspective, the proposed MSOP-based approach demonstrates significant effectiveness in enhancing system hosting capacity. The optimized total hosting capacity reaches 4588.1 kW, representing an absolute capacity gain of 1588.1 kW and a relative improvement of 52.9% compared to the baseline of 3000 kW. This substantial improvement is achieved through efficient resource utilization, with both MSOP units being actively dispatched daily (as shown in Figure 10) and different FAIs being dynamically activated based on daily operational needs.
Economically, the proposed framework exhibits clear advantages over conventional approaches. While the benchmark method using fixed SOPs [17] requires an investment equivalent to three SOPs to achieve a total capacity of 4479.2 kW, our proposed method achieves a higher capacity of 4588.1 kW with only an equivalent investment of two fixed SOPs. This represents a 33.3% reduction in equivalent SOP units while simultaneously delivering superior performance. The combination of higher capacity achievement and lower capital investment underscores the economic viability and efficiency of the mobile, coordination-based approach proposed in this work.
6.5. Parametric Analysis
To guide practical investment decisions, a parametric analysis was conducted to evaluate the impact of the MSOP fleet size on the system hosting capacity. The analysis reveals a clear law of diminishing returns. The first MSOP unit brings the most substantial benefit, increasing the hosting capacity by 920.5 kW, a remarkable 30.7% improvement over the base case. The second unit remains highly effective, adding 667.6 kW (a 17.0% gain), resulting in the configuration presented in the main case study.
However, the marginal gain drops significantly for the third and fourth units, providing only 8.9% and 3.0% improvements, respectively. This trend is visualized in Figure 11, which plots the marginal improvement percentage against the number of MSOPs.
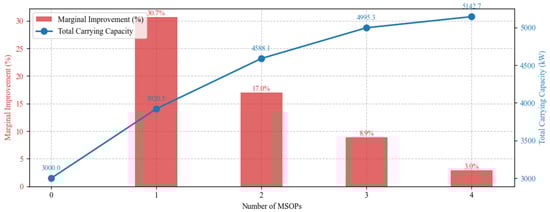
Figure 11.
Comparison of marginal improvement for different MSOP deployment scales.
Therefore, from a cost-effectiveness perspective, deploying two MSOP units represents the optimal trade-off, achieving a high total capacity while maintaining excellent resource utilization efficiency. Investing in a third unit yields less than half the relative improvement of the second unit, suggesting that capital might be better allocated elsewhere beyond this point.
7. Conclusions
This paper focuses on the challenges faced by distribution networks under holiday surges in EV charging demand, and develops an MSOP-based hosting capacity enhancement method from the viewpoint of power supply companies. Different to fixed SOP deployment, the proposed approach integrates the flexible scheduling capability of MSOPs with fast-access interface expansion and rolling optimization. By introducing overload penalty terms, interface-freezing constraints, and single-day dispatch limits, the method achieves capacity enhancement while avoiding persistent overload and idle resource issues.
Case studies based on a four-feeder distribution network coupled with the Sioux Falls transportation system are conducted from three perspectives: peak load identification, rolling dispatch processes, and methods comparisons. The results demonstrate that the proposed method can effectively detect load peaks, schedule MSOPs accordingly, and significantly enhance network capacity during peak periods. Compared with fixed SOP deployment, the proposed scheme achieves superior hosting capacity, as well as higher economic efficiency and operational flexibility.
Although the present model is developed under deterministic assumptions, temporal variability of load and charging demand is represented through typical daily profiles. This allows the model to capture the expected operating fluctuations while maintaining computational tractability. Future work will extend the framework to a scenario-based formulation to explicitly address uncertainties in user demand and MSOP mobility. In addition, the topologies and parameters of both the DN and RN can be flexibly adapted to different regions, ensuring the general applicability of the proposed framework.
In conclusion, the MSOP-based approach provides a feasible solution to the challenges of large-scale EV charging integration. Future research will focus on its application to larger-scale systems and the coordinated optimization with other flexible resources, particularly the synergy with coordinated Vehicle-to-Grid (V2G) systems like [31], to further improve its applicability and scalability in complex power systems.
Author Contributions
Conceptualization, C.Z. and Q.D.; methodology, C.Z. and Q.Y.; writing-original draft, C.Z.; writing-review and editing, Q.D. and Z.C.; supervision, Q.D.; resources, J.P., G.G. and D.L.; data curation and visualization, Q.Y. All authors have read and agreed to the published version of the manuscript.
Funding
The study was funded by the Science and Technology Project of China Southern Power Grid Co., Ltd. (Project No. GDKJXM20231336).
Data Availability Statement
The original contributions presented in this study are included in the article. Further inquiries can be directed to the corresponding author.
Acknowledgments
The authors would like to express their sincere gratitude to Wencong Xiao and Yushen Gong from South China University of Technology for providing part of the test data and offering guidance on model design.
Conflicts of Interest
The authors declare no conflicts of interest. All authors, except for the corresponding author Qi Ye, are employees of Foshan Power Supply Bureau of Guangdong Power Grid Co., Ltd. The funders had no role in the development of the study or in the decision to publish the results.
Abbreviations
The following abbreviations are used in this manuscript:
| EV | Electric Vehicle |
| DN | Distribution Network |
| SOP | Soft Open Point |
| MSOP | Mobile Soft Open Point |
| FAI | Fast-Access Interface |
| CS | Charging Station |
References
- Huang, X.; Wu, D.; Boulet, B. Metaprobformer for charging load probabilistic forecasting of electric vehicle charging stations. IEEE Trans. Intell. Transp. Syst. 2023, 24, 10445–10455. [Google Scholar] [CrossRef]
- Rahman, S.; Khan, I.A.; Khan, A.A.; Mallik, A.; Nadeem, M.F. Comprehensive review & impact analysis of integrating projected electric vehicle charging load to the existing low voltage distribution system. Renew. Sustain. Energy Rev. 2022, 153, 111756. [Google Scholar] [CrossRef]
- Liu, J.; Wang, H.; Du, Y.; Lu, Y.; Wang, Z. Multi-objective optimal peak load shaving strategy using coordinated scheduling of EVs and BESS with adoption of MORBHPSO. J. Energy Storage 2023, 64, 107121. [Google Scholar] [CrossRef]
- Yang, X.; Niu, D.; Sun, L.; Ji, Z.; Zhou, J.; Wang, K.; Siqin, Z. A bi-level optimization model for electric vehicle charging strategy based on regional grid load following. J. Clean. Prod. 2021, 325, 129313. [Google Scholar] [CrossRef]
- Kamana-Williams, B.; Bishop, D.; Hooper, G.; Chase, J. Driving change: Electric vehicle charging behavior and peak loading. Renew. Sustain. Energy Rev. 2024, 189, 113953. [Google Scholar] [CrossRef]
- Chen, X.; Wang, H.; Wu, F.; Wu, Y.; Gonzalez, M.C.; Zhang, J. Multimicrogrid load balancing through EV charging networks. IEEE Internet Things J. 2021, 9, 5019–5026. [Google Scholar] [CrossRef]
- Nimalsiri, N.I.; Ratnam, E.L.; Smith, D.B.; Mediwaththe, C.P.; Halgamuge, S.K. Coordinated charge and discharge scheduling of electric vehicles for load curve shaping. IEEE Trans. Intell. Transp. Syst. 2021, 23, 7653–7665. [Google Scholar] [CrossRef]
- Jones, C.B.; Lave, M.; Vining, W.; Garcia, B.M. Uncontrolled electric vehicle charging impacts on distribution electric power systems with primarily residential, commercial or industrial loads. Energies 2021, 14, 1688. [Google Scholar] [CrossRef]
- Miyawaki, K.; Farzaneh, H. Optimal operation planning of V2G (Vehicle-to-Grid)-equipped microgrid in urban areas in Japan. Energy 2022. [Google Scholar]
- Amir, M.; Zaheeruddin; Haque, A.; Bakhsh, F.I.; Kurukuru, V.B.; Sedighizadeh, M. Intelligent energy management scheme-based coordinated control for reducing peak load in grid-connected photovoltaic-powered electric vehicle charging stations. IET Gener. Transm. Distrib. 2024, 18, 1205–1222. [Google Scholar] [CrossRef]
- Fachrizal, R.; Ramadhani, U.H.; Munkhammar, J.; Widén, J. Combined PV–EV hosting capacity assessment for a residential LV distribution grid with smart EV charging and PV curtailment. Sustain. Energy Grids Netw. 2021, 26, 100445. [Google Scholar] [CrossRef]
- Zheng, X.q.; Yao, Y.p. Multi-objective capacity allocation optimization method of photovoltaic EV charging station considering V2G. J. Cent. South Univ. 2021, 28, 481–493. [Google Scholar] [CrossRef]
- Bollerslev, J.; Andersen, P.B.; Jensen, T.V.; Marinelli, M.; Thingvad, A.; Calearo, L.; Weckesser, T. Coincidence factors for domestic EV charging from driving and plug-in behavior. IEEE Trans. Transp. Electrif. 2021, 8, 808–819. [Google Scholar] [CrossRef]
- Jiang, X.; Zhou, Y.; Ming, W.; Yang, P.; Wu, J. An overview of soft open points in electricity distribution networks. IEEE Trans. Smart Grid 2022, 13, 1899–1910. [Google Scholar] [CrossRef]
- Ding, T.; Wang, Z.; Jia, W.; Chen, B.; Chen, C.; Shahidehpour, M. Multiperiod distribution system restoration with routing repair crews, mobile electric vehicles, and soft-open-point networked microgrids. IEEE Trans. Smart Grid 2020, 11, 4795–4808. [Google Scholar] [CrossRef]
- Zhang, S.; Fang, Y.; Zhang, H.; Cheng, H.; Wang, X. Maximum hosting capacity of photovoltaic generation in SOP-based power distribution network integrated with electric vehicles. IEEE Trans. Ind. Inform. 2022, 18, 8213–8224. [Google Scholar] [CrossRef]
- Fu, Y.; Gong, Y.; Shi, C.; Zheng, C.; You, G.; Xiao, W. Optimizing EV Charging Station Carrying Capacity Considering Coordinated Multi-Flexibility Resources. World Electr. Veh. J. 2025, 16, 381. [Google Scholar] [CrossRef]
- Zhao, J.; Qu, J.; Ji, H.; Xu, J.; Hasanien, H.M.; Turky, R.A.; Li, P. Robust operation of flexible distribution network with large-scale EV charging loads. IEEE Trans. Transp. Electrif. 2023, 10, 2207–2219. [Google Scholar] [CrossRef]
- Wang, J.; Zhou, N.; Wang, Q.; Liu, H. Hierarchically coordinated optimization of power distribution systems with soft open points and electric vehicles. Int. J. Electr. Power Energy Syst. 2023, 149, 109040. [Google Scholar] [CrossRef]
- Kang, Y.; Lu, G.; Chen, M.; Li, X.; Li, S. Collaborative Optimization of Direct Current Distribution Network Based on Scaled Electric Vehicles Charging and Discharging and Soft Open Points Topology Reconfiguration. Energies 2025, 18, 373. [Google Scholar] [CrossRef]
- Li, S.; Li, Z.; Shahidehpour, M.; Huang, W.; Zheng, J. Dispatchable region for distributed renewable energy generation in reconfigurable AC–DC distribution networks with soft open points. Appl. Energy 2024, 371, 123704. [Google Scholar] [CrossRef]
- Zhang, T.; Mu, Y.; Dong, L.; Jia, H.; Pu, T.; Wang, X. Fully parallel decentralized load restoration in coupled transmission and distribution system with soft open points. Appl. Energy 2023, 349, 121626. [Google Scholar] [CrossRef]
- Khamphakdi, P.; Nitta, M.; Hagiwara, M.; Akagi, H. Zero-voltage ride-through capability of a transformerless back-to-back system using modular multilevel cascade converters for power distribution systems. IEEE Trans. Power Electron. 2015, 31, 2730–2741. [Google Scholar] [CrossRef]
- Ning, X.; Zhu, T.; Kang, T.; Zhu, J.; Liu, K.; Sun, L.; You, J.; Wang, X.; Guo, Q. Emergency Power Supply Management Strategy for Low-Performance Distribution Networks Based on Mobile Multi-Port Interconnection Equipment. Energies 2024, 17, 5926. [Google Scholar] [CrossRef]
- Chen, X.; Zhang, L.; Zhou, Y.; Ji, Y.; Zhang, B.; Tang, W. Using Mobile soft open points to enhance power balance capability between LVDNs through mobility multi-stage optimization. Appl. Energy 2025, 397, 126381. [Google Scholar] [CrossRef]
- Fuad, K.S.; Hafezi, H.; Kauhaniemi, K.; Laaksonen, H. Soft open point in distribution networks. IEEE Access 2020, 8, 210550–210565. [Google Scholar] [CrossRef]
- Chen, R.; Lai, Z.; Feng, Q.; Bao, W.; Huang, H.; Yi, H. Topology Selection and Operation Strategy Design of the Soft Open Point in Looped Distribution Networks. In Proceedings of the 2024 9th Asia Conference on Power and Electrical Engineering (ACPEE), Shanghai, China, 11–13 April 2024; pp. 115–120. [Google Scholar] [CrossRef]
- Wang, Z.; Yu, T.; Fan, P.; Pan, Z.; Chen, W. Optimal Smart Switch Deployment With Tri-Layer Synergized Resilience Enhancement Considering Multiple Heterogeneous Faults. IEEE Trans. Smart Grid 2025, 16, 3601–3614. [Google Scholar] [CrossRef]
- Liu, J.; Qin, C.; Yu, Y. Enhancing Distribution System Resilience With Proactive Islanding and RCS-Based Fast Fault Isolation and Service Restoration. IEEE Trans. Smart Grid 2020, 11, 2381–2395. [Google Scholar] [CrossRef]
- Stabler, B. Sioux Falls Transportation Network. Available online: https://github.com/bstabler/TransportationNetworks/tree/master/SiouxFalls (accessed on 8 August 2025).
- Fotopoulou, M.; Rakopoulos, D.; Blanas, O. Day Ahead Optimal Dispatch Schedule in a Smart Grid Containing Distributed Energy Resources and Electric Vehicles. Sensors 2021, 21, 7295. [Google Scholar] [CrossRef] [PubMed]
Disclaimer/Publisher’s Note: The statements, opinions and data contained in all publications are solely those of the individual author(s) and contributor(s) and not of MDPI and/or the editor(s). MDPI and/or the editor(s) disclaim responsibility for any injury to people or property resulting from any ideas, methods, instructions or products referred to in the content. |
© 2025 by the authors. Licensee MDPI, Basel, Switzerland. This article is an open access article distributed under the terms and conditions of the Creative Commons Attribution (CC BY) license (https://creativecommons.org/licenses/by/4.0/).