You are currently viewing a new version of our website. To view the old version click .
Energies
  • Article
  • Open Access

28 October 2025

Scalable Hybrid Arrays Overcome Electrode Scaling Limitations in Micro-Photosynthetic Power Cells

and
1
Department of Biomedical Engineering, University of Calgary, Calgary, AB T2N 1N4, Canada
2
Optical-Bio Microsystems Lab, Department of Mechanical, Industrial and Aerospace Engineering, Concordia University, Montreal, QC H3G 1M8, Canada
*
Authors to whom correspondence should be addressed.
Energies2025, 18(21), 5644;https://doi.org/10.3390/en18215644 
(registering DOI)
This article belongs to the Special Issue Advances in Optimized Energy Harvesting Systems and Technology

Abstract

Micro-photosynthetic power cells (μPSCs), also known as biophotovoltaics (BPVs), represent sustainable and self-regenerating solutions for harvesting electricity from photosynthetic microorganisms. However, their practical deployment has been constrained by low voltage, low current output, and scaling inefficiencies. In this work, we address these limitations through a dual-optimization strategy: (i) systematic quantification of how electrode surface area influences key performance metrics, and (ii) based on our previous work we highlighted the novel hybrid modular array architectures that combine series and parallel connections of μPSCs. Three single μPSCs with electrode areas of 4.84, 19.36, and 100 cm2 were fabricated and compared, revealing that while open-circuit voltage remains largely area-independent (850–910 mV), both short-circuit current and maximum power scale with electrode size. Building on these insights, two hybrid array configurations fabricated from six 4.84 cm2 μPSCs achieved power outputs of 869.2 μW and 926.4 μW, equivalent to ~82–87% of the output of a large 100 cm2 device, while requiring only ~29% electrode area and ~70% less reagent volume. Importantly, these arrays delivered voltages up to 2.4 V, significantly higher than a single large device, enabling easier integration with IoT platforms and ultra-low-power electronics. A meta-analysis of over 40 reported BPV/μPSC systems with different electrode surface areas further validated our findings, showing a consistent inverse relationship between electrode area and power density. Collectively, this study introduces a scalable, resource-efficient strategy for enhancing μPSC performance, providing a novel design paradigm that advances the state of the art in sustainable bioenergy and opens pathways for practical deployment in distributed, low-power and IoT applications.

1. Introduction

Micro-photosynthetic power cell (μPSC), also known as biophotovoltaic (BPV), represents a promising new frontier in sustainable energy harvesting technologies, leveraging living photosynthetic microorganisms such as cyanobacteria and algae to directly convert solar energy into electricity [,,,,]. Unlike traditional photovoltaic (PV) systems based on inorganic semiconductors, μPSC utilize biological components, enabling unique advantages including self-assembly, self-regeneration, and intrinsic metabolic energy storage capabilities [,]. Photosynthetic microorganisms naturally replenish their photosynthetic machinery, maintaining operational functionality over extended periods through continual regeneration of damaged proteins and pigments []. Moreover, μPSC systems utilize abundant, renewable resources like sunlight, water, and atmospheric carbon dioxide eliminating the need for external chemical substrates required by alternative microbial technologies such as microbial fuel cells (MFCs) [,]. These characteristics position μPSC as compelling power sources for low power, distributed electronic applications, including environmental monitoring sensors, low power biological and chemical sensors, IoT electronics, and remote sensing devices [,].
Despite their considerable advantages, BPVs currently exhibit significant limitations in electrical performance. Typical open-circuit voltages (Voc) achieved by BPV systems range from approximately 0.5 to 0.9 V and largely depends on the inherent electrochemical potential difference between photosynthetic water oxidation at the anode and oxygen reduction (depending on the catholyte) at the cathode. The theoretically achievable maximum Voc is around 1.8 V, constrained by practical inefficiencies such as internal resistance, energy losses due to charge recombination, and imperfect extracellular electron transfer (EET). Moreover, the photocurrent densities commonly reported remain low (microampere to sub-milliampere per cm2), primarily due to inefficient electron harvesting and limited biological electron export pathways []. This results in maximum power densities typically falling within the micro- to milliwatt-per-square-meter range, markedly below those achievable with conventional photovoltaic cells (100–200 W/m2 at ~20% efficiency) or even microbial fuel cells (up to several watts per square meter), though the latter require continual external feeding and maintenance [,] and also the photovoltaic systems cause environmental damage while mining the raw materials for the fabrication.
Several biological and engineering challenges contribute to this gap in performance. At the cellular level, only a small fraction of electrons produced via photosynthesis are accessible for external harvesting, as most electrons are channeled toward intracellular metabolic processes [,]. Thus, the fractions of electrons that are available for harvesting are not known yet. Additionally, the limited extracellular electron transfer efficiency between photosynthetic cells and electrode interfaces represents a critical bottleneck []. At the device level, practical constraints such as inefficient electrode architectures [], mass transport limitations [], biofilm shading effects [], resistive losses [], and poor long-term operational stability further suppress achievable power densities and efficiencies [,]. Therefore, addressing these limitations through systematic electrode optimization, improved microbial–electrode interfacing, and enhanced charge collection techniques is imperative.
Furthermore, most existing μPSC and BPV systems exhibit limited electrical performance due to low open-circuit voltage, low current density, and low power output, primarily constrained by intrinsic electrochemical inefficiencies such as poor extracellular electron transfer, high internal resistance, and mass transport limitations. Although array strategies have been explored to enhance power output, the combined effects of electrode surface area and array configuration have received limited attention. To overcome these limitations, array integration enables voltage and current scaling, enhances overall power density, and improves operational stability, making it essential for driving low-power electronics and facilitating practical applications. This shift from single-cell to array-based architecture marks a critical step toward the real-world deployment of µPSC or BPV technology. Addressing this gap, the present work provides new insights and demonstrates that optimized array strategies offer a practical and efficient pathway for real-world applications. Merely increasing electrode surface area often leads to reduced power density, inefficient reagent usage, and impractical scaling. Similarly, traditional series or parallel array configurations tend to offer limited voltage enhancement or require large physical footprints, restricting their integration into compact systems. This work tackles these challenges through a dual-optimization approach: (1) a systematic investigation of electrode surface area effects (4.84, 19.36 and 100 cm2), and (2) the development of innovative hybrid array configurations that combine series and parallel connections of miniaturized μPSC units. The proposed modular arrays deliver power outputs exceeding 85% of a 100 cm2 μPSC while utilizing only ~29% of the area and ~70% less reagent, and they achieve voltages up to 2.4 V suitable for powering ultra-low power, IoT devices and also low-power electronic devices. In this study, three μPSC configurations were fabricated and comprehensively characterized through measurements of Voc, Isc, load voltage (VL), load current (IL), and detailed polarization analysis under realistic operating conditions. Additionally, a meta-analysis was conducted using data from over 40 reported BPV and μPSC systems to quantitatively assess the relationship between electrode area and power density. The analysis revealed a consistent inverse trend: smaller-scale devices generally exhibit higher power densities due to improved reaction kinetics, lower resistive losses, shorter electron diffusion paths, and more effective bio-electrode coupling [,,]. These findings provide a foundation for advancing BPVs towards practical, real-world applications particularly in scenarios requiring low-power, continuous energy generation offering a sustainable, self-sufficient alternative to conventional photovoltaic cells, batteries, and fuel cells. However, there is a long way to go to achieve this milestone.
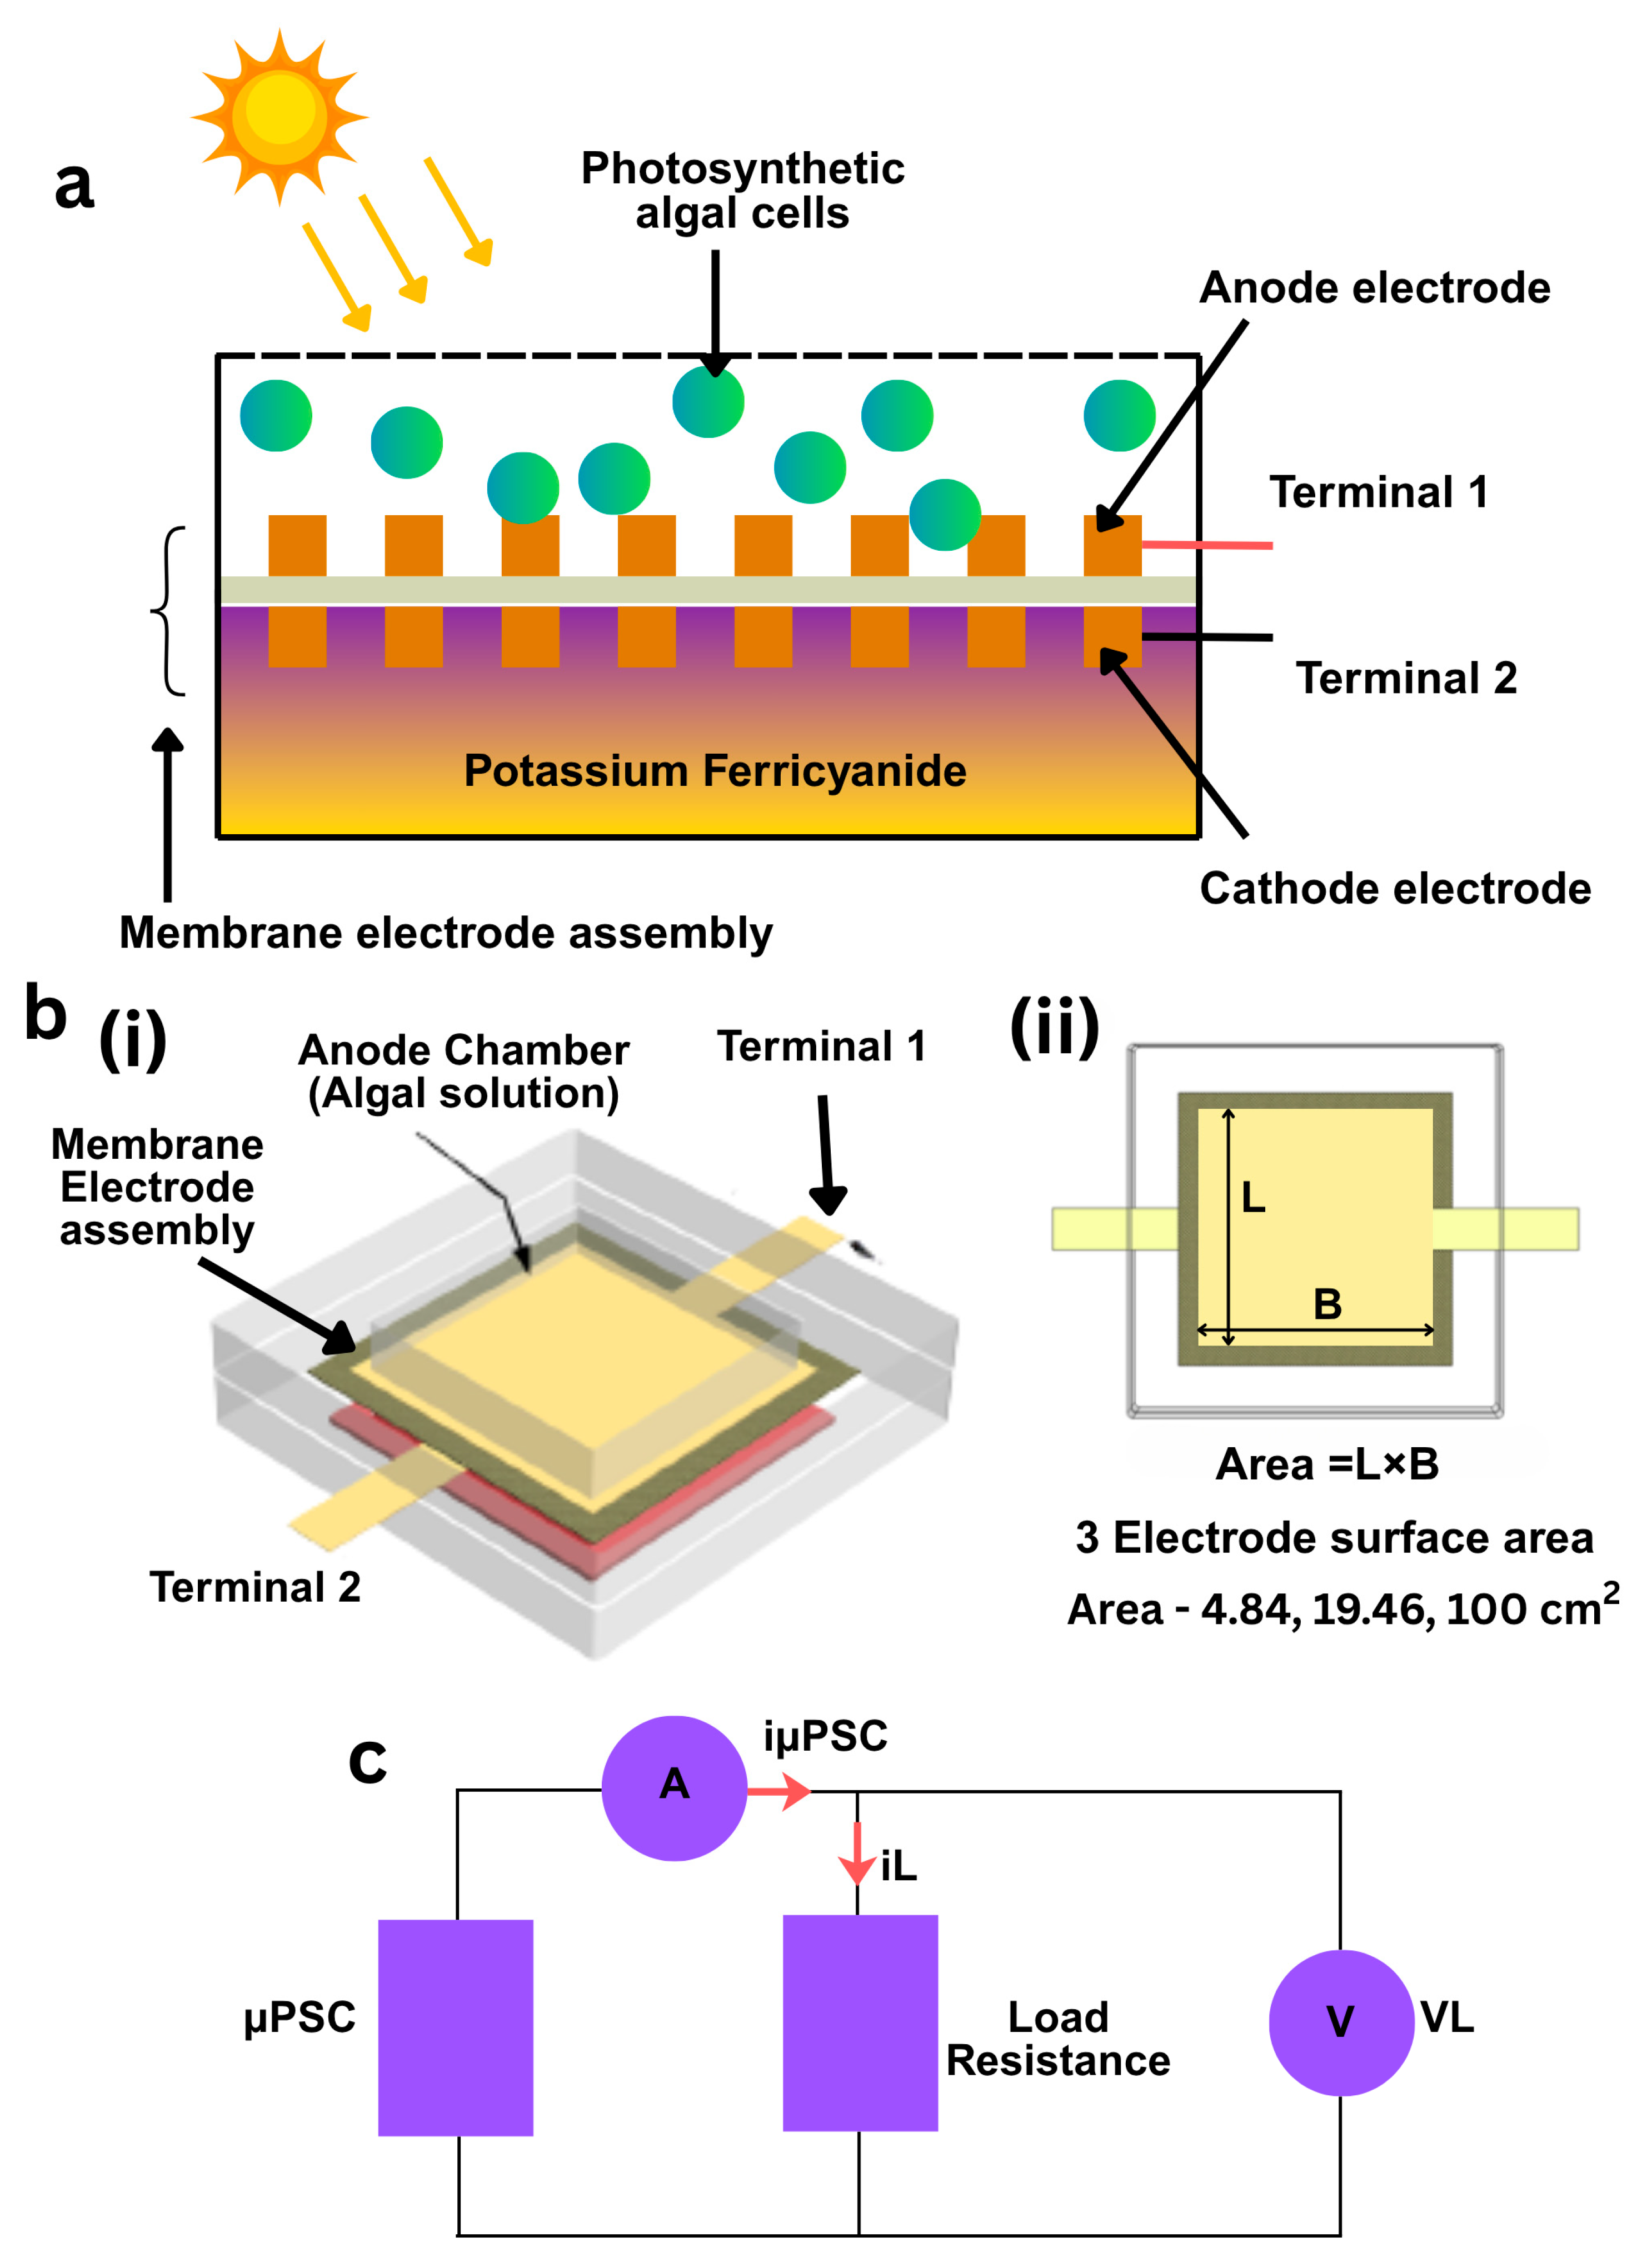
Figure 1 demonstrates the operating principle of the μPSC. Details of the operating principle of the device are presented in our previous works. For clarity to new readers, the operating principles of the μPSC are briefly outlined here. The μPSC was fabricated with discrete anode and cathode chambers separated by a membrane electrode assembly (MEA), wherein selective proton transport between the two compartments is facilitated by a Nafion proton exchange membrane. Within the anode chamber, photosynthetic microorganisms are employed to catalyze water-splitting reactions through integrated photosynthetic (under illuminated conditions) and respiratory metabolic pathways (under dark conditions). Electrons generated via photosynthetic redox processes at the anode are transferred to an external circuit, thereby generating electrical energy across an external load resistor. Simultaneously, protons released during these metabolic reactions are driven through the Nafion membrane toward the cathode chamber. The membrane enforces unidirectional proton transport while preventing electron crossover, thereby compelling electron flow through the external circuit to the cathode. At the cathode, the incoming electrons and transported protons react with molecular oxygen to produce water as the terminal reaction product. Through this sequence of reactions, bioenergy is sustainably converted into bioelectricity, completing the electrochemical cycle.
Figure 1. Schematic illustration and electrical characterization of the µPSC: (a) schematics of µPSC, consists of anode and cathode chambers. Anode chamber consists of algal cells and cathode electron acceptor (potassium ferricyanide). (b(i)) Three-dimensional view of the μPSC with labeled terminals and membrane assembly. (b(ii)) Top view showing the electrode dimensions (L × B) with surface areas of 4.84, 19.46, and 100 cm2. (c) Circuit diagram showing the μPSC connected to a load resistor (R), ammeter (A), and voltmeter (V) for current (iL) and voltage (VL) measurements.
In Figure 1b(i), the fabricated μPSC is illustrated as an assembled structure, where the membrane electrode assembly is sandwiched between the anode chamber containing the algal solution and the cathode chamber containing the potassium ferricyanide, an electron acceptor. The selection of specific concentration of potassium ferricyanide was performed based on previous works. The device was designed with terminals for electrical access. Figure 1b(ii) shows a top view of the electrode, where the surface area is defined as the product of length (L) and breadth (B) of the electrode. Three different electrode surface areas such as 4.84 cm2, 19.36 cm2, and 100 cm2 were fabricated to investigate the effect of electrode size on device performance of the μPSC. The performance of these devices was characterized by measuring the Voc, Isc, and VL and IL at a fixed load resistance of 1 kΩ. The primary objective of this design was to determine whether an increase in electrode surface area results in enhanced output voltage, output current and power density. Figure 1c presents the schematic of the electrical measurement setup, where the μPSC was connected in series with a load resistor (R). The load voltage is measured across the resistor, and the load current was calculated accordingly. This configuration allows the performance parameters of the μPSC to be systematically evaluated under different electrode surface area conditions.

2. Materials and Methods

2.1. µPSC Fabrication

The µPSC was fabricated as a dual-chambered device comprising an anode and cathode separated by a Nafion 117 proton-exchange membrane (Fuel Cell Store Inc., Bryan, TX, USA), which was pretreated to enhance ionic conductivity and air-dried for 12–14 h. Honeycomb-structured aluminum foils (2.4 × 2.4 cm2, 0.027 mm thick, Dexmet Corp., Wallingford, CT, USA) were sputter-coated with a 40 nm gold layer (Quorum Technologies) to serve as electrodes. Electrodes were bonded to the membrane using polyurethane water-resistant adhesive, and a uniaxial pressure of 10 kN was applied for 1 h to ensure firm contact. Electrical terminals (0.5 × 3 cm) were attached to both electrodes. Anode and cathode chambers were cast from PDMS (10:1 base to curing agent), degassed for 10 min, and molded using custom brass forms, followed by curing at 60 °C for 4 h. The membrane-electrode assembly was sealed to the PDMS chambers using the same PDMS mixture and pressed with 1.3 kN force before undergoing a second 4 h cure at 60 °C. A glass coverslip, fixed with hot-melt adhesive, sealed the cathode chamber to retain the catholyte.

2.2. Preparation of Electrolytes and Photosynthetic Microorganisms

The catholyte was prepared by dissolving potassium ferricyanide (K3[Fe (CN)6]) to a concentration of 25% (w/v), as determined from prior optimization studies for achieving maximum power output. A volume of 2 mL of the prepared solution was introduced into the cathode chamber using syringe injection. Similarly, the anode chamber was filled with algal suspension containing Chlamydomonas reinhardtii in its growth medium. The wild-type strain Chlamydomonas reinhardtii CC-125 (mt+) was cultivated in Tris–Acetate–Phosphate (TAP) medium prepared according to the Sueoka formulation. Cultures were inoculated at an initial optical density (OD750) of ~0.1–0.15 (~1–2 × 10⁶ cells/mL) and maintained until the mid-logarithmic phase (OD750 ≈ 0.6–0.8, ~8–10 × 106 cells/mL). For device experiments, cells were harvested in the mid-log phase (48 h of algal cells cultivation). For the µPSC with an electrode area of 4.84 cm2, 2.5 mL of the suspension was used; for the 19.36 cm2 configuration, 10 mL was added; and for the 100 cm2 device, 50 mL of the algal suspension was introduced.

2.3. Terminal Connections

Brass electrodes (Dexmet Corp, Wallingford, CT, USA) and alligator clips (Digikey Inc., Thief River Falls, MN, USA) were used to connect the µPSC to a custom-designed, calibrated data acquisition system with an integrated microcurrent sensing module for measuring terminal voltage and current.

2.4. Light Condition

Artificial lighting was provided by a 40 W white, fluorescent lamp (Philips–Purchased in Montreal, QC, Canada) emitting within the 400–700 nm spectral range. Illumination intensity was modulated manually and measured using a lux meter. The recorded values were subsequently converted to photosynthetically active radiation units (µmol m−2 s−1) for consistency with photosynthesis-related studies.

2.5. Loading Tests and Measurements

Real-time electrical characterization was conducted by connecting various external load resistances (ranging from 0 to 50 kΩ) using a rheostat to the µPSC. For each resistance setting, the steady-state voltage and current were recorded after a 30 s stabilization period. The power output was computed as the product of the measured terminal voltage and current (P = V × I). Polarization curves (I-V characteristics) were generated by gradually adjusting a rheostat from short-circuit to open-circuit conditions. Corresponding power curves (I-P characteristics) were also plotted to identify the maximum power point (Pmp), and the associated operating voltage (Vmp) and current (Imp) were recorded.

2.6. Generative AI for Image Generation

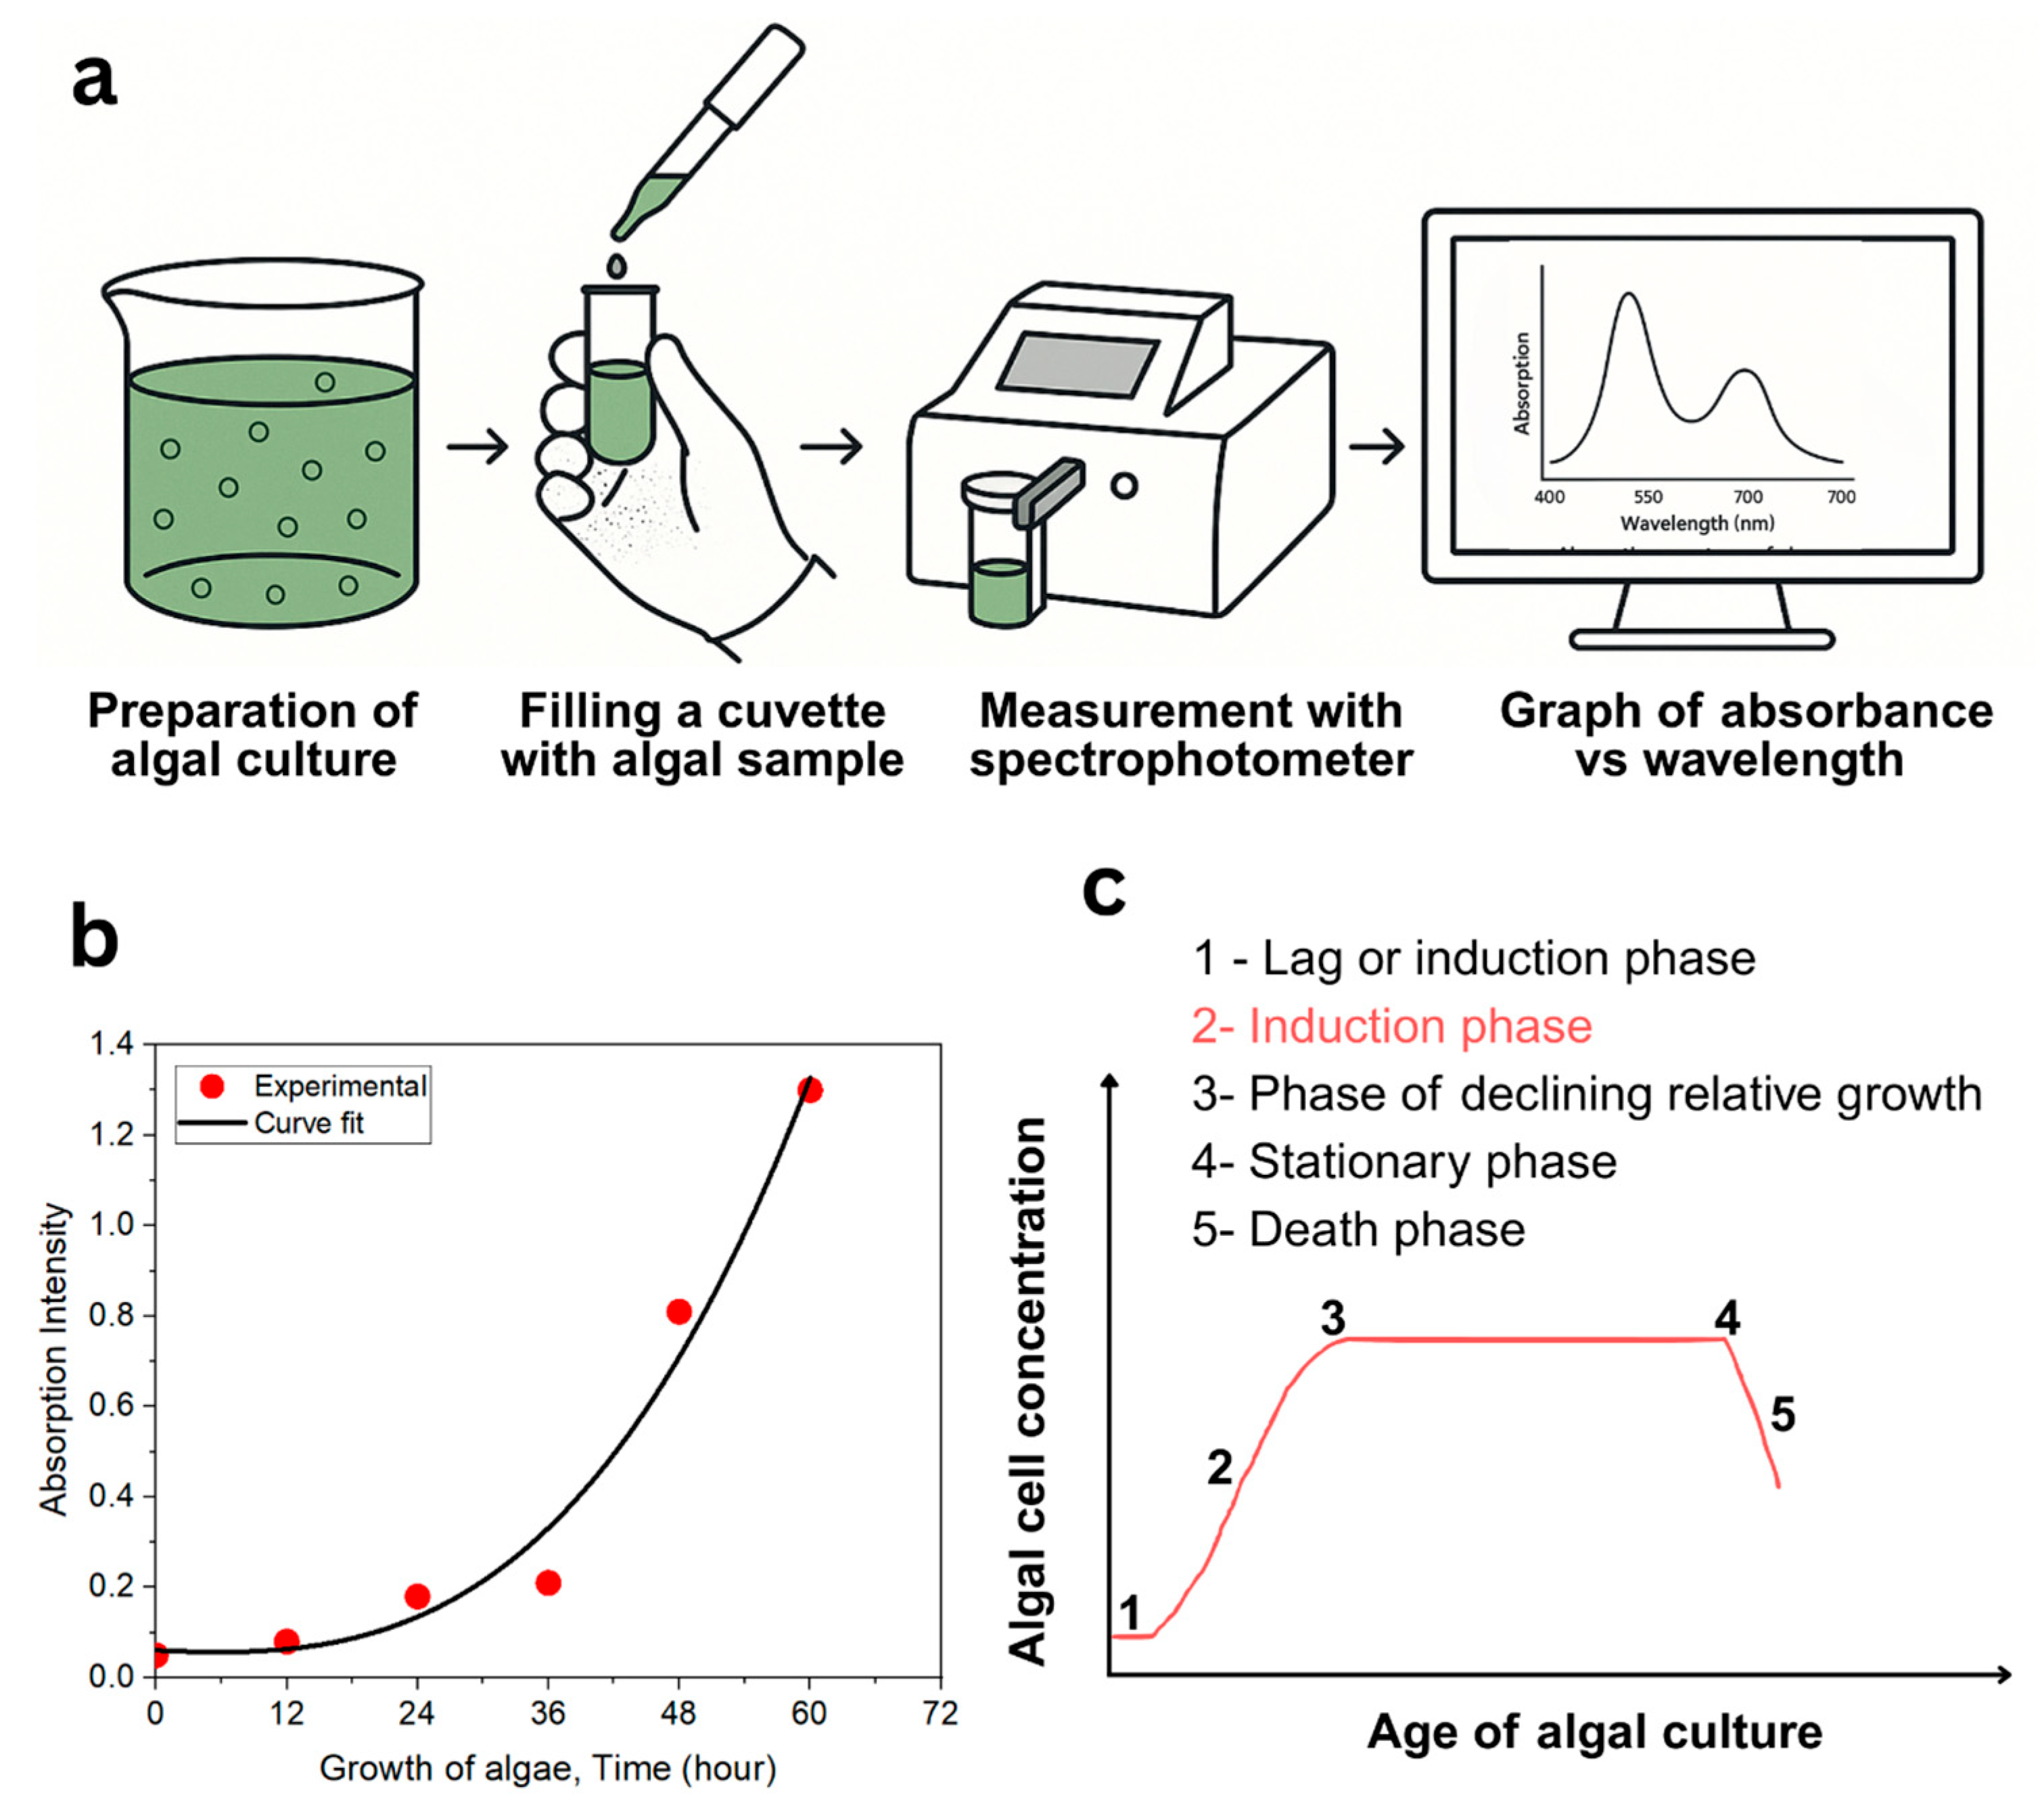
Figure 2a was created using generative AI tools. Specifically, ChatGPT 5 was utilized to design and generate the schematic illustration presented in the figure.
Figure 2. Spectrophotometric characterization of algal culture growth. (a) The experimental workflow for algal growth monitoring is illustrated (generated using Generative AI—ChatGPT). The algal culture was prepared, an aliquot was transferred into a cuvette using a micropipette, and absorbance was measured using a spectrophotometer. The resulting spectra were plotted as absorbance versus wavelength. (b) The algal growth curve was obtained by measuring absorbance over time. Experimental data (red dots) were recorded, and an exponential growth model was fitted to the data. (c) The typical phases of algal growth are schematically represented: (1) lag phase (adaptation), (2) exponential or accelerated growth phase, (3) decelerated growth phase, (4) stationary phase, and (5) death phase. Changes in cell concentration are shown as a function of culture age.

3. Results

3.1. Optimized Growth of Algal Culture for the µPSC Testing Subsection

To determine the optimal growth stage of algal cultures for maximizing the performance of µPSCs, algal cells were cultivated under controlled conditions, and their absorption intensity was periodically measured using a spectrophotometer. Since the photosynthetic activity and metabolic rate of algae vary significantly with their growth phase, identifying the phase during which algal cells exhibit maximum photosynthetic efficiency was critical for ensuring consistent and high-performance operation of µPSCs. Figure 2a illustrates the schematic procedure followed for the spectrophotometric measurement of algal culture. Algal cells were grown in sterile conical flasks placed within a culture chamber, where parameters such as temperature, light intensity, and light-dark cycles were precisely regulated to promote optimal growth. At predetermined intervals, aliquots of the algal suspension were collected using a micropipette and transferred into clean optical cuvettes (1 cm path length). The absorbance spectrum in the range of 400–750 nm was recorded using a calibrated spectrophotometer. The spectra typically exhibited absorption peaks near 430 nm and 680 nm, corresponding to chlorophyll a and b, which serve as indicators of algal biomass and photosynthetic pigment content.
To evaluate the progression of algal growth, absorbance measurements were recorded at regular time points and plotted (Figure 2b). The red dots represent experimental absorption values at ~680 nm, and the black line shows a fitted nonlinear regression curve. The data clearly indicates an exponential increase in absorption intensity between 24 and 60 h, which corresponds to the exponential (log) growth phase also referred to as the induction phase. During this period, the cells actively divide and exhibit the highest metabolic and photosynthetic rates, making it the most favorable phase for harvesting algal biomass for µPSC application.
To maintain consistency and reproducibility in µPSC performance evaluation, algal cultures were predominantly used at 48 h of growth which was well within the exponential phase. This selection ensured that the photosynthetic microorganisms powering the µPSCs were at their peak activity, thereby maximizing current generation and overall power output.
Figure 2c provided a conceptual representation of the algal growth curve, which consists of five distinct phases: (1) lag phase, where cells adapt to the new environment without dividing; (2) induction or exponential phase, characterized by rapid cell division and high photosynthetic activity; (3) phase of declining relative growth, as resource limitations begin to slow down proliferation; (4) stationary phase, where cell division ceases due to nutrient depletion; and (5) death phase, during which cell viability decreases due to accumulated stress and waste products.
While the focus of this study was to leverage the exponential phase for optimized µPSC performance, the influence of other growth phases such as the stationary and decline phases on power output and photosynthetic efficiency could offer valuable insights and will be addressed in a future detailed investigation beyond the scope of this manuscript.

3.2. Effect of Electrode Surface Area (ESA) on µPSC Performance

μPSC was evaluated for its electrical performance across three distinct electrode surface areas: 4.84 cm2, 19.36 cm2, and 100 cm2. The parameters characterized include open-circuit voltage (Voc), short-circuit current (Isc), VL and IL across a fixed resistance, and the current-voltage (I-V) and current-power (I-P) characteristics. These measurements were performed under uniform illumination of 147 lux (equivalent to 2 μmol m−2 s−1), ensuring consistent photosynthetic activity.

3.2.1. Open Circuit Voltage (Voc)

Voc is the maximum theoretical voltage a cell can produce when no external load is connected (i.e., current is zero). It is governed fundamentally by the redox potential difference between the anode and cathode half-cell reactions. The theoretical maximum Voc of a μPSC is determined by the Nernst equation,
E c e l l = E c a t h o d e 0 E a n o d e 0
where E c e l l —open circuit voltage of µPSC; E c a t h o d e 0 —standard reduction potential of cathodic reactions; E a n o d e 0 —standard reduction potential of anodic reactions.
For μPSC using oxygen reduction at the cathode (~+0.82 V vs. Standard Hydrogen Electrode) and the biological oxidation of intracellular metabolites at the anode (ranging~–0.4 to –0.6 V), the theoretical Voc lies around 1.0–1.2 V under ideal conditions.
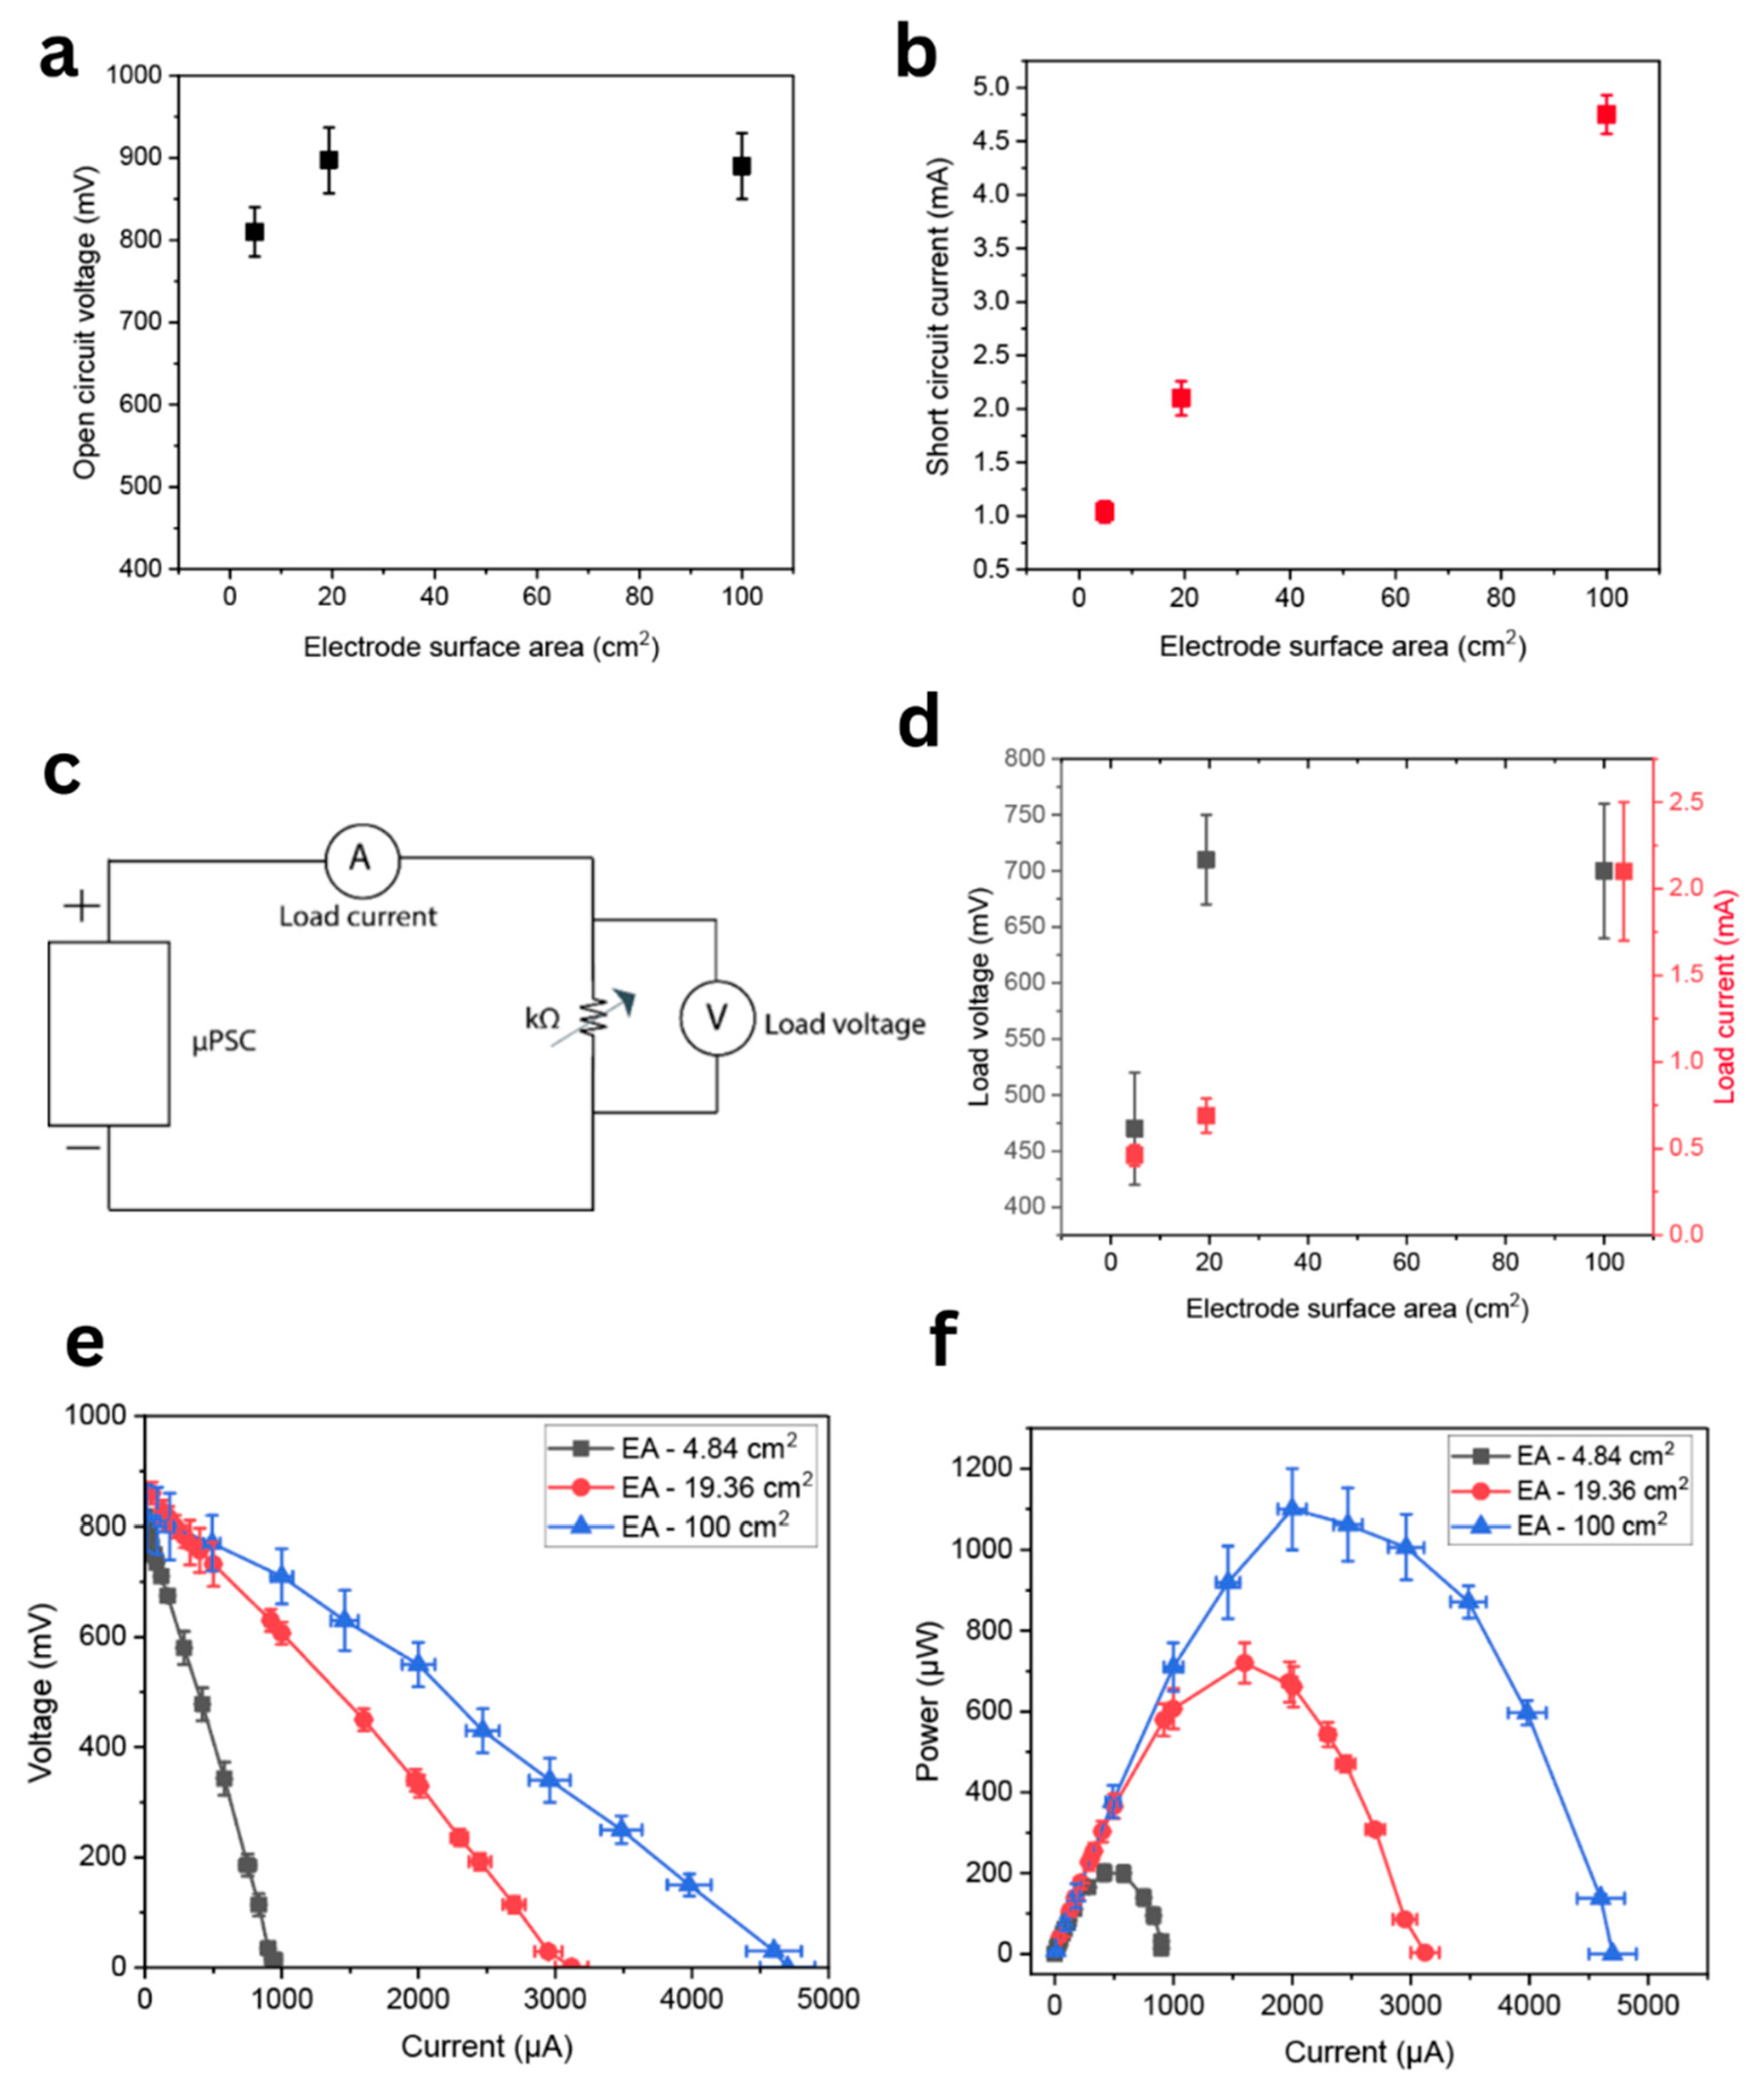
As shown in Figure 3a, the measured Voc values for all three μPSC configurations were in the range of 850–910 mV, which is approximately 75–85% of the theoretical maximum. Crucially, there was no significant change in Voc with increasing electrode surface area, affirming the electrode area-independence of Voc. This observation aligns with the electrochemical principle that Voc is a thermodynamic function of redox potential and not influenced by the geometric surface area. Minor fluctuations observed between configurations may be attributed to small variations in fabrication quality or algal cell viability. However, these differences were within experimental uncertainty.
Figure 3. Electrical performance of micro-photosynthetic power cells (μPSCs) as a function of electrode surface area. The open circuit voltage (a) remained relatively stable across increasing electrode areas, indicating that voltage output is independent of surface area. In contrast, the short-circuit current (b) showed a near-linear increase with electrode area, reflecting enhanced current generation due to a larger photosynthetic interface. A schematic of the experimental setup (c) illustrates the μPSC connected to a variable resistor, ammeter, and voltmeter to measure load current and voltage. Load voltage and current (d) measured at optimal resistance conditions demonstrate higher power output for larger electrode areas. Polarization curves (e) for electrode areas of 4.84, 19.36, and 100 cm2 show a clear increase in current with increasing area, while the corresponding power curves (f) confirm that peak power output scales proportionally with electrode surface area. These results highlight the significance of electrode scaling in optimizing μPSC performance. Error bars represent the standard deviation of three independent measurements.

3.2.2. Short Circuit Current (Isc)

In contrast to Voc, the Isc is a kinetic parameter that depends heavily on electrode surface area, bio-electrode interface area, and the rate of electron transfer. It represents the maximum current that the μPSC can deliver under zero external resistance. The theoretical upper limit of current for μPSC systems was constrained by the photosynthetic electron transport chain capacity and algal cell density. Figure 3b shows that Isc increased with surface area: approximately 1.04 mA at 4.84 cm2, 2.1 mA at 19.36 cm2, and 4.83 mA at 100 cm2, corresponding to a current density of ~215–240 μA/cm2. This suggests a near-linear relationship between Isc and surface area, validating the premise that larger electrodes provide greater interfacial contact area for bioelectronic harvesting. The results demonstrate efficient scaling behavior and indicate that the μPSC maintains consistent performance per unit area when upscaled.

3.2.3. Load Voltage (VL) and Load Current (IL) at 1 kΩ Resistance

VL is the potential measured across a finite resistive load, representing real-world operational performance of the μPSC. It provides insight into how much usable voltage the cell can supply when current is drawn, which is a crucial metric for integration with electronics. As shown in the schematic (Figure 3c), a 1 kΩ resistive load was applied, and both load voltage and load current were recorded (Figure 3d).
At this load, the measured VL increased with electrode surface area, from 465 mV (4.84 cm2) to 690 mV (19.36 cm2) and 765 mV (100 cm2). Corresponding IL also scaled from 0.46 mA to 2.0 mA. This positive correlation was attributed to a reduction in internal resistance and improved electrode kinetics as more active sites become available with larger electrodes. Importantly, this confirms that power extraction capacity under practical loads were enhanced with increasing electrode area, making surface area a key design variable for upscaling μPSC current output in real-world applications.

3.2.4. Polarization Characteristics

The polarization (I-V) curve characterizes the relationship between terminal voltage and output current across varying external loads, providing insight into the internal electrochemical losses and dynamic performance of the μPSC. As shown in Figure 3e, all three electrode configurations exhibit quasi-linear I-V profiles, where the terminal voltage decreases progressively as current increases from open-circuit to short-circuit conditions. From a theoretical standpoint, the shape of the polarization curve can be divided into three characteristic regions in classical electrochemical cells: (1) activation polarization at low currents, (2) ohmic polarization at intermediate currents, and (3) concentration polarization at high currents. In our μPSC devices, the dominant loss mechanism appears to be ohmic resistance, as evidenced by the nearly linear voltage drop, indicating minimal kinetic or mass transport limitations under the tested conditions. Importantly, the slope of the I-V curve, representing the internal resistance decreases with increasing electrode surface area. This indicates enhanced ionic/electronic conductivity and reduced interfacial resistances in larger-area cells.
R i n t = d V d I  
where R i n t is the total internal resistance of the µPSC in Ω, d V d I slope of the polarization curve (I-V) plot. The negative sign indicates slope is negative, which is voltage decreases as current increases.
Specifically, the 4.84 cm2 device shows a steeper slope and an early voltage collapse (0 V at 1 mA), while the 100 cm2 device maintains a higher voltage (450–600 mV) even at 4.8 mA. This was attributable to the increased bio-electrode interface, which facilitates higher electron flux and better charge transfer kinetics due to greater algal cell coverage and contact area. The deviation from the ideal flat-top curve observed in conventional photovoltaic systems (where current remains constant until a knee point) further reinforces that the μPSC operates more like a mixed-mode electrochemical generator, where both voltage and current are load-dependent due to non-negligible internal resistance and distributed reaction sites. Hence, for optimal system integration, this I-V behavior must be accounted for in the design of load-matching power management circuits.

3.2.5. Current-Power (I-P) Characteristics

The I-P curve represents the real-time power output of the μPSC as a function of current, calculated using P = VI. It provides critical information on the maximum deliverable power (Pmp) and the associated operating point (Vmp, Imp), which are essential for efficient circuit coupling and energy harvesting optimization and to power the real-time low power devices.
Figure 3f presents the I-P characteristics of μPSCs with varying electrode surface areas. In each case, a distinct peak in power output was observed, beyond which the power declined due to the diminishing voltage outweighing the increase in current. The maximum power output (Pmp) was found to scale significantly with electrode area. Specifically, approximately 200 μW was achieved for the 4.84 cm2 device, around 580 μW for the 19.36 cm2 configuration, and nearly 1200 μW for the 100 cm2 device. This increase in power output was attributed to the linear scaling of current with electrode surface area, while the operating voltage remained relatively stable near the maximum power point (~450–500 mV), as it is determined by redox potentials and is largely independent of area. The I-P curve was also observed to broaden with increasing electrode surface area, resulting in a wider plateau near the Pmp. This broader region is advantageous for load matching, as it enables more stable operation under varying load conditions without significant efficiency loss. Moderate increases in both Imp (current at maximum power) and Vmp (voltage at maximum power) were recorded as the electrode area increased, indicating enhanced power delivery capability. Furthermore, the normalized power density remained consistent across all configurations, in the range of ~40–50 μW/cm2, demonstrating that energy conversion efficiency per unit area was maintained even as the system was geometrically scaled. These results confirm the potential for modular scaling or parallel arraying of μPSCs to achieve higher total power output without compromising performance.
Table 1 μPSC performance summary presents the key performance metrics operating voltage (Vmp), current (Imp), and maximum power output (Pmp) for μPSCs with electrode surface areas of 4.84 cm2, 19.36 cm2, and 100 cm2.
Table 1. Performance of µPSC with Electrode surface area (ESA).
As the surface area increases, both Imp and Pmp show substantial enhancement, confirming that power output scales effectively with the available bio-electrode interface. Vmp exhibits a modest increase with surface area, reflecting slight improvements in internal resistance and charge transfer efficiency. These trends validate the design strategy of geometric scaling to achieve higher power output while maintaining efficient energy conversion.
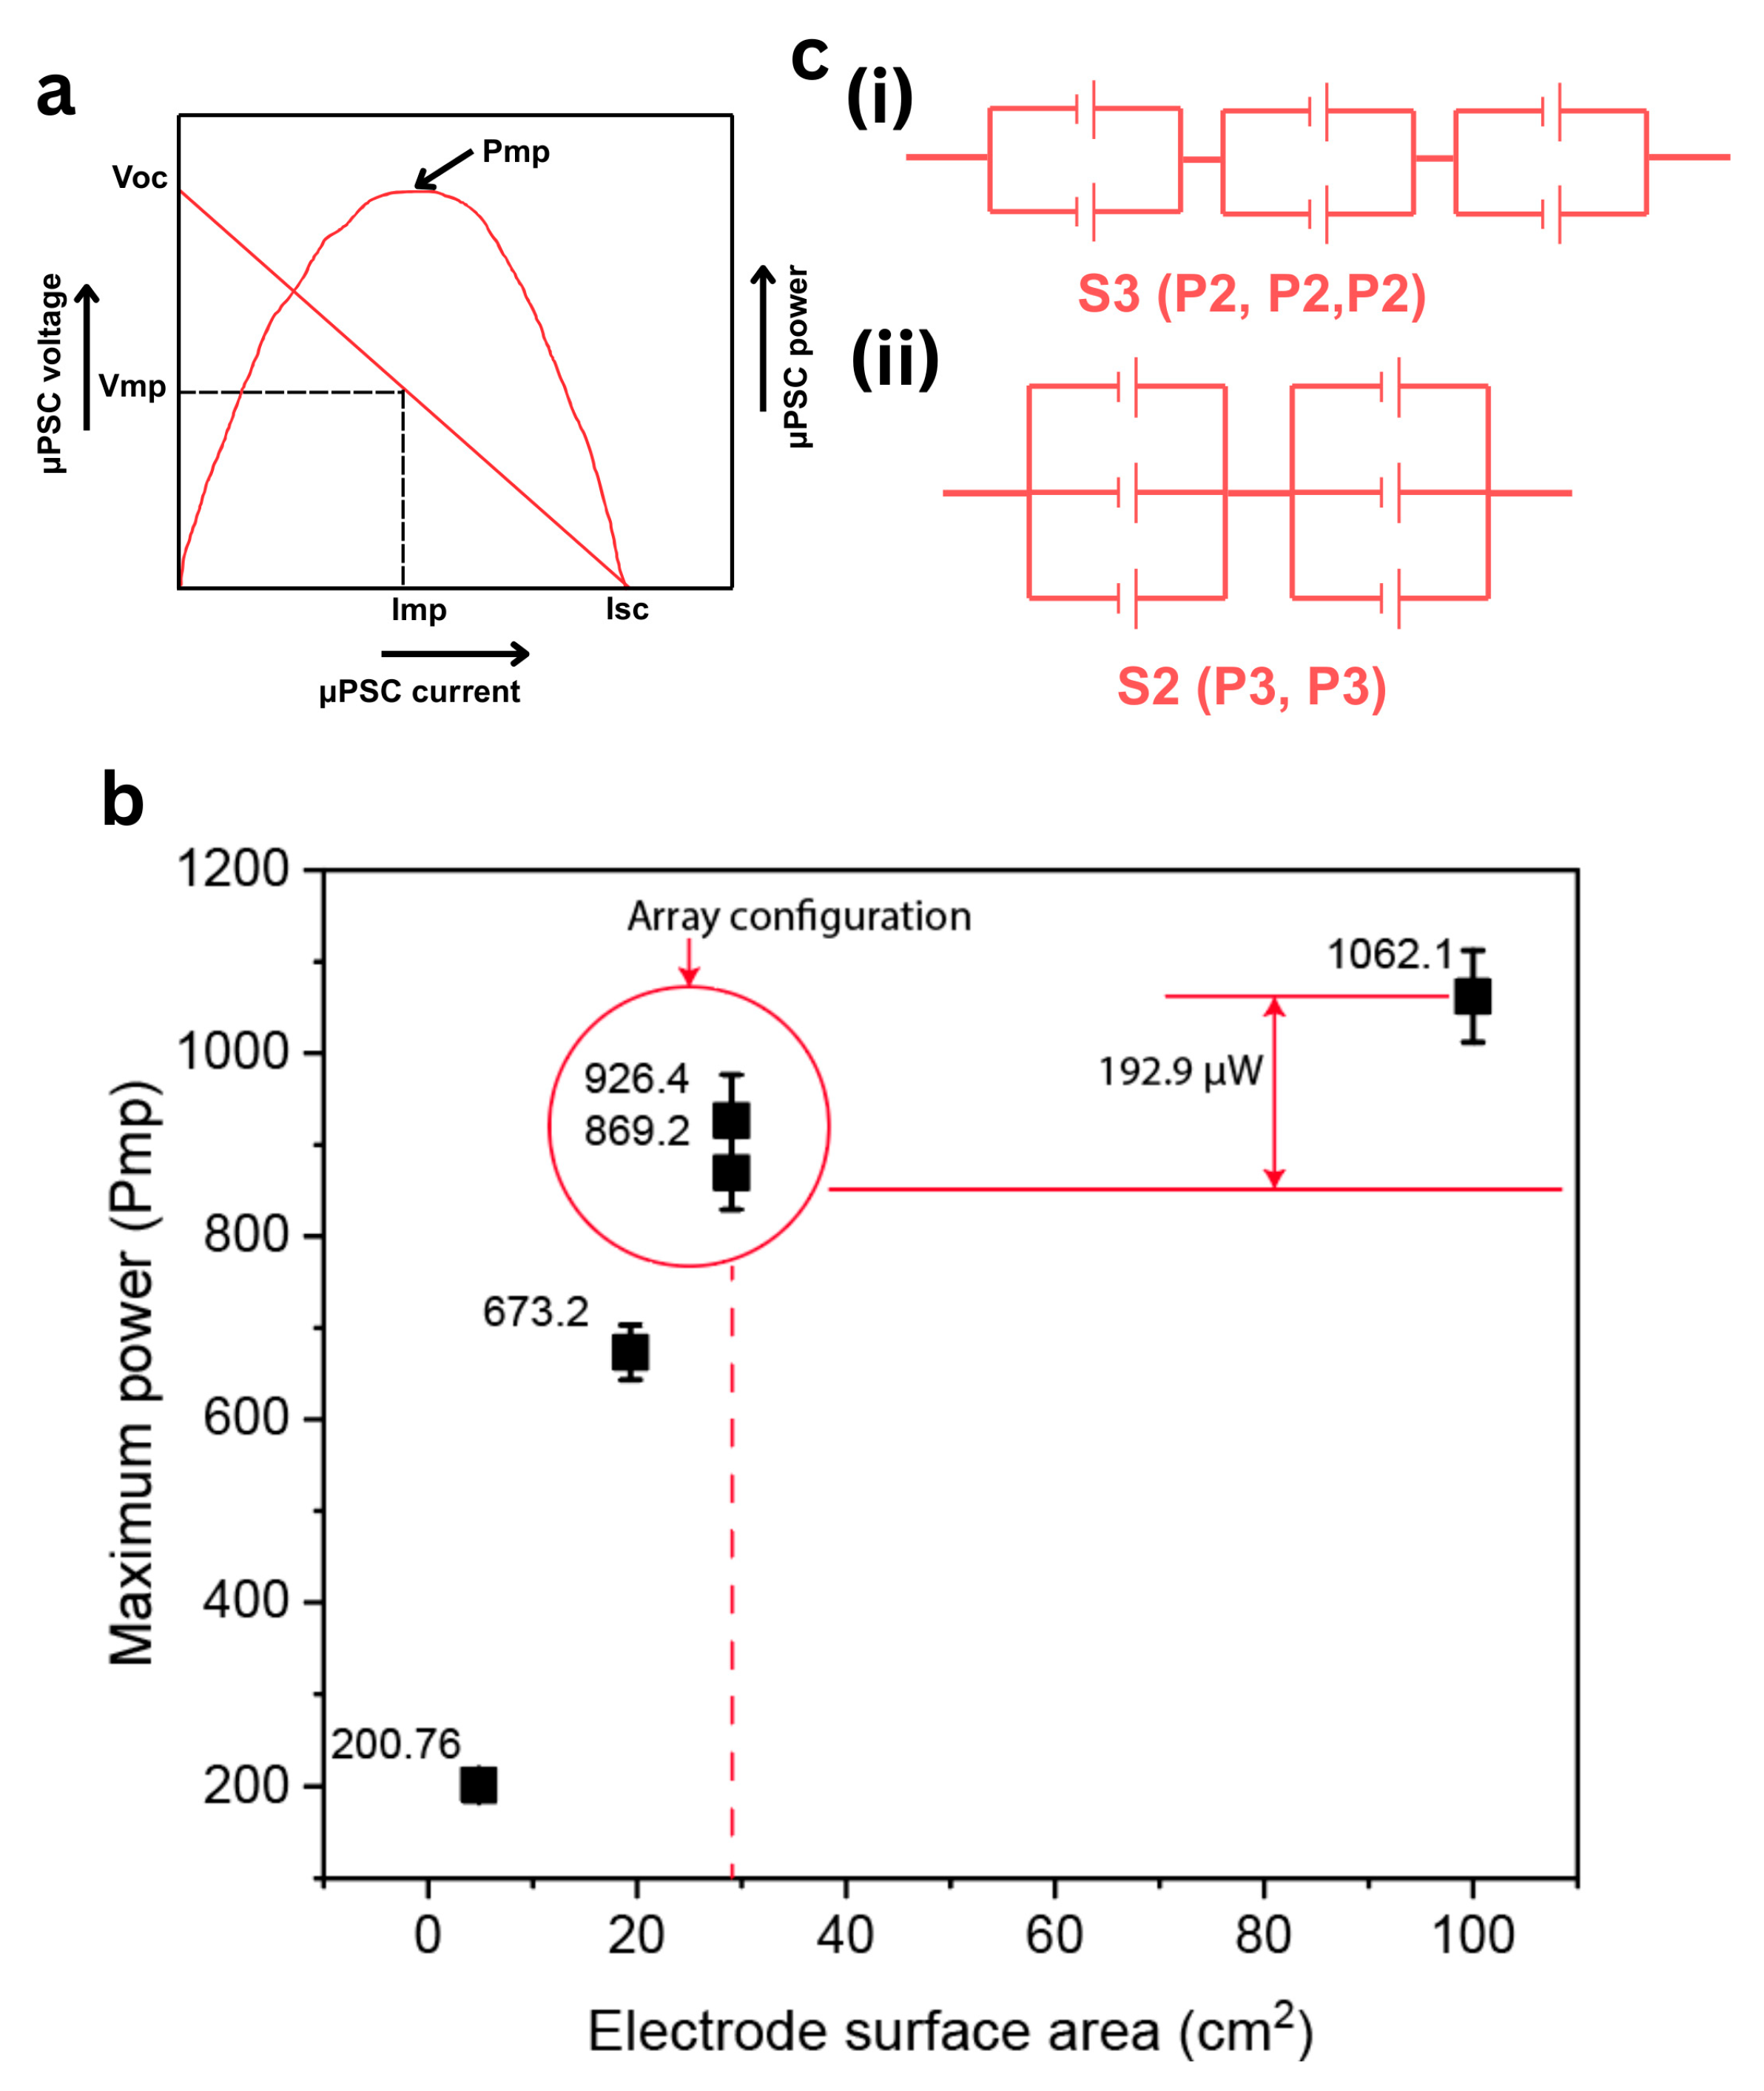
Figure 4a illustrates the characteristic output behavior of a μPSC, with key electrical parameters identified, Voc, Isc, and the maximum power point (Pmp), which occurs at a specific voltage (Vmp) and current (Imp). This schematic highlight that while Voc and Isc define the theoretical operating limits, usable power output is delivered only at the point (Vmp, Imp), where the product of voltage and current is maximized. In Figure 4b, the experimentally measured maximum power outputs (Pmp) were plotted as a function of the ESA, encompassing both individual μPSC units and array configurations. Devices with electrode areas of 4.84 cm2, 19.36 cm2, and 100 cm2 were evaluated individually, alongside two optimized array configurations that were designed to enhance power performance based on previous array wiring strategies []. Previously we published a work on arraying strategies for enhancing the power output of the μPSC.
Figure 4. Performance characterization of μPSCs and effects of array configurations. (a) I-V and P-V curves of a μPSC are shown, with key parameters labeled: Voc, Isc, Vmp, Imp, and Pmp. (b) Pmp is plotted against ESA, showing an increase from 869.2 µW to 1062.1 µW using array configurations without increasing ESA. (c) Schematic of μPSC array setups: (i) S3 (P2, P2, P2) in series for higher voltage, and (ii) S2 (P3, P3) in parallel for higher current.
For individual μPSCs, the Pmp values were observed to increase with electrode area, demonstrating a strong correlation between ESA and the total power generated. Specifically, a Pmp of approximately 200.76 μW was measured for a single μPSC with a 4.84 cm2 electrode area, while devices with 19.36 cm2 and 100 cm2 ESAs yielded 673.2 μW and 1062.1 μW, respectively. These results confirm that the output power scales almost linearly with surface area, owing to the proportional increase in photocurrent generation.
Two modular array configurations, S3 (P2, P2, P2) and S2 (P3, P3), were also evaluated. These configurations were chosen based on the array configurations that led to highest power output among the 6 cells when connected in array configurations. Both configurations were constructed using six μPSC units (each of 4.84 cm2), resulting in a total ESA of 29.04 cm2. Despite having ESA of 29.04 cm2 in comparison with 100 cm2 single-chip device, the arrays delivered remarkably high-power outputs: 869.2 μW for S3 and 926.4 μW for S2. These values correspond to approximately 82% and 87%, respectively, of the power generated by the 100 cm2 μPSC, as indicated by the red arrows and annotations. While the six cells in series configurations generated power output of 473.3 μW, whereas six cells in parallel configurations generated power output of 500 μW. The detailed analysis was presented in our previous works.
The performance of these arrays was notable. The S3 (P2, P2, P2) configuration achieved a Voc of 2.4 V and a Pmp of 869.2 μW, while the S2 (P3, P3), configuration yielded a Voc of 1.6 V and a Pmp of 926.4 μW. In comparison, the single μPSC device with a 100 cm2 electrode area produced a Pmp of 1062.1 μW and a Voc of 0.88 V. Despite using almost less than one-third the electrode area, these array configurations delivered approximately 82–87% of the power output of the 100 cm2 single-chip device. Furthermore, these modular arrays operated at significantly higher voltages, 2.4 V for S3 (P2, P2, P2) and 1.6 V for S2 (P3, P3), facilitating easier integration with power management and conditioning circuitry.
Additionally, the total reagent volume required for the arrays was only ~15 mL, compared to ~50 mL for the 100 cm2 device, representing an approximate 70% reduction in material usage and associated fabrication costs. These findings underscore the resource efficiency and scalability advantages of the arrayed configurations. Therefore, while powering up the low power devices depending on the voltage and current requirements, we need to choose numbers of μPSCs and then optimize the array configurations that can produce the voltage and current that is essential to power those devices.
Figure 4c provides a schematic circuit diagram of the two array topologies. In the S3 design, three parallel-connected pairs (P2) of μPSCs are connected in series, whereas in the S2 design, two parallel-connected triplets (P3) are linked in series. These configurations were specifically engineered to overcome the intrinsic limitations of individual μPSC units. A single μPSC is inherently limited to a Voc of approximately 0.8–0.9 V due to thermodynamic constraints imposed by redox potentials, and its current output is limited by the kinetics of electron transfer in photosynthetic reactions. Therefore, array integration is essential for scaling both voltage and current outputs to match the demands of practical low- and medium-power electronic applications.
Table 2 tabulates the ESA, Pmp, and Voc values for all tested configurations. It is evident that the S2 and S3 arrays not only approach the power output of the larger 100 cm2 μPSC device but also offer superior voltage characteristics and a significantly reduced physical and operational footprint. These results validate the effectiveness of modular μPSC arrays as a viable strategy for scalable, efficient, and cost-effective bioelectric energy generation.
Table 2. Table summarizing ESA, Pmp, and Voc for individual and arrayed μPSC devices.

3.2.6. Practical Application and System Integration

The increased output voltage and current of the S3 (P2, P2, P2) and S2 (P3, P3), configurations make them ideally suited for integration with DC-DC converters, particularly boosting converters, to elevate and regulate voltage for low power and ultra-low power consumer-grade electronics. For instance, the 2.4 V output of the S3 (P2, P2, P2) configuration can be stepped up and stabilized to 5 V or higher using a compact boost circuit, making it capable of charging mobile phones or powering microcontroller-based IoT platforms. However, it is necessary to increase the current generation significantly to power a microcontroller based IoT devices and slow charging mobile phones. Additionally, these μPSC arrays can be coupled with other energy sources such as photovoltaic (PV) panels or rechargeable batteries in dual-input hybrid systems [,]. In such setups, μPSCs can serve as a sustainable base-load source, while PVs or batteries supply peak or backup power. This dual-source approach ensures continuous, stable power for low-power or intermittently operating devices such as environmental sensors, smart textiles, wearable health monitors, and distributed agriculture systems. However, integrating μPSC arrays with existing power management electronics, such as boost converters or hybrid storage systems, faces several key limitations. These include low and fluctuating output power that often falls below the startup thresholds of commercial power ICs, high internal resistance causing voltage drops under load, and biologically driven variability that leads to unstable output. Additionally, the slow dynamic response of μPSCs, mismatch with standard energy storage devices, and inefficiencies in power conversion further hinder effective integration. Variations among individual μPSC units in arrays can also create imbalances. Therefore, μPSC still needs to be improved quite a lot to integrate with existing power management electronics.
To establish a clear performance benchmark and guide the optimization of μPSC design, we conducted a comprehensive literature survey of previously reported bio-photovoltaic (BPV) and μPSC systems. The primary objective of this analysis was to evaluate the relationship between electrode surface area (EA) and power density (PD) across a wide spectrum of device configurations, fabrication methods, and biological systems. This survey was essential not only to contextualize our results but also to understand the broader performance trends in the field and to identify key limitations and opportunities for further development. The significance of this study lies in several critical aspects. First, it supports design optimization by revealing how performance varies with device scale. By comparing PD across systems ranging from sub-millimeters to tens square centimeters in area, we can identify the scaling behavior of μPSCs and determine the most efficient electrode geometries. Second, the literature analysis serves as a robust framework for performance benchmarking. It allows us to position our own μPSC and array configurations relative to existing technologies and quantify any performance gains or limitations, particularly with respect to our modular array strategy.
Furthermore, this analysis is vital for assessing commercial viability, as power density directly impacts the practicality of integrating μPSCs into compact, portable electronics. High PD is essential for minimizing the footprint of energy-harvesting systems while ensuring adequate power supply. The instance, so helps identify technological bottlenecks for instance; lower PDs observed in large-area systems often stem from mass transport limitations, poor light distribution, or reduced biofilm–electrode coupling. Recognizing these challenges provides us with direction for refining both biological and electrochemical interfaces in future iterations.
Overall, this literature study offers a strong empirical foundation for the field and supports our claims with a statistically diverse and technically rich dataset. Table 3 tabulated results below summarize over 40 BPV and μPSC devices, listing their electrode surface areas and corresponding power densities []. These values form a critical reference for evaluating the effectiveness of our μPSC system, including our novel array configurations that aim to deliver high power output with minimized area, cost, and material usage.
Table 3. Literature analysis of ESA, and their power density of BPVs.
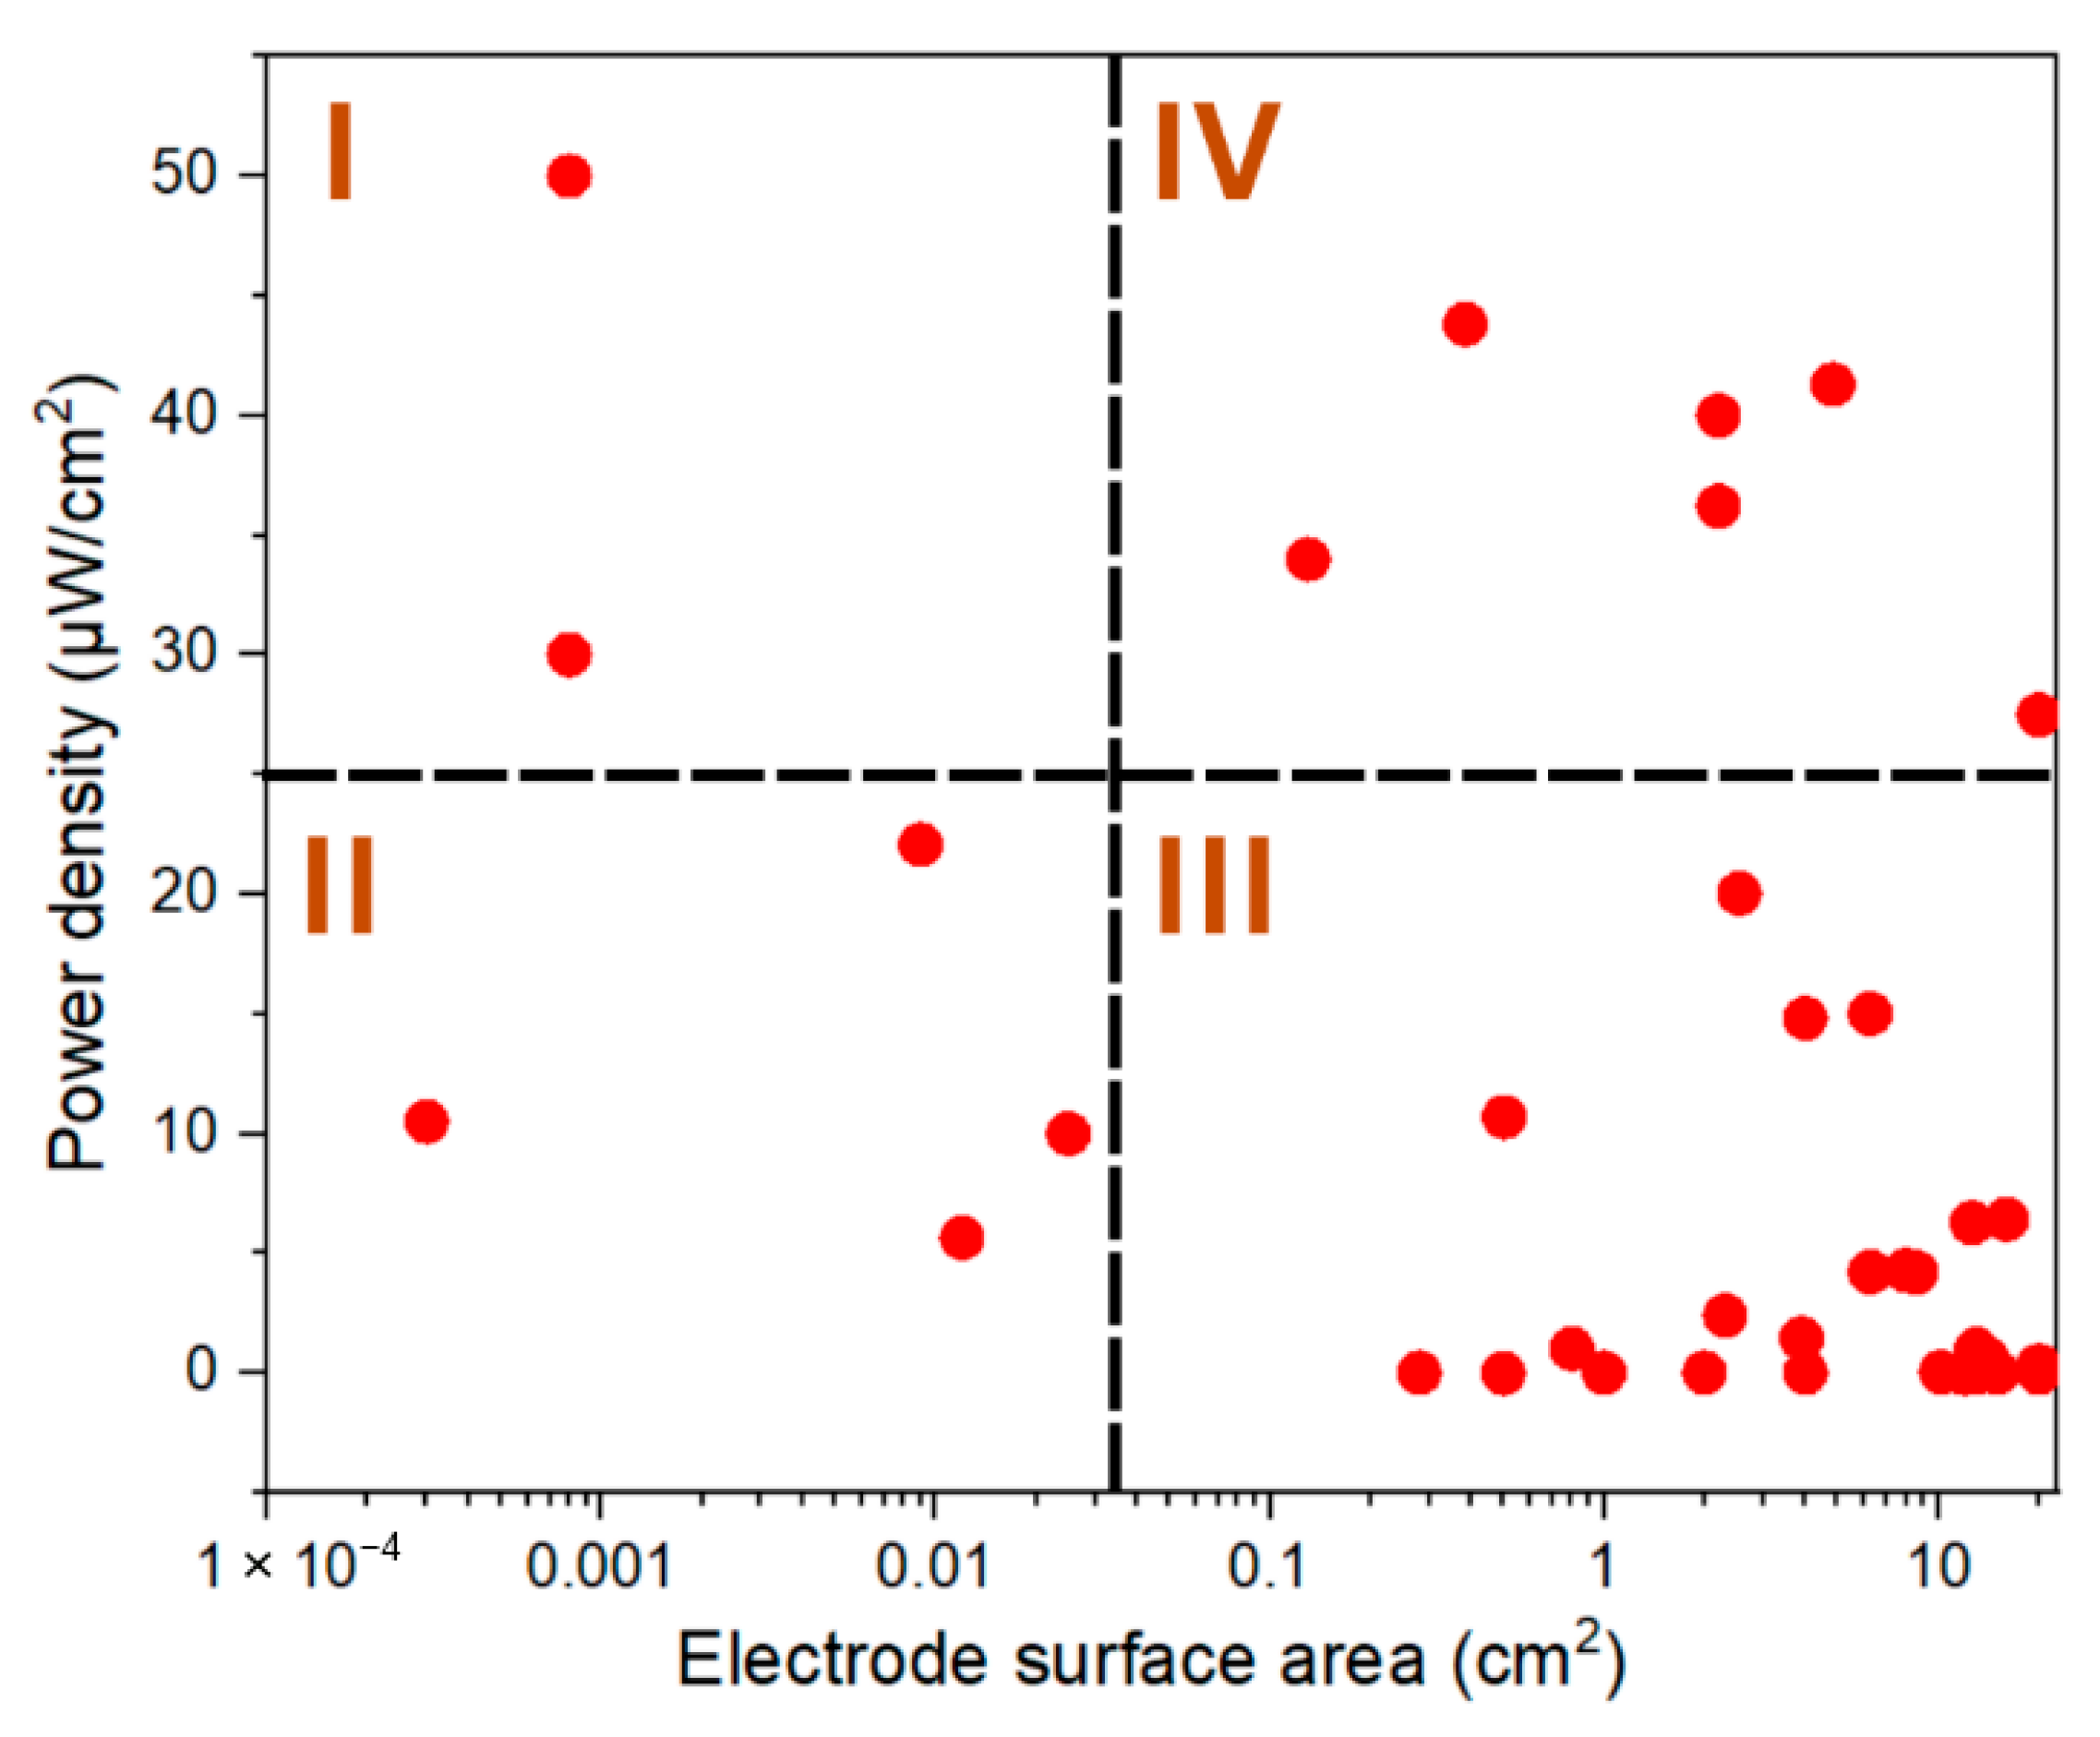
Figure 5 presents a quadrant-based analysis of the power density versus electrode surface area for a wide range of μPSC devices reported in the literature. The plot is divided into four distinct quadrants using reference thresholds at 0.03 cm2 for electrode surface area (x-axis) and 25 μW/cm2 for power density (y-axis), allowing us to visualize and compare the performance categories across different device scales. Quadrant I includes devices with small electrode areas and high-power density. These are typically micro-scale μPSCs or lab-scale prototypes that benefit from optimized reaction kinetics, short diffusion distances, and precise fabrication.
Figure 5. Scatter plot showing power density (μW/cm2) versus electrode surface area (cm2) for various BPV and μPSC devices reported in the literature. The plot is divided into four quadrants to categorize device performance. Quadrant I is occupied by small-area, high-power-density devices. Quadrant II includes small-area devices with low power density. Quadrant III is defined by large-area devices with low power density, while Quadrant IV represents large-area, high-power-density systems. Dashed lines are used to divide the plot based on electrode area (0.03 cm2) and power density (25 μW/cm2).
However, despite their high performance, such devices are limited in absolute power output and often lack scalability. Quadrant II represents micro-scale devices with low power density, often resulting from insufficient biological activity, poor light absorption, or inefficient electrode interfaces. These systems highlight the challenges in optimizing microscale platforms for meaningful power generation. Quadrant III contains larger-area devices with low power density, which are commonly observed in scaled-up systems. The drop in performance here is often attributed to mass transport limitations, uneven biofilm distribution, and increased internal resistance. Many reported devices fall into this quadrant, revealing a key bottleneck in the transition from lab-scale to practical systems. Quadrant IV is the most desirable region, comprising large-area devices that maintain high power density. Only a few devices achieve this, highlighting the challenge of combining scalability with performance. Devices in this quadrant demonstrate successful strategies in bio-electrode engineering, system design, and operational optimization. This classification provides a clear visual overview of the current landscape of BPV/μPSC performance and emphasizes the need for innovative approaches that can shift more devices toward Quadrant IV, where both high output and practical size coexist.

4. Discussion

The present study systematically investigates the effects of electrode surface area on the performance of micro-photosynthetic power cells (μPSCs) and introduces innovative hybrid array architectures to enhance their power output and voltage. Three μPSC configurations with electrode areas of 4.84 cm2, 19.36 cm2, and 100 cm2 were fabricated and characterized through key electrical measurements, including open-circuit voltage (Voc), short-circuit current (Isc), load voltage and current, and polarization analyses under realistic operational conditions. The experimental results clearly demonstrate that while the open-circuit voltage remains relatively unaffected by increasing electrode area, both the short-circuit current and maximum power output scale significantly with electrode size. The study also presents a meta-analysis incorporating data from over 40 reported BPV and μPSC systems, revealing an inverse relationship between electrode surface area and power density, with smaller devices generally achieving higher power densities. Furthermore, this work introduces compact hybrid array configurations that combine multiple miniaturized μPSC units in series and parallel to deliver power outputs comparable to a single large-area cell but with reduced reagent consumption and a smaller physical footprint. These findings highlight the importance of balancing electrode geometry and array design to optimize both energy conversion efficiency and practical scalability in μPSC technologies.
This work contributes significantly to the scientific understanding of micro-photosynthetic power cells by quantifying the interplay between electrode surface area and power performance while addressing the typical trade-offs in scaling such bioelectrochemical devices. The detailed characterization across varying electrode sizes provides empirical evidence supporting the observed inverse relationship between electrode area and power density, which has implications for device miniaturization and optimization. By innovating scalable hybrid array architectures, the study transcends traditional limitations of single-device configuration such as limited voltage enhancement or excessive spatial requirements offering a modular and efficient approach tailored for real-world applications. These insights enrich the foundational knowledge necessary for advancing μPSC design strategies, fueling continuous development towards higher-performing, compact, and sustainable bio-photovoltaic systems that can power low-power electronics or Internet of Things (IoT) devices. Ultimately, this work bridges gaps in understanding electrode scaling effects and array integration, accelerating practical adoption of μPSCs as viable renewable energy alternatives.

5. Conclusions

This study demonstrates that integrating systematic electrode scaling with hybrid modular array design provides a practical and resource-efficient strategy to markedly enhance μPSC performance. The results show that while open-circuit voltage remains independent of electrode area, both short-circuit current and maximum power output scale proportionally with electrode size. Notably, innovative series–parallel array architectures achieved comparable power output (~870–926 μW) to a single 100 cm2 μPSC while utilizing only one-third of the electrode area and significantly reducing reagent consumption. These modular arrays also generated voltages up to 2.4 V, enabling direct interfacing with power conditioning circuits for IoT and ultra-low-power electronics.
A meta-analysis of over 40 reported μPSC/BPV systems further revealed a consistent inverse relationship between electrode area and power density, offering new benchmarking insights and validating the broader applicability of these findings. The integration of empirical characterization, hybrid array design, and performance benchmarking represents the key novelty of this work, advancing the field beyond conventional scaling approaches based solely on electrode enlargement or simple array wiring. By bridging fundamental scaling laws with practical engineering design, this study establishes a framework for developing compact, scalable, and resource-efficient μPSC systems for powering distributed sensors, wearables, and IoT devices, while highlighting future efforts on improving operational stability, bio-electrode interfaces, and hybrid energy integration.

Author Contributions

Conceptualization, methodology, validation, investigation, data curation, writing—original draft preparation K.K.; conceptualization, supervising, mentorship, original draft preparation, M.P. All authors have read and agreed to the published version of the manuscript.

Funding

NSERC and FQRNT funding received by Muthukumaran Packirisamy.

Data Availability Statement

All the data generated during the investigation of the research is provided here. No more data is available.

Acknowledgments

The authors acknowledge the use of OpenAI’s ChatGPT for generating the schematic illustration in Figure 2a. ChatGPT was employed as a generative AI tool to assist in the conceptual design and visualization of the figure.

Conflicts of Interest

The authors declare no conflicts of interest.

References

  1. Saar, K.L.; Bombelli, P.; Lea-Smith, D.J.; Call, T.; Aro, E.-M.; Müller, T.; Howe, C.J.; Knowles, T.P.J. Enhancing Power Density of Biophotovoltaics by Decoupling Storage and Power Delivery. Nat. Energy 2018, 3, 75–81. [Google Scholar] [CrossRef]
  2. Bombelli, P.; Savanth, A.; Scarampi, A.; Rowden, S.J.L.; Green, D.H.; Erbe, A.; Årstøl, E.; Jevremovic, I.; Hohmann-Marriott, M.F.; Trasatti, S.P.; et al. Powering a Microprocessor by Photosynthesis. Energy Environ. Sci. 2022, 15, 2529–2536. [Google Scholar] [CrossRef]
  3. Sawa, M.; Fantuzzi, A.; Bombelli, P.; Howe, C.J.; Hellgardt, K.; Nixon, P.J. Electricity Generation from Digitally Printed Cyanobacteria. Nat. Commun. 2017, 8, 1327. [Google Scholar] [CrossRef] [PubMed]
  4. Bombelli, P.; Bradley, R.W.; Scott, A.M.; Philips, A.J.; McCormick, A.J.; Cruz, S.M.; Anderson, A.; Yunus, K.; Bendall, D.S.; Cameron, P.J.; et al. Quantitative Analysis of the Factors Limiting Solar Power Transduction by Synechocystis sp. PCC 6803 in Biological Photovoltaic Devices. Energy Environ. Sci. 2011, 4, 4690–4698. [Google Scholar] [CrossRef]
  5. McCormick, A.J.; Bombelli, P.; Scott, A.M.; Philips, A.J.; Smith, A.G.; Fisher, A.C.; Howe, C.J. Photosynthetic Biofilms in Pure Culture Harness Solar Energy in a Mediatorless Bio-Photovoltaic Cell (BPV) System. Energy Environ. Sci. 2011, 4, 4699–4709. [Google Scholar] [CrossRef]
  6. Bradley, R.W.; Bombelli, P.; Rowden, S.J.L.; Howe, C.J. Biological Photovoltaics: Intra- and Extra-Cellular Electron Transport by Cyanobacteria. Biochem. Soc. Trans. 2012, 40, 1302–1307. [Google Scholar] [CrossRef]
  7. Howe, C.J.; Bombelli, P. Electricity Production by Photosynthetic Microorganisms. Joule 2020, 4, 2065–2069. [Google Scholar] [CrossRef]
  8. McCormick, A.J.; Bombelli, P.; Bradley, R.W.; Thorne, R.; Wenzel, T.; Howe, C.J. Biophotovoltaics: Oxygenic Photosynthetic Organisms in the World of Bioelectrochemical Systems. Energy Environ. Sci. 2015, 8, 1092–1109. [Google Scholar] [CrossRef]
  9. Chiao, M.; Lam, K.B.; Lin, L. Micromachined Microbial and Photosynthetic Fuel Cells. J. Micromech. Microeng. 2006, 16, 2547. [Google Scholar] [CrossRef]
  10. Fan, L.P.; Li, J.J. Overviews on Internal Resistance and Its Detection of Microbial Fuel Cells. Int. J. Circuits Syst. Signal Process. 2016, 10, 316–320. [Google Scholar]
  11. Oseyemi, A.E.; Kuruvinashetti, K.; Packirisamy, M. Perspective—Trends in the Miniaturization of Photosynthetic Power Cell towards Improved Power Density. J. Electrochem. Soc. 2022, 169, 126501. [Google Scholar] [CrossRef]
  12. Ali, A.O.; Elgohr, A.T.; El-Mahdy, M.H.; Zohir, H.M.; Emam, A.Z.; Mostafa, M.G.; Al-Razgan, M.; Kasem, H.M.; Elhadidy, M.S. Advancements in Photovoltaic Technology: A Comprehensive Review of Recent Advances and Future Prospects. Energy Convers. Manag. X 2025, 26, 100952. [Google Scholar] [CrossRef]
  13. Chen, X.; Lawrence, J.M.; Wey, L.T.; Schertel, L.; Jing, Q.; Vignolini, S.; Howe, C.J.; Kar-Narayan, S.; Zhang, J.Z. 3D-Printed Hierarchical Pillar Array Electrodes for High-Performance Semi-Artificial Photosynthesis. Nat. Mater. 2022, 21, 811–818. [Google Scholar] [CrossRef]
  14. Krieg, T.; Wood, J.A.; Mangold, K.-M.; Holtmann, D. Mass Transport Limitations in Microbial Fuel Cells: Impact of Flow Configurations. Biochem. Eng. J. 2018, 138, 172–178. [Google Scholar] [CrossRef]
  15. Bozan, M.; Berreth, H.; Lindberg, P.; Bühler, K. Cyanobacterial Biofilms: From Natural Systems to Applications. Trends Biotechnol. 2025, 43, 318–332. [Google Scholar] [CrossRef]
  16. Ng, F.-L.; Phang, S.-M.; Periasamy, V.; Beardall, J.; Yunus, K.; Fisher, A.C. Algal Biophotovoltaic (BPV) Device for Generation of Bioelectricity Using Synechococcus Elongatus (Cyanophyta). J. Appl. Phycol. 2018, 30, 2981–2988. [Google Scholar] [CrossRef]
  17. Yoon, S.; Lee, H.; Fraiwan, A.; Dai, C.; Choi, S. A Microsized Microbial Solar Cell: A Demonstration of Photosynthetic Bacterial Electrogenic Capabilities. IEEE Nanotechnol. Mag. 2014, 8, 24–29. [Google Scholar] [CrossRef]
  18. Siu, C.-P.-B.; Chiao, M. A Microfabricated PDMS Microbial Fuel Cell. J. Microelectromech. Syst. 2008, 17, 1329–1341. [Google Scholar] [CrossRef]
  19. Kuruvinashetti, K.; Packirisamy, M. Arraying of Microphotosynthetic Power Cells for Enhanced Power Output. Microsyst. Nanoeng. 2022, 8, 29. [Google Scholar] [CrossRef] [PubMed]
  20. Sundareswaran, K.; Kuruvinashetti, K.; Hariprasad, B.; Sankar, P.; Nayak, P.S.; Vigneshkumar, V. Optimization of Dual Input Buck Converter Control through Genetic Algorithm. IFAC Proc. Vol. 2014, 47, 142–146. [Google Scholar] [CrossRef]
  21. Sundareswaran, K.; Kuruvinashetti, K.; Gangadhar, I.; Sankar, P.; Nayak, P.S.; Vigneshkumar, V. Output Voltage Control and Power Management of a Dual Input Buck–Boost Converter Employing P&O Algorithm. IFAC Proc. Vol. 2014, 47, 1039–1043. [Google Scholar] [CrossRef]
  22. Bombelli, P.; Müller, T.; Herling, T.W.; Howe, C.J.; Knowles, T.P.J. A High Power-Density, Mediator-Free, Microfluidic Biophotovoltaic Device for Cyanobacterial Cells. Adv. Energy Mater. 2015, 5, 1401299. [Google Scholar] [CrossRef]
  23. Torabi, N.; Qiu, X.; López-Ortiz, M.; Loznik, M.; Herrmann, A.; Kermanpur, A.; Ashrafi, A.; Chiechi, R.C. Fullerenes Enhance Self-Assembly and Electron Injection of Photosystem I in Biophotovoltaic Devices. Langmuir 2021, 37, 11465–11473. [Google Scholar] [CrossRef] [PubMed]
  24. Mohammadifar, M.; Tahernia, M.; Choi, S. A Miniaturized, Self-Sustaining, and Integrable Bio-Solar Power System. Nano Energy 2020, 72, 104668. [Google Scholar] [CrossRef]
  25. Sekar, N.; Umasankar, Y.; Ramasamy, R.P. Photocurrent Generation by Immobilized Cyanobacteria via Direct Electron Transport in Photo-Bioelectrochemical Cells. Phys. Chem. Chem. Phys. 2014, 16, 7862–7871. [Google Scholar] [CrossRef]
  26. Masi, M.; Bollella, P.; Riedel, M.; Lisdat, F.; Katz, E. Photobiofuel Cell with Sustainable Energy Generation Based on Micro/Nanostructured Electrode Materials. ACS Appl. Energy Mater. 2020, 3, 9543–9549. [Google Scholar] [CrossRef]
  27. Liu, L.; Choi, S. Self-Sustainable, High-Power-Density Bio-Solar Cells for Lab-on-a-Chip Applications. Lab Chip 2017, 17, 3817–3825. [Google Scholar] [CrossRef] [PubMed]
  28. Liu, L.; Choi, S. A Paper-Based Biological Solar Cell. SLAS Technol. 2020, 25, 75–81. [Google Scholar] [CrossRef]
  29. Senthilkumar, N.; Sheet, S.; Sathishkumar, Y.; Lee, Y.S.; Phang, S.-M.; Periasamy, V.; Gnana Kumar, G. Titania/Reduced Graphene Oxide Composite Nanofibers for the Direct Extraction of Photosynthetic Electrons from Microalgae for Biophotovoltaic Cell Applications. Appl. Phys. A 2018, 124, 769. [Google Scholar] [CrossRef]
  30. Thong, C.-H.; Priyanga, N.; Ng, F.-L.; Pappathi, M.; Periasamy, V.; Phang, S.-M.; Kumar, G.G. Metal Organic Frameworks (MOFs) as Potential Anode Materials for Improving Power Generation from Algal Biophotovoltaic (BPV) Platforms. Catal. Today 2022, 397–399, 419–427. [Google Scholar] [CrossRef]
  31. Shahparnia, M.; Packirisamy, M.; Juneau, P.; Zazubovich, V. Micro Photosynthetic Power Cell for Power Generation from Photosynthesis of Algae. Technology 2015, 03, 119–126. [Google Scholar] [CrossRef]
  32. Ramanan, A.V.; Pakirisamy, M.; Williamson, S.S. Advanced Fabrication, Modeling, and Testing of a Microphotosynthetic Electrochemical Cell for Energy Harvesting Applications. IEEE Trans. Power Electron. 2015, 30, 1275–1285. [Google Scholar] [CrossRef]
  33. Thorne, R.; Hu, H.; Schneider, K.; Bombelli, P.; Fisher, A.; Peter, L.M.; Dent, A.; Cameron, P.J. Porous Ceramic Anode Materials for Photo-Microbial Fuel Cells. J. Mater. Chem. 2011, 21, 18055–18060. [Google Scholar] [CrossRef]
  34. Saper, G.; Kallmann, D.; Conzuelo, F.; Zhao, F.; Tóth, T.N.; Liveanu, V.; Meir, S.; Szymanski, J.; Aharoni, A.; Schuhmann, W.; et al. Live Cyanobacteria Produce Photocurrent and Hydrogen Using Both the Respiratory and Photosynthetic Systems. Nat. Commun. 2018, 9, 2168. [Google Scholar] [CrossRef]
  35. Schneider, K.; Thorne, R.J.; Cameron, P.J. An Investigation of Anode and Cathode Materials in Photomicrobial Fuel Cells. Philos. Trans. R. Soc. A Math. Phys. Eng. Sci. 2016, 374, 20150080. [Google Scholar] [CrossRef] [PubMed]
  36. Inglesby, A.E.; Yunus, K.; Fisher, A.C. In Situ Fluorescence and Electrochemical Monitoring of a Photosynthetic Microbial Fuel Cell. Phys. Chem. Chem. Phys. 2013, 15, 6903–6911. [Google Scholar] [CrossRef]
  37. Firoozabadi, H.; Mardanpour, M.M.; Motamedian, E. A System-Oriented Strategy to Enhance Electron Production of Synechocystis sp. PCC6803 in Bio-Photovoltaic Devices: Experimental and Modeling Insights. Sci. Rep. 2021, 11, 12294. [Google Scholar] [CrossRef]
  38. Cevik, E.; Tombuloglu, H.; Anıl, I.; Senel, M.; Sabit, H.; AbdulAzeez, S.; Borgio, J.F.; Barghouthi, M. Direct Electricity Production from Microalgae Choricystis sp. and Investigation of the Boron to Enhance the Electrogenic Activity. Int. J. Hydrogen Energy 2020, 45, 11330–11340. [Google Scholar] [CrossRef]
  39. Zhu, H.; Meng, H.; Zhang, W.; Gao, H.; Zhou, J.; Zhang, Y.; Li, Y. Development of a Longevous Two-Species Biophotovoltaics with Constrained Electron Flow. Nat. Commun. 2019, 10, 4282. [Google Scholar] [CrossRef] [PubMed]
  40. Gonzalez del Campo, A.; Perez, J.F.; Cañizares, P.; Rodrigo, M.A.; Fernandez, F.J.; Lobato, J. Characterization of Light/Dark Cycle and Long-Term Performance Test in a Photosynthetic Microbial Fuel Cell. Fuel 2015, 140, 209–216. [Google Scholar] [CrossRef]
  41. Ng, F.-L.; Jaafar, M.M.; Phang, S.-M.; Chan, Z.; Salleh, N.A.; Azmi, S.Z.; Yunus, K.; Fisher, A.C.; Periasamy, V. Reduced Graphene Oxide Anodes for Potential Application in Algae Biophotovoltaic Platforms. Sci. Rep. 2014, 4, 7562. [Google Scholar] [CrossRef] [PubMed]
  42. Gouveia, L.; Neves, C.; Sebastião, D.; Nobre, B.P.; Matos, C.T. Effect of Light on the Production of Bioelectricity and Added-Value Microalgae Biomass in a Photosynthetic Alga Microbial Fuel Cell. Bioresour. Technol. 2014, 154, 171–177. [Google Scholar] [CrossRef]
  43. Bradley, R.W.; Bombelli, P.; Lea-Smith, D.J.; Howe, C.J. Terminal Oxidase Mutants of the Cyanobacterium Synechocystis sp. PCC 6803 Show Increased Electrogenic Activity in Biological Photo-Voltaic Systems. Phys. Chem. Chem. Phys. 2013, 15, 13611–13618. [Google Scholar] [CrossRef] [PubMed]
  44. Luimstra, V.M.; Kennedy, S.-J.; Güttler, J.; Wood, S.A.; Williams, D.E.; Packer, M.A. A Cost-Effective Microbial Fuel Cell to Detect and Select for Photosynthetic Electrogenic Activity in Algae and Cyanobacteria. J. Appl. Phycol. 2014, 26, 15–23. [Google Scholar] [CrossRef]
  45. Madiraju, K.S.; Lyew, D.; Kok, R.; Raghavan, V. Carbon Neutral Electricity Production by Synechocystis sp. PCC6803 in a Microbial Fuel Cell. Bioresour. Technol. 2012, 110, 214–218. [Google Scholar] [CrossRef]
  46. Wu, Y.; Wang, Z.; Zheng, Y.; Xiao, Y.; Yang, Z.; Zhao, F. Light Intensity Affects the Performance of Photo Microbial Fuel Cells with Desmodesmus sp. A8 as Cathodic Microorganism. Appl. Energy 2014, 116, 86–90. [Google Scholar] [CrossRef]
  47. Bombelli, P.; Zarrouati, M.; Thorne, R.J.; Schneider, K.; Rowden, S.J.L.; Ali, A.; Yunus, K.; Cameron, P.J.; Fisher, A.C.; Ian Wilson, D.; et al. Surface Morphology and Surface Energy of Anode Materials Influence Power Outputs in a Multi-Channel Mediatorless Bio-Photovoltaic (BPV) System. Phys. Chem. Chem. Phys. 2012, 14, 12221. [Google Scholar] [CrossRef]
  48. Nishio, K.; Hashimoto, K.; Watanabe, K. Light/Electricity Conversion by a Self-Organized Photosynthetic Biofilm in a Single-Chamber Reactor. Appl. Microbiol. Biotechnol. 2010, 86, 957–964. [Google Scholar] [CrossRef]
  49. Gunaseelan, K.; Jadhav, D.A.; Gajalakshmi, S.; Pant, D. Blending of Microbial Inocula: An Effective Strategy for Performance Enhancement of Clayware Biophotovoltaics Microbial Fuel Cells. Bioresour. Technol. 2021, 323, 124564. [Google Scholar] [CrossRef]
Disclaimer/Publisher’s Note: The statements, opinions and data contained in all publications are solely those of the individual author(s) and contributor(s) and not of MDPI and/or the editor(s). MDPI and/or the editor(s) disclaim responsibility for any injury to people or property resulting from any ideas, methods, instructions or products referred to in the content.

Article Metrics

Citations

Article Access Statistics

Article metric data becomes available approximately 24 hours after publication online.