Abstract
The global adoption of solar-powered streetlights has grown significantly, driven by their cost-effectiveness and potential to reduce dependence on fossil fuels associated with conventional street lighting. Battery storage represents a substantial portion of the total capital cost in solar-powered streetlight systems. Therefore, selecting an efficient charge regulator is crucial to protect battery lifespan and reduce energy losses. In this context, the choice of an appropriate charge regulator plays a vital role in enhancing system reliability and overall performance. This study presents a practical approach for evaluating three commercially available 6 A-rated Pulse Width Modulation (PWM) solar charge regulators intended for recharging lead-acid batteries in a proposed 12 V off-grid solar photovoltaic (PV) street lighting system. The regulators were evaluated concurrently in separate circuits, each experiencing similar meteorological conditions, including similar temperature and solar irradiance. The measured data for each regulator were acquired using LabVIEW-based virtual instruments. The performance comparison was conducted using the Linear Regression Algorithm (LRA) to support decision-making. Based on the analysis, the most suitable PWM charge regulator was identified as the one offering the best charging performance due to low internal losses. Hence, solar battery charge regulators with identical load current ratings do not necessarily deliver equivalent charge/discharge performance.
1. Introduction
Globally, fossil fuels have been the main source of electricity generation. Hence, the rising energy demand led to global warming because of the emission of greenhouse gases. This necessitates the global need to minimize the reliance on fossil fuels. Outdoor lighting plays an important role in ensuring the safety and security of residents at night. The conventional outdoor streetlight puts severe pressure on the national grids since it consumes around 19% of electricity consumption around the world [1]. The answer to such challenges is to utilize solar renewable energy systems to minimize the fossil fuel electricity consumption. Solar renewable energy is gaining more popularity by reducing the reliance on fossil fuels around the world. If a utility company chooses to power streetlights with solar energy, this can lead to a reduction in greenhouse gas emissions, especially in countries that depend heavily on fossil fuels for electricity generation. This will not only benefit economically but also environmentally by minimizing the amount of emitted CO2 during electricity generation [2]. In this context, the application of small-scale solar PV systems in streetlighting systems is a solution to such environmental problems.
An off-grid solar-powered streetlight consists of several components, such as a solar PV panel, a battery storage system, a charge regulator, and a DC lighting unit. Energy from the sun is harnessed and converted into electrical energy using solar panels. Solar panels used in street lighting are typically installed at a fixed tilt angle, which is approximately equal to the latitude of the installation site [3]. The reason for not opting for a single-axis or dual-axis tracker is due to the complexity that introduces higher maintenance and capital costs. Modern DC solar-powered streetlights use light-emitting diodes (LEDs) as a source of light. The reason is due to the minimal operational costs and maximum reliability offered by LEDs compared to the conventional lamps [4]. LED lights with lower lumen output can effectively replace a conventional lamp with higher lumen output due to directionality and efficiency [5]. The LED-based solar-powered streetlight has proved to yield an energy savings capacity of around 40% compared to the traditional streetlight.
The battery is a crucial component of an off-grid solar streetlight system, representing a significant portion of the total capital investment. Therefore, the proper sizing, utilization, and management of the battery are essential strategies for minimizing system costs [6,7,8]. Lead-acid batteries remain a cost-effective choice for small-scale off-grid PV systems, offering lower upfront costs despite their shorter lifespan and maintenance requirements [9,10]. Additionally, lead acid has proved to have a low self-discharging rate and the ability to operate under variable temperatures [11]. Lead-acid batteries have proven to be a cost-effective option for budget-conscious projects, whereas lithium-ion batteries are more economical in hybrid systems involving multiple energy sources [12,13]. Under normal operating conditions, the aging of storage batteries is primarily attributed to four factors: deep discharging, overcharging, low electrolyte levels, and elevated temperatures [14,15].
Selection of a reliable battery charging strategy is important to ensure the longevity of a battery [7]. The reliability and longevity of a battery hinge on the quality of the charge regulator since the PV system and the load are primarily connected to the battery via the regulator. The charge regulator used in solar streetlights plays a critical role in charging the battery and discharging stored electricity to the load. The Pulse Width Modulation (PWM) type has been selected since it is the most cost-effective charge regulator used in small-scale solar PV systems applications as compared to the Maximum Power Point Tracker (MPPT) [16,17,18]. PWM charge controllers contain fewer electronic components than MPPT types, resulting in a longer lifespan and reduced thermal stress [19]. They are particularly well-suited for lead-acid batteries and off-grid solar PV systems. PWM technology offers an effective method for maintaining a consistent battery charging voltage [20]. These controllers support multi-stage charging—bulk, absorption, and float—which is essential for prolonging battery life [21]. In an off-grid solar PV street lighting system, the PWM charge regulator ensures safe battery charging by preventing overcharging, blocking reverse current flow during nighttime, and protecting the battery from deep discharge under load conditions.
An efficient charge regulator may extend the battery’s operating time before it reaches the disconnection threshold. Therefore, when selecting a charge regulator, an appropriate method is required to analyze the discharge rate (slope) of the battery during use. The Linear Regression Algorithm (LRA) is one of the simplest and most widely used techniques in machine learning for predictive modeling [22]. In this study, LRA is employed to monitor, analyze, and compare the battery discharge rates by processing the acquired performance data. The method is used to evaluate the relationship between one or more independent variables and a dependent variable by fitting the best straight line through the data, minimizing the sum of squared errors. Once the line is fitted, it can be used to predict the system’s future behavior based on the line equation. The slope of this line, which represents the discharge rate, is determined using the gradient descent method.
In this study, three 6 A-rated solar PWM charge regulator models were identified and selected based on their suitability for the intended application in the real-world off-grid solar street lighting project. These regulators were selected based on their local availability, compliance with the required 6 A rating, and affordability compared to more expensive models capable of supporting both DC and AC loads. All three feature reverse polarity protection and are compatible with 12 V systems. The higher-end unit offers a multifunctional LED display and automatic 12/24 V voltage detection, making it more versatile for slightly advanced system configurations. However, the primary challenge lies in identifying which regulator offers the best charging performance. Therefore, the main objective of the study is to practically test and compare the performance of these three charge regulators in charging the selected lead-acid battery size. Based on the results, the most efficient regulator will be recommended for bulk procurement and use in the project. The performance data will be acquired using the LABVIEW program, and the comparison will be carried out using the LRA method. The aim is not to propose a new predictive model, but to demonstrate how a simple, practical, and interpretable technique can be effectively applied to assess charge regulator performance using the linear region of the battery and aid in making informed choices during system design.
2. Pulse Width Modulation and Battery Operation
The operation of a PWM regulator is achieved using a switching circuit, which is often made up of MOSFETs and controlled by microcontrollers or a comparator circuit, as shown in Figure 1. Unlike the linear regulator, the control is achieved by rapidly turning the power ON and OFF. The duration of the ON time (duty cycle) determines how much energy is transferred into the battery, as shown in Equation (1).
where TON is the time the switch is ON; TOFF is the time the switch is OFF.
The PWM signal is a high-frequency square wave with a variable duty cycle, typically operating from a few kilohertz up to several hundred kilohertz [23]. During the bulk charging stage of a lead-acid battery, the duty cycle is maintained at 100% to enable rapid charging up to approximately 70–80% state of charge (SoC). In the absorption stage, the controller gradually reduces the duty cycle below 100% to limit the current as the battery approaches full charge [24]. During the float stage, the duty cycle is further decreased to supply a lower voltage and minimal current—just enough to compensate for the battery’s self-discharge. Battery protection features, such as prevention of overcharging, polarity reversal, and short-circuiting, further contribute to extending battery lifespan. Overcharge protection is achieved by gradually reducing the charging current as the battery nears full charge [19]. Optimal battery charging is maintained by rapidly switching the power on and off to modulate the output voltage according to the battery’s needs. Hence, the energy losses are minimal compared to the linear regulators, and the chances for overheating are minimal.
Although batteries inherently exhibit nonlinear charging and discharging behavior due to factors such as increasing electrolyte resistance and temperature fluctuations [25], a linear approximation can still offer valuable insights under controlled conditions. As the SoC decreases, the discharge rate increases for the given power consumption to exhibit a nonlinear behavior. However, batteries have also been shown to exhibit linear characteristics, particularly during the initial stages of discharge from full SoC to partial SoC [26,27,28]. As the discharge process progresses, nonlinearity becomes more pronounced, especially at low SoC levels, as denoted by the hyperbolic region in Figure 2. Therefore, when measurements are taken over a short duration of time and a battery supplying less current to the load, its behavior can often be reasonably approximated as linear. In this study, the batteries used are new, with an assumed state of health of 100%, meaning the onset of nonlinear behavior is delayed, especially under constant low load current before reaching the knee-point [27]. Hence, LRA is suitable for assessing and comparing the relative differences in slope, representing the rate of change in battery voltage.

Figure 1.
Block diagram of a PWM charge regulator [24].
Figure 1.
Block diagram of a PWM charge regulator [24].


Figure 2.
Load terminal voltage versus SoC under different constant current discharge rates [28].
Figure 2.
Load terminal voltage versus SoC under different constant current discharge rates [28].

Estimating the State of Charge (SoC) is a critical function in battery management systems (BMS), as it helps prevent both overcharging and over-discharging of batteries. Several techniques are used for SoC estimation, including direct measurement methods (which are not model-based), black-box estimation approaches, and state-space model-based methods [29]. Direct measurement techniques include coulomb counting, open circuit voltage (OCV) measurement, internal resistance analysis, discharge testing, and voltage change analysis (also known as the EMF prediction method) [29]. The coulomb counting method, while widely used, requires frequent calibration due to the high precision needed in current sensing, which is susceptible to sensor errors [28].
As previously discussed, the battery voltage curve can be divided into two regions: a linear region, corresponding to full-to-partial SoC, and a hyperbolic region, representing partial-to-low SoC. The impedance-based method has limitations, as battery impedance is affected by both temperature and aging. However, this method becomes more suitable at lower SoC levels, where the battery operates in the nonlinear region [28]. In contrast, during the linear region of operation, the terminal voltage is approximately proportional to the EMF. Therefore, under a constant load current, the terminal voltage can be used to estimate the EMF voltage without relying on impedance measurements. This predicted EMF voltage can then be used to estimate the SoC of the battery. Unlike lithium-ion batteries, lead-acid batteries exhibit a linear relationship between EMF voltage and SoC, particularly from full to partial SoC. As a result, the EMF prediction method can provide accurate SoC estimations during constant current discharge conditions [28,30]. Thus, in the full-to-partial SoC range, terminal voltage can be effectively used to track the battery’s discharge rate, as the battery operates within the linear region of its voltage curve. In such a context, the terminal voltage slope determined using LRA acts as a performance indicator of the discharging rate, not a battery model. The LRA has proved to be capable of monitoring and predicting the battery power as well as the battery state of health [27,31,32].
3. Materials and Methods
The planning of solar PV streetlight encompasses various aspects such as appropriate solar PV panel size, optimal tilt angle, energy storage size, and a suitable charge regulator. The study area of Bloemfontein, South Africa, is situated within Latitudes 29°7′6.06″ South and Longitude 26°13′29.71″ East. The average annual solar radiation is about 5.86 kWh/m2/day, which ranges from a minimum of 3.75 kWh/m2/day in winter to a maximum of 8.03 kWh/m2/day in summer [33]. The electrical power output of a solar PV panel is directly dependent on the level of solar irradiance at the installation site, as described by Equation (2) [34].
where ɳpv is the efficiency of the solar PV panel; Apv is the panel surface area (m2); G(t) is the solar irradiance (kW/m2).
3.1. Material
In this study, an 80 W solar PV panel with an open circuit voltage (Voc) of 21.6 V and short circuit current (Isc) of 4.76 A has been used, as shown in Table 1. At normal operating cell temperature (NOCT), the solar PV panel’s maximum power voltage (Vmp) and maximum power current (Imp) are 18 V and 4.44 A, respectively. The dimensions of the solar PV panel are 780 × 670 × 30 mm.

Table 1.
System components to be connected to the charge regulators.
In this study, a 44 W LED lamp is selected for each streetlight since a 36 W LED has proved to offer the required luminance flux at an installation height of 4–7 m [35]. Hence, the total daily energy consumption of each streetlight is determined to be 528 Wh for a total cumulative illumination time of 12 h. For a 12 V battery system, the total current consumption of each streetlight is 3.76 A (44 W/12 V).
Energy storage process is achieved using a charge regulator since it regulates the flow of energy to the battery and to the load. The charge regulators to be used in this study are a series of PWM types, as shown in Table 2. PWM has proved to be cost-effective for smaller solar arrays and offers high conversion efficiency [16]. To ensure proper sizing of the PWM, the voltage rating of the charger should not exceed or match the system voltage of the array. The amperage rating should be sufficient to handle the maximum current produced by the solar panel. Hence, to ensure that the current rating is sufficient to handle the maximum current produced by the solar PV panel and to incorporate a 25% safety margin, the required amperage rating is then calculated as follows [36]:
Table 2.
Solar PWM charge regulators.
Given that the short-circuit current (Isc) of the selected solar PV panel is 4.76 A, the charge regulator should have a current rating of approximately 5.95 A (rounded up to 6 A) to accommodate potential power fluctuations and surges. The three cost-effective (cheaper to buy) and suitable 6 A 4-stage PWM charge regulators were identified for this purpose, namely, Charge regulator A: Morningstar Sunsaver (SS-6L-12 V 6 A) is manufactured by Morningstar Corporation, located at Newtown, PA, USA, Charge regulator B: Morningstar Sunguard (SK-6 6 A/12 V) is manufactured by Morningstar Corporation, located at Newtown, PA, USA, Charge regulator C: Steca Solar charge regulator (Solsum 6.6F 12/24 V, 6 A) is manufactured by Steca GmbH, located at Memmingen, Bavaria, Germany and are as shown in Table 2. All three charge regulators can handle a maximum voltage of 30 V, which exceeds the solar panel’s open-circuit voltage, as detailed in Table 1, below. The selected PWM batteries are all compatible with lead-acid or NiCd batteries.
To size the lead acid battery to be used (in Ah unit), the total energy consumption of the load, the desired autonomy days, as well as the Depth of Discharge (DoD) needs to be considered. Hence, the size of the required battery can be determined as follows [37,38]:
The efficiency of the lead-acid battery is assumed to be 85% at a DoD of 50% [38,39]. In this study, a 12 V, 100 Ah sealed lead acid battery has been selected to meet the lighting demand at an autonomy of 1 day since the conventional outdoor streetlight will be used as back-up during insufficient solar radiation (e.g., during rainy or cloudy days). Installing streetlights without removing the existing conventional grid-powered streetlights can reduce battery costs. Hence, better economic returns are ensured because of backup reliability and reduced street lighting grid consumption during sunny days.
3.2. Method
The experimental setup of the off-grid, solar-powered LED lighting system is illustrated in Figure 3. The objective is to assess the combined charging and discharging performance of each charge regulator operating in an independent circuit. Three 12 V, 100 Ah sealed lead-acid batteries are used to assess the performance of three different PWM charge regulators rated 6 A, as listed in Table 2. The aim is to select the best charge regulator to be used for the solar-powered streetlight. The tests are conducted simultaneously under uniform meteorological conditions, such as the same temperature and solar irradiance. This methodology enhances the reliability of the results and supports the validation of simulation findings. The experiment was carried out during the winter season, representing a worst-case scenario due to reduced solar irradiance. Three identical 80 Wp solar PV panels have been used to generate electricity for each circuit. Given that the study site is located at a latitude of 29°7′6.06″ South and a longitude of 26°13′29.71″ East, the panels are installed at an optimal tilt angle of 30° facing true North, closely aligned with the site’s latitude (≈29.118°). This is a rule of thumb for fixed solar panels in order to ensure optimal year-round performance during solar energy capturing [40]. All three batteries were verified to be in a fully charged state prior to connecting the 44 W LED lighting load. To confirm this, the no-load terminal voltage of each battery was measured using a multimeter and found to be approximately 12.7 V, revealing a fully charged condition.
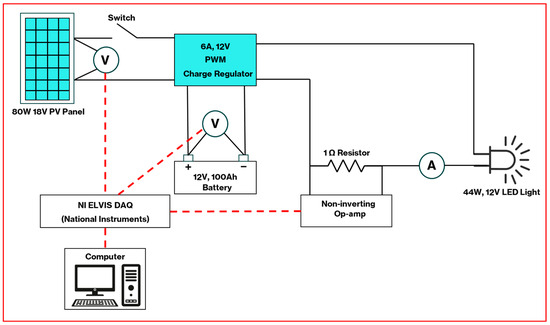
Figure 3.
Experimental setup of the solar-powered street-lighting system.
In this study, the LabVIEW real-time interface program has been used to measure the real-time output voltage of the solar PV panel, battery voltage, as well as the load current, as shown in Figure 3. LabVIEW uses graphical blocks to represent the source code of a program, as shown in Figure 4. The sample has been measured in a time step of 1.5 min (90,000 ms) for a 2 h snapshot using a virtual instrument Data Acquisition (DAQ). Hence, 82 data points were collected for each charge regulator circuit.
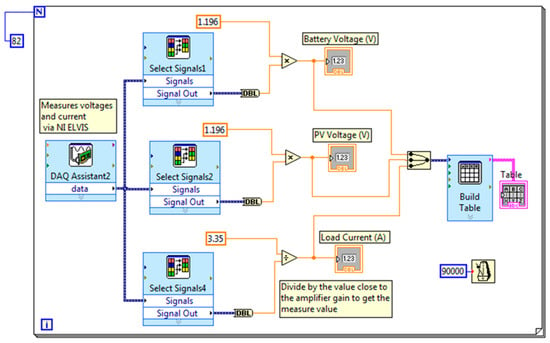
Figure 4.
A Virtual Instrument LabView block diagram developed to acquire data.
As illustrated in Figure 4, the LabVIEW DAQ system was developed to measure the battery and PV voltage as well as the current consumed by a 44 W LED load via the NI ELVIS prototype board. During voltage measurements, two external voltmeters were used to verify the voltage measurements obtained from the LabVIEW DAQ system. During verification, the battery and PV voltages were adjusted using a calibration scaling factor of 1.196 to align with the actual measured values. The applied calibration scaling factor ensured close agreement between the acquired data and the measured values. To measure the load current, a simple 741 non-inverting op-amp circuit with a gain of 3.2 (Gain = R2/R1 + 1) on an NI ELVIS prototype board was used, as shown in Figure 5.
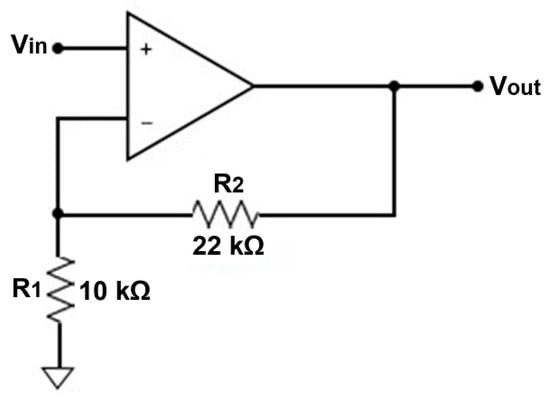
Figure 5.
Non-inverting op-amp circuit for measuring the current.
The op-amp circuit was employed to amplify the low-voltage signal developed across a series 1 Ω resistor, as illustrated in Figure 3. This voltage signal represents the load current in accordance with Ohm’s Law, given the known resistance value of 1 Ω. An external ammeter was used to verify the accuracy of the current measured by the LabVIEW DAQ system. To obtain the actual load current, the amplified signal was divided by a calibration scaling factor approximately equal to the amplifier gain (3.35), as shown in Figure 4. The results demonstrated a close agreement between the externally measured current and the current acquired by the DAQ system.
4. Results and Discussion
The comparison process began by selecting three commercially available 6 A-rated solar charge regulators to be applied to recharge the lead-acid battery of a 12 V off-grid solar photovoltaic (PV) street lighting system. The experiment was conducted during the winter season as a worst-case scenario. The minimum average solar irradiation at the installation site is approximately 3.75 kWh/m2/day during the winter season. The indoor ambient temperature was recorded to be around 15.1 °C, which falls within the specified operating temperature range for all three charge regulators. LabVIEW real-time interface program was then used to acquire the real-time output voltage of the solar PV panel, battery voltage as well as the load current. The acquired data was validated through practical measurements, which confirmed consistency between the measured and acquired values through the calibration process. After acquiring 2 h of data in a sample of 1.5 min (as shown in Table A1), the snapshots of regulators’ performances are analyzed and compared. The comparison results are shown in Figure 6, Figure 7 and Figure 8 below. As previously mentioned, when measurements are taken over a short time window starting from a 100% SoC, battery behavior can often be approximated as linear. This is because the most significant nonlinear effects typically arise at lower SoC levels. Furthermore, since new batteries were used in this study, their state of health is assumed to be 100%, which delays the onset of nonlinear behavior. Another contributing factor is the low discharge current drawn from the batteries, as the solar PV panels also contribute to supplying current to the load. This further reduces the rate at which the battery transitions into nonlinear response regions. Given these conditions, the use of the Linear Regression Algorithm (LRA) is appropriate for comparing the relative slope differences in battery voltage across the charge regulators (i.e., the rate of change in battery voltage). In this context, the slope derived from LRA serves as a performance indicator for each charge regulator rather than a detailed model of battery behavior. It is also important to note that using new batteries is critical when comparing charge regulator performance. Previous studies [41,42] have shown that as batteries age, nonlinearity becomes more pronounced due to capacity loss and increased internal impedance from repeated charge–discharge cycles.
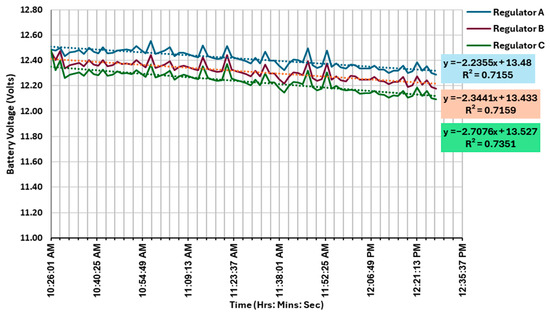
Figure 6.
Battery discharge rate graphs with fitted linear regression lines.
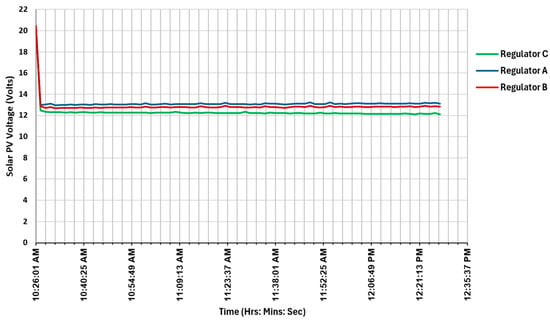
Figure 7.
Solar PV voltage before and after connecting the load.
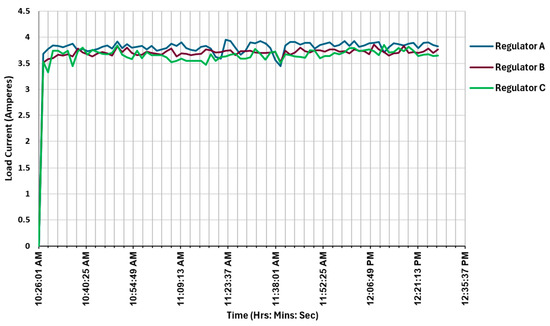
Figure 8.
Load current.
Solar PV module receives sunlight and converts it into electricity. The generated current will then be supplied to the battery and load via the PWM solar charge regulator, which has proved to be cost-effective for smaller solar array projects [16,17,18]. The charge regulator is designed to control the DC voltage and current from the solar panel to the battery to ensure safe charging and discharge.
Figure 6, Figure 7 and Figure 8 present the battery voltage, solar PV voltage, and load current data as acquired simultaneously via LabVIEW for each PWM charge regulator. Prior to switching on the LED lighting load, battery voltages were measured at 10:26:01 a.m. to verify that all batteries are in a fully charged state, as shown in Figure 6. Hence, the open-circuit battery voltage in each circuit was approximately 12.48 V since they are in a fully charged state. The corresponding open-circuit voltage across each solar panel was around 20 V, namely 20.21425808 V, 20.033674 V, and 20.166225 V, respectively, as shown in Table A1 and Figure 7, since no load was connected. Following confirmation of the batteries’ fully charged condition, all three charge regulator circuits were simultaneously activated to supply power to their respective loads for a duration of two hours, during which data was recorded.
As shown in Figure 6, when the load is connected, the battery voltage fluctuates to represent charging and discharging activity as a result of a change in solar irradiance due to partly cloudy conditions. During the winter season, when solar radiation is limited, the observed decline in battery voltage indicates that the solar PV panel is unable to meet the full load demand on its own. Hence, the batteries discharge to compensate for the energy deficit. This discharging process occurs under all three charge regulators. To compare their discharge performance, the Linear Regression Analysis (LRA) method is applied to analyze the gradients of the battery voltage curves. The linear line (trendline) for each regulator is shown by the dashed lines as determined from data series. In this context, a steeper slope corresponds to a more rapid discharge rate, thereby providing a quantitative basis for performance comparison. The comparison indicates that regulator A exhibits a more favorable gradient of −2.2355, suggesting a slower battery discharge rate compared to the other two charge regulators. Such performance is attributed to lower internal losses, likely due to reduced idle current consumption. This represents that regulator A offers the best charging performance as compared to the other two charge regulators.
As shown in Figure 8, all three charge regulators consistently supply current to the lighting load at levels approaching the full-load current of 3.76 A. Minor fluctuations in the supplied current are attributed to variations in solar irradiance. Regulator A delivers a slightly higher current to the load, attributed to its superior conversion efficiency. Figure 7 illustrates the solar PV voltage for each charge regulator circuit. Since solar module voltage is directly proportional to solar irradiance, an increase in irradiance is observed as the day progresses from 10:26 a.m. to 12:27 p.m. [43]. Fluctuations in irradiance due to intermittent cloud cover are also noted. Despite these variations, Figure 7 shows that the solar PV voltage remains relatively stable, which is characteristic of PWM charge regulators. Unlike the MPPT type, the PWM regulators regulate the PV module voltage to remain close to the battery voltage [44].
To evaluate if regulator A consistently offers the best charging performance throughout all 82 data points (10:26 a.m. to 12:27 p.m.), the slopes are determined in steps of 10 samples, as shown in Table 3. The slope (m) and Pearson correlation coefficient (R2) are determined using the relationship between the scalar variable (Y) and explanatory variables denoted by (X) using Equations (5) and (6) [45]. To represent a strong linear relationship, the golden rule is to allow the coefficient of determination, R2, to lie between 0.7 and 1 [46]. Hence, the more the data points, the R2 increases until it reaches a value of above 0.7 to represent a strong linear relationship for all the charge regulators.
Table 3.
Slope and Coefficient of Determination in steps of 10 data points.
As shown in Table 3, the absolute value of the slope (m) for regulator A (Sunsaver SS-6L) is consistently lower than that of the other two regulators across all data points. As the number of data points increases, R2 also increases until it rises above 0.7 (70%), indicating a strong linear relationship and thereby strengthening the validity of the comparison. Hence, charge regulator A has been determined to be the most suitable 6 A PWM charge regulator for the proposed project and is therefore recommended for bulk procurement, owing to its best charging performance compared to the other regulators evaluated.
5. Conclusions
This study presents a practical and data-driven methodology for selecting an efficient PWM solar charge regulator for use in a real-world off-grid solar PV streetlight configuration. The primary objective was to address the challenge of identifying the most suitable regulator among the three commercially available selected units with identical load current ratings, particularly when manufacturers do not provide efficiency specifications in the data sheets. Data acquisition was performed using LabVIEW-based virtual instrumentation to analyze battery charge/discharge behavior over time. Linear Regression Algorithm (LRA) has proved to be suitable to analyze battery discharge performance only in the linear SoC region of the voltage curve.
All three charge regulators consistently delivered current to the lighting load at levels nearing the full-load current of 3.76 A as tests were conducted simultaneously under similar environmental conditions to minimize comparative measurement errors. However, their battery discharge rates varied significantly. The discharge slope reflects the rate of battery voltage decline under constant load, providing a useful indication of how much current is drawn from the battery relative to the charging contribution from the regulator. This is a reasonable proxy for internal losses and voltage drop. A steeper slope suggests higher net discharge, while a flatter slope indicates more effective energy retention. This LRA resulted in the identification of the best charge regulator, characterized by low internal losses. This regulator demonstrated the slowest discharge rate (i.e., the least negative voltage gradient of −2.235 as compared to −2.344 and −2.708 offered by other charge regulators) as a result of the lowest voltage drop. These characteristics make it the most suitable option for enhancing the performance and reliability of small-scale off-grid solar PV systems.
The study has identified the following future gaps:
- 1.
- For long-term systems optimization, a more comprehensive efficiency analysis that incorporates coulombic efficiency, energy balance over time, and idle current measurement should be undertaken to study the nonlinear behavior.
- 2.
- Incorporating a full GUM-based analysis for uncertainty in future extended studies, particularly those involving long-term field data or model-based performance extrapolation.
- 3.
- While this study focuses on PWM regulators, the results should not be generalized to all types of charge regulators. Hence, future work will include benchmarking other regulator types, such as MPPT regulators, for further validation.
- 4.
- Additionally, further testing using various battery chemistries—such as Lithium-ion, Nickel-Cadmium (Ni-Cd), and Nickel-Metal Hydride (Ni-MH)—is recommended to study optimal compatibility and system performance in a small-scale solar project.
- 5.
- A future study will be conducted to study the impact of seasonal variations on the performance of the PWM charge regulators.
Author Contributions
Conceptualization, S.P.K., M.S. and X.P.Y.; methodology, S.P.K. and X.P.Y.; software, S.P.K. and X.P.Y.; validation, M.S. and X.P.Y.; formal analysis, S.P.K., M.S. and X.P.Y.; investigation, S.P.K. and X.P.Y.; resources, M.S.; data curation, S.P.K. and X.P.Y.; writing—original draft preparation, S.P.K., M.S. and X.P.Y.; writing—review and editing, S.P.K., M.S. and X.P.Y. All authors have read and agreed to the published version of the manuscript.
Funding
This research received no external funding.
Data Availability Statement
The data supporting the conclusions of this article has been made available by the authors.
Acknowledgments
The authors (Sandile Phillip Koko, Mbuyu Sumbwanyambe, Xolani Phillips Yokwana) would like to thank the University of South Africa for administrative and technical support during the preparation of this study.
Conflicts of Interest
The authors declare no conflicts of interest.
Abbreviations
The following abbreviations are used in this manuscript:
| CO2 | Carbon dioxide |
| DAQ | Data acquisition |
| DoD | Depth of discharge |
| GUM | Guide to the Expression of Uncertainty in Measurement |
| LEDs | Light-emitting diodes |
| LRA | Linear regression algorithm |
| MPPT | Maximum power point tracker |
| NOCT | Normal operating cell temperature |
| PWM | Pulse width modulation |
Appendix A
Table A1.
Data points of voltages and current measurement.
Table A1.
Data points of voltages and current measurement.
| Solsum 6.6F | Sunguard SK-6 | Sunsaver SS-6L | |||||||
|---|---|---|---|---|---|---|---|---|---|
| Time | Battery | PV | Load | Battery | PV | Load | Battery | PV | Load |
| H: Min: S | Voltage | Voltage | Current | Voltage | Voltage | Current | Voltage | Voltage | Current |
| (V) | (V) | (A) | (V) | (V) | (A) | (V) | (V) | (A) | |
| 10:26:01 a.m. | 12.474614 | 20.457887 | 0.000161 | 12.482836 | 20.214258 | 0.000180 | 12.488137 | 20.324011 | 0.000090 |
| 10:27:24 a.m. | 12.401295 | 12.882287 | 3.510339 | 12.325702 | 12.447423 | 3.528563 | 12.479800 | 13.000150 | 3.679366 |
| 10:28:54 a.m. | 12.473582 | 12.723818 | 3.577161 | 12.397549 | 12.346145 | 3.324453 | 12.502662 | 13.016042 | 3.779010 |
| 10:30:24 a.m. | 12.337040 | 12.801710 | 3.596600 | 12.261839 | 12.309397 | 3.742393 | 12.435035 | 13.095684 | 3.841944 |
| 10:31:54 a.m. | 12.365597 | 12.665259 | 3.662206 | 12.290222 | 12.295954 | 3.737533 | 12.463819 | 12.956063 | 3.831454 |
| 10:33:24 a.m. | 12.370952 | 12.698255 | 3.645197 | 12.295544 | 12.293264 | 3.681646 | 12.469217 | 12.989793 | 3.805233 |
| 10:34:54 a.m. | 12.382554 | 12.707446 | 3.675571 | 12.307075 | 12.277132 | 3.744822 | 12.480910 | 12.999159 | 3.844566 |
| 10:36:24 a.m. | 12.355780 | 12.723051 | 3.634263 | 12.280465 | 12.294161 | 3.448377 | 12.453924 | 13.015093 | 3.873410 |
| 10:37:54 a.m. | 12.402187 | 12.699225 | 3.786130 | 12.326589 | 12.269066 | 3.733888 | 12.500699 | 12.990689 | 3.743611 |
| 10:39:24 a.m. | 12.369168 | 12.750624 | 3.708374 | 12.293771 | 12.298643 | 3.797065 | 12.467418 | 13.043230 | 3.777699 |
| 10:40:54 a.m. | 12.358458 | 12.720364 | 3.678001 | 12.283126 | 12.289680 | 3.668281 | 12.456623 | 13.012244 | 3.730499 |
| 10:42:24 a.m. | 12.404864 | 12.713032 | 3.633048 | 12.329250 | 12.269066 | 3.755757 | 12.503398 | 13.004715 | 3.752789 |
| 10:43:54 a.m. | 12.356673 | 12.764471 | 3.688935 | 12.281352 | 12.269962 | 3.714449 | 12.454824 | 13.057298 | 3.772455 |
| 10:45:24 a.m. | 12.362028 | 12.718566 | 3.718094 | 12.286675 | 12.304916 | 3.679216 | 12.460222 | 13.010309 | 3.819654 |
| 10:46:54 a.m. | 12.391240 | 12.740369 | 3.693795 | 12.315709 | 12.254725 | 3.676786 | 12.477312 | 13.032577 | 3.843255 |
| 10:48:24 a.m. | 12.371588 | 12.761540 | 3.645197 | 12.296176 | 12.260103 | 3.701085 | 12.482191 | 13.054199 | 3.785565 |
| 10:49:54 a.m. | 12.375161 | 12.744990 | 3.824729 | 12.299727 | 12.265480 | 3.845662 | 12.485796 | 13.037235 | 3.917987 |
| 10:51:24 a.m. | 12.366228 | 12.752360 | 3.716879 | 12.290848 | 12.282510 | 3.668281 | 12.476783 | 13.044743 | 3.796055 |
| 10:52:54 a.m. | 12.401067 | 12.746840 | 3.798280 | 12.325475 | 12.268169 | 3.618469 | 12.511934 | 13.039065 | 3.866854 |
| 10:54:24 a.m. | 12.373374 | 12.786451 | 3.695010 | 12.297951 | 12.277132 | 3.579591 | 12.483994 | 13.079551 | 3.797366 |
| 10:55:54 a.m. | 12.346575 | 12.761580 | 3.660992 | 12.271316 | 12.258310 | 3.741178 | 12.456955 | 13.054084 | 3.814410 |
| 10:57:24 a.m. | 12.442160 | 12.737629 | 3.664636 | 12.366318 | 12.269962 | 3.597815 | 12.553394 | 13.029544 | 3.832765 |
| 10:58:54 a.m. | 12.343001 | 12.839953 | 3.720524 | 12.267764 | 12.261896 | 3.718094 | 12.453349 | 13.134179 | 3.765899 |
| 11:00:24 a.m. | 12.353722 | 12.741299 | 3.697440 | 12.278419 | 12.226045 | 3.653702 | 12.464165 | 13.033237 | 3.831454 |
| 11:01:54 a.m. | 12.368014 | 12.756050 | 3.681646 | 12.292624 | 12.269962 | 3.654917 | 12.478585 | 13.048293 | 3.739677 |
| 11:03:24 a.m. | 12.393920 | 12.774491 | 3.669496 | 12.318372 | 12.281613 | 3.658562 | 12.504723 | 13.067128 | 3.769833 |
| 11:04:54 a.m. | 12.322455 | 12.804952 | 3.736318 | 12.247343 | 12.277132 | 3.612394 | 12.432619 | 13.098247 | 3.794744 |
| 11:06:24 a.m. | 12.351042 | 12.734789 | 3.780056 | 12.275755 | 12.259206 | 3.522488 | 12.461461 | 13.026447 | 3.878654 |
| 11:07:54 a.m. | 12.357754 | 12.780639 | 3.628188 | 12.286120 | 12.337182 | 3.551177 | 12.459659 | 13.073320 | 3.836699 |
| 11:09:24 a.m. | 12.346133 | 12.782481 | 3.692580 | 12.274566 | 12.254725 | 3.592297 | 12.447942 | 13.075167 | 3.902254 |
| 11:10:54 a.m. | 12.332723 | 12.774142 | 3.682860 | 12.261234 | 12.236800 | 3.551177 | 12.434422 | 13.066605 | 3.789500 |
| 11:12:24 a.m. | 12.322891 | 12.763941 | 3.656132 | 12.251459 | 12.236800 | 3.551177 | 12.424508 | 13.056143 | 3.759344 |
| 11:13:54 a.m. | 12.427481 | 12.757444 | 3.676786 | 12.355442 | 12.257415 | 3.551177 | 12.519961 | 13.049461 | 3.739677 |
| 11:15:24 a.m. | 12.333618 | 12.869432 | 3.680431 | 12.262123 | 12.206327 | 3.551177 | 12.435323 | 13.163977 | 3.817032 |
| 11:16:54 a.m. | 12.321102 | 12.775903 | 3.769121 | 12.249680 | 12.243970 | 3.471351 | 12.422705 | 13.068282 | 3.831454 |
| 11:18:24 a.m. | 12.312163 | 12.766613 | 3.747252 | 12.240793 | 12.243970 | 3.676072 | 12.413692 | 13.058747 | 3.784254 |
| 11:19:54 a.m. | 12.314845 | 12.761027 | 3.705944 | 12.243460 | 12.239489 | 3.548679 | 12.416396 | 13.052997 | 3.620367 |
| 11:21:24 a.m. | 12.442677 | 12.767483 | 3.718094 | 12.370551 | 12.237696 | 3.622367 | 12.515282 | 13.059566 | 3.588900 |
| 11:22:54 a.m. | 12.327360 | 12.903719 | 3.741178 | 12.255902 | 12.217082 | 3.629861 | 12.429015 | 13.198892 | 3.956009 |
| 11:24:24 a.m. | 12.313951 | 12.787804 | 3.746037 | 12.242570 | 12.229629 | 3.663582 | 12.415494 | 13.080295 | 3.925855 |
| 11:25:54 a.m. | 12.305012 | 12.777573 | 3.653702 | 12.233683 | 12.230526 | 3.678571 | 12.406481 | 13.069791 | 3.803922 |
| 11:27:24 a.m. | 12.292497 | 12.771966 | 3.736318 | 12.221241 | 12.242178 | 3.589894 | 12.393864 | 13.064025 | 3.664945 |
| 11:28:54 a.m. | 12.273725 | 12.762646 | 3.730243 | 12.202577 | 12.332701 | 3.589894 | 12.374936 | 13.054457 | 3.743611 |
| 11:30:24 a.m. | 12.318421 | 12.746808 | 3.743607 | 12.247015 | 12.211705 | 3.618621 | 12.420002 | 13.038233 | 3.898321 |
| 11:31:54 a.m. | 12.274618 | 12.796902 | 3.704729 | 12.203465 | 12.232319 | 3.777238 | 12.375837 | 13.089440 | 3.883899 |
| 11:33:24 a.m. | 12.368481 | 12.755066 | 3.696225 | 12.296785 | 12.211705 | 3.683566 | 12.470474 | 13.046608 | 3.929788 |
| 11:34:54 a.m. | 12.296072 | 12.856286 | 3.695010 | 12.224796 | 12.176750 | 3.573658 | 12.399919 | 13.163109 | 3.883899 |
| 11:36:24 a.m. | 12.296072 | 12.784687 | 3.708374 | 12.224796 | 12.262792 | 3.704798 | 12.399919 | 13.089771 | 3.793433 |
| 11:37:54 a.m. | 12.254058 | 12.788361 | 3.713234 | 12.183024 | 12.209015 | 3.724781 | 12.357549 | 13.093495 | 3.567923 |
| 11:39:24 a.m. | 12.218301 | 12.748316 | 3.519309 | 12.147475 | 12.203638 | 3.509190 | 12.321490 | 13.052465 | 3.444679 |
| 11:40:54 a.m. | 12.271043 | 12.714758 | 3.738748 | 12.199911 | 12.219771 | 3.673574 | 12.374677 | 13.018078 | 3.844566 |
| 11:42:24 a.m. | 12.304796 | 12.773302 | 3.664636 | 12.231017 | 12.200949 | 3.661085 | 12.406229 | 13.077987 | 3.914054 |
| 11:43:54 a.m. | 12.300325 | 12.809542 | 3.703514 | 12.226573 | 12.211705 | 3.629861 | 12.401721 | 13.115057 | 3.906187 |
| 11:45:24 a.m. | 12.285126 | 12.808560 | 3.804354 | 12.211465 | 12.203638 | 3.626114 | 12.386397 | 13.114015 | 3.858988 |
| 11:46:54 a.m. | 12.394207 | 12.796396 | 3.730243 | 12.319892 | 12.195571 | 3.606130 | 12.496377 | 13.101529 | 3.893077 |
| 11:48:24 a.m. | 12.263667 | 12.913707 | 3.704729 | 12.190134 | 12.180335 | 3.747263 | 12.364761 | 13.221611 | 3.889143 |
| 11:49:54 a.m. | 12.239527 | 12.781358 | 3.752112 | 12.166139 | 12.192883 | 3.741018 | 12.340422 | 13.086069 | 3.784254 |
| 11:51:24 a.m. | 12.252044 | 12.759842 | 3.753327 | 12.178581 | 12.265480 | 3.594890 | 12.353042 | 13.064015 | 3.855054 |
| 11:52:54 a.m. | 12.378113 | 12.776551 | 3.726598 | 12.303895 | 12.182128 | 3.642350 | 12.480151 | 13.081084 | 3.873410 |
| 11:54:24 a.m. | 12.249361 | 12.911703 | 3.763047 | 12.175914 | 12.191987 | 3.636106 | 12.350337 | 13.219431 | 3.903565 |
| 11:55:54 a.m. | 12.273336 | 12.781054 | 3.763047 | 12.199139 | 12.214394 | 3.702301 | 12.375324 | 13.085636 | 3.824899 |
| 11:57:24 a.m. | 12.244891 | 12.809097 | 3.722953 | 12.171471 | 12.165099 | 3.676072 | 12.345830 | 13.115827 | 3.852432 |
| 11:58:54 a.m. | 12.236844 | 12.783695 | 3.730243 | 12.163472 | 12.186610 | 3.713541 | 12.337717 | 13.088274 | 3.928477 |
| 12:00:24 p.m. | 12.277575 | 12.791576 | 3.693795 | 12.167817 | 12.190194 | 3.794723 | 12.366564 | 13.096293 | 3.835388 |
| 12:01:54 p.m. | 12.275785 | 12.825137 | 3.767906 | 12.166043 | 12.163306 | 3.790976 | 12.364761 | 13.130630 | 3.925855 |
| 12:03:24 p.m. | 12.248936 | 12.826930 | 3.744822 | 12.139434 | 12.163306 | 3.733524 | 12.337717 | 13.132432 | 3.820966 |
| 12:04:54 p.m. | 12.249830 | 12.802527 | 3.731458 | 12.140320 | 12.162410 | 3.747263 | 12.338618 | 13.107416 | 3.841944 |
| 12:06:24 p.m. | 12.249830 | 12.807116 | 3.671926 | 12.140320 | 12.153447 | 3.765997 | 12.338618 | 13.112082 | 3.883899 |
| 12:07:54 p.m. | 12.269521 | 12.810773 | 3.863887 | 12.159835 | 12.156136 | 3.736022 | 12.358451 | 13.115790 | 3.891766 |
| 12:09:24 p.m. | 12.240880 | 12.835024 | 3.769121 | 12.131451 | 12.154343 | 3.661085 | 12.329603 | 13.140586 | 3.911432 |
| 12:10:54 p.m. | 12.237301 | 12.808706 | 3.713234 | 12.127903 | 12.153447 | 3.853424 | 12.325998 | 13.113618 | 3.709522 |
| 12:12:24 p.m. | 12.214926 | 12.808615 | 3.647627 | 12.105728 | 12.132833 | 3.711043 | 12.303460 | 13.113488 | 3.806544 |
| 12:13:54 p.m. | 12.231931 | 12.788841 | 3.693795 | 12.122581 | 12.141796 | 3.716039 | 12.320588 | 13.093208 | 3.883899 |
| 12:15:24 p.m. | 12.229246 | 12.810287 | 3.697440 | 12.119920 | 12.130144 | 3.789727 | 12.317884 | 13.115139 | 3.870787 |
| 12:16:54 p.m. | 12.270416 | 12.811127 | 3.834728 | 12.160722 | 12.164203 | 3.733524 | 12.359353 | 13.115961 | 3.845877 |
| 12:18:24 p.m. | 12.191668 | 12.857908 | 3.696225 | 12.105728 | 12.130144 | 3.813457 | 12.303460 | 13.163831 | 3.879966 |
| 12:19:54 p.m. | 12.205068 | 12.803408 | 3.714449 | 12.119033 | 12.115804 | 3.737271 | 12.316983 | 13.107998 | 3.889143 |
| 12:21:24 p.m. | 12.273851 | 12.821126 | 3.696225 | 12.187331 | 12.169580 | 3.642350 | 12.386397 | 13.126107 | 3.788189 |
| 12:22:54 p.m. | 12.206855 | 12.897050 | 3.727813 | 12.120807 | 12.139107 | 3.662623 | 12.318786 | 13.203803 | 3.895699 |
| 12:24:24 p.m. | 12.244373 | 12.830293 | 3.787345 | 12.158061 | 12.139107 | 3.672325 | 12.356648 | 13.135433 | 3.899632 |
| 12:25:54 p.m. | 12.189882 | 12.873386 | 3.701085 | 12.103954 | 12.216186 | 3.639853 | 12.301657 | 13.179519 | 3.849810 |
| 12:27:24 p.m. | 12.178269 | 12.819738 | 3.770336 | 12.092423 | 12.110426 | 3.650806 | 12.289938 | 13.124563 | 3.827521 |
References
- Bachanek, K.H.; Tundys, B.; Wiśniewski, T.; Puzio, E.; Maroušková, A. Intelligent Street lighting in a smart city concepts—A direction to energy saving in cities: An overview and case study. Energies 2021, 14, 3018. [Google Scholar] [CrossRef]
- Mostafaeipour, A.; Bidokhti, A.; Fakhrzad, M.B.; Sadegheih, A.; Mehrjerdi, Y.Z. A new model for the use of renewable electricity to reduce carbon dioxide emissions. Energy 2022, 238, 121602. [Google Scholar] [CrossRef]
- Khan, S.; Ahmed, M.M.; Muhaisen, N.A.; Habaebi, M.H.; Ahmed, N.A. Street lighting poles top solar power generation for typical housing area in Kuwait. In Proceedings of the 2019 IEEE International Conference on Innovative Research and Development (ICIRD), Jakarta, Indonesia, 28–30 June 2019; IEEE: New York, NY, USA, 2019; pp. 1–5. [Google Scholar]
- Rofaie, N.S.A.; Phoong, S.W.; Abdul Talib @ Abdul Mutalib, M. Light-Emitting Diode (LED) versus High-Pressure Sodium Vapour (HPSV) Efficiency: A Data Envelopment Analysis Approach with Undesirable Output. Energies 2022, 15, 4589. [Google Scholar] [CrossRef]
- Mahmoud, M.M. Economic applications for led lights in industrial sectors. In Light-Emitting Diodes And Photodetectors: Advances and Future Directions; InTech Open: Rijeka, Croatia, 2021. [Google Scholar]
- Symeonidou, M.M.; Zioga, C.; Papadopoulos, A.M. Life cycle cost optimization analysis of battery storage system for residential photovoltaic panels. J. Clean. Prod. 2021, 309, 127234. [Google Scholar] [CrossRef]
- Dorel, S.; Gmal Osman, M.; Strejoiu, C.V.; Lazaroiu, G. Exploring optimal charging strategies for off-grid solar photovoltaic systems: A comparative study on battery storage techniques. Batteries 2023, 9, 470. [Google Scholar] [CrossRef]
- Koko, S.P. Optimal battery sizing for a grid-tied solar photovoltaic system supplying a residential load: A case study under South African solar irradiance. Energy Rep. 2022, 8, 410–418. [Google Scholar] [CrossRef]
- Nasab, N.M.; Yazdanian, S. The advantages of lead-acid battery for off-grid design. Energy Storage 2024, 6, e595. [Google Scholar] [CrossRef]
- Anuphappharadorn, S.; Sukchai, S.; Sirisamphanwong, C.; Ketjoy, N. Comparison the economic analysis of the battery between lithium-ion and lead-acid in PV stand-alone application. Energy Procedia 2014, 56, 352–358. [Google Scholar] [CrossRef]
- Bizhani, H.; Sani, S.K.; Rezazadeh, H.; Muyeen, S.M.; Rahmani, S. Modeling of an optimum fast charging multi-step constant current profile for lead-acid batteries. IEEE Trans. Ind. Appl. 2022, 59, 2050–2060. [Google Scholar] [CrossRef]
- Carroquino, J.; Escriche-Martínez, C.; Valiño, L.; Dufo-López, R. Comparison of economic performance of lead-acid and li-ion batteries in standalone photovoltaic energy systems. Appl. Sci. 2021, 11, 3587. [Google Scholar] [CrossRef]
- Jahed, A.; Abbaspour, A.; Ahmadi, A. Techno-economic analysis of off-grid hybrid wind-photovoltaic-battery power system by analyzing different batteries for the industrial plant in Shiraz Industrial Town, Iran. Sci. Prog. 2024, 107. [Google Scholar] [CrossRef]
- Zeng, J.; Liu, S. Research on aging mechanism and state of health prediction in lithium batteries. J. Energy Storage 2023, 72, 108274. [Google Scholar] [CrossRef]
- Guo, J.; Li, Y.; Pedersen, K.; Stroe, D.I. Lithium-ion battery operation, degradation, and aging mechanism in electric vehicles: An overview. Energies 2021, 14, 5220. [Google Scholar] [CrossRef]
- Antonov, I.; Kanchev, H.; Hinov, N. Study of PWM solar charge controller operation modes in autonomous DC system. In Proceedings of the 2019 II International Conference on High Technology for Sustainable Development (HiTech), Sofia, Bulgaria, 10–11 October 2019; IEEE: New York, NY, USA, 2019; pp. 1–4. [Google Scholar]
- Shi, Z.; Guo, Y.; Li, P.; Sun, H. A boost CLLC converter controlled by PWM and PFM hybrid modulation for photovoltaic power generation. IEEE Access 2020, 8, 112015–112026. [Google Scholar] [CrossRef]
- Schmid, F.; Behrendt, F. Optimal sizing of Solar Home Systems: Charge controller technology and its influence on system design. Sustain. Energy Technol. Assess. 2021, 45, 101198. [Google Scholar] [CrossRef]
- Kibirige, D.; Uzorka, A.; Mustafa, M.M.; Ukagwu, K.J. Design and implementation of a charge controller for solar PV systems for emergency situations in health facilities in rural areas of Uganda. Eng. Sci. Technol. 2024, 5, 326–342. [Google Scholar] [CrossRef]
- Yenku, C.F.; Fendji, M.D.; Fopah-Lele, A.; Tsuanyo, D. Charge-controller optimization on lead-acid battery in solar PV systems: Temperature effects and efficiency improvement. In E3S Web of Conferences, Proceedings of the International Energy 2021—Conference on “Renewable Energy and Digital Technologies for the Development of Africa”, Yaoundé, Cameroon, 18–20 November 2021; EDP Sciences: Les Ulis, France, 2022; Volume 354, p. 01003. [Google Scholar]
- Najmurrokhman, A.; Hambali, T.; Hakim, M.T.; Ismail, N. Solar panel charge controller using PWM regulation for charging lead acid batteries. In Proceedings of the 2022 8th International Conference on Wireless and Telematics (ICWT), Yogyakarta, Indonesia, 21–22 July 2022; IEEE: New York, NY, USA, 2022; pp. 1–4. [Google Scholar]
- Priya, K.S. Linear regression algorithm in machine learning through MATLAB. Int. J. Res. Appl. Sci. Eng. Technol. 2021, 9, 989–995. [Google Scholar] [CrossRef]
- Diyoke, G.C. Analysis and Simulation of Buck Switch Mode DC to DC Power Regulator. Int. J. Tech. Res. Appl 2015, 3, 97–103. [Google Scholar]
- Louie, H. Off-Grid System Battery Operationand Control. In Off-Grid Electrical Systems in Developing Countries; Springer Nature: Cham, Switzerland, 2025; pp. 411–444. [Google Scholar]
- Zhao, X.; Osborne, M.; Lantair, J.; Robu, V.; Flynn, D.; Huang, X.; Fisher, M.; Papacchini, F.; Ferrando, A. Towards integrating formal verification of autonomous robots with battery prognostics and health management. In Software Engineering and Formal Methods, Proceedings of the 17th International Conference on Software Engineering and Formal Methods 2019, Oslo, Norway, 16–20 September 2019; Springer International Publishing: Cham, Switzerland, 2019; pp. 105–124. [Google Scholar]
- Relan, R.; Tiels, K.; Timmermans, J.-M.; Schoukens, J. Estimation of best linear approximation from varying operating conditions for the identification of a li-ion battery model. IFAC-Pap. 2017, 50, 4739–4744. [Google Scholar] [CrossRef]
- Sheikh, S.S.; Anjum, M.; Khan, M.A.; Hassan, S.A.; Khalid, H.A.; Gastli, A.; Ben-Brahim, L. A battery health monitoring method using machine learning: A data-driven approach. Energies 2020, 13, 3658. [Google Scholar] [CrossRef]
- Coleman, M.; Lee, C.K.; Zhu, C.; Hurley, W.G. State-of-charge determination from EMF voltage estimation: Using impedance, terminal voltage, and current for lead-acid and lithium-ion batteries. IEEE Trans. Ind. Electron. 2007, 54, 2550–2557. [Google Scholar] [CrossRef]
- Zhou, W.; Zheng, Y.; Pan, Z.; Lu, Q. Review on the battery model and SOC estimation method. Processes 2021, 9, 1685. [Google Scholar] [CrossRef]
- Yang, R.; Xiong, R.; He, H.; Mu, H.; Wang, C. A novel method on estimating the degradation and state of charge of lithium-ion batteries used for electrical vehicles. Appl. Energy 2017, 207, 336–345. [Google Scholar] [CrossRef]
- Vilsen, S.B.; Stroe, D.I. Battery state-of-health modelling by multiple linear regression. J. Clean. Prod. 2021, 290, 125700. [Google Scholar] [CrossRef]
- Huang, B.; Liao, H.; Wang, Y.; Liu, X.; Yan, X. Prediction and evaluation of health state for power battery based on Ridge linear regression model. Sci. Prog. 2021, 104, 00368504211059047. [Google Scholar] [CrossRef]
- Dekker, J.; Nthontho, M.; Chowdhury, S.; Chowdhury, S.P. Economic analysis of PV/diesel hybrid power systems in different climatic zones of South Africa. Int. J. Electr. Power Energy Syst. 2012, 40, 104–112. [Google Scholar] [CrossRef]
- Koko, S.P. Optimal Battery Recharging Strategy for a Grid-Tied Solar Photovoltaic-Battery. In Trends in Environmental Sustainability and Green Energy: Proceedings of the 2024 7th International Conference on Green Energy and Environment Engineering, Seoul, Republic of Korea, 4–6 July 2024; Springer Nature: Cham, Switzerland, 2025; p. 198. [Google Scholar]
- Ibrahim, M.M.; Elwany, A.M.; Elansary, L.K. Sustainable technical design and economic–environmental analysis of SMART solar street lighting system in Giza City, Egypt. Int. J. Energy Environ. Eng. 2021, 12, 739–750. [Google Scholar] [CrossRef]
- El-Khozenadar, H.J.; Albardawil, M.A.; Asfour, M.S.; Abu-Khater, I.N.; Nassar, Y.F. DC off-grid PV system to supply electricity to 50 boats at Gaza seaport. In Proceedings of the 2023 8th International Engineering Conference on Renewable Energy & Sustainability (ieCRES), Gaza, Palestine, 8–9 May 2023; IEEE: New York, NY, USA, 2023; pp. 1–5. [Google Scholar]
- Saputra, R.; Erawadi, D.; Hendri, Z. Design of Public Street Lighting for Solar Power Plants (PLTS) in Bukit Bio-Bio Village, Kenagarian Sikucua Utara V Koto, Kampung Dalam Padang Pariaman. Innov. J. Intell. Control. Optim. Electr. Syst. 2024, 1, 62–68. [Google Scholar]
- El-Khozondar, H.J.; Asfour, A.A.; Nassar, Y.F.; Shaheen, S.W.; El-Zaety, M.F.; El-Khozondar, R.J.; Khaleel, M.M.; Ahmed, A.A.; Alsharif, A.H. Photovoltaic solar energy for street lighting: A case study at Kuwaiti Roundabout, Gaza Strip, Palestine. Power Eng. Eng. Thermophys 2024, 3, 77–91. [Google Scholar] [CrossRef]
- Sachin, K.; Yadav, V.P.; Mukesh, A.N.; Sharma, P.K.; Solanki, L. Design and development of PWM based solar hybrid charge controller. In Proceedings of the 2021 IEEE International Conference on Electronics, Computing and Communication Technologies (CONECCT), Bangalore, India, 9–11 July 2021; IEEE: New York, NY, USA, 2021; pp. 1–6. [Google Scholar]
- Yunus Khan, T.M.; Soudagar, M.E.M.; Kanchan, M.; Afzal, A.; Banapurmath, N.R.; Akram, N.; Mane, S.D.; Shahapurkar, K. Optimum location and influence of tilt angle on performance of solar PV panels. J. Therm. Anal. Calorim. 2020, 141, 511–532. [Google Scholar] [CrossRef]
- Severson, K.A.; Attia, P.M.; Jin, N.; Perkins, N.; Jiang, B.; Yang, Z.; Chen, M.H.; Aykol, M.; Herring, P.K.; Fraggedakis, D.; et al. Data-driven prediction of battery cycle life before capacity degradation. Nat. Energy 2019, 4, 383–391. [Google Scholar] [CrossRef]
- Yang, X.G.; Leng, Y.; Zhang, G.; Ge, S.; Wang, C.Y. Modeling of lithium plating induced aging of lithium-ion batteries: Transition from linear to nonlinear aging. J. Power Sources 2017, 360, 28–40. [Google Scholar] [CrossRef]
- Noman, A.M.; Haidar, Z.A.; Aljumah, A.S.; Almutairi, S.Z.; Alqahtani, M.H. Forecasting the distortion in solar radiation during midday hours by analyzing solar radiation during early morning hours. Appl. Sci. 2023, 13, 6049. [Google Scholar] [CrossRef]
- Faizal, E.; Winoko, Y.A.; Mustapa, M.S.; Kozin, M. Solar Charger Controller Efficiency Analysis of Type Pulse Width Modulation (PWM) and Maximum Power Point Tracking (MPPT). Asian J. Sci. Eng. 2022, 1, 90–102. [Google Scholar] [CrossRef]
- Sathasivam, S.; Adebayo, S.A.; Velavan, M.; Liang, J.K.W. Determine the parameters for photoelectric effect data using correlation and simple linear regression. J. Qual. Meas. Anal. 2022, 18, 61–70. [Google Scholar]
- Razzouk, J.; Ramos, O.; Ouro-Rodrigues, E.; Samayoa, C.; Wycliffe, N.; Cheng, W.; Danisa, O. Comparison of cervical, thoracic, and lumbar vertebral bone quality scores for increased utility of bone mineral density screening. Eur. Spine J. 2023, 32, 20–26. [Google Scholar] [CrossRef] [PubMed]


Disclaimer/Publisher’s Note: The statements, opinions and data contained in all publications are solely those of the individual author(s) and contributor(s) and not of MDPI and/or the editor(s). MDPI and/or the editor(s) disclaim responsibility for any injury to people or property resulting from any ideas, methods, instructions or products referred to in the content. |
© 2025 by the authors. Licensee MDPI, Basel, Switzerland. This article is an open access article distributed under the terms and conditions of the Creative Commons Attribution (CC BY) license (https://creativecommons.org/licenses/by/4.0/).