You are currently viewing a new version of our website. To view the old version click .
Energies
  • Article
  • Open Access

21 October 2025

Simulation Modeling and Working Fluid Usage Reduction for Small-Scale Low-Temperature Organic Rankine Cycle (ORC) Plate Heat Exchangers

,
,
,
and
1
School of Environmental and Municipal Engineering, Qingdao University of Technology, Qingdao 266525, China
2
School of Science, Huzhou University, Huzhou 313000, China
*
Author to whom correspondence should be addressed.
This article belongs to the Section J1: Heat and Mass Transfer

Abstract

In response to the increasingly severe energy crisis and global warming, ORC systems have attracted considerable attention owing to their ability to harness waste heat for power generation. Reducing the amount of organic working fluid in the heat exchanger can improve the economic performance of the ORC system. To achieve this aim, a new simulation model for plate evaporators and condensers of small/micro-scale ORC systems was developed, which can estimate the amount of organic working fluid and the outlet parameters. An ORC test rig was constructed to validate the model. Several experiments cases with different inlet temperatures were conducted. After validation, the impact of adjusting the operational and geometry parameters of the heat exchangers on the amount of organic working fluid was investigated. The results showed that appropriately increasing the temperature of the heat sources and cold sources or narrowing the heat exchanger width reduced the amount of working fluid in both the condenser and evaporator by over 30%. When adjusting the operational flow rate, the comprehensive impact on both the evaporator and condenser must be considered. The maximum mass was reduced by approximately 15.4%. The study results offer insights into designing plate evaporators and condensers for small/micro-scale ORC systems.

1. Introduction

Rapid industrialization and urbanization have increased energy consumption and greenhouse gas emissions, thus exacerbating global warming. The International Energy Agency report [] showed that carbon dioxide emissions were approximately 37.2 billion tons in 2023. The organic Rankine cycle (ORC) system is a key technology for waste heat recovery, energy conservation, and emission reduction [,]. Compared with other waste heat utilization technologies, the ORC system can effectively utilize various low-grade thermal energy resources. These resources include low-temperature waste heat generated during industrial production [,], geothermal resources [,], solar energy [,], and biomass energy []. In recent years, ORC technology has gradually matured, and its demand and installed capacity are increasing each year [].
Heat exchangers are important components of ORC systems [], and they are divided into evaporators and condensers in an ORC system. Evaporators absorb heat from low-temperature sources (such as hot water, hot gases, and steam) and transfer the heat to the organic working fluid, providing the necessary power for the subsequent expansion work of the fluid. Condensers condense the exhaust vapor into liquid working fluid to complete the next cycle.
Due to the high exergy loss and investment cost associated with heat exchangers in ORC equipment [,,,], recent research has increasingly focused on optimizing their design to improve overall ORC system performance. Nematollahi (2018) [] explored the impact of porous metal foam plate heat exchangers (BMPHE) and conventional brazed plate heat exchangers on the performance of ORC systems. Their experimental results showed that although BMPHE increased the pressure drop by 1.5–2.2 times, the overall performance of the ORC was slightly affected. BMPHE can be used to manufacture compact ORC systems for power generation distribution. Luo (2015) [] developed a mathematical model for a liquid-separating condenser (LSC) and proposed a solution strategy. Using this model, they analyzed the impact of pore numbers, finite element numbers, tube type, tube numbers, and investment cost on the optimization results, establishing a foundational framework and methodology for optimizing ORC systems containing LSCs. Bull (2020) [] calculated the minimum heat transfer areas for the hot-end preheating, evaporation, superheating, cold-end precooling, and condensation sections and explored methods for optimizing the heat transfer area of heat exchangers. Their study revealed that the heat exchange areas of the evaporator and condenser affected their heat transfer performance, thereby influencing the overall operating characteristics of the ORC.
Plate heat exchangers, particularly brazed plate heat exchangers, have become the most widely used type of heat exchanger owing to their high heat transfer coefficient, compact structure, and strong pressure-bearing capacity. Additionally, they are one of the most common heat exchangers used in small and micro-scale ORC systems []. Numerous studies have proposed optimization methods for the structure or selection of ORC plate heat exchangers.
However, existing studies on ORC systems’ plate heat exchangers optimization mainly focus on two aspects: the structural improvement of plate heat exchangers and the screening of working fluids based on thermal properties. Studies on working fluids have advanced the selection of alternative substances. Yang (2019) [] experimentally studied low-GWP refrigerants R1234ze(Z), R1233zd(E), and R1336mzz(Z) as replacements for R245fa. Wang (2010) [] investigated the use of azeotropic mixtures and pure fluids in a low-temperature solar Rankine cycle. These efforts have predominantly focused on thermos physical performance in the heat exchangers rather than charge minimization. Consequently, the optimization of working fluid mass has seldom been a central objective. The most numerical models are confined to predicting heat transfer metrics, but fail to establish an intrinsic link between heat exchanger design parameters and the working fluid mass.
During the startup of the ORC system, an excess or shortage of organic working fluid in the plate heat exchanger can affect heat exchange performance and even determine system operability. Additionally, the amount of organic working fluid used determines the economics and ease of maintenance of the ORC system. The use of large amounts of organic working fluid in small and micro-scale ORC systems significantly increases operational costs.
To address the research gap of optimizing working fluid usage, this study introduces a new simulation model for plate evaporators and condensers. The model advances conventional approaches by coupling the prediction of thermal-hydraulic performance with the estimation of the amount of working fluid employed. Based on the model, the effects of source temperatures and heat exchangers’ geometry on working fluid usage were further investigated. The findings provide a theoretical basis for formulating optimization design that reduces working fluid usage requirements, supporting the development of more compact and economic ORC systems.

2. Modeling

The evaporator and condenser are modeled as single-pass, counterflow plate heat exchangers having inlet and outlet connections on the same side (Figure 1). As shown in Figure 1, W1 represents the plate width, W2 is the horizontal distance between the centers of the inlet and outlet ports, L1 denotes the plate length, L2 is the vertical distance between the centers of the inlet and outlet ports, and β represents the angle between the Chevron corrugations and the centerline of the plate. The condenser and evaporator used in this study have the same structure, and their specific parameters are shown in Table 1.
Figure 1. Plate heat exchanger and its humanoid plates.
Table 1. Specific parameters of Chevron heat exchange plate.
The model in this study is developed based on the following assumptions: A1. The heat exchangers in the ORC system operate under steady-state conditions; A2. Heat loss from the heat exchangers is negligible; A3. Fouling factors or long-term degradation of the heat exchangers are negligible; A4. The pressure drop of the working fluid is negligible.
Assumption A1 is considered because this study aims to optimize the heat exchanger structure to reduce the amount of working fluid. As a result, only long-term stable operation of the heat exchangers is considered. Assumption A2 holds except under more extreme environmental conditions. In actual operation, the presence of insulation layers on the heat exchangers can effectively reduce heat loss. Thus, heat loss is not considered in this study. This study omits fouling thermal resistance in Assumption A3 primarily based on two considerations. The research focuses on parameters analysis during the system design phase, making it difficult to effectively quantify time-varying uncertainties such as fouling formation during long-term operation. Second, the analytical framework established herein possesses scalability, allowing subsequent sensitivity analysis of heat transfer coefficients to quantitatively assess the impact of long-term operational factors like scaling. Assumption A4 significantly reduces the computational complexity of the simulation but affects the accuracy of the model. In optimized heat exchangers with reduced working fluid usage, the fluid mainly exists in a gaseous form, thus resulting in a minimal pressure drop. Therefore, A4 is valid for analysis aimed at reducing the use of working fluid.
This model estimates the outlet temperatures of the working fluid, heat sources/sinks, and the internal state of the heat exchanger (including the working fluid mass) based on the heat exchanger structure and the inlet and outlet parameters (temperature, pressure, and flow rate) of the working fluid and heat sources/sinks. The simulation approach divides the evaporator into three regions: preheating, evaporation, and superheating sections. The condenser is divided into three regions: precooling, condensation, and subcooling sections. The logarithmic mean temperature difference and bisection method are used to calculate the working fluid parameters in different regions. Furthermore, based on the working fluid parameters and changes in the heat sources/sinks in each region, the area of each region and the corresponding working fluid mass are calculated in reverse.
Figure 2 shows the specific computational simulation flowchart. The calculation process of the evaporator is as follows.
Figure 2. Simulation flow chart.
First, obtaining the basic parameters of the evaporator, such as L1, L2, W1, W2 thickness (dp), β, and thermal conductivity (Kwall) of the heat transfer plates is necessary. In addition, the inlet parameters of the working fluid (Tr,in, Pr,in, and mr) and the inlet parameters of the heat source (Th,in and mh,in) must be known.
Then, a range of outlet enthalpy values for the working fluid is assumed based on the parameters of the working fluid and the heat source. The maximum outlet enthalpy of the working fluid in the evaporator is achieved when the outlet temperature of the working fluid equals the inlet temperature of the heat source (Tro = Thi). The minimum value is reached when the vapor fraction is exactly one (x = 1), i.e., the saturated vapor enthalpy at the outlet pressure. An initial value for dryness (x) in the two-phase region is assumed (e.g., x = 0.5). The assumed range of working fluid enthalpy is expressed using Equations (1) and (2) for the evaporator and condenser, respectively:
hr,out,max = ƒ(Th,in, Pr,out), hr,out,min = ƒ(xeva = 1, Pro)
hr,out,max = ƒ(xcon = 0, Pr,out), hr,out,min = ƒ(Tc,in, Pro)
The bisection method is used to calculate the actual enthalpy value by averaging the assumed maximum and minimum enthalpy values. If the result falls within one-half of the range—e.g., between the average and the maximum value—then in the next iteration, the previous average is used as the new minimum value, whereas the previous maximum is retained as the new maximum value for recalculation.
After obtaining the assumed outlet enthalpy of the working fluid, the heat transfer of the heat exchanger can be calculated, followed by the heat calculation of transfer and working fluid parameters for each region. The heat transfer in the superheating section of the evaporator can be calculated using Equation (3). The superheat degree of the vapor is calculated using Equation (4):
Qeva = mr(hr,superheat,in − hr,superheat,out)
Tr,sup = Tr,out − Tr,st
The calculations for other heat exchange sections are similar to the process described for the superheating section. After obtaining the amount of heat transfer of the heat exchanger, the heat transfer coefficients and heat transfer areas for each section are calculated using the correlations listed in Table 2. The heat transfer coefficient and heat transfer area for each of the three sections mentioned above are separately calculated to provide a basis for the subsequent calculation of working fluid mass and model convergence. The heat transfer area for each phase region is obtained using the thermal resistance method (Equation (5)):
A/R = Q/ΔT
where R is the thermal resistance, which is calculated using Equation (6), and ΔT is the logarithmic mean temperature difference, which is calculated using Equation (7):
R = 1/Hr + dp/k + 1/Hh
Δ T = Δ T 1 Δ T 2 l n Δ T 1 Δ T 2
Table 2. Heat transfer correlation and its source.
Subsequently, the mass of the working fluid in each section is calculated based on the heat transfer area and working fluid density in each heat exchange section, from which the total mass of the working fluid inside the evaporator and condenser is estimated. The calculation process is shown in Equation (8), where the working fluid density is calculated based on temperature and pressure:
M =   M i = A i · b · D · N
where i is preheating/precooling, evaporation/condensation, superheating/subcooling; hereinafter, i carries the same meaning. When the heat transfer area satisfies the convergence condition, the model outputs the outlet parameters of the working fluid and heat source and the total working fluid mass. The convergence condition for the heat transfer area is that the difference between the calculated heat transfer area and the actual heat transfer area must be less than an acceptable value. If the heat transfer area does not meet the convergence condition, the bisection method is used to narrow the assumed outlet enthalpy range and optimize the value of x, followed by the next iteration. The calculations of condenser area and working fluid mass follow the same approach and use the same formulas as the evaporator, as shown in Equations (3)–(8).
To achieve the above calculation process, this study developed a MATLAB (R2020a) code-based model for plate evaporators and condensers, using the REFPROP plugin to query the thermophysical parameters of the working fluid. Using heat transfer correlations, the area of each phase region and the total area were obtained. When the total area meets the convergence condition, the iteration ends, outputting the heat transfer area, outlet temperatures of the cold and hot sources, and the mass of working fluid in the heat exchanger. Additionally, considering that the model may fail to converge under certain extreme conditions, the number of simulation iterations, k, is set to 1000. After 1000 iterations, the program will automatically terminate the loop. If the area does not meet the convergence condition, the program calculates the error in the area and the outlet temperatures of the cold and hot sources and outputs the error. Testing has shown that this simulation method can calculate 50 sets of simulation results in just 3.06 s.

3. Experimental Equipment

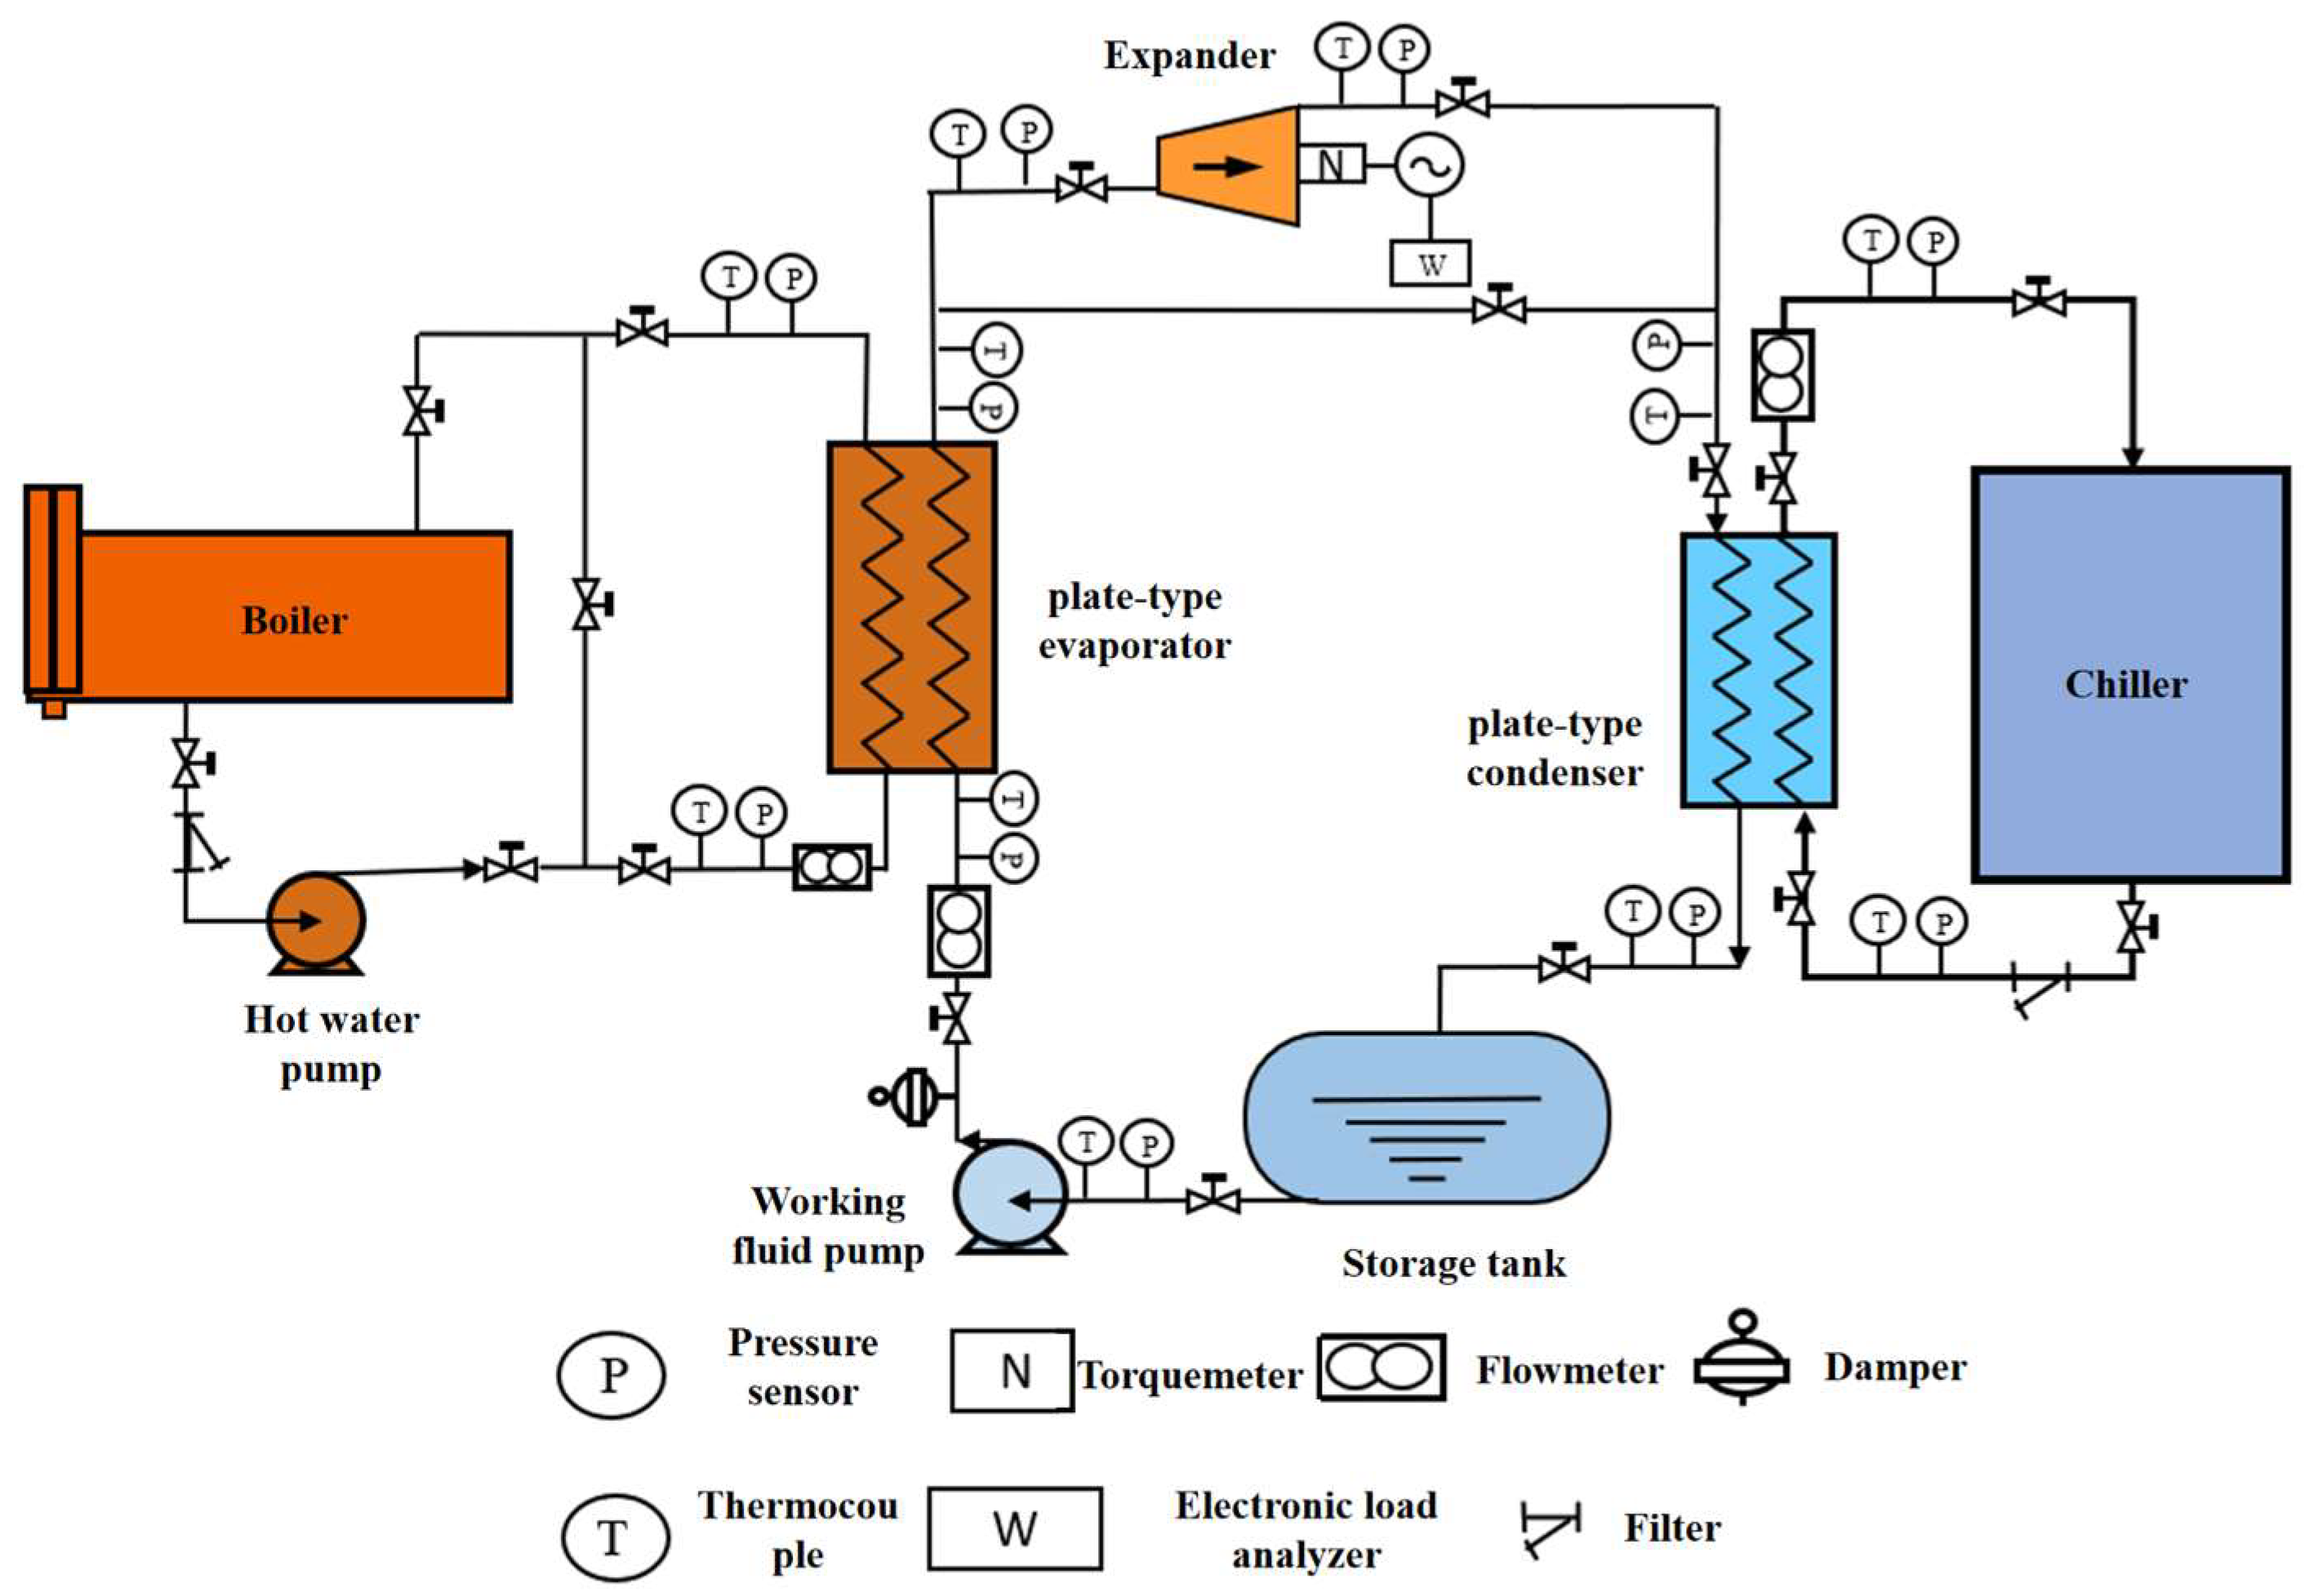
To verify the above model, we developed a small-scale ORC test rig using brazed plate heat exchangers as the evaporator and condenser. The structure of the test rig is shown in Figure 3. The test rig comprises three main components: the heat source system, the working fluid system, and the cooling system. The detailed information about the test rig can be found in reference [].
Figure 3. Schematic diagram of ORC waste heat power generation test rig.
The heat source system mainly comprised an electric hot water boiler, water pump, and corresponding supporting pipe fittings and valves. An electric water heater was used as the hot water boiler at a rated power of 24 kW. The outlet temperature of the boiler was adjusted according to the experimental settings. The hot water was pressurized and transferred into the evaporator using an adjustable water pump to provide heat to the working fluid. The working fluid system mainly comprised a diaphragm working fluid pump, evaporator, expander, condenser, liquid receiver, and generator. All heat exchangers were brazed plate heat exchangers. The ORC test rig used R245fa as the working fluid. The cooling system used two identical air-cooled water chillers to provide sufficient and stable cold water for the ORC system. The input power of the air-cooled water chillers was 4.5 kW, and the nominal cooling capacity was 14 kW. The temperatures of both chillers were set, and the cold water flow rate was adjusted by valves. Pressure sensors and thermocouples were installed at the inlets and outlets of each heat exchanger. In addition, flow meters were installed in all three circulation pipelines. All data were collected and recorded by a data logger at a frequency of once per second.
The details of sensor are listed in Table 3. The uncertainties of these quantities are calculated using error propagation theory (root mean square method). Error propagation theory is that the uncertainty of the target ω can be calculated by the sum of the uncertainties of the independent measured variables ( ω i ,   ω j ).
ω = ( i ) 2 ω i 2 + ( j ) 2 ω j 2 +
Table 3. Measurement errors.
In this study, the main measurement uncertainty includes two core quantities: the heat released by the heat source and the heat absorbed by the working fluid. Substitute the error data from Table 3. The heat transfer error on the evaporator heat source side is 6.58%, and the error on the working fluid side is 6.11%. The heat transfer error on the condenser cold source side is 8.25%, and the error on the working fluid side is 7.85%.

4. Results and Discussion

In this section, the accuracy of the model is verified by comparing experimental data and simulation data. The simulation results reveal the relationships between hot–cold source temperatures, the overall equivalent heat transfer coefficient of the heat exchanger, and the mass of working fluid within the heat exchanger. Furthermore, to reduce the working fluid mass inside the heat exchanger, the effects of changing plate width, β angle, and flow rate are discussed. Finally, methods to reduce the working fluid mass in the heat exchanger are summarized.

4.1. Model Validation

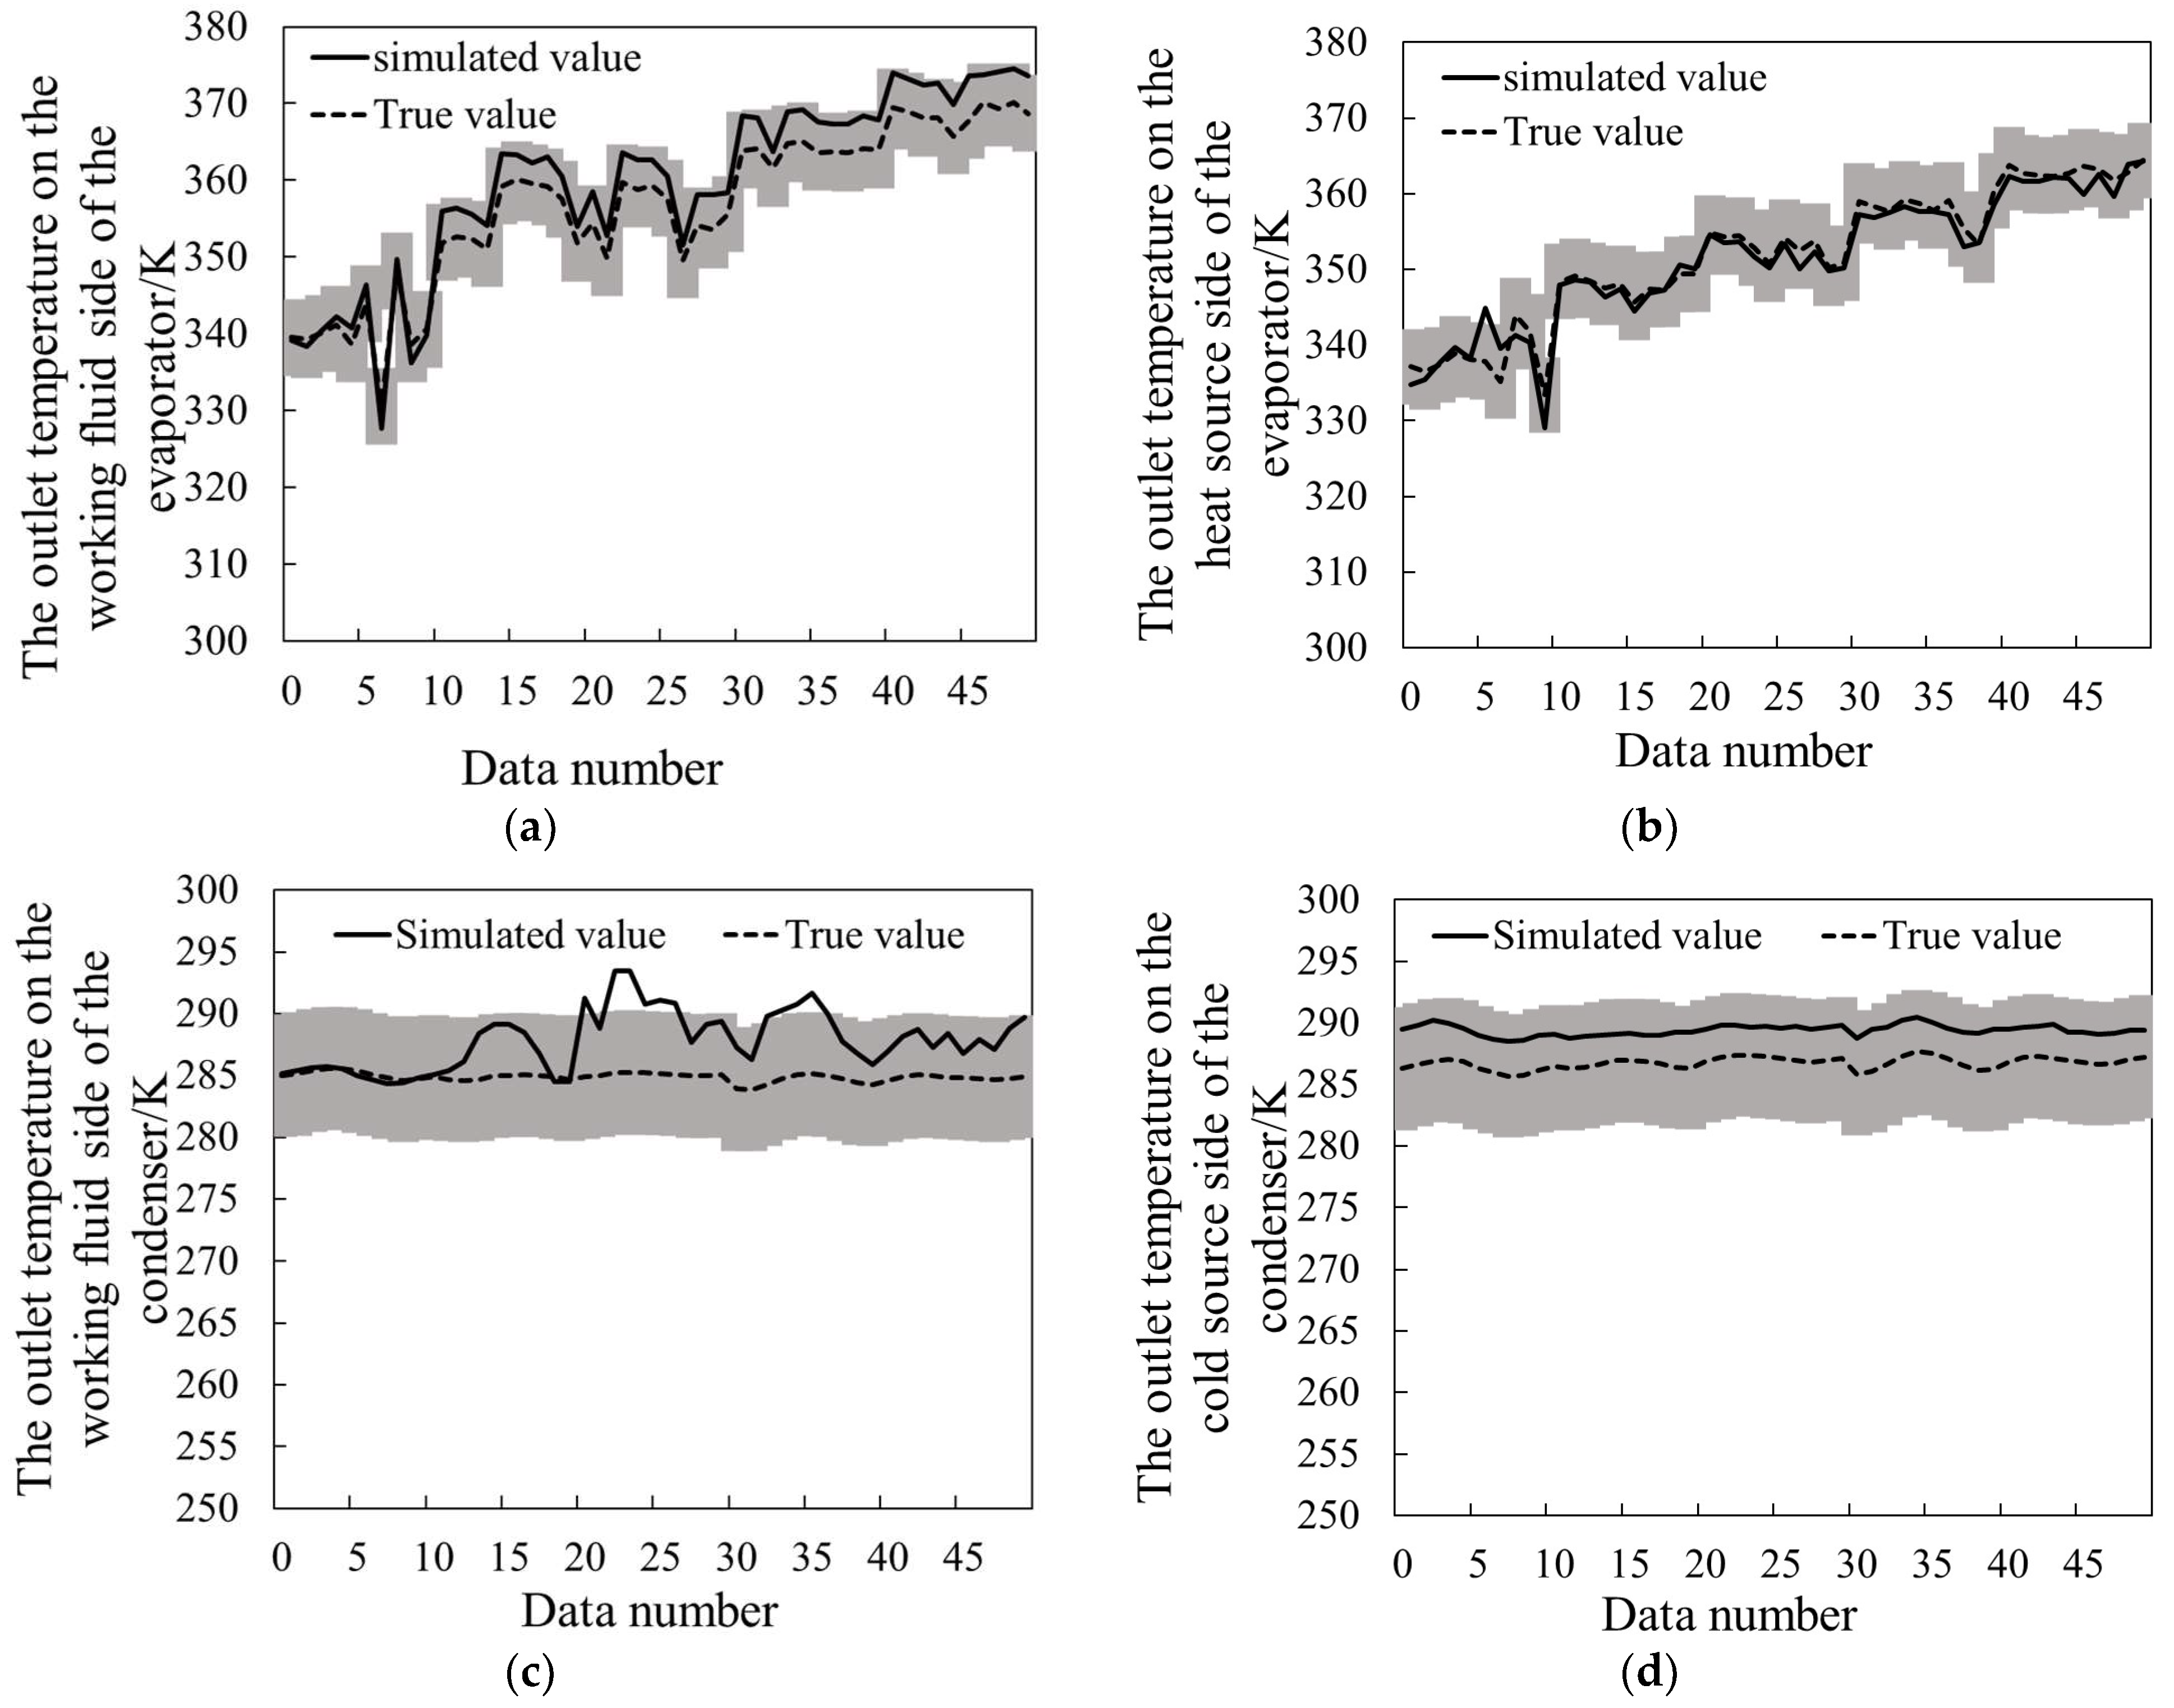
To verify the accuracy of the simulation model, the outlet temperatures of the heat exchangers monitored during 30 min of steady operation under each working condition were compared with the simulation results (Figure 4). It should be noted that the 30-min test duration mentioned in this document specifically refers to the effective period for data collection after the system reaches steady state. To ensure the system is fully stabilized, the total test time for each experiment is typically 1 to 1.5 h, encompassing the system warm-up and parameter stabilization phases. The 30-min data collection is determined because the literature indicates that the test duration in this study is sufficient to characterize the thermodynamic properties of the system. For example, Peris B et al. [] characterized the performance of ORC systems used for low-grade waste heat recovery in industrial applications. They identified steady-state points using 15-min data, then sampled 900 sets of data (1 set per second), utilizing 600 sets (equivalent to 10 min) for analysis. Experiments by Bianchi M et al. [] indicate that data from many measurement points reach a stable state within 400 s.
Figure 4. Simulation error plot: (a) outlet temperature on the working fluid side of the evaporator, (b) outlet temperature on the heat source side of the evaporator, (c) outlet temperature on the working fluid side of the condenser, and (d) outlet temperature on the cold source side of the condenser.
Each data number in the figure represents the average value of data over 3 min. For example, data number 2 is the average of the data from min 4 to 6. Every 10 data points correspond to experimental results at one heat source temperature. Data 1–10 represent the experimental and simulation data at a heat source temperature of 75 °C. Each subsequent group of 10 data points corresponds sequentially to heat source temperatures of 80, 85, 90, and 95 °C. The shaded area represents a ±5 K (Kelvin) error range from the true value. As shown in Figure 4a–d, most simulation data errors are within 5 K, while some are within 3 K. This phenomenon indicates that the simulation model can accurately reflect the operational characteristics of plate heat exchangers under the above experimental conditions.
For the evaporator, the mean absolute error (MAE) values for refrigerant and heat source outlet temperatures are 3.33 and 1.28 respectively, and the mean square error (MSE) values are 12.64 and 3.30 respectively. For the condenser, the MAE values for refrigerant and cold source outlet temperatures are 3.01 and 2.66 respectively, and the MSE values are 14.09 and 7.15 respectively.
From MSE, the model’s prediction accuracy for the evaporator is better than that for the condenser. This issue is presumed to stem from the A4 assumption. In the validation, the cold source temperature is low, and more working fluid remains in the condenser, causing a significant pressure drop, which violates the A4 assumption to some extent. Therefore, when applying the proposed model, the pressure drop should be paid attention to avoid deviation. With this limitation, the later simulation (i.e., Section 4.2) limits the ranges of analyzing the effects of hot/cold source temperature for ensuring the prediction accuracy.

4.2. Simulation Analysis of Heat Transfer Characteristics and Working Fluid Mass

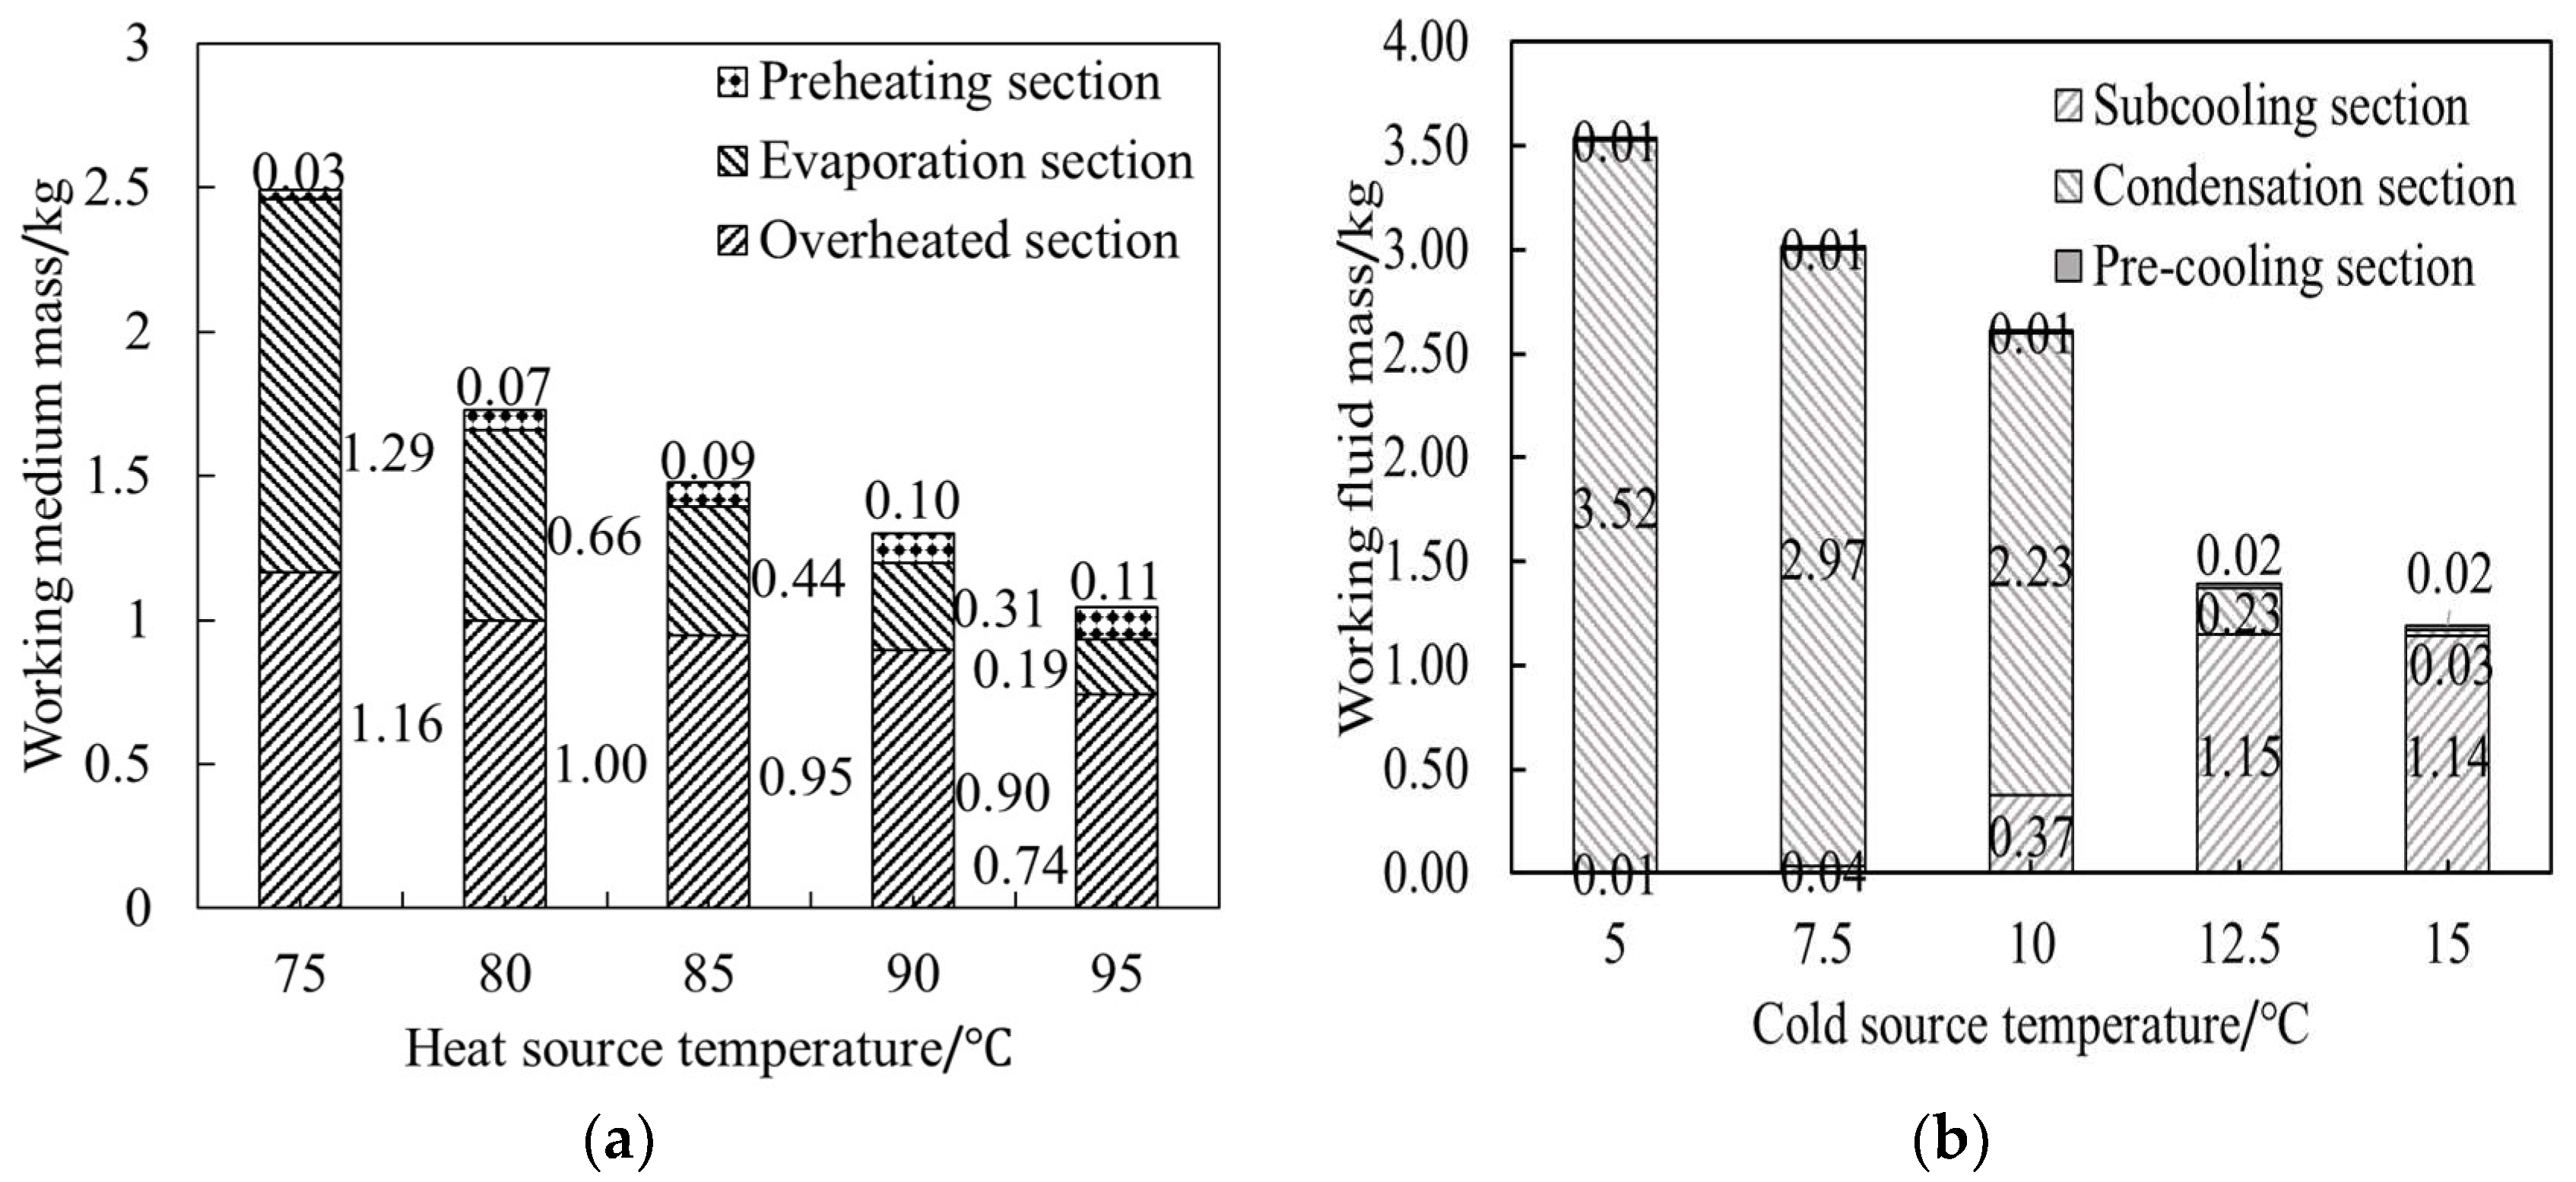
After validation, the simulation model was used to determine the changes in working fluid mass within the evaporator and condenser under different hot and cold source temperatures. The selected temperature ranges of the cold and heat sources are within the applicable range of the working fluid adopted. For a low-temperature ORC, when the cold source temperature exceeds 15 °C or the heat source temperature falls outside the 75 ~ 95 °C range, the system thermal efficiency will decrease, thereby compromising its practicality for engineering applications. Specific simulation parameters are shown in Table 4. The simulation results are presented in Figure 5. As shown in Figure 5a, the mass of the working fluid decreases as the heat source temperature increases. For example, when the heat source temperature increases from 75 °C to 95 °C, the working fluid mass in the evaporator decreases from 2.49 kg to 1.04 kg. This mass reduction is mainly attributed to the decrease in the area of the two-phase and superheating regions in the evaporator. As shown in Figure 5b, the working fluid mass in the condenser decreases with the increase in the cold source temperature, whereas the proportion of liquid-phase working fluid increases. For example, when the cold source temperature increases from 5 °C to 15 °C, the mass of the working fluid in the condenser decreases from 3.54 kg to 1.19 kg.
Table 4. Simulation parameter table.
Figure 5. Quality of working medium in each region of heat exchanger under different working conditions. (a) The mass of the working medium in each heat exchange section of the evaporator and (b) The mass of working medium in each heat exchange section of the condenser.
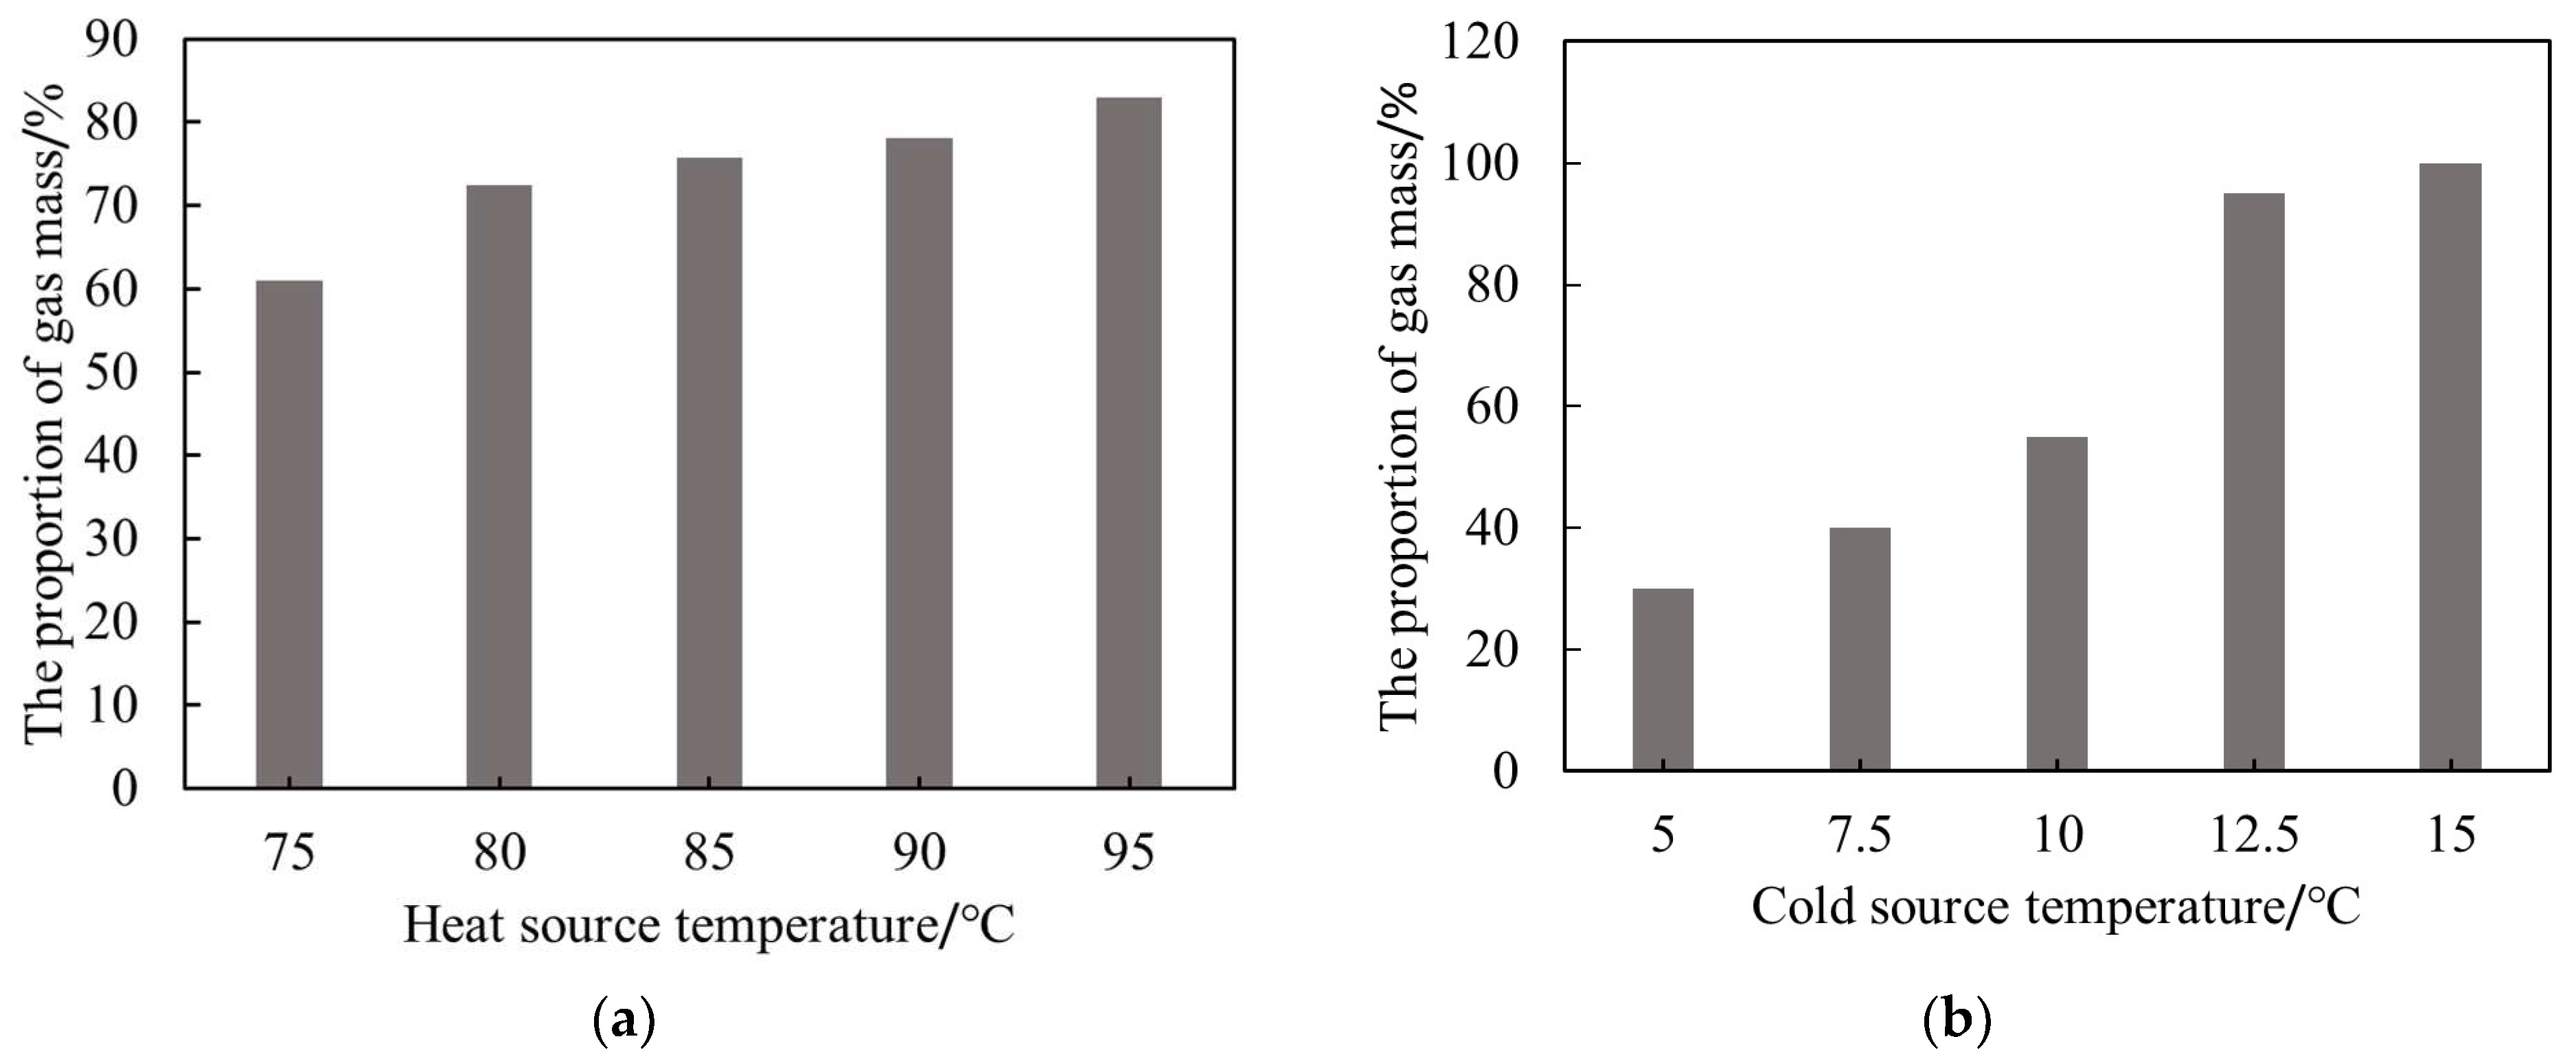
Figure 6 explains the reasons behind these results. Figure 6a shows the vapor-phase mass percentage in the two-phase region of the evaporator at different heat source temperatures. As the heat source temperature increased, the vapor-phase mass percentage in the two-phase region increased, reducing the total mass of the two-phase region. Figure 6b shows the vapor-phase mass percentage in the two-phase region of the condenser at different cold source temperatures. As the cold source temperature decreased, the vapor-phase mass percentage in the dominant two-phase region of the condenser significantly decreased (implying an increase in the amount of liquid), resulting in an increase in the working fluid mass retained in the condenser.
Figure 6. Mass percentage of gas in the two-phase zone of heat exchanger under different working conditions. (a) The proportion of gas mass in the two-phase zone of the evaporator and (b) The proportion of gas mass in the two-phase zone of the condenser.
However, it also should be noted that the current model has limited capability to distinguish phase regions within the condenser when the cold source temperature is extremely low. This issue is presumed to stem from the A4 assumption. When the cold source temperature is relatively low, more working fluid remains in the condenser, causing a significant pressure drop in the heat exchanger, which violates the conditions under which the A4 assumption holds. To reduce the working fluid mass in the condenser, a higher-temperature cold source should be used, and attention should be paid to the accuracy of the model under low cold source temperature conditions.
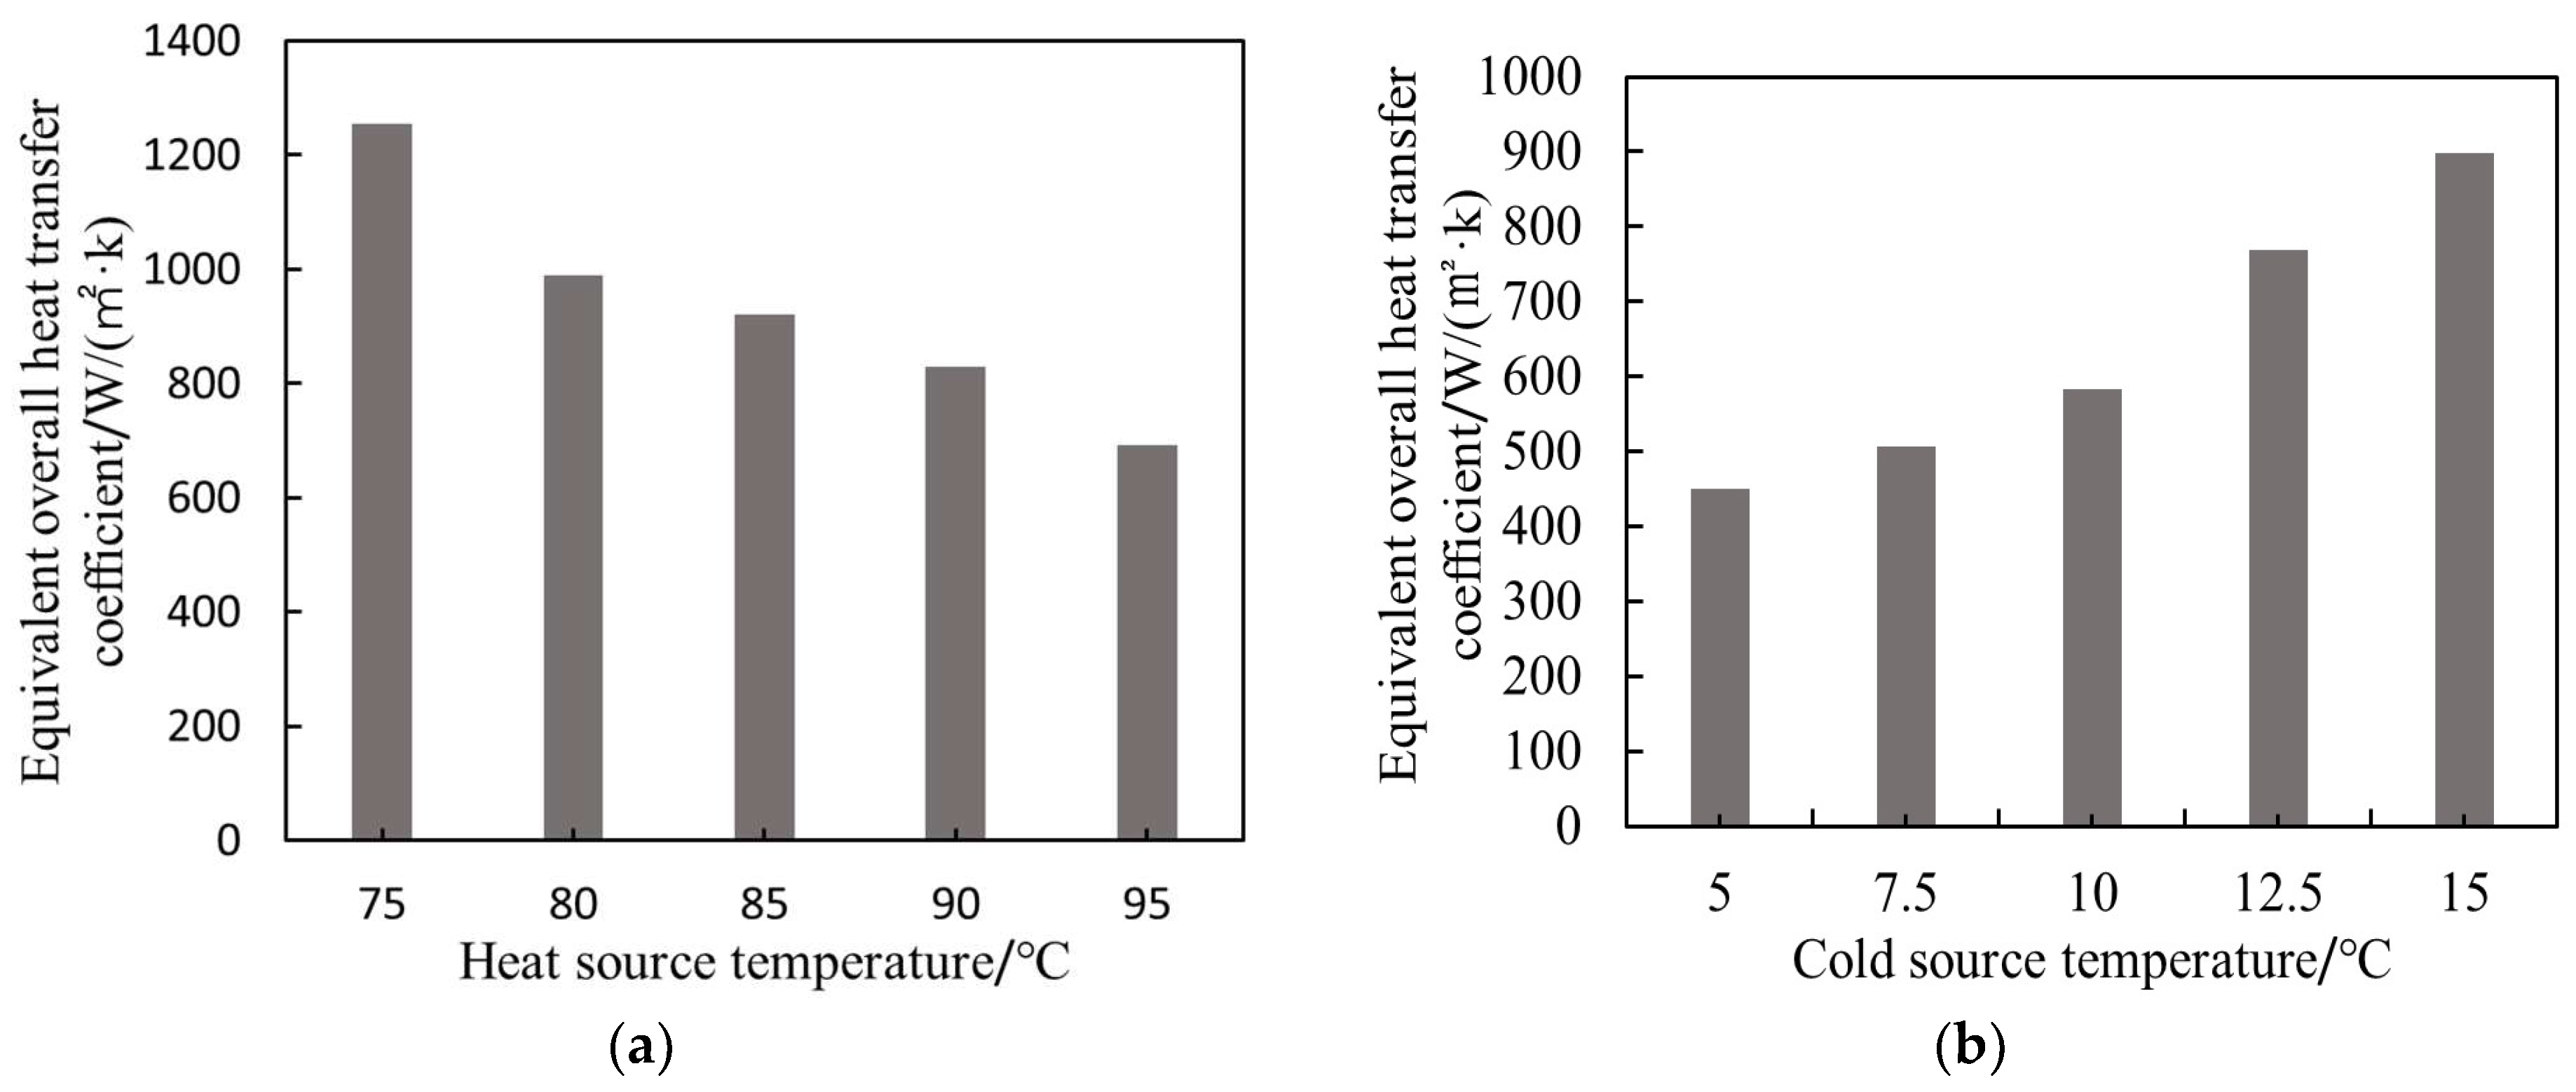
To further explore the mechanism underlying the changes in working fluid mass in the evaporator and condenser, i.e., the change of gas proportion, the equivalent overall heat transfer performance were analyzed (Figure 7). The equivalent overall heat transfer coefficient is used to evaluate the overall heat transfer performance of the heat exchanger, as expressed in Equation (10):
U eq , eva   =   U e v a , i A e v a , i A e v a
Figure 7. Simulated heat transfer characteristics of heat exchangers under different heat source conditions. (a) The equivalent overall heat transfer coefficient of the evaporator and (b) The equivalent overall heat transfer coefficient of the condenser.
As shown in Figure 7a, the equivalent overall heat transfer coefficient increased with increasing heat source temperature. When the heat source temperature increased from 75 °C to 95 °C, the equivalent overall heat transfer coefficient decreased by 45%. As shown in Figure 7b, the equivalent overall heat transfer coefficient increased with increasing cold source temperature. When the cold source temperature increased from 5 °C to 15 °C, the equivalent overall heat transfer coefficient increased by 99%. The changes in the equivalent overall heat transfer coefficients of the evaporator and condenser in this simulation are consistent with those in the previous study []. In summary, a large temperature difference leads to a large equivalent overall heat transfer coefficient in the evaporator but a small coefficient in the condenser, resulting in more evaporation in evaporator and lower condensation in condenser. Therefore, to reduce the working fluid mass in the heat exchangers, a suitable temperature difference should be used whenever possible.

5. Plate Configuration and Flow Rate Effect Simulation

To further evaluate the influence of heat exchanger structural parameters and flow rate, an evaporator with a heat source inlet temperature of 90 °C, working fluid inlet temperature of 12 °C, and flow rate of 0.22 m3/h were selected. Additionally, a condenser with a cold source inlet temperature of 10 °C, working fluid inlet temperature of 55 °C, and flow rate of 0.22 m3/h were selected for further simulation. It is important to note that, as a steady-state model, its results are uniquely determined and do not inherently incorporate the long-term performance degradation that can result from an insufficient heat exchange surface area. However, this long-term reliability constraint falls outside the scope of the current steady-state simulation, which should be incorporated into the comprehensive engineering design in future.

5.1. Plate Configuration Effects

Plate configuration is a crucial factor influencing the performance of heat exchangers. Based on the above model, plate configuration effects were evaluated, including the plate width and β angle. To eliminate the influence of other factors and maintain a single variable, the following two analysis schemes were designed:
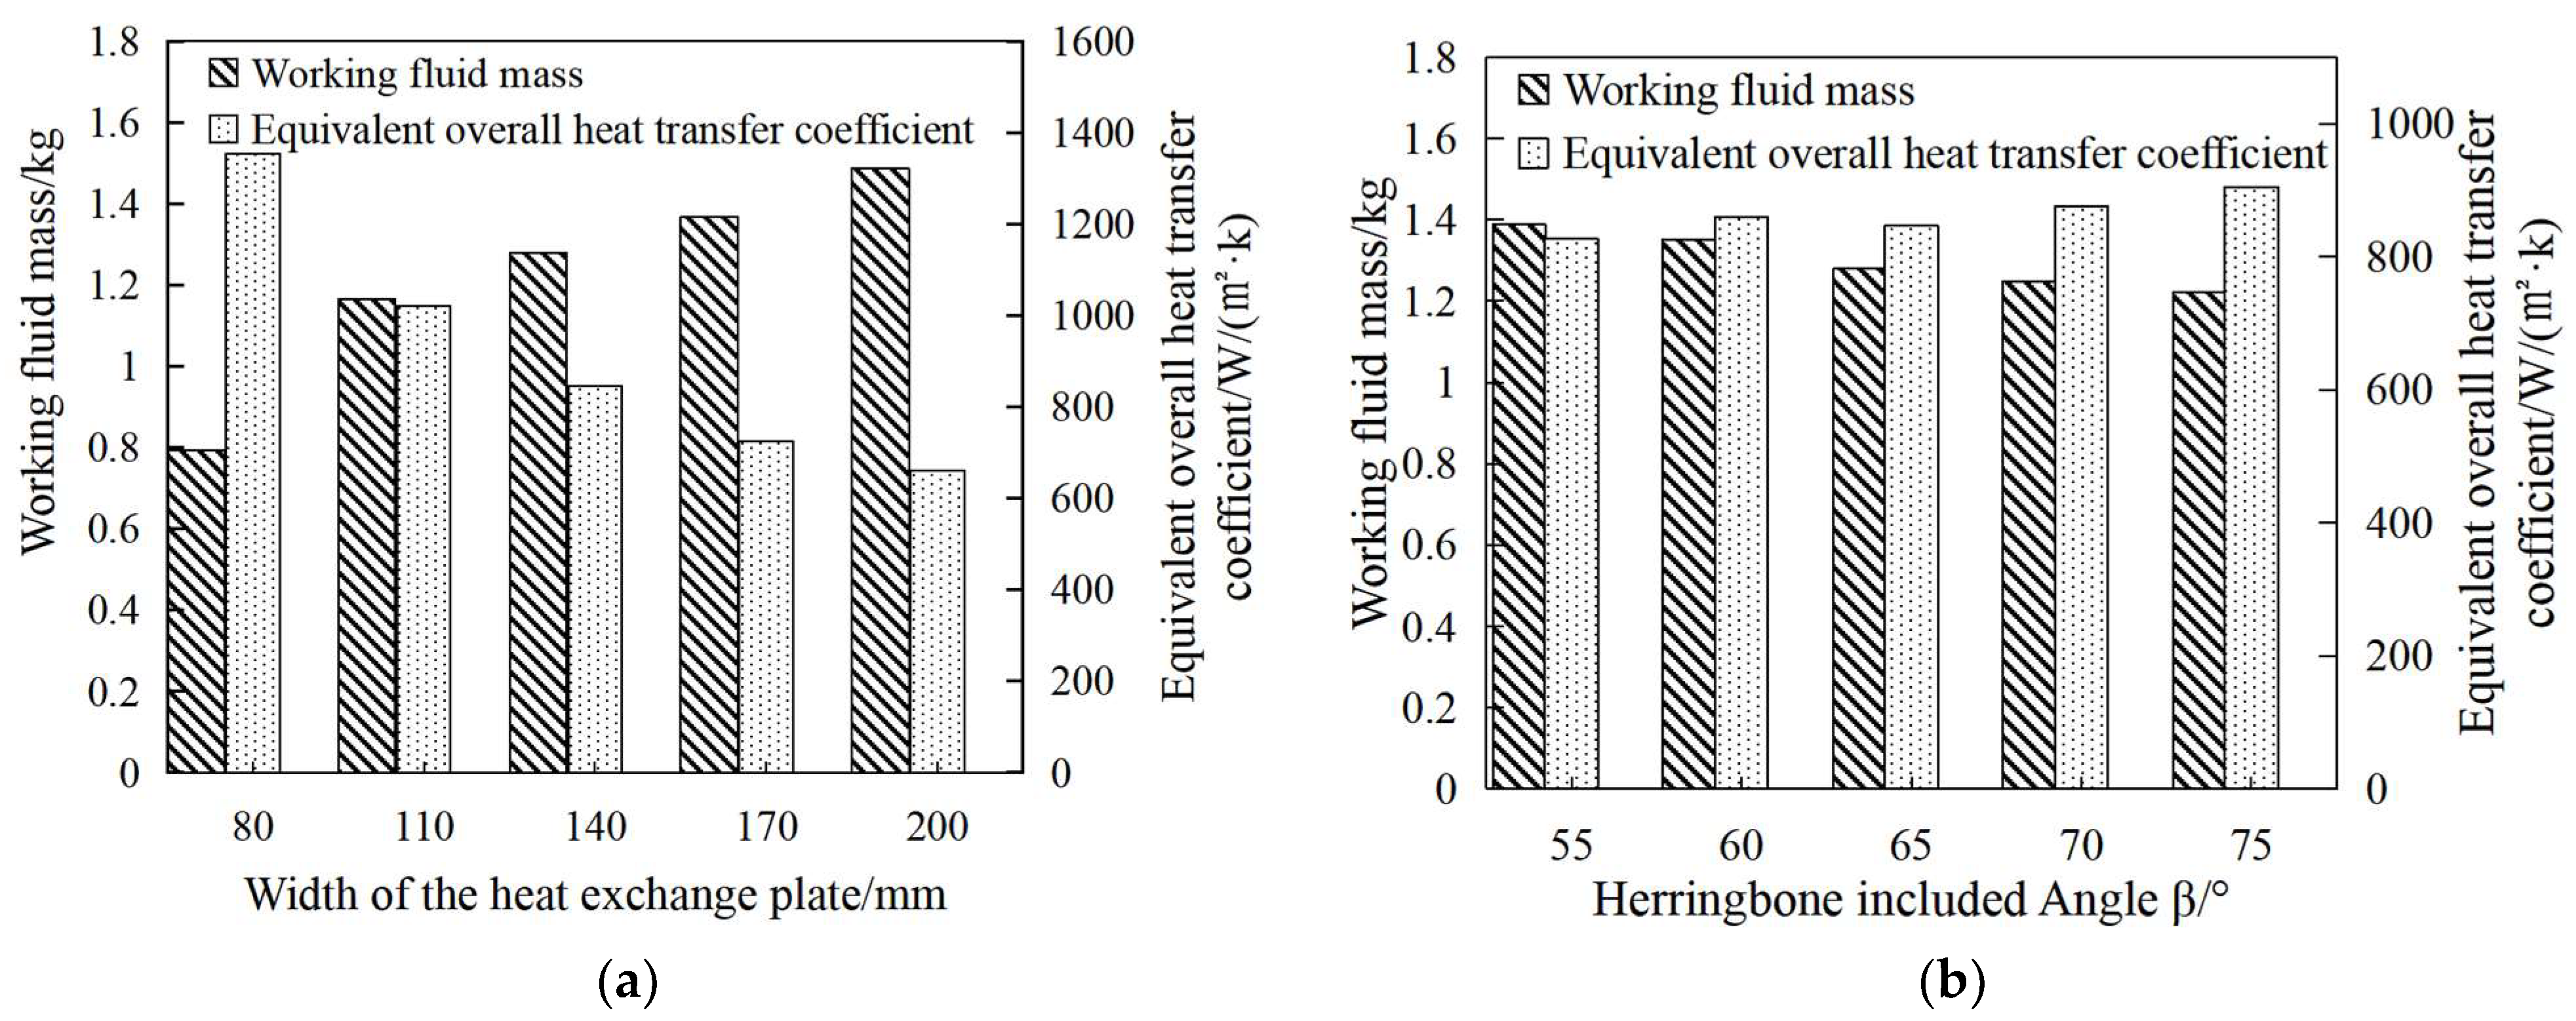
Scheme 1: Consider the influence of plate width. This study adopts a minimum heat exchanger width of 80 mm. The lower plate widths are not considered, because too small heat exchanger surface cannot match the heat transfer requirement. With plate length held constant, plate width is incrementally increased from 80 mm to 200 mm in 30-mm steps. Data was calculated for the five plate width variations described above. Scheme 2: Keep the plate length and width constant, and only change the β angle. Given that the corrugation inclination angle of Chevron pattern plates is generally within the range of 60–70°, while ensuring result variability and engineering feasibility, this simulation used a step size of 5°, producing data for five different β angles.
Figure 8 and Figure 9 present the simulation results for the evaporator and condenser, respectively, under Schemes 1 and 2; in both graphs, the left-slanted diagonal fill represents the mass of the working fluid, while the right-slanted diagonal fill represents the equivalent overall heat transfer coefficient.
Figure 8. Evaporator plate shape simulation results: (a) working fluid mass and heat transfer coefficient in the evaporator under Scheme 1. (b) Working fluid mass and heat transfer coefficient in the evaporator under Scheme 2.
Figure 9. Condenser plate shape simulation results: (a) Working fluid mass and heat transfer coefficient in the condenser under Scheme 1 and (b) Working fluid mass and heat transfer coefficient in the condenser under Scheme 2.
As shown in Figure 8a, as the plate width decreased, the equivalent overall heat transfer coefficient increased, whereas the working fluid mass inside the evaporator decreased. For example, when the plate width decreased from 200 mm to 80 mm, the equivalent heat transfer coefficient increased by approximately 104.8%, and the working fluid mass decreased by approximately 46.6%. As shown in Figure 8b, an increase in β results in slight decreases in the working fluid mass in the evaporator and a slight increase in the heat transfer coefficient, indicating that β has a certain influence on the working fluid mass in the heat exchanger, though neither change is significant.
As shown in Figure 9. As the plate width decreased, the mass of the working fluid in the condenser decreased, and the equivalent heat transfer coefficient increased. For example, when the plate width was reduced from 200 mm to 80 mm, the working fluid mass decreased by approximately 65.6%, and the heat transfer coefficient increased by approximately 137.5%. The influence of β on the condenser was less pronounced than that on the evaporator. However, the mass of the working fluid decreased as β increased, and the equivalent overall heat transfer coefficient increased with increasing β. The above simulation results revealed that when the constant plate length and plate width for the plate heat exchanger ranged from 80 mm to 200 mm, reducing the plate width decreased the working fluid mass in the evaporator and condenser but increased the equivalent overall heat transfer coefficient. Changes in β within the range of 55–75° slightly affected the working fluid mass and the heat transfer coefficient.

5.2. Flow Rate Analysis

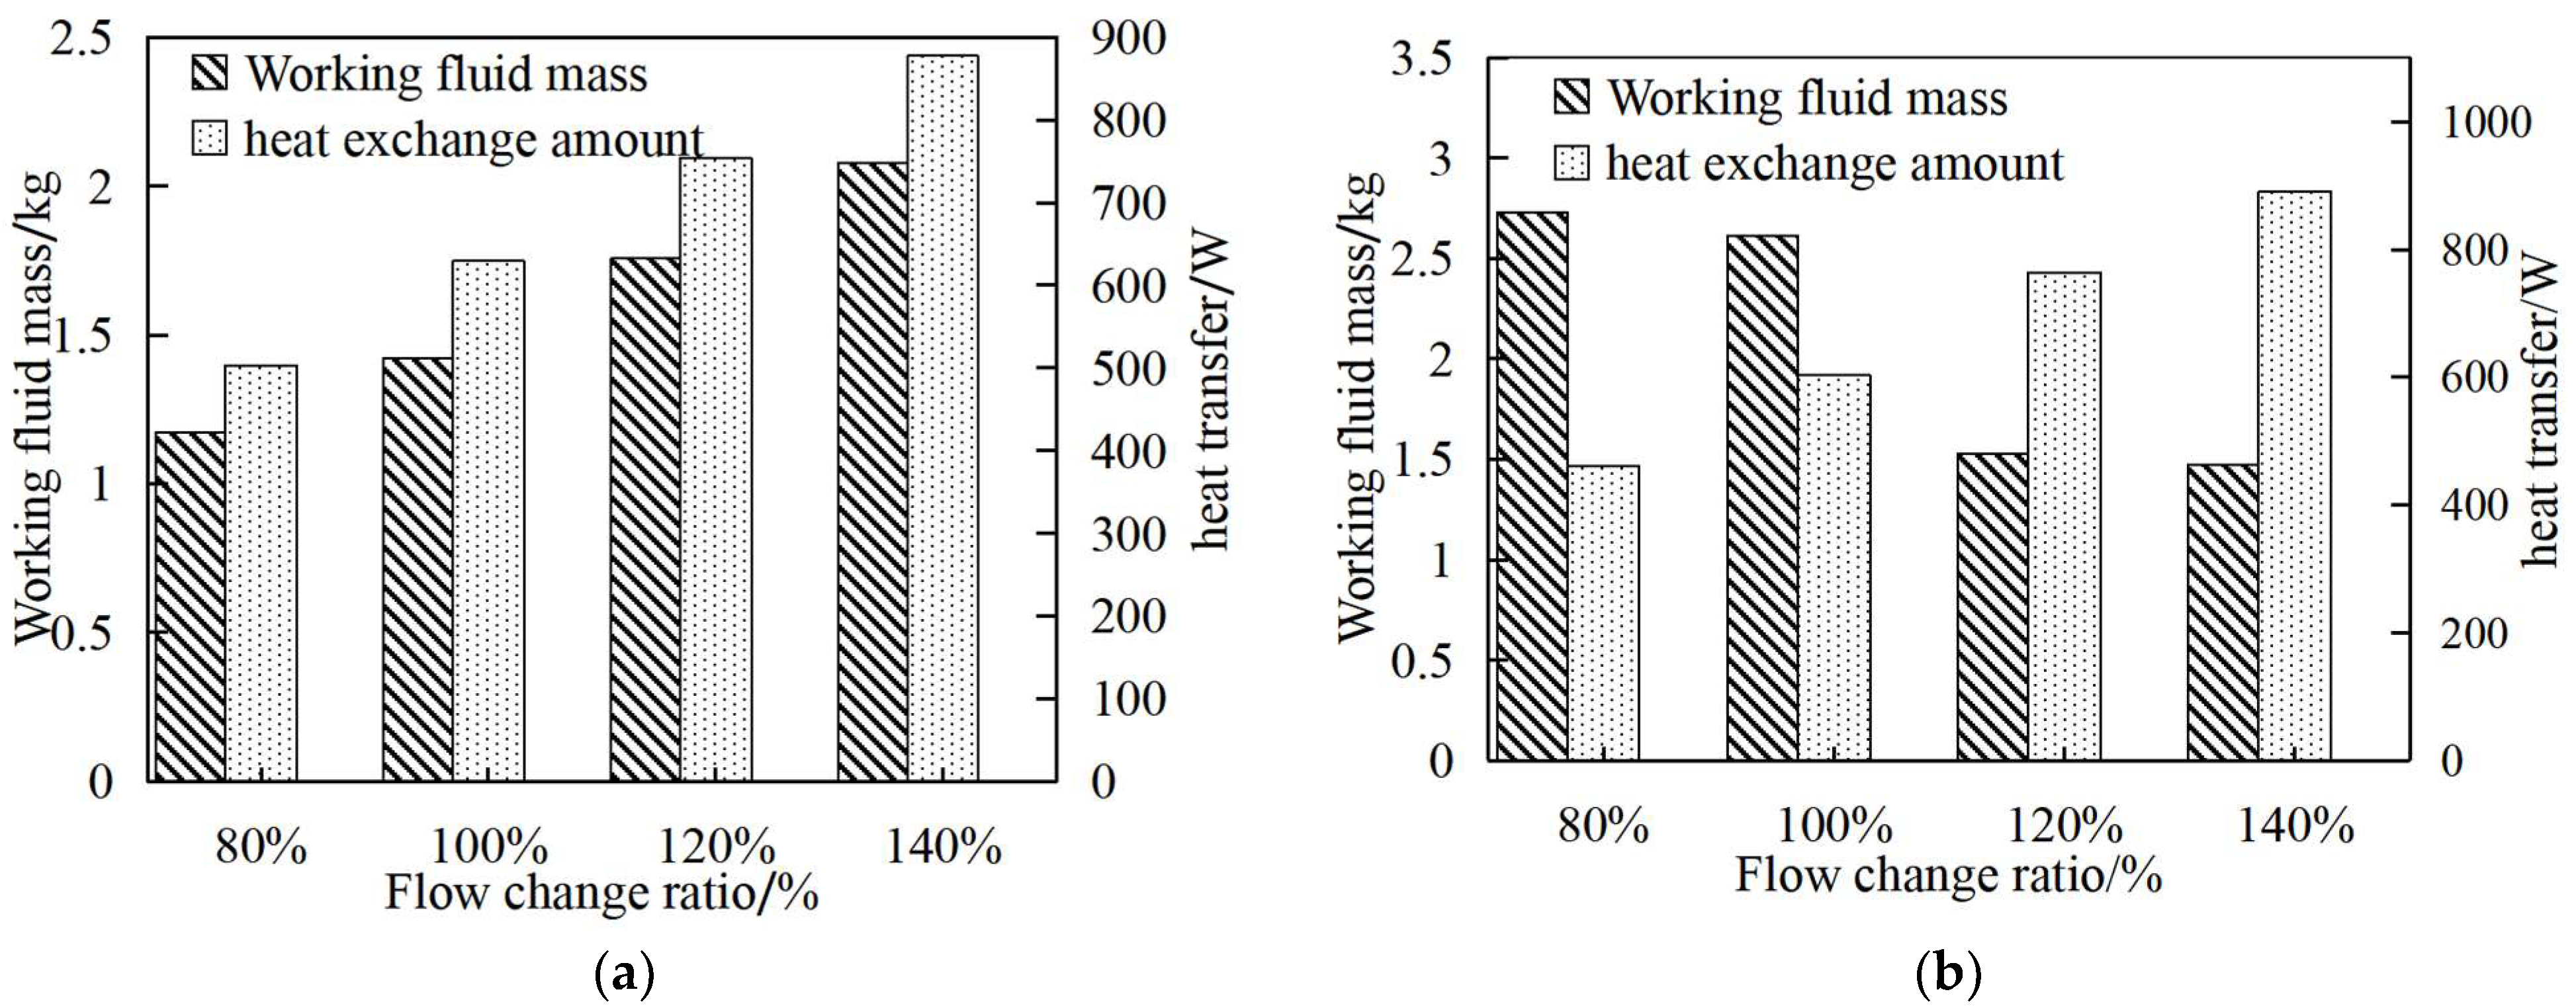
Flow rate is a critical factor affecting heat exchangers’ performance. When the refrigerant flow rate is too low, the flow velocity decreases to below the phase change rate within the evaporator, which will result in the error of the refrigerant flow meter. To ensure the pipe remains in a full-liquid state at all times, the refrigerant flow rate must not fall below 80% of the original operating condition. When the refrigerant flow rate is too high, it increases the mass of stored refrigerant within the evaporator, which contradicts the research objective. Therefore, this study gradually simulated working fluid masses in the evaporator and condenser corresponding to 80%, 100%, 120%, and 140% of the original flow rate.
Figure 10 presents the simulation results for the variation in flow rate for the evaporator and condenser. As shown in Figure 10a, both the mass of the working fluid and total heat transfer (thermal load) in the evaporator increased with increasing the working fluid flow rate. For instance, when the flow rate increased to 140% of the original, the mass of the working fluid increased by 45.9%. This phenomenon may occur because, as the flow rate increases, more working fluid enters the evaporator, making it unable to fully absorb heat and vaporize in time, thus increasing the mass of the working fluid inside the evaporator. Figure 10b shows the simulation results of flow rate changes in the condenser. The results showed that as the flow rate increased, the mass of the working fluid in the condenser decreased, while the heat transfer increased with the flow rate. When the flow rate increased to 140% of the original value, the working fluid mass decreased by 43.6%. This phenomenon may attributed to the increased flow rate of vapor into the condenser that cannot rapidly condense, thus increasing vapor mass fraction in the two-phase region. The total mass of the working fluid in both the evaporator and condenser initially decreased and then increased as the flow rate increased. As the flow rate increased from 80% to 120%, the mass of the total working fluid decreased from 3.9 kg to 3.3 kg.
Figure 10. Simulation results at different flow rates: (a) Working fluid mass and heat transfer amount in the evaporator and (b) Working fluid mass and heat transfer amount in the condenser.

5.3. Economic Analysis

This study uses R245fa as the refrigerant, with its economic analysis referencing current market prices. The domestic market price is approximately 100 Chinese Yuan (CNY) per kilogram []. The international market price is $5.25 per liter []. Based on R245fa’s liquid density at 30 °C (82.7 kg/m3), this converts to approximately 463.39 CNY per kilogram. Ultimately, this study adopts the arithmetic mean of domestic and international prices, roughly 265 CNY per kilogram, as the calculation benchmark.
Using the aforementioned simulation results as an example, adjusting the temperatures of the heat source and sink can reduce the refrigerant charge in the evaporator by about 1.44 kg and in the condenser by approximately 2.35 kg. After comprehensive adjustments, the initial investment can be reduced by about 1004.35 CNY, representing a savings of approximately 63.0% in the initial refrigerant investment. By altering the heat exchangers’ size, the evaporator can save approximately 0.7 kg of working fluid, while the condenser can save about 2.9 kg. Combined changes to both components can reduce the initial investment by approximately 954 CNY, representing a saving of about 37.3% of the initial investment for the working fluid. For large-scale ORC systems, the savings in initial investment may be even more significant. However, a comprehensive economic assessment exceeds the scope of this study and requires further investigation in subsequent research.

6. Conclusions

In this study, an experiment on a small-scale ORC system was conducted under different heat source conditions. A new mathematical model for the evaporator and condenser was developed, and the relationship between the plate configuration and working fluid flow rate was analyzed using the numerical model. The conclusions drawn from the results are as follows:
  • A new mathematical model for the plate evaporator and condenser was developed, and its accuracy was validated by comparing the predicted data with experimental data. The limitations of this model were also discussed. The results showed that the temperature prediction error of the model was less than 5 K. However, the model ignored the pressure drop of the working fluid, and its simulation accuracy decreased under conditions with excessive liquid in the heat exchanger.
  • The mass of the working fluid in the condenser and evaporator must be optimized in coordination with the hot and cold source temperatures. For example, when the cold source temperature increased from 5 °C to 15 °C, the working fluid mass in the condenser decreased by approximately 66.4%. When the heat source temperature increased from 75 °C to 90 °C, the working fluid mass in the evaporator decreased by approximately 58.0%.
  • The working fluid mass in the condenser and evaporator can be reduced by adjusting the plate width and flow rate, with suitable parameter combinations identified through sensitivity analysis, but β angle has a slight effect on the working fluid mass. For example, when the plate width was reduced from 140 mm to 80 mm, the mass of the working fluid in the evaporator and condenser decreased by 37.9% and 33.1%, respectively. When β increased from 55° to 75°, the working fluid mass in the evaporator and condenser decreased by 11.9% and 1.5%, respectively. The working fluid flow rate exhibited different influence trends on the working fluid mass in the evaporator and condenser. When the flow rate increased to 120% of the 80%, the mass of the total working fluid decreased from 3.9 kg to 3.3 kg.
This paper indicates that altering the dimensions of plate heat exchangers is constrained by manufacturing costs and must be coupled with the temperatures of heat sources and sinks. Consequently, its economic analysis extends far beyond simple cost aggregation. Given the complexity of the issue, a comprehensive economic evaluation is beyond the scope of this paper and will be addressed separately. This study focuses on revealing its underlying mechanisms, aiming to establish a theoretical foundation for subsequent cost-optimal design and engineering applications.

Author Contributions

Conceptualization, H.S.; Methodology, Q.M. and H.S.; Software, Q.M. and H.Y.; Validation, Q.M.; Formal analysis, Q.M.; Investigation, Q.M. and H.Y.; Resources, H.S.; Data curation, Q.M.; Writing—original draft, Q.M.; Writing—review & editing, Y.L. and H.S.; Visualization, Q.M.; Supervision, H.S. and S.L.; Project administration, Y.L., H.S. and S.L.; Funding acquisition, Y.L. All authors have read and agreed to the published version of the manuscript.

Funding

This research was funded by the open Foundation of Huzhou Key Laboratory of Data Modeling and Analysis, grant number 2023-03.

Data Availability Statement

Some or all data, models, or code that support the findings of this study are available from the corresponding author upon reasonable request.

Acknowledgments

The authors wish to acknowledge the technical support from Yuqing Wei for the experiment reported in this paper.

Conflicts of Interest

The authors declare no conflicts of interest.

Notation List

The following notations are used in this document:
NotationMeaningSubscriptsMeaning
A Area, m2a Actual value
bPlate spacing, mas Assumed value
DDensity, kg m−3calCalculated value
dpPlate thickness, mconCondenser
dhHydraulic diameter, mevaEvaporator
f Pressure drop coefficienteqEquivalent
GMass flux, kg·m−2·scCold side
HHeat transfer coefficient, W·m−2·K−1hHot side
hEnthalpy, kJ/kginInlet
KThermal conductivity, W·m−1·K−1maxMaximum value
L1, L2Chevron plate length; length between heat exchanger interfaces, mmminMinimum value
MMass, kgrWorking fluid side
mVolumetric flow rate, m3·h−1outOutlet
NNumber of working fluid flow channels in the heat exchanger, –stSaturated state
PPressure, kPasupSuperheated
QHeat transfer amount, WsubSubcooled
RThermal resistance, m2·K·W−1wallWall surface
rArea error, %
sNumber of iterations
TTemperature, K
tStep size of vapor mass fraction
UHeat transfer coefficient, W·m−2·K−1
VFlow velocity, m·s−1
W1, W2Chevron plate width; distance between heat exchanger inlet and outlet, mm
xVapor mass fraction/dryness, %
ΔDifference/change
βChevron angle, °
μDynamic viscosity, Pa·s
φAmplification factor
ωRelative error

References

  1. IEA. CO2 Emissions in 2023; IEA: Paris, France, 2024; Available online: https://www.iea.org/reports/co2-emissions-in-2023 (accessed on 12 May 2025).
  2. Jiménez-García, J.C.; Ruiz, A.; Pacheco-Reyes, A.; Rivera, W. A Comprehensive Review of Organic Rankine Cycles. Processes 2023, 11, 1982. [Google Scholar] [CrossRef]
  3. Wang, X.; Cai, Y.; Yu, X.; Li, Q. Study on organic Rankine cycle system for low-temperature waste heat power generation. In Proceedings of the Third International Conference on Mechanical, Electronics, and Electrical and Automation Control (METMS 2023), Online, 17 February 2023; SPIE: Washington, DC, USA, 2023; Volume 12722, pp. 132–149. [Google Scholar]
  4. Xia, L.; Liu, R.; Zeng, Y.; Zhou, P.; Liu, J.; Cao, X.; Xiang, S. A review of low-temperature heat recovery technologies for industry processes. Chin. J. Chem. Eng. 2019, 27, 2227–2237. [Google Scholar] [CrossRef]
  5. Zhihong, W.; Xiaoming, D.; Ming’ou, W.U. Application of organic Rankine cycle in multi-grade waste heat power generation. Chem. Ind. Eng. Prog. 2019, 38, 2189–2196. [Google Scholar]
  6. Altun, A.; Kilic, M. Thermodynamic performance evaluation of a geothermal ORC power plant. Renew. Energy 2020, 148, 261–274. [Google Scholar] [CrossRef]
  7. Fiaschi, D.; Lifshitz, A.; Manfrida, G.; Tempesti, D. An innovative ORC power plant layout for heat and power generation from medium-to low-temperature geothermal resources. Energy Convers. Manag. 2014, 88, 883–893. [Google Scholar] [CrossRef]
  8. Mahlia, T.M.I.; Syaheed, H.; Abas, A.E.P.; Kusumo, F.; Shamsuddin, A.H.; Ong, H.C.; Bilad, M.R. Organic Rankine Cycle (ORC) System Applications for Solar Energy: Recent Technological Advances. Energies 2019, 12, 2930. [Google Scholar] [CrossRef]
  9. Ramos, A.; Chatzopoulou, M.A.; Freeman, J.; Markides, C.N. Optimisation of a high-efficiency solar-driven organic Rankine cycle for applications in the built environment. Appl. Energy 2018, 228, 755–765. [Google Scholar] [CrossRef]
  10. Świerzewski, M.; Kalina, J. Optimisation of biomass-fired cogeneration plants using ORC technology. Renew. Energy 2020, 159, 195–214. [Google Scholar] [CrossRef]
  11. Zhu, J.; Cao, X.; Chen, Z.; Zhu, Q. Progress in Low-grade Thermal Energy Organic Rankine Cycle Power Generation Technology. Low Temp. Supercond. 2021, 49, 73–80. [Google Scholar] [CrossRef]
  12. Hu, K. Research on the Heat Exchange Characteristics of the Evaporator and the Influence of Superheat on the Stability of the ORC System. Ph.D. Thesis, Tianjin University, Tianjin, China, 2017. [Google Scholar]
  13. Chen, Q.; Xu, J.; Chen, H. A new design method for Organic Rankine Cycles with constraint of inlet and outlet heat carrier fluid temperatures coupling with the heat source. Appl. Energy 2012, 98, 562–573. [Google Scholar] [CrossRef]
  14. Lecompte, S.; Huisseune, H.; van den Broek, M.; De Schampheleire, S.; De Paepe, M. Part load based thermo-economic optimization of the Organic Rankine Cycle (ORC) applied to a combined heat and power (CHP) system. Appl. Energy 2013, 111, 871–881. [Google Scholar] [CrossRef]
  15. Lee, Y.-R.; Kuo, C.-R.; Liu, C.-H.; Fu, B.-R.; Hsieh, J.-C.; Wang, C.-C. Dynamic Response of a 50 kW Organic Rankine Cycle System in Association with Evaporators. Energies 2014, 7, 2436–2448. [Google Scholar] [CrossRef]
  16. Zheng, X.; Luo, X.; Luo, J.; Chen, J.; Liang, Y.; Yang, Z.; Chen, Y.; Wang, H. Experimental investigation of operation behavior of plate heat exchangers and their influences on organic Rankine cycle performance. Energy Convers. Manag. 2020, 207, 112528. [Google Scholar] [CrossRef]
  17. Nematollahi, O.; Abadi, B.G.; Kim, Y.D.; Kim, K. Experimental study of the effect of brazed compact metal-foam evaporator in an organic Rankine cycle performance: Toward a compact ORC. Energy Convers. Manag. 2018, 173, 37–45. [Google Scholar] [CrossRef]
  18. Luo, X.; Yi, Z.; Zhang, B.; Mo, S.; Wang, C.; Song, M.; Chen, Y. Mathematical modelling and optimization of the liquid separation condenser used in organic Rankine cycle. Appl. Energy 2015, 185, 1309–1323. [Google Scholar] [CrossRef]
  19. Bull, J.; Buick, M.J.; Radulovic, J. Heat Exchanger Sizing for Organic Rankine Cycle. Energies 2020, 13, 3615. [Google Scholar] [CrossRef]
  20. Du, W.; Zhao, J.; Zhang, L.; Wang, Z.; Ji, W. Review and Prospect of Heat Exchanger Structure Development. J. Shandong Univ. (Eng. Sci. Ed.) 2021, 51, 76–83. [Google Scholar]
  21. Yang, J.; Ye, Z.; Yu, B.; Ouyang, H.; Chen, J. Simultaneous experimental comparison of low-GWP refrigerants as drop-in replacements to R245fa for Organic Rankine cycle application: R1234ze(Z), R1233zd(E), and R1336mzz(E). Energy 2019, 173, 721–731. [Google Scholar] [CrossRef]
  22. Wang, J.; Zhao, L.; Wang, X. A comparative study of pure and zeotropic mixtures in low-temperature solar Rankine cycle. Appl. Energy 2010, 87, 3366–3373. [Google Scholar] [CrossRef]
  23. García-Cascales, J.; Vera-García, F.; Corberán-Salvador, J.; Gonzálvez-Maciá, J. Assessment of boiling and condensation heat transfer correlations in the modelling of plate heat exchangers. Int. J. Refrig. 2007, 30, 1029–1041. [Google Scholar] [CrossRef]
  24. Zhang, C.; Liu, C.; Wang, S.; Xu, X.; Li, Q. Thermo-economic comparison of subcritical organic Rankine cycle based on different heat exchanger configurations. Energy 2017, 123, 728–741. [Google Scholar] [CrossRef]
  25. Zhang, C. Comprehensive Performance Evaluation and Experimental Study of Low-Grade Waste Heat Organic Rankine Cycle. Ph.D. Thesis, Chongqing University, Chongqing, China, 2018. [Google Scholar]
  26. Amalfi, L.R.; Vakili-farahani, F.; Thome, R.J. Flow boiling and frictional pressure gradients in plate heat exchangers. Part 1: Review and experimental database. Int. J. Refrig. 2016, 61, 166–184.3. [Google Scholar] [CrossRef]
  27. Jafari, A.; Sadeghianjahromi, A.; Wang, C.C. Experimental and numerical investigation of brazed plate heat exchangers—A new approach. Appl. Therm. Eng. 2022, 200, 117694. [Google Scholar] [CrossRef]
  28. Kim, B.M.; Park, Y.C. An experimental study on single phase convection heat transfer and pressure drop in two brazed plate heat exchangers with different chevron shapes and hydraulic diameters. J. Mech. Sci. Technol. 2017, 31, 2559–2571. [Google Scholar] [CrossRef]
  29. Sha, H.; Yu, H.; Ma, Q.; Yang, Y.; Feng, Y.; Luo, S. Investigation of lifelong learning methods with elastic weight consolidation (EWC) for low-temperature ORC scroll expander modeling. Appl. Therm. Eng. 2025, 278, 127359. [Google Scholar] [CrossRef]
  30. Peris, B.; Navarro-Esbrí, J.; Molés, F.; Mota-Babiloni, A. Experimental study of an ORC (organic Rankine cycle) for low grade waste heat recovery in a ceramic industry. Energy 2015, 85, 534–542. [Google Scholar] [CrossRef]
  31. Bianchi, M.; Branchini, L.; De Pascale, A.; Orlandini, V.; Ottaviano, S.; Peretto, A.E.; Melino, F.; Pinelli, M.; Spina, P.R.; Suman, A. Experimental investigation with steady-state detection in a micro-ORC test bench. Energy Procedia 2017, 126, 469–476. [Google Scholar] [CrossRef]
  32. Luo, J.; Lu, P.; Chen, K.; Luo, X.; Chen, J.; Liang, Y.; Yang, Z.; Chen, Y. Experimental and simulation investigation on the heat exchangers in an ORC under various heat source/sink conditions. Energy 2023, 264, 126189. [Google Scholar] [CrossRef]
  33. Shanghai Haomai Energy Co. R245fa Refrigerant. Available online: https://detail.1688.com/offer/899707422332.html (accessed on 1 October 2025).
  34. Made-in-China.com. R245fa Refrigerant. Available online: https://zjjushen.en.made-in-china.com/product/ynZpKucOwCVW/China-99-9-High-Purity-Refrigerant-Gas-R245fa-with-Comprtitive-Prices.html (accessed on 1 October 2025).
Disclaimer/Publisher’s Note: The statements, opinions and data contained in all publications are solely those of the individual author(s) and contributor(s) and not of MDPI and/or the editor(s). MDPI and/or the editor(s) disclaim responsibility for any injury to people or property resulting from any ideas, methods, instructions or products referred to in the content.

Article Metrics

Citations

Article Access Statistics

Multiple requests from the same IP address are counted as one view.