Abstract
With the increasing penetration of renewable energy such as solar and wind power into the grid as well as the addition of modern types of versatile loads such as electric vehicles, the grid system is more prone to system failure and instability. One of the possible solutions to mitigate these conditions and increase the system efficiency is the integration of virtual power plants into the system. Virtual power plants can aggregate distributed energy resources such as renewable energy systems, electric vehicles, flexible loads, and energy storage, thus allowing for better coordination and optimization of these resources. This paper proposes a genetic algorithm-based optimization to coordinate the different elements of the energy management system of a virtual power plant, such as the energy storage system and charging/discharging of electric vehicles. It also deals with the random behavior of the genetic algorithm and its failure to meet certain constraints in the final solution. A novel method is proposed to mitigate these problems that combines a genetic algorithm in the first stage, followed by a gradient-based method in the second stage, consequently reducing the overall electricity bill by 50.2% and the simulation time by almost 95%. The performance is evaluated considering the reference set-points of operation from the obtained solution of the energy storage and electric vehicles by performing tests using a detailed model where power electronics converters and their local controllers are also taken into account.
1. Introduction
The growing demand for new types of electrical devices, such as electric vehicles (EVs) with bidirectional high-powered fast chargers, is putting extra pressure on power grids, leading to greater stress and energy shortages. Moreover, the rising demand from end-use electrification such as heat pumps and industrial loads contributes to this additional electricity consumption. At the same time, rising prices for fossil fuels are driving up electricity bills for everyday households. On the positive side, the rapid adoption of renewable energy sources is increasing, especially due to the falling price of solar panels. However, the existing infrastructure of the electrical grids was not originally designed to handle high bidirectional flows from distributed energy resources (DERs) or clustered EV charging stations and must be coordinated to maintain the balance in the system. One of the possible solutions is to use energy storage (ES)-based systems such as virtual power plants (VPPs), which help to coordinate and optimize energy use. However, as different renewable energy sources are fed into the grid, distributed energy resources (DERs) must meet stricter grid codes and technical standards. A flexible and intelligent VPP can help to ensure compliance with these rules. Within the power system, VPPs offer a range of benefits from managing energy flows to providing essential support services [1,2,3]. There are also various strategies to align the technical performance of VPPs with commercial objectives [4].
In order to justify the method of current study, the literature review emphasizes studies relating to the optimization of energy resources. Mixed-integer linear programming (MILP) is one of the most widely used techniques but other strategies have also been researched, such as dynamic programming (DP), model predictive control (MPC), nonlinear programming (NLP), and heuristic approaches like genetic algorithms (GAs) and particle swarm optimization (PSO). Artificial intelligence (AI) techniques like reinforcement learning have begun to attract more attention in recent years [5]. However, there are still certain obstacles that AI-based solutions must overcome, especially when it comes to translating what AI learns in simulations into real-world systems and rigorously adhering to unbreakable real-world standards [6]. Dijkstra’s algorithm is used to analyze traffic conditions where EVs can participate to provide ancillary services but fails to deliver incentives to the consumers [7].
The PSO algorithm is presented in a modified form in [8]. The cost estimate incorporates a dynamic penalty factor that requires careful adjustment. This method, however, re-runs the algorithm every hour and does not use prediction data for solar generation or energy consumption. A more straightforward technique to enhance on-site solar energy consumption is employed in [9]. It is less complicated to calculate and accounts for the initial setup and maintenance costs but it is limited to two-level power pricing plans (such as peak and off-peak rates). A modified form of DP is employed in [10] to guarantee that the battery reaches a predetermined charge level by the end of the day. However, this strategy involves dividing the battery’s charge levels into steps, which provides a non-smooth and limited search space. The optimal method of charging and discharging a battery is likewise planned using DP in [11], this time taking battery aging into account. The system’s overall cost over time (net present cost) is used to gauge its performance rather than user profit.
In [12], the effects of varying battery sizes and metering configurations on system performance are investigated using a scheduling technique based on quadratic programming (QP). This strategy also lessens the pressure on the grid by discouraging abrupt voltage swings brought on by a high power flow. In order to control energy use for groups that combine energy sources, loads, and storage that are all connected to the distribution grid, ref. [13] uses an improved version of the sparrow search algorithm (SSA), which includes a multi-objective variant. Ref. [14] concentrates on limiting energy exchanges with the grid in order to alleviate strain on the power grid and lower hidden expenses like network charges. Although the goal of these techniques is to use less energy, they also produce better financial results than simple tactics like charging the battery only when solar generation surpasses consumption. Another strategy in [15] aims to control battery operation and lower energy use. It employs linear programming and weighted sums to aggregate several goals into a single cost function. However, the selection of those weights has a significant impact on the outcomes. Reinforcement learning (RL) is one of the newest techniques. A Proximal Policy Optimization-based system for energy management that does not require forecast data is created in [16]. However, this approach necessitates a lot of training samples and careful tweaking, and assumes stable feed-in tariffs and electricity prices. Simpler, centralized optimization techniques can usually handle residential applications, in contrast to large-scale systems that employ distributed algorithms.
Numerous studies that concentrate on energy management optimization oversimplify the system and frequently fail to take into account the behavior of the low-level controllers and associated power electronics (PECs). To maximize the system’s potential, however, these components are essential, as is the way energy storage systems (ESSs) must function.
In contrast to strictly optimization-based approaches, research that incorporates these lower-level controls demonstrates that the system may be reliably operated in significantly shorter time periods (down to seconds). For instance, ref. [17] examines an off-grid system that is controlled by a straightforward EMS based on flowcharts and is fueled by both solar panels and a wind turbine. In order to manage with uncertainty, ref. [18] modifies the battery’s minimum charge level based on predictions of energy generation and use. It is interesting to note that, in contrast to many systems that depend on additional ES devices, this method sends control signals straight from the top-level controller to the inverter. To help fulfil peak demand, an electric car is utilized in [19] rather than a second battery. Although this system was evaluated under different conditions, neither the overall energy consumption nor the cost reductions were measured. Although these rule-based EMSs are simpler to set up, they are insufficient for reaching specific objectives like cost or energy savings while adhering to system constraints. Nevertheless, these less complex technologies are crucial, particularly when it comes to assisting energy systems in continuing to function in the face of unforeseen circumstances like black starts (the process of restarting the grid following a complete blackout) or grid disruptions.
This paper’s primary focus is on the application of a GA to optimize the microgrid’s components, which include EVs, ESSs, PV power, and home loads. In order to evaluate the originality of the current study compared with other papers that use GAs for VPPs, a literature review is conducted. In comparison to PSO and the firefly algorithm, ref. [20] suggests an adaptive GA optimization strategy that can reduce energy costs for consumers. Two case studies, one for a single family and the other for a community of twenty homes with PV energy sharing, are examined using GA optimization to reduce energy expenses [21]. A GA is used in [22] to enhance demand-side management (DSM) in sizable industrial structures; by scheduling controllable loads and incorporating renewable energy for more effective load sharing, the objective is to decrease peak electricity consumption, minimize energy expenditure, and enhance the peak-to-average ratio (PAR). In order to better schedule when household appliances operate, a VPP that also leverages a GA is launched in [23]; based on actual data from Moroccan households, it achieves cost reductions of up to 63.48% while accounting for fluctuating electricity prices, the availability of solar power, and user comfort. In a similar way, ref. [24] offers a decentralized and intelligent EMS that optimizes energy distribution through an improved GA; the findings demonstrate that improving a system’s capacity to lower peak demand lowers operational expenses and boosts energy efficiency. Under a dynamic pricing model, ref. [25] presents a Home Energy Management System (HEMS) that employs both a GA and MILP to strike a compromise between reducing energy expenditure and dependence on the grid; according to the findings, MILP outperforms, lowering costs by 15% and raising the Independence Performance Index (IPI).
Nevertheless, none of these studies discussed above consider EVs in the microgrid configuration, except for [23]. Another point to be noted is that in most of these proposals, the battery is completely discharged to reduce the cost as much as possible whereas in this case, it is limited to a certain value to limit the exploitation of the ESS. A management system for a residential VPP that integrates solar energy, ES, EVs, and household energy use is shown in [26]; to maximize financial gains and the provision of grid support services, it employs a GA. According to the study, single-objective optimization outperforms multi-objective techniques in the studied cases. Despite the fact that EVs are discussed in this paper, it is unclear how all of the system parameters are fulfilled. Also, the computation time of performing the GA is far higher (approximately 90%) than the proposed approach of the current paper. Ref. [27] explains these limitations but lacks validation of the results by using PECs consisting of low-level controllers.
In the second stage of optimization, a gradient-based method (GBM)—namely, the Fmincon solver from MATLAB 2023b version—is used to refine the results after the first stage and further improve the cost minimization as well as the fulfilment of the constraints. The research in [28,29] demonstrates that the Fmincon solver is a proven method for minimizing costs. However, according to these references, the performance of this method when used alone is considerably less capable compared with the method proposed in this paper. Furthermore, as this study does, none of the examined publications investigate a two-stage optimization strategy that combines a GA and a GBM while also carefully confirming that all constraints are satisfied. Moreover, none of the papers include the addition of low-level controllers for the validation of the obtained operation set-points after performing optimization.
In light of the above literature review, the work undertaken in this paper can be summarized using the following points:
- The proposed VPP employs a two-stage optimization framework that integrates economic objectives while satisfying the operational constraints. Specifically, the optimization problem incorporates the optimal scheduling of EV charging and discharging during off-peak (valley) hours to minimize electricity bills, as well as the strategic dispatch of ESS power to the grid either by supplying energy during peak hours or drawing energy during valley hours.
- In the first stage, a GA is used to explore the solution space, recognizing the stochastic nature of GA results; therefore, the algorithm is executed several times to ensure the robustness of the solution.
- In the second stage, a GBM—specifically, the Fmincon solver from MATLAB—is applied to refine the solution due to computational efficiency. Any remaining unmet constraints are subsequently resolved using analogous corrections in the last hour of operation.
- To validate the proposed approach, a real-world case study is conducted, demonstrating the effectiveness of the method in achieving economic objectives while satisfying all the defined operational constraints. The functionality of the proposed VPP is evaluated using a detailed system model that incorporates PECs, along with their associated low-level controllers.
The paper is structured as follows: Section 2 consists of the case study, followed by the optimization methodology in Section 3. Section 4 consists of optimization results and Section 5 includes the validation of the proposed algorithm using low-level controllers. Finally, Section 6 consists of the conclusions.
2. Case Study
The main ideas and elements of the case study are described in this section. An EV, a PV power plant, a battery-based ESS, and a collection of residential houses comprise the VPP under study, as shown in Figure 1. The model includes a household with an hourly load profile forecasted for a full day. Based on recent studies, the household reflects electricity consumption levels typical of medium voltages [30]. This consumption profile was selected due to the availability of reliable consumption data for medium-demand households and to introduce demand variability within the system. Even though a VPP consists of more than one microgrid, this case study only considers one microgrid due to its simplicity. The main objective of the VPP is to obtain an optimized price and decrease the optimization time by exchanging data with the microgrid, where it sends new set-points of operation to the ESS and EV.
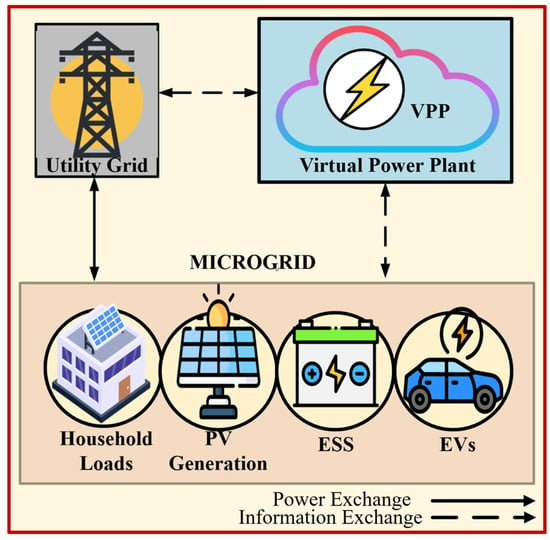
Figure 1.
Elements of the VPP under study.
Using a generating profile based on the one in [31], the communal PV power plant taken into consideration in the study has an installed capacity of 10 kWp. This size is in line with common self-consumption practices seen in Spain, where peak installed capacity is frequently constrained to prevent excessive contracted power tariffs linked to higher levels of grid connection [32].
A collection of lithium-ion batteries under central supervision and controlled by PECs makes up the ESS. The system enables a maximum charge/discharge rate of ±2.5 kW and has a total storage capacity of 10 kWh. According to [33], its operation is limited to a state of charge (SoC) range of 20% to 90% to increase the lifespan of the ESS [34]. An EV with a 7.5 kWh battery and an average energy consumption rate of 20 kWh per 100 km with a microgrid is used. Conventional domestic single-phase outlets of 230 V and 32 A comprise the charging infrastructure. It is expected that each EV’s initial SoC is 50%. According to the Spanish energy market, charging is planned for the first eight hours of the day in order to take advantage of the lower electricity rates that apply during off-peak hours on workdays [35]. The information above is presented as a summary below in Table 1.

Table 1.
Case study parameters.
This study’s main goal is to reduce the cost of electricity. As a result, the optimization framework incorporates the previously described charging schedule. The baseline scenario, in which no optimization is used, shows the total power generation and consumption over 24 h intervals in Figure 2. The total power generation is the energy that is produced by the PV and the total demand comprises the household loads and EV. The total power transferred between the grid and the EMS is also displayed in Figure 2. Due to the EV being charged at full capacity, there is a discernible spike in demand between hours 0 and 1. As the EV is fully charged, it is no longer demanding any power, and the demand is mostly from the household loads after this hour. To lower total energy costs, the main goal is to lessen this peak and spread the charging load more efficiently. In Section 3, a more thorough examination is presented.
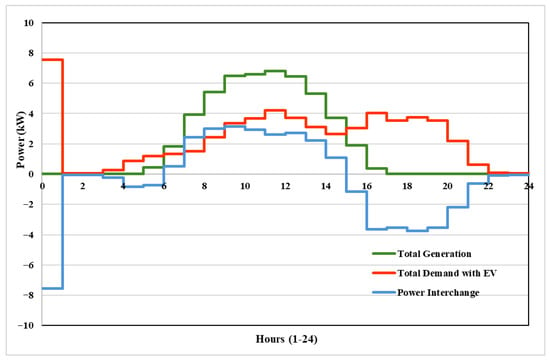
Figure 2.
Total generation of the PV (in green) and total demand of the household and EV (in red), excluding the ESS and power interchange (in blue), with distribution grid in initial condition.
As previously stated, one of the main goals of the optimization process is to reduce electricity costs by planning EV charging for off-peak hours. The objective function must, therefore, be developed using electricity prices over a 24 h period. Different types of contracts control the price of power in the Spanish energy market. In contrast to variable-rate contracts, which have time-dependent tariffs that fluctuate hourly, fixed-rate contracts keep a constant price throughout the day, regardless of changes in demand. The current study focuses on a variable pricing system with the goal of lowering operating costs. Based on statistics from the Iberian energy market, Figure 3 shows the prices for buying and selling power as of 3 February 2025 [36]. The VPP’s daily energy costs, under the initial, non-optimized conditions, are EUR 3.1366.
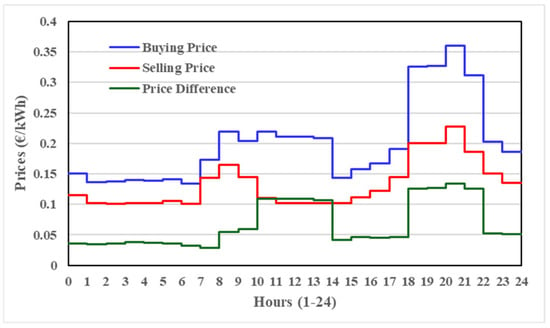
Figure 3.
Energy prices for prosumers under the Spanish regulatory framework as of 3 February 2025 [36].
3. Optimization Methodology
The VPP is economically optimized in this study using a GA, which integrates an objective function and a set of operational restrictions [37]. The optimization framework’s main goal is to lower electricity costs while abiding by several technological restrictions. These include the rated capabilities of the EV chargers and ESS converter as well as the ESS’s SoC limitations. The most optimal hourly charging and discharging schedules for the ESS and EVs are produced by the optimization. Current published research acknowledges the use of a GA as a reliable and efficient method to manage these nonlinear, limited optimization issues in VPPs [38,39]. Furthermore, the MATLAB-based Fmincon solver, which is based on GBM, has proved to be dependable in VPP optimization applications [40]. The various stages of the optimization process are depicted in the flowchart presented in Figure 4.
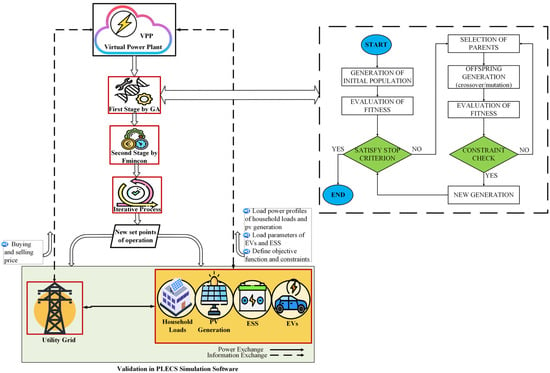
Figure 4.
Strategy of two-stage optimization procedure.
As previously stated, the central objective of the optimization problem is to minimize the electricity cost incurred by the consumer. To achieve this, it is first necessary to establish the power balance within the VPP, as formulated in Equation (1).
Here, Pgrid(h) represents power interchanged with the grid at hour h; PPV(h), PLD(h), PESS(h), and PEV(h) represent PV generation power at hour h in kW, load demand power at hour h in kW, ESS power at hour h (positive when charging) in kW, and EV power at hour h (positive when charging) in kW, respectively. The objective function in (2) aims to minimize the electricity bill by discharging power from the ESS to the grid when the selling price is high and drawing power from the grid when the purchasing price is low.
The optimization follows the ESS constraints outlined in (3)–(5). Here, Ipur(h) and Isel(h) represent a binary index of 1 when Pgrid(h) ≤ 0 and Pgrid(h) > 0, respectively, where pur stands for purchasing and sel represents selling. ppur(h) defines the price for purchased energy at hour h in EUR/kWh and psel(h) the price for sold energy at hour h in EUR/kWh. The ESS is required to operate within the predefined upper and lower bounds set by the converter capacity, the physical limitations of the system components, and grid-related constraints. Accordingly, the power limits for ESS charging and discharging are formally expressed in Equation (3).
To ensure adequate energy availability for the following day, Equations (4) and (5) impose restrictions on the permissible deviation in the SoC between the start and end of the 24 h period. In this context, PESSmax denotes the maximum allowable ESS power during both charging and discharging, measured in kW, while SoC(h) represents the ESS’s SoC at hour h, expressed as a percentage. The symbol ηch refers to the charging efficiency of the ESS expressed per unit (pu). represents ESS power during a specific hour, h. and represent the lowest and highest allowable limits for the SoC of the ESS.
where
The constraints related to the EVs are shown in (7)–(9).
In order to save electricity costs, EV charging and discharging must only take place during off-peak, or valley, hours, i.e., 00:00 to 8:00. According to Equation (9), each EV must reach a complete SoC of 100% during this time. Equation (7) establishes the maximum EV charging power limit by multiplying the number of EVs connected to the system by the rated capacity of each individual charger, which is equal to 1 in this case. Equation (8) states that the power allotted to EVs is limited to zero outside of this specified time range. The number of EVs connected at hour h is indicated by nEV(h). nhEV is the total number of hours that at least one EV is connected. Here, PEVmax denotes the maximum allowable EV power during both charging and discharging, measured in kW, while ηEV refers to the charging efficiency of the EV expressed per unit (pu).
The objective function and its constraints related to the second-stage optimization of the GBM is based on Equations (10)–(13).
The function to be minimized is the objective function , which usually represents a cost objective and receives input from the GA’s first stage of optimization. For this optimization issue, the limitations related to the SoC of the EV and ESS are regarded as being the same as earlier. In this case, x can be described as follows:
Here, is the decision variable at iteration k, representing power dispatch decisions; α is the step size (learning rate); and is the gradient of the objective function, given by
For each time step h,
Ultimately, following the second optimization stage, it is evident that the EV’s SoC constraint is not entirely met. To analogously satisfy the necessary constraint of EVs, Equation (14) is utilized.
Here, the remaining power is provided from the grid to fully charge the EVs during the final hour (7 to 8 h) if their total SoC does not reach 7.5 kWh at the end of 8 h.
4. Optimization Results
Three different types of scenarios are examined in the case study. For the base case scenario, when no optimization algorithm is considered, the price during the day is determined in the first scenario. Figure 5 serves as the case study’s starting point, where the electric cars are charged during the first hour of the night (from 0:00 to 1:00) and the ESS does not participate in this case. It is evident that the initial state has a high peak in demand. Therefore, the base price in the starting condition, 3.1366 EUR/day, is the reference price to be improved upon.
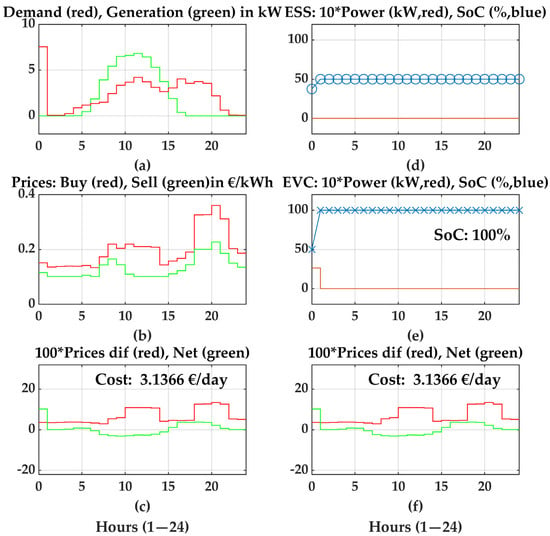
Figure 5.
References without optimization in the initial condition. The graphs on the left from top to bottom show (a) demand and generation, (b) buying and selling prices, and (c) cost per day. The graphs on the right from top to bottom show the (d) power and SoC of the ESS, (e) power and SoC of the EVC, and (f) cost per day.
4.1. Analysis of the Random Effect and Justification of the Optimization Process in Three Steps
The default GA of MATLAB uses membership functions like Creation, Crossover, Fitness Scaling, Hybrid, Mutation, Output, Plot, and Selection. The GA is programmed with a maximum of 2000 generations and a tolerance of 10−2. Population size is considered to be 48, in which the first 24 are allocated to the ESS without EVs and the other 24 are allocated with EVs, and these are combined to obtain a profile for 24 h. Function tolerance and Max generations are considered to be 1 and infinite, respectively. The Max time parameter is not considered in this case; hence, the optimization time could be greatly decreased by using this method.
The research in [26,27,41] provide the parameters considered for this case study. In MATLAB, the GBM optimization is defined as Fmincon, and, in this instance, the default parameters are also taken into account. Given the random nature of the optimization, the GA optimization process is run 1000 times to achieve the lowest cost, followed by the GBM.
The outcomes are shown in Figure 6. It can be concluded that after 1000 rounds, it is evident that the EV’s SoC limitation is not satisfied, not even once. Therefore, during the final hour of the EV’s charging time, the SoC must be adjusted. The primary significance of obtaining this result lies in the observation that although the lowest cost achieved through optimization occurs at the 969th iteration when only the GA is applied, this value decreases to the 671st iteration when the combined GA–Fmincon approach is implemented. Furthermore, after incorporating the third-stage manual adjustment, the minimum cost is attained at the 64th iteration. This progression clearly demonstrates that increasing the number of optimization stages effectively reduces the number of iterations required to reach the minimum cost, thereby enhancing the overall efficiency of the optimization process as well as minimizing the computation time. Following these attempts, the minimum prices listed below are achieved:
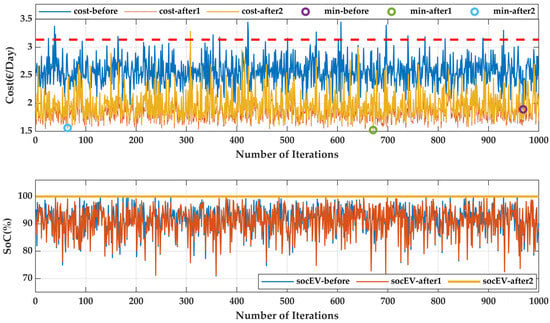
Figure 6.
The first diagram shows the number of iterations versus change in cost in which the cost before optimization after using only a GA and using both a GA and GBM are highlighted. The second diagram shows the SoC of the EV during the three scenarios with respect to the number of iterations.
- Before (only GA): EUR 1.8930 (on iteration 969).
- After the first stage (GA + Fmincon): EUR 1.5235 (on iteration 671).
- After the second stage (GA + Fmincon + SoC adjustment): EUR 1.5620 (on iteration 64).
As the cost is lowest after satisfying the SoC constraint of the EV in this instance, as shown in Figure 6, iteration 64 is regarded as the best-case option for the case study. Figure 7 displays the reference solution (attempt 64).
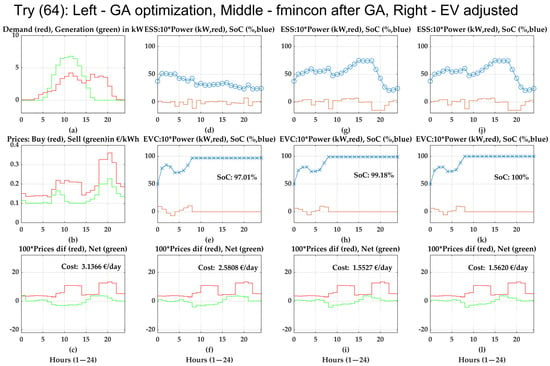
Figure 7.
References for the optimal solution where the SoC of the ESS and EV, along with the cost per day, is shown. The graphs starting on the left from top to bottom show (a) demand and generation, (b) buying and selling prices, and (c) cost per day in initial condition. The next graphs to the right from top to bottom show (d) the power and SoC of the ESS, (e) the power and SoC of the EV, and (f) cost per day after using only GA. Then, the next graphs to the right from top to bottom show (g) the power and SoC of the ESS, (h) the power and SoC of the EV, and (i) cost per day, after using both GA and Fmincon. The graphs on the far right from top to bottom show (j) the power and SoC of the ESS, (k) the power and SoC of the EV, and (l) cost per day, after performing the manual adjustment.
4.2. Analysis of the Optimized Results Based on the Number of Iterations
Building upon the previous findings, this section presents an analysis of the minimum electricity cost attainable given a predefined number of optimization attempts. Figure 8a illustrates the resulting trends, highlighting both the best- and worst-case scenarios as a function of the number of iterations. The results indicate a significant reduction in cost variability with an increasing number of attempts, with uncertainty becoming almost negligible beyond approximately 450 iterations. This behavior suggests an almost exponential convergence pattern, which is consistent with the expected dynamics of stochastic optimization processes. Figure 8b displays the reduction curve, which further supports the idea that costs decrease as the number of iterations increases by taking into account the cost reduction as a percentage.
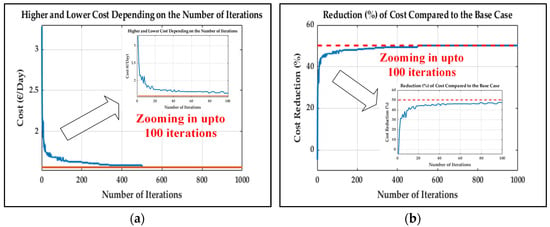
Figure 8.
(a) Higher (blue) and lower (red) costs, depending on the number of iterations. (b) Cost reduction (percentage in blue), depending on the number of iterations (maximum reduction after 1000 iterations in red).
4.3. Findings of the Results
After the second stage, the EV’s SoC must equal 7.5 kWh at the end of the final hour of charging, i.e., 8 h in this case. In the first stage of optimization, in which only the GA is considered (Before), it is possible to reduce the cost from the base case scenario in 983 out of 1000 cases, which accounts for 98.3%. The maximum price that can be reduced after the two-stage optimizations and by fulfilling all the constraints from the base case is EUR 1.5746 (50.2%). A few optimization iterations yield electricity costs that surpass the established reference benchmark. These instances are deemed suboptimal and, therefore, are excluded from the set of valid or feasible solutions. The optimization results are achieved in a randomized pattern; hence, it is necessary to complete the overall process including the three stages. Only the minimum price of the final stage should be considered as the final result. After the first and second stages, the EVs are charged on average at 7.28 kWh and 7.44 kWh, respectively; hence, the manual adjustment is necessary. The efficiency discrepancies between charging and discharging seem to be the cause of this phenomenon. The second stage manages to reduce the cost in 100% of the cases whereas the third stage reduces the cost in 999 out of 1000 cases. This is due to the excess purchase of power in the final hour to comply with the total charging constraint of the EV. After applying the “MaxTime” parameter within the GA to ensure full compliance with the EV charging constraint, the simulation time ranges between 35 and 40 min. In contrast, the proposed method—when executed without the “MaxTime” constraint—requires approximately 3 h to complete 1000 iterations. However, it has been observed that satisfactory results can be achieved with just 65 iterations, requiring only about 8 min and 13 s. This represents a reduction in simulation time of over 95%, highlighting the improved computational efficiency of the proposed approach.
5. Validation Using a PLECS Simulation Model
This section consists of the validation of the obtained set-points of operation after performing the optimization by using a detailed system model that incorporates PECs, along with their associated low-level controllers. The simplified diagram of the developed model is shown in Figure 9a. Figure 9b depicts a residential grid-connected system with PV generation and a lithium-ion battery serving as the ES device for this study. A bidirectional converter connects the battery to the DC bus and a boost converter interfaces the PV module with the system. Operationally, both DC-DC converters are interleaved. This topology was selected because of its capacity to lessen the current load on semiconductor components. Additionally, interleaving enables a fourfold reduction in filter size while preserving the same input current ripple compared with traditional converter arrangements [42,43,44].
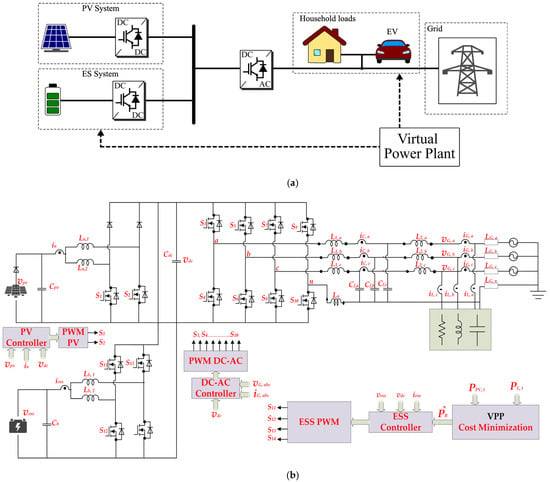
Figure 9.
(a) Simplified diagram of the residential system under study; (b) schematic diagram of the residential system under study.
Depending on the specific load characteristics and operational needs, either three-leg or four-leg two-level converters can be used for the DC-AC conversion step. Increased flexibility is crucial in residential applications, where electricity is usually supplied via low-voltage distribution networks that can handle several single-phase or unbalanced three-phase loads. A four-leg two-level converter with an LCL filter is used to facilitate future standalone operations and efficiently handle zero-sequence current components. Compared with a traditional three-leg converter, which can only control positive and negative sequence components, this arrangement has advantages [45]. A programmable three-phase voltage source connected in series with lumped impedance is used to model the grid impedance, which represents the electrical properties of the distribution line between the closest transformer and the PCC. Table 2 lists all the system parameters used in this investigation.

Table 2.
System parameters.
The L1, Ln internal resistor (R1, Rn), Cdc internal resistor (Rdc), L2 internal resistor (R2), Cf internal resistor (Ru), Lb internal resistor (Rb), Cpv internal resistor (Rpv), and Cb internal resistor (Rb) are all considered to be 10 mΩ. The power of the various energy exchange units in the system is determined by the following measurements, which are also utilized for the controllers:
- vpv—PV voltage;
- iu—PV converter input current;
- vess—battery voltage;
- ib—battery converter input current;
- vdc—DC bus voltage;
- iC,abc—DC-AC converter current;
- iL,abc—load currents;
- vG,abc—grid phase voltages at the PCC.
5.1. Local Controllers
The configuration of the local controllers for each system component is depicted in Figure 10. The controller of the PV system is tasked with ensuring the extraction of the maximum available power. To this end, a Maximum Power Point Tracking (MPPT) algorithm is employed to determine the optimal reference voltage v*pv, which corresponds with the maximum power output [35]. This reference voltage is subsequently processed by an outer Proportional–Integral (PI) controller to generate the reference current i*u, which is used as the input for the inner PI control loop. The resulting control signal is then scaled by the DC bus voltage vdc to produce the modulation signal for the converter.
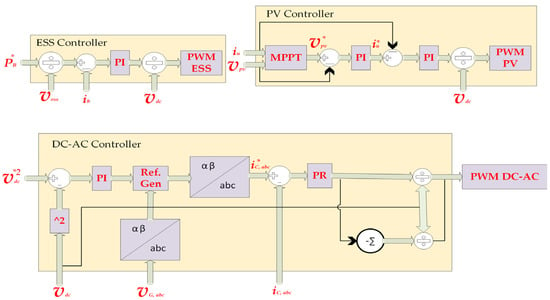
Figure 10.
Local controllers of the converter.
The controller for the DC-AC converter is responsible for regulating the DC bus voltage vdc while ensuring the generation of sinusoidal output currents. Voltage regulation is achieved through an outer PI controller. The controller’s output, along with the measured grid voltages vG,abc, is utilized to compute the reference currents iC,abc, which are designed to maintain operation at a unity power factor. To accurately track these reference currents, a Proportional–Resonant (PR) controller is implemented for each phase. The output of each PR controller is divided by the DC bus voltage vdc to derive the modulation signals for the inverter stage.
The ESS controller receives the reference power P*B as the input, which is subsequently converted into the corresponding battery reference current i*b by dividing it by the battery voltage vess. A PI controller processes this reference current, and its output is appropriately scaled to generate the modulation signal required for the bidirectional converter. This mechanism facilitates precise control of the battery’s charging and discharging cycles according to the reference power P*B provided by the VPP. The specific controller parameters and implementation details are presented in Table 3. The PI and PR controllers are defined by their respective transfer functions, GPI(s), and GPR(s), with the resonant frequency ω0 = 2πfg.

Table 3.
Controller parameters.
5.2. Results from the PLECS Simulation Model
The proposed control strategies must be computed in advance to define the battery’s scheduled power profile. This involves determining an hourly reference power P*B,t, which is updated on an hourly basis and transmitted to the ESS controller. The battery’s SoC is estimated by using the Coulomb counting method.
The acquisition of power profile data is enabled by the widespread deployment of smart meters. This study adopts an hourly resolution for both load and generation profiles. Notably, the proposed methodology is adaptable and can be extended to finer time intervals by modifying the relevant constraints and providing appropriately resolved input data. Here, the constraints are selected according to the previous case, and the inputs are taken from the final optimal output as shown in Figure 7 and fed into the PLECS simulation model. For simplicity, the EV is considered to be a current source in the model during simulation that supplies or demands power according to the references from the optimal results.
It can be observed from Figure 11 that after taking the references of operation of the ESS and EV from the optimal solution, the model behaves in an ideal way and the reference set-points are followed. The total cost of energy obtained in this way is 1.62 EUR/day, which deviates by only 3.85%.
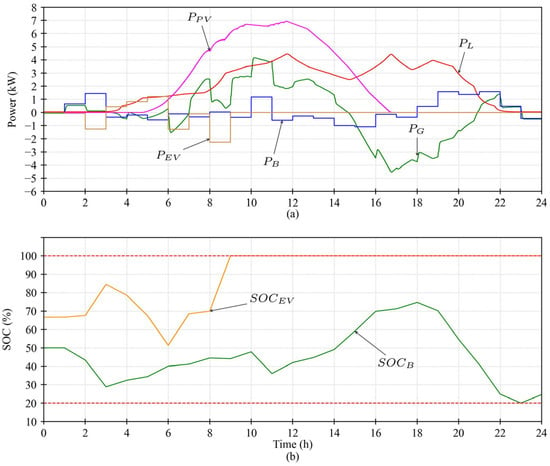
Figure 11.
Results from PLECS simulation model: (a) power; (b) SoC.
6. Conclusions
This study introduces an enhanced VPP for an MG by incorporating the optimal scheduling of EV charging and discharging during valley hours in conjunction with traditional DERs and household loads. The proposed VPP employs a novel two-stage optimization approach combining a GA and GBM, followed by a post-optimization adjustment phase to ensure that critical constraints—particularly the SoC of EVs—are satisfied, which represents a key innovation of this work. The validation of the VPP using local controllers is also performed.
According to the results, the combined optimization of a GA and GMB has proved to be a reliable optimization method for VPPs. The optimization outcomes are evaluated across multiple scenarios, demonstrating that, after 1000 iterations, electricity costs can be reduced by up to 50.2% compared with the base case. The convergence trend exhibits approximately exponential behavior, which is consistent with the characteristics of stochastic optimization processes. The simulation time is also significantly reduced by over 95% compared with traditional methods by performing 65 iterations. After performing first- and second-stage optimization, the EV has a SoC of 97.01% and 99.18%, respectively. Hence, the SoC constraint of the EV and ESS are manually fulfilled in the third stage.
In the final step, the results are validated by using a detailed model consisting of power electronics-based local controllers. The operation set-points from the optimal case are selected to be fed into the model and the output is observed. It can be observed that the results are almost identical, with a price deviation of only 3.85%.
In future work, grid congestion constraints such as peak shaving can be included to avoid any penalty. Moreover, environmental and social parameters can be considered together with economic benefits. The optimization problem can be implemented by using Python programming instead of MATLAB to make the program more accessible to the market. The algorithm can be applied to a more complex system composed of many energy communities to compute the optimization time and decrease the overall cost.
Author Contributions
Conceptualization, A.A.A. and L.M.-C.; methodology, E.R.-C.; software, A.A.A. and L.M.-C.; validation, A.A.A., L.M.-C., E.R.-C. and E.G.-R.; formal analysis, A.A.A. and L.M.-C.; resources, M.M.; writing—original draft preparation, A.A.A.; writing—review and editing, E.G.-R.; supervision, E.R.-C. and M.M.; project administration, E.R.-C.; funding acquisition, E.R.-C. All authors have read and agreed to the published version of the manuscript.
Funding
This research was funded by the European Union’s Horizon 2020 research and innovation program under the Marie Skłodowska-Curie grant agreement No. 955614.
Data Availability Statement
Publicly available datasets were analyzed in this study. The data can be found at https://www.esios.ree.es/en (accessed on 15 August 2025).
Conflicts of Interest
The authors declare no conflicts of interest. The funders had no role in the design of the study; in the collection, analyses, or interpretation of data; in the writing of the manuscript; or in the decision to publish the results.
References
- Abdeltawab, H.; Mohamed, Y.A.-R.I. Energy Storage Planning for Profitability Maximization by Power Trading and Ancillary Services Participation. IEEE Syst. J. 2022, 16, 1909–1920. [Google Scholar] [CrossRef]
- Eyer, J.; Corey, G. Energy Storage for the Electricity Grid: Benefits and Market Potential Assessment Guide; Tech. Rep. SAND2010-0815; Sandia National Laboratories: Albuquerque, NM, USA, 2010. [Google Scholar]
- Walawalkar, R.; Apt, J. Market Analysis of Emerging Electric Energy Storage Systems; Tech rep. DOE/NETL-2008/1330; NETL: Pittsburgh, PA, USA, 2008. [Google Scholar]
- Kumar, M.; Shanmugam, K.; Pradeep, K.; Filippone, M. Grid integration and application of Battery Energy Storage Systems. In Proceedings of the 2022 IEEE International Conference on Electronics, Computing and Communication Technologies (CONECCT), Bangalore, India, 8–10 July 2022; pp. 1–6. [Google Scholar] [CrossRef]
- Thirunavukkarasu, G.S.; Seyedmahmoudian, M.; Jamei, E.; Horan, B.; Mekhilef, S.; Stojcevski, A. Role of Optimization Techniques in Microgrid Energy Management Systems—A Review. Energy Strategy Rev. 2022, 43, 100899. [Google Scholar] [CrossRef]
- Trivedi, R.; Khadem, S. Implementation of Artificial Intelligence Techniques in Microgrid Control Environment: Current Progress and Future Scopes. Energy AI 2022, 8, 100147. [Google Scholar] [CrossRef]
- Caminiti, C.M.; Brigatti, L.G.; Spiller, M.; Rancilio, G.; Merlo, M. Unlocking Grid Flexibility: Leveraging Mobility Patterns for Electric Vehicle Integration in Ancillary Services. World Electr. Veh. J. 2024, 15, 413. [Google Scholar] [CrossRef]
- Hossain, M.A.; Pota, H.R.; Squartini, S.; Abdou, A.F. Modified PSO Algorithm for Real-Time Energy Management in Grid Connected Microgrids. Renew. Energy 2019, 136, 746–757. [Google Scholar] [CrossRef]
- Ahmadiahangar, R.; Karami, H.; Husev, O.; Blinov, A.; Rosin, A.; Jonaitis, A.; Sanjari, M.J. Analytical Approach for Maximizing Self-Consumption of Nearly Zero Energy Buildings-Case Study: Baltic Region. Energy 2022, 238, 121744. [Google Scholar] [CrossRef]
- Zhao, Z.; Keerthisinghe, C. A Fast and Optimal Smart Home Energy Management System: State-Space Approximate Dynamic Programming. IEEE Access 2020, 8, 184151–184159. [Google Scholar] [CrossRef]
- Li, Y.; Peng, J.; Jia, H.; Zou, B.; Hao, B.; Ma, T.; Wang, X. Optimal Battery Schedule for Grid-Connected Photovoltaic-Battery Systems of Office Buildings Based on a Dynamic Programming Algorithm. J. Energy Storage 2022, 50, 104557. [Google Scholar] [CrossRef]
- Ratnam, E.L.; Weller, S.R.; Kellett, C.M. An Optimization-Based Approach to Scheduling Residential Battery Storage with Solar PV: Assessing Customer Benefit. Renew. Energy 2015, 75, 123–134. [Google Scholar] [CrossRef]
- Liu, K.; Sheng, W.; Li, Z.; Liu, F.; Liu, Q.; Huang, Y.; Li, Y. An Energy Optimal Schedule Method for Distribution Network Considering the Access of Distributed Generation and Energy Storage. IET Gener. Transm. Distrib. 2023, 17, 2996–3015. [Google Scholar] [CrossRef]
- González-Romera, E.; Ruiz-Cortés, M.; Milanés-Montero, M.I.; Barrero-González, F.; Romero-Cadaval, E.; Lopes, R.A.; Martins, J. Advantages of Minimizing Energy Exchange Instead of Energy Cost in Prosumer Microgrids. Energies 2019, 12, 719. [Google Scholar] [CrossRef]
- Georgiou, G.S.; Christodoulides, P.; Kalogirou, S.A. Optimizing the Energy Storage Schedule of a Battery in a PV Grid-Connected nZEB Using Linear Programming. Energy 2020, 208, 118177. [Google Scholar] [CrossRef]
- Härtel, F.; Bocklisch, T. Minimizing Energy Cost in PV Battery Storage Systems Using Reinforcement Learning. IEEE Access 2023, 11, 39855–39865. [Google Scholar] [CrossRef]
- Merabet, A.; Tawfique Ahmed, K.; Ibrahim, H.; Beguenane, R.; Ghias, A.M.Y.M. Energy Management and Control System for Laboratory Scale Microgrid Based Wind-PV-Battery. IEEE Trans. Sustain. Energy 2017, 8, 145–154. [Google Scholar] [CrossRef]
- Mahmud, K.; Sahoo, A.K.; Ravishankar, J.; Dong, Z.Y. Coordinated Multilayer Control for Energy Management of Grid-Connected AC Microgrids. IEEE Trans. Ind. Appl. 2019, 55, 7071–7081. [Google Scholar] [CrossRef]
- Tran, V.T.; Islam, M.R.; Muttaqi, K.M.; Sutanto, D. An Efficient Energy Management Approach for a Solar-Powered EV Battery Charging Facility to Support Distribution Grids. IEEE Trans. Ind. Appl. 2019, 55, 6517–6526. [Google Scholar] [CrossRef]
- Majeed, M.A.; Phichaisawat, S.; Asghar, F.; Hussan, U. Optimal Energy Management System for Grid-Tied Microgrid: An Improved Adaptive Genetic Algorithm. IEEE Access 2023, 11, 117351–117361. [Google Scholar] [CrossRef]
- Mota, B.; Faria, P.; Vale, Z. Energy cost optimization through load shifting in a photovoltaic energy-sharing household community. Renew. Energy 2024, 221, 119812. [Google Scholar] [CrossRef]
- Sardar, A.; Khan, S.U.; Hassan, M.A.; Qureshi, I.M. A demand side management scheme for optimal power scheduling of industrial loads. Energy Syst. 2023, 14, 335–356. [Google Scholar] [CrossRef]
- El Makroum, R.; Khallaayoun, A.; Lghoul, R.; Mehta, K.; Zörner, W. Home Energy Management System Based on Genetic Algorithm for Load Scheduling: A Case Study Based on Real Life Consumption Data. Energies 2023, 16, 2698. [Google Scholar] [CrossRef]
- Liu, D.; Wang, L.; Liu, M.; Jia, H.; Li, H.; Wang, W. Optimal Energy Storage Allocation Strategy by Coordinating Electric Vehicles Participating in Auxiliary Service Market. IEEE Access 2021, 9, 95597–95607. [Google Scholar] [CrossRef]
- Mohan, A.; Singh, S.; Thirumala, K.; Ilango, G.S. A Comparative Study on Genetic Algorithm and Mixed Integer Linear Programming based Optimal Home Energy Management System. In Proceedings of the 2023 IEEE International Conference on Power Electronics, Smart Grid, and Renewable Energy (PESGRE), Trivandrum, India, 17–20 December 2023; pp. 1–6. [Google Scholar] [CrossRef]
- González-Romera, E.; Romero-Cadaval, E.; Roncero-Clemente, C.; Milanés-Montero, M.I.; Barrero-González, F.; Alvi, A.A. A Genetic Algorithm for Residential Virtual Power Plants with Electric Vehicle Management Providing Ancillary Services. Electronics 2023, 12, 3717. [Google Scholar] [CrossRef]
- Alvi, A.A.; Romero-Cadaval, E.; González-Romera, E.; Milanés-Montero, M.I.; Barrero-González, F.; Mart, L. A Novel Iteration Based Two-Stage Optimization in Energy Management Systems Application for Cost Minimization. In Proceedings of the 2025 IEEE 19th International Conference on Compatibility, Power Electronics and Power Engineering (CPE-POWERENG), Antalya, Türkiye, 20–22 May 2025; pp. 1–6. [Google Scholar] [CrossRef]
- Horrillo-Quintero, P.; García-Triviño, P.; Carrasco-González, D.; Sarrias-Mena, R.; Tostado, M.; Jurado, F.; Sapera, L.S.; Fernández-Ramírez, L.M. Adaptive multi-objective real-time hierarchical control for isolated microgrid clusters utilizing an enhanced particle swarm optimization strategy to optimize costs and emissions. Electr. Power Syst. Res. 2026, 250, 112169. [Google Scholar] [CrossRef]
- Selim, A.; Mo, H.; Pota, H.; Dong, D. Day ahead scheduling of battery energy storage system operation using growth optimizer within cyber-physical-social systems. Energy 2025, 331, 136675. [Google Scholar] [CrossRef]
- Martínez-Caballero, L.; Kot, R.; Milczarek, A.; Malinowski, M. Comparison of Energy Storage Management Techniques for a Grid-Connected PV- and Battery-Supplied Residential System. Electronics 2024, 13, 87. [Google Scholar] [CrossRef]
- Ruiz-Cortés, M.; González-Romera, E.; Amaral-Lopes, R.; Romero-Cadaval, E.; Martins, J.; Milanes-Montero, M.I.; Barrero-Gonzalez, F. Optimal charge/discharge scheduling of batteries in microgrids of prosumers. IEEE Trans. Energy Convers. 2019, 34, 468–477. [Google Scholar] [CrossRef]
- Roldán Fernández, J.M.; Burgos Payán, M.; Riquelme Santos, J.M. Profitability of household photovoltaic self-consumption in Spain. J. Clean. Prod. 2021, 279, 123439. [Google Scholar] [CrossRef]
- Gallego-Castillo, C.; Heleno, M.; Victoria, M. Self-consumption for energy communities in Spain: A regional analysis under the new legal framework. Energy Policy 2021, 150, 112144. [Google Scholar] [CrossRef]
- Caminiti, C.M.; Merlo, M.; Fotouhi Ghazvini, M.A.; Edvinsson, J. optimHome: A Shrinking Horizon Control Architecture for Bidirectional Smart Charging in Home Energy Management Systems. Energies 2024, 17, 1963. [Google Scholar] [CrossRef]
- BOE No. 306, 22 December 2022. Resolución de 15 de Diciembre de 2022, de la Comisión Nacional de los Mercados y la Competencia, por la que se Establecen los Valores de los Peajes de Acceso a Las Redes de Transporte y Distribución de Electricidad de Aplicación a Partir del 1 de Enero de 2023 (Resolution of 15 December 2022, of CNMC, that Approves Transmission and Distribution Tariffs, from 1 January 2023). Available online: https://www.boe.es/diario_boe/txt.php?id=BOE-A-2022-21799 (accessed on 15 January 2024).
- REE-ESIOS, 3 February 2025. Market and Prices. Available online: https://www.esios.ree.es/en (accessed on 26 February 2025).
- Chang, Y.-C.; Lin, J.-K.; Chuang, M.-H. Optimal chiller loading by genetic algorithm for reducing energy consumption. Energy Build. 2005, 37, 147–155. [Google Scholar] [CrossRef]
- Celik, B.; Roche, R.; Bouquain, D.; Miraoui, A. Decentralized neighborhood energy management with coordinated smart home energy sharing. IEEE Trans. Smart Grid 2018, 9, 6387–6397. [Google Scholar] [CrossRef]
- Holland, J.H. Adaptation in Natural and Artificial Systems: An Introductory Analysis with Applications to Biology, Control, and Artificial Intelligence; MIT Press: Cambridge, MA, USA, 1992. [Google Scholar]
- Hosseini, E.; Horrillo-Quintero, P.; Carrasco-Gonzalez, D.; García-Triviño, P.; Sarrias-Mena, R.; García-Vázquez, C.A.; Fernández-Ramírez, L.M. Optimal energy management system for grid-connected hybrid power plant and battery integrated into multilevel configuration. Energy 2024, 294, 130765. [Google Scholar] [CrossRef]
- Alvi, A.A.; Martínez-Caballero, L.; Romero-Cadaval, E.; González-Romera, E.; Kot, R.; Malinowski, M. Guidelines for the Application of Genetic Algorithm in Energy Management System. In Proceedings of the IECON 2024—50th Annual Conference of the IEEE Industrial Electronics Society, Chicago, IL, USA, 3–6 November 2024; pp. 1–6. [Google Scholar] [CrossRef]
- Sakasegawa, E.; Chishiki, R.; Sedutsu, R.; Soeda, T.; Haga, H.; Kennel, R.M. Comparison of Interleaved Boost Converter and Two-Phase Boost Converter Characteristics for Three-Level Inverters. World Electr. Veh. J. 2023, 14, 7. [Google Scholar] [CrossRef]
- Kroičs, K.; Staņa, Ģ. Bidirectional Interleaved DC–DC Converter for Supercapacitor Energy Storage Integration with Reduced Capacitance. Electronics 2023, 12, 126. [Google Scholar] [CrossRef]
- Kot, R.; Stynski, S.; Stepien, K.; Zaleski, J.; Malinowski, M. Simple Technique Reducing Leakage Current for H-Bridge Converter in Transformerless Photovoltaic Generation. J. Power Electron. 2016, 16, 153–162. [Google Scholar] [CrossRef][Green Version]
- Rojas, F.; Cárdenas, R.; Burgos-Mellado, C.; Espina, E.; Pereda, J.; Pineda, C.; Arancibia, D.; Díaz, M. An Overview of Four-Leg Converters: Topologies, Modulations, Control and Applications. IEEE Access 2022, 10, 61277–61325. [Google Scholar] [CrossRef]
Disclaimer/Publisher’s Note: The statements, opinions and data contained in all publications are solely those of the individual author(s) and contributor(s) and not of MDPI and/or the editor(s). MDPI and/or the editor(s) disclaim responsibility for any injury to people or property resulting from any ideas, methods, instructions or products referred to in the content. |
© 2025 by the authors. Licensee MDPI, Basel, Switzerland. This article is an open access article distributed under the terms and conditions of the Creative Commons Attribution (CC BY) license (https://creativecommons.org/licenses/by/4.0/).