Abstract
Animal farming produces large volumes of underutilised by-products, such as poultry feathers (PF), often discarded in landfills or incinerated, causing environmental concerns. Transforming such residues into valuable energy carriers aligns with sustainable waste-to-energy (WtE) management. Pyrolysis represents a versatile thermochemical pathway for converting organic wastes into gaseous, liquid, and solid fuels. This study investigates slow pyrolysis of PF, lignite (LG), and their blends at pilot scale using a uniquely designed, patent-pending reactor bridging laboratory research with industrial practice. Experiments were conducted at 20 °C·min−1, temperatures of 500–800 °C, and pressures from 0.1 to 1.0 MPa. PF pyrolysis produced mainly gas (70.1%), suitable for energy recovery, with smaller fractions of char (15.3%) and oil (14.6%). LG yielded predominantly char (59.9%), with lower gas (32.4%) and oil (7.7%) outputs. Co-pyrolysis revealed limited synergistic effects. Rising temperature promoted gas formation, reduced char, and improved its calorific value through carbon enrichment. Elevated pressure enhanced char yield and unexpectedly increased hydrogen content, suggesting complex thermochemical behaviour. The results confirm the scalability of laboratory findings and highlight pyrolysis as a practical WtE pathway for valorising protein-rich residues and low-rank coals, contributing to cleaner, more sustainable energy systems.
1. Introduction
Animal farming generates a stream of animal by-products (ABPs) that are not intended for human consumption, such as poultry feathers. The method of managing these ABPs is determined by a combination of legal, sanitary, economic, and technological factors.
Under European Union regulations [1], poultry feathers may be classified into three distinct categories. If classified as Category 3 low-risk materials, they may be legally processed and utilised for economic purposes. The most common applications of poultry feathers include the production of feather meal, which is used as a feed additive for animals and as an organic fertiliser; the extraction of keratin for use in the cosmetics and pharmaceutical industries; textile and insulation applications, such as in clothing, household appliances, and construction; the production of adsorbents for environmental protection purposes; and energy generation [2]. If poultry feathers originate from animals suspected of being diseased, animals that have died, or those from illegal slaughter, they are classified as Category 1 or 2 materials and must be disposed of through thermal treatment processes. Disposal methods, including process temperature and retention time of the treated material, are regulated under relevant legislation [3]. According to this regulation, incineration is permitted; however, other thermochemical processes, such as gasification, torrefaction, and pyrolysis, also appear to meet the applicable criteria.
According to estimates presented in [4,5], approximately 3.1 to 3.6 Mt of poultry feathers are generated annually in the European Union, of which only about 25% [5] are utilised for economic purposes, while the remainder is disposed of through thermal treatment. Global estimates of poultry feather generation are less precise, indicating an annual output ranging from 8.5 [6] to 40 Mt [7], with a significant portion of this stream not only remaining unused for economic purposes, but also not being properly managed, often ending up directly in landfills [8].
The most common method of thermal disposal of animal by-products, including poultry feathers, is combustion, also known as incineration. However, this process leads to the emission of harmful compounds into the atmosphere [9,10]. Increasing attention is now being given to alternative methods, particularly gasification processes [11,12,13,14] and wet torrefaction, which is especially relevant for disposing of materials with high moisture content, such as poultry litter [15]. The least explored technology, yet the one offering the most diverse range of products, including char, oil, and gas, is pyrolysis.
An analysis of the available literature indicates that few studies focus on the pyrolysis of poultry feathers. Existing research has primarily employed microscale equipment, such as thermogravimetric analysers (TGA) processing samples ranging from a few mg to several g, as well as batch reactors and laboratory furnaces capable of converting tens of g of fuel.
An example of such a study is [16], in which the authors subjected turkey feathers to pyrolysis in experiments conducted using a TGA and a small-scale batch reactor. The experiments were carried out at temperatures ranging from 400 to 900 °C, at atmospheric pressure, with a heating rate of 18 °C min−1. Once the target temperature was reached, the experiments were extended until no significant emission of gaseous products could be detected. The mass of the sample in the reactor was not specified; however, knowing that the reactor is cylindrical with a diameter of 98 mm and an estimated height of 550 mm, it can be expected that the sample mass did not exceed a few g.
The results showed that the char yield decreased from 15.7% at 400 °C to 2.6% at 900 °C. Increasing the temperature from 400 to 700 °C resulted in a rise in gas yield from 65.8% to 82.4%, while at 900 °C a decrease in the yield of gaseous products to 75.0% was observed. The yield of the liquid fraction at 400 °C was 16.4%, decreased at 500 and 700 °C, and reached a maximum of 23.1% at 900 °C. As the process temperature increased, the authors observed a decrease in the carbon dioxide (CO2) content in the produced gases from 35.9% (at 400 °C) to 7.4% (at 900 °C), while the methane (CH4) and hydrogen (H2) contents increased from 1.2 and 3.6% (at 400 °C) to 32.4 and 23.4% (at 900 °C), respectively. The carbon monoxide (CO) content was 5.3% at 400 °C, then increased to a maximum of 29.2% at 650 °C before decreasing to 21.6% at 900 °C. The higher heating value (HHV) calculated from the gas analysis increased from 7.9 MJ Nm−3 at 400 °C to 19.3 MJ Nm−3 at 900 °C.
For the char, increasing the process temperature led to a decrease in elemental hydrogen (H), nitrogen (N), oxygen (O), and HHV. The material produced at 400 °C contained 3.8% H, 11.6% N, 5.4% O, and had an HHV of 25.6 MJ kg−1, whereas char obtained at 900 °C showed values of 0.17%, 3.9%, 0.21%, and 16.8 MJ kg−1, respectively. Interestingly, the carbon (C) content in the char increased from 69.0% to 75.6% as the temperature rose from 400 to 500 °C, then decreased to 60.0% at 700 °C and 40.9% at 900 °C.
Liquid products from pyrolysis carried out at low temperatures (400–500 °C) mainly contained methanethiol, toluene, styrene, and naphthalene, whereas the liquid fraction from pyrolysis at high temperatures (700–900 °C) consisted mainly of benzene and toluene. Furthermore, the experiments indicated the formation of toxic compounds such as hydrogen cyanide in the liquid (0.13%) and gaseous (88 mg Nm−3) products.
Another study [17] presents results of pyrolysis conducted using a TGA and a small semi-batch glass reactor capable of processing a 10 g sample. Chicken feathers were subjected to pyrolysis at temperatures up to 600 °C, atmospheric pressure, and a heating rate of 10 °C min−1. The study did not specify the residence time of the sample at high temperature, but the content suggests that once the maximum temperature was reached, the sample was not held further. Results obtained at 500 °C indicate that pyrolysis yielded 12.6% gaseous products, 37.7% char, and 49.7% liquid products. Among the gaseous components identified in the pyrolysis gas generated at temperatures up to 300 °C were CO2, ammonia (NH3), and inorganic sulphur-containing compounds, such as sulphur dioxide and hydrogen sulphide. With increasing temperature, the presence of nitriles, aromatics, pyrroles, pyridines, amides, sulphides, thiols, thiazoles, and thiophenes was also observed.
In study [18], pyrolysis was conducted in a small-scale tube furnace. Chicken feather fibre samples with a mass of 10 g were subjected to conversion at temperatures between 200 and 240 °C under atmospheric pressure, with a residence time of 24 h and a heating rate of 5 °C min−1. Additionally, a two-stage pyrolysis protocol was implemented: an initial stage at 230 °C for 24 h, followed by a secondary stage at 450–500 °C for 1 to 1.5 h. Elemental analysis of the resultant char revealed C content ranging from 46.1% to 55.2%, N from 13.4% to 25.1%, H from 2.4% to 5.5%, and O from 17.3% to 36.6%. The carbon-to-nitrogen (C/N) ratio varied between 2.06 and 3.35 depending on the sample.
The pyrolysis of chicken feather fibres was also investigated in [19], where the authors conducted experiments using a box furnace. Fuel samples weighing 6 g were subjected to conversion. The process was performed in two stages: first, the samples were heated to 215 °C at a heating rate of 3 °C min−1 and held for 15 h; then, the temperature was increased to 350–500 °C at the same heating rate, with a residence time ranging from 0.5 to 2 h. The experiments were carried out at atmospheric pressure. The results indicated that with increasing temperature and residence time, the char yield decreased. At 400 °C, a residence time of 0.5 h resulted in a char yield of 20%, which decreased to 19.4%, 17.3%, and 16.4% when the residence time was extended to 1, 1.5, and 2 h, respectively. Similar trends were observed for experiments conducted at 420 °C and 450 °C. Furthermore, the study found that the properties of the char, including its microporosity, depend on two opposing processes: one forming and the other destroying the microporous structure. The experiments showed that, within the temperature range of 400–450 °C, an optimal microporosity was achieved with a residence time of 1 h.
Larger fuel sample masses were analysed in study [20], where experiments were conducted using a tubular pyrolysis reactor capable of accommodating 40 g of fuel. The experiments were performed at atmospheric pressure. In the first stage, the sample was heated to 700 °C at a heating rate of 20 °C min−1 and held for 30 min. In the second stage, the material was further heated to 800 °C at a heating rate of 10 °C min−1 in the presence of steam. Interestingly, not only chicken feathers but also their blends with macadamia nut shells in a 1:1 mass ratio were analysed. The results demonstrated that co-pyrolysis positively affects solid matter retention. The theoretical interpolated retention would have been 20.3% if both biomass streams had been pyrolysed independently without interaction, whereas the experiment showed a char yield as high as 25.9%. Furthermore, nitrogen retention during pyrolysis of the blend doubled compared to chicken feathers alone, increasing from 9.6% to 18.6%.
In all the aforementioned studies, the slow pyrolysis process was analysed, conducted with heating rates ranging from several to a dozen °C min−1. In study [21], the influence of heating rate on the pyrolysis process was compared. Experiments were carried out in a horizontal tube furnace at atmospheric pressure under a nitrogen atmosphere, as well as nitrogen enriched with NH3 and CO2. For slow pyrolysis, samples were heated at a rate of 10 °C min−1 to temperatures between 400 and 700 °C and held for an additional 30 min. In the case of fast pyrolysis, a quartz boat containing the sample was pushed directly into the heating zone; however, the authors did not specify the actual heating rate during this process.
The results showed that, regardless of heating rate, char yield decreased while gas yield increased with rising pyrolysis temperature. For slow pyrolysis, char yield at 400 °C was 32.8% and decreased to 22.9% at 700 °C, whereas for fast pyrolysis these values were 29.7% and 16.9%, respectively. Gas yield ranged from 26.3% to 34.3% for slow pyrolysis and from 18.8% to 29.3% for fast pyrolysis. For both heating rates, the maximum liquid product yield was recorded at 500 °C (50.1% for slow pyrolysis and 56.4% for fast pyrolysis), decreasing at temperatures both below and above this point. Interestingly, the presence of 5% CO2 and 5% NH3 in the atmosphere increased both the bio-oil yield and the nitrogen content in the bio-oil.
Each of the previously cited studies presented experiments conducted using TGA and/or small-scale batch reactors and furnaces. In contrast, study [22] reported the use of a large-scale tube furnace, but the authors did not provide specific details regarding the geometry of the apparatus or the mass of the fuel processed. The pyrolysis of chicken feathers was conducted at 300 °C and 600 °C under atmospheric pressure, with a residence time of 30 min; the precise value of the applied heating rate was not reported. The results showed that the char yield decreased with increasing temperature, from 55.5 to 55.8% at 300 °C to 16.1–25.3% at 600 °C. Notably, significant differences in char yield at 600 °C were observed depending on the physical form of the feedstock. Pyrolysis of feathers introduced into the reactor in their as-received form yielded 16.1% char, while pyrolysis of pulverised feathers resulted in a higher yield of 25.3%.
The studies presented above provide information on the influence of pyrolysis conditions on the yields of solid, gaseous, and liquid fractions, as well as on their composition and calorific value. They confirm the fundamental principles of pyrolysis, indicating that an increase in temperature, heating rate, and/or fuel residence time in the reactor leads to a reduction in char yield and the release of oxygen- and hydrogen-containing compounds from its structure (see Table 1). In the case of gaseous and liquid products, no such clear correlation can be observed, and depending on the fuel properties, the optimal yields and composition of these products are obtained under different conditions.

Table 1.
Process parameters and product distribution from poultry feather pyrolysis (literature data).
In addition to these aspects, the literature also addresses topics such as the chemical kinetics governing the rate of poultry feather pyrolysis [23], and the cost-effectiveness of the process [24]. However, these issues fall outside the scope of the present article and will not be discussed in detail. Moreover, the literature includes studies dedicated to the pyrolysis of poultry litter, such as [25,26,27]. While this material contains a certain proportion of feathers, it is a mixture that also includes bedding, manure, and spilled feed. As a result, it is characterised by, among other things, a high moisture and ash content, which makes its properties significantly different from those of pure poultry feathers.
The overview of the current state of knowledge on poultry feather pyrolysis clearly indicates the current level of scientific advancement. The experiments presented in nearly all the cited studies were conducted using small-scale reactors and/or furnaces. Although a wide temperature range (215 °C to 900 °C) and residence times (0.5 to 15 h) were investigated, the processes were generally carried out at low heating rates (up to 18 °C·min−1) and under atmospheric pressure. Furthermore, one study [20] demonstrated an interesting and practically relevant positive effect of co-pyrolysing feathers with another fuel. As poultry feathers have a low bulk density, which complicates processing at an industrial scale, blending this material with conventional energy fuels presents a promising alternative.
In this context, the present study set out to explore the pyrolysis of poultry feathers at a pilot scale, bridging the gap between microscale insights and practical, larger-scale applications. Central to this research was the deployment of a uniquely designed pyrolysis reactor [28], currently under patent protection, capable of processing several-kilogram fuel samples with precision and efficiency. This study systematically examined the effects of temperature, elevated pressure, and the proportion of poultry feathers in the fuel mixture on the pyrolysis process, paving the way for sustainable WtE solutions.
2. Experimental
2.1. Methods
In this study, poultry feathers from ducks (PF), lignite (LG), and mixtures containing 5% feathers with 95% lignite (5PF:95LG) as well as 20% feathers with 80% lignite (20PF:80LG) were examined (see Figure 1). The materials were supplied by the Poltegor-Institute. The choice of lignite for co-combustion with poultry feathers is based on its availability and comparable lower calorific value (LHV, see Table 1), which is advantageous from a practical standpoint.
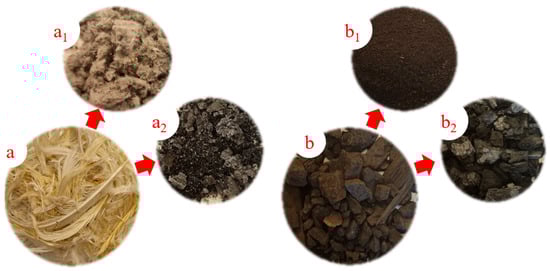
Figure 1.
Materials analysed. Symbols: “a”—poultry feathers from ducks in the as-received state; “a1”— pulverised poultry feathers; “a2”—char obtained from poultry feathers; “b”—pea-sized lignite in the as-received state; “b1”— pulverised lignite; “b2”—char obtained from lignite.
For physicochemical analyses, the samples were air-dried, milled using a RETSCH SM100 cutting mill, and analysed in powdered form with a particle size below 2 mm. For the pyrolysis experiments, the air-dried materials were used in their as-received form, i.e., whole feathers and pea-sized lignite.
As may be seen above, a specific nomenclature was adopted in this study for the designation of raw fuel samples. To ensure consistency and enhance clarity, the same convention was applied to chars obtained from pyrolysis. For example, char derived from PF is denoted as CH.PF. When production conditions are relevant, they are appended to the designation; for instance, char produced at 700 °C and 0.1 MPa (1 bar) is designated as CH.PF.700.1. If the name includes the symbol “(C)”, it indicates that the data were calculated (based on the properties of the feedstock); otherwise, the results originate directly from experiments.
2.2. Physicochemical Properties Characterisation
Proximate analysis was performed using laboratory chamber furnaces in accordance with ISO-standardised methods. For PF, moisture content was determined according to [29], volatile matter according to [30], and ash content according to [31], while for LG the corresponding methods were [32,33], and [34]. Ultimate analysis was carried out using an ELTRA CHS-580 analyser, as described in [35]. The HHV of raw fuels and chars was measured with an IKA WERKE C2000 calorimeter in accordance with [36], while the LHV was calculated using the following equation:
where LHV and HHV are expressed in kJ kg−1, and H and the moisture content (M) are expressed as percentages (%).
The LHV of gases was calculated using the following equation:
where LHV is expressed in MJ·Nm−3, and CO, CH4, and H2 are expressed in %.
2.3. Pyrolysis Process
The pyrolysis process was carried out in a custom-designed reactor built specifically for this study [28]. A schematic diagram of the reactor setup is shown in Figure 2, while its external configuration is presented in Figure 3.
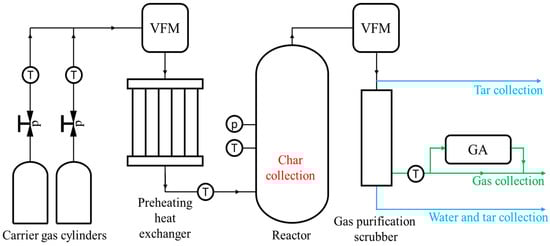
Figure 2.
Schematic diagram of the pyrolysis reactor setup. Symbols: “p”—pressure measurement, “T”—temperature measurement, “VFM”—volumetric gas flow meters, and “GA”—gas analysers.
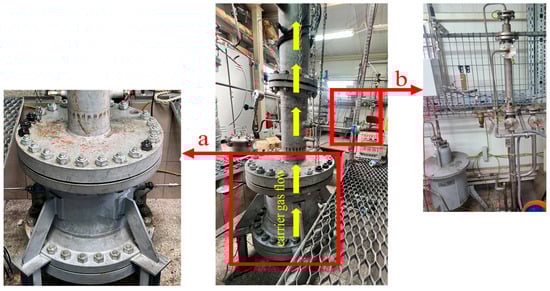
Figure 3.
External configuration of the pyrolysis reactor setup: (a) main reactor chamber, (b) gas purification section.
The reactor used, with an external diameter of φ775 mm and a height of 1875 mm, was developed on commission by the Poltegor-Institute. It features a central basket where the fuel is placed. Depending on the material density, it allows for the conversion of 20 to 40 kg of fuel per process cycle. The geometry of the basket ensures a uniform temperature distribution throughout the entire fuel bed. The basket is surrounded by a specially designed electric heating system that enables operation at temperatures up to 1000 °C. The control system for the electric heaters allows processes to be conducted at various heating rates; for the purposes of this study, a heating rate of 20 °C min−1 was applied. The entire system is enclosed within a sealed housing equipped with ports for monitoring temperature and pressure inside the fuel bed. Carrier gas, with a volumetric flow rate ranging from 2 to 10 Nm3 h−1 and pressure not exceeding 2.5 MPa, was first directed to a heating system for preheating and then introduced into the reactor. Inside the reactor, the gas was evenly dispersed to ensure uniform infiltration of the fuel bed. The resulting process gas stream, which also contained a liquid fraction, was continuously removed from the reactor. The condensable liquid fraction was collected in a dedicated storage tank, while the gas stream was routed to a scrubber, where the remaining tar was removed using a water stream. The cleaned gas was then sent to a set of analysers: the SIEMENS Ultramat 23 for measuring CO2, CO, and CH4 concentrations, and the SIEMENS Calomat 6 for H2 measurement.
In addition to the four gases mentioned above (i.e., CO2, CO, CH4, and H2), the pyrolytic gases produced during the process also contained nitrogen as a carrier gas; however, its presence will not be further considered in the results.
3. Results and Discussion
3.1. Physicochemical Analysis of Raw Materials
The physicochemical properties of the analysed PF and LG samples are summarized in Table 2.
Table 2.
Proximate and ultimate analysis of raw materials (on an air-dried basis).
Both PF and LG exhibited comparable LHVs of 20.3 and 21.0 MJ·kg−1, respectively. Moisture levels were moderate at 7.8% for PF and 5.4% for LG, while ash content was relatively low, measuring 1.4% and 5.3%, respectively. Compared to LG, PF showed significantly higher volatile matter content (V; 74.5% vs. 52.3%) and lower fixed carbon content (FC; 16.3% vs. 37.0%).
Among the analysed elements, LG had the highest C content (58.1%), along with notable H content (5.4%) and moderate S content (1.0%). PF contained considerably less elemental C (33.3%), but significant amounts of H (6.9%) and S (2.3%).
The proximate analysis results for both materials, as well as the ultimate analysis results for LG, are consistent with those reported for similar materials in the literature [37,38]. Unfortunately, no literature data were found on the elemental composition of duck feathers; therefore, the results were compared with data for chicken [39] and turkey feathers [11], showing reasonable agreement.
3.2. Pyrolysis Products Yield
Pyrolysis of PF conducted at 700 °C, atmospheric pressure, and a low heating rate of 20 °C·min−1 yielded 15.3% solid products, 70.1% gaseous products, and 14.6% liquid products (Figure 4). Notably, the proportions of solid and volatile products are quite similar to the volatile matter content and fixed carbon fraction determined by proximate analysis. The observed discrepancies, particularly between the gas yield (70.1%) and volatile matter content (74.5%), can likely be attributed to the difference in temperatures used in pyrolysis (700 °C) and in the standard determination of volatile matter content (900 °C) [30,33].
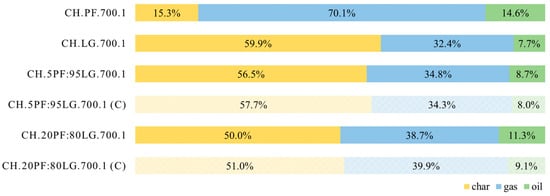
Figure 4.
Product yields for PF, LG, and their blends.
The amounts of gaseous and liquid products obtained are comparable to those reported in previous studies [16]. Laboratory-scale pyrolysis of turkey feathers under similar temperature and pressure conditions resulted in 82.0% gaseous and 13.5% liquid products. However, a notable difference was observed in the char yield (15.3% vs. 3.5% in [16]), which can be largely explained by differences in feather properties, including fixed carbon content (16.3% vs. 6.9% in [16]).
Poultry feathers with a quite similar fixed carbon content of 12.7%, derived from cock feathers, were analysed in [21]. Experiments conducted under comparable conditions yielded 22.9% char, a value closer to that obtained in this study (15.3%). The substantial differences in oil and gas yields between [21] and the present work—up to 30 percentage points—are most likely due to variations in gas collection systems, such as the application of a cold trap directly at the reactor outlet in [21].
For LG, the yields of solid, gaseous, and liquid products were 59.9%, 32.4%, and 7.7%, respectively. These results are consistent with data commonly reported in the literature, for example, lignite from Baganuur [40], which yielded 60.4% char, 36.8% gas, and 3.6% oil, and lignite from Pingshuo [41], with yields of 60.6%, 35.2%, and 4.2%, respectively.
Pyrolysis of mixtures 5PF:95LG and 20PF:80LG resulted in char, gas, and oil yields of 56.5%, 34.8%, 8.7%, and 50.0%, 38.7%, 11.3%, respectively. These experimental results showed good agreement with the theoretical yields predicted from the proportions of PF and LG in the mixtures. If PF and LG had been pyrolysed independently without interaction, the theoretical char, gas, and oil yields would be 57.7%, 34.3%, 8.0% (for 5PF:95LG), and 51.0%, 39.9%, 9.1% (for 20PF:80LG). Notably, co-pyrolysis resulted in approximately 1.0–1.2 percentage points lower char yields and 0.7–2.2 percentage points higher oil yields. For the 5PF:95LG, the gas yield was 0.5 percentage points higher than predicted, whereas for the 20PF:80LG it was 1.2 percentage points lower. These findings contradict the observation reported in [20] that co-pyrolysis positively influences solid matter retention. The authors attribute minor discrepancies between observed and predicted co-pyrolysis yields to the method of fuel bed preparation and the heterogeneous properties of the feedstock.
Figure 5 presents experiments performed on the 5PF:95LG at atmospheric pressure and temperatures of 500, 600, 700, and 800 °C. The results demonstrate that the char yield decreased from 65.3% to 52.3%, the gas yield increased from 27.6% to 39.4%, and the oil yield ranged between 7.1% and 8.7%. A clear inverse correlation between temperature and char yield was observed, while gas yield exhibited a direct correlation with temperature. These trends are consistent with results from studies on poultry feather pyrolysis [16,19,21] as well as lignite pyrolysis [41].
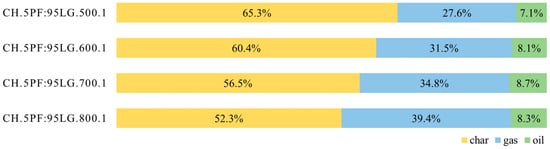
Figure 5.
Product yields for 5PF:95LG pyrolysed at 500–800 °C.
The oil yield increased with temperature from 500 to 700 °C but decreased at 800 °C. Similar trends have been observed in both lignite pyrolysis [41] and poultry feather pyrolysis [21], though the temperature at which the oil yield trend reverses differs slightly, 500 °C in [21] and 600 °C in [41]. According to [41], the increase in pyrolytic oil yield at lower temperatures is attributed to the dynamic thermal decomposition of organic compounds, whereas the decrease at higher temperatures results from secondary cracking and polycondensation reactions of tar. Some studies on poultry feather pyrolysis present divergent observations; for instance, [16] reported a significant oil yield at 400 °C, followed by a notable decrease at 500 °C, and then an increase up to the maximum at 900 °C. The authors of [16] ascribed these differences to the short residence time of primary pyrolysis products in their reactor. In contrast, the residence time in the present study was selected to ensure complete decomposition, thereby allowing secondary reactions to occur.
To investigate the effect of pressure on the co-pyrolysis of PF and LG, experiments were conducted at 700 °C under pressures of 0.1, 0.5, and 1.0 MPa. Due to the lack of literature on pressurised poultry feather pyrolysis, the results were compared with data from lignite and hard coal studies. As shown in Figure 6, increasing pressure resulted in char yields of 56.5%, 58.7%, and 62.4%, gas yields of 34.8%, 34.3%, and 33.1%, and oil yields of 8.7%, 7.0%, and 4.5%, respectively. These results clearly demonstrate that elevated pressure favours the formation of char at the expense of gas and oil production.
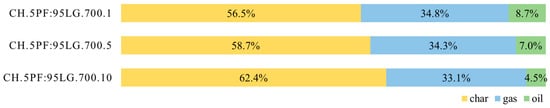
Figure 6.
Product yields for 5PF:95LG pyrolysed at 0.1 MPa (1 bar), 0.5 MPa (5 bar), and 1.0 MPa (10 bar).
This trend aligns with findings from a fundamental study on high-pressure bituminous coal pyrolysis [42], which reported similar effects at 800 °C and pressures of 0.3–3.0 MPa. The increase in char yield with pressure is widely accepted and has been experimentally confirmed in studies such as [43] (0.086–1.52 MPa), [44] (0.1–3.0 MPa), and [45] (0.1–4.0 MPa). The Chemical Percolation Devolatilization (CPD) model also supports this tendency, as analysed in [43]. Some studies suggest that for coals with high volatile and H content, increasing pressure at lower temperatures (e.g., 600 °C) may reduce char yield due to hydrogenation reactions [46]; however, this effect was not observed in the present work.
The positive effect of pressure on char yield inevitably implies a reduction in the combined yields of liquid and gaseous products. Because these products readily interconvert and their production dynamics depend on pyrolysis conditions (e.g., temperature, heating rate) and feedstock properties, the influence of pressure on gas and tar yields reported in the literature is inconsistent.
As mentioned, [42] reported a decrease in gas yield with increasing pressure based on experiments on Taiheiyo, Adaro, and Berau bituminous coals pyrolysed at 25 °C·min−1, 800 °C, and pressures of 0.3–3.0 MPa. Conversely, [47] studied Turkish lignite Tuncbilek pyrolysed at 3 °C·min−1, temperatures up to 950 °C, and pressures of 0.5–10 MPa. Their results indicated that gas yield increased with pressure between 0.5 and 5.0 MPa but decreased between 5 and 10 MPa; however, these experiments involved hydropyrolysis in a hydrogen-rich atmosphere. An interesting observation from [45], based on eight different coals, revealed that the effect of pressure on gas yield depends on coal properties, resulting in either increased or negligible change. An increase in gas yield with pressure was also observed in [46] during experiments at 20 °C·min−1, temperatures up to 600 °C, and pressures of 0.1–2.0 MPa.
Similar discrepancies are reported regarding oil yield. Studies [42,45] observed a decrease in oil yield with increasing pressure, while [46] found a maximum oil yield at 1.0 MPa, with either lower or higher pressures reducing oil production. In [47], oil yield increased with pressure over the range 0.5–10 MPa.
3.3. Char Properties
Although LG and PF possess distinct physicochemical properties, the chars obtained from their pyrolysis display similar characteristics, as shown in Figure 7 and Table 3. As expected, pyrolysis led to a significant increase in C concentration in both chars compared with the original feedstocks, accompanied by a decrease in H and S contents. Comparing the two chars, the most notable difference is observed in C content, with a difference of 3.7 percentage points, CH.PF contains 67.7% C, whereas CH.LG contains 71.4% C. The hydrogen content in CH.PF is 3.7%, in contrast to 3.1% in CH.LG.
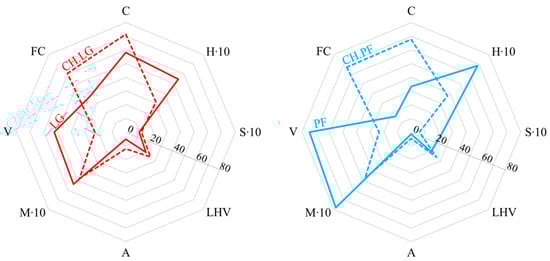
Figure 7.
Comparison of physicochemical properties of feedstock and chars. Moisture and hydrogen contents were magnified tenfold to improve the clarity of the plots. For LHV, the unit is MJ kg−1; for the other parameters, the unit is wt% (adb).
Table 3.
Physicochemical properties of chars.
Calculating the H/C ratio reveals that while this parameter differed substantially in the raw fuels (0.206 for PF and 0.094 for LG), it converged for the chars, with values of 0.055 (CH.PF) and 0.043 (CH.LG), respectively. This ratio provides insight into the degree of hydrogen evolution resulting from chemical transformations during pyrolysis and suggests that pyrolysis of poultry feathers led to the release of gaseous and/or liquid products with a higher H content than in the case of lignite.
Noteworthy conclusions also emerge from the comparison of S content in raw fuels and their respective chars. Although PF contained significantly more sulphur than LG (2.3% vs. 1.0%), CH.PF retained only 0.6% S, while CH.LG contained 1.2%. Accordingly, the S/C ratio for the raw fuels was 0.069 (PF) and 0.017 (LG), but for the chars, these values decreased to 0.009 (CH.PF) and 0.016 (CH.LG). This indicates that sulphur compounds in LG were relatively thermally stable, as evidenced by the similar S/C ratios in the raw and char materials. Conversely, pyrolysis of PF resulted in the release of substantial amounts of sulphur, which transitioned into volatile and/or liquid products. This suggests that sulphur species in PF were thermally labile and differed fundamentally from those in LG.
The authors did not find in the literature any chars derived from poultry feathers with properties comparable to those obtained in the present study. For example, char from turkey feathers produced under similar temperature, pressure, and heating rate conditions contained 60.01% C and 0.56% H [16]. Char from chicken feathers pyrolysed at 600 °C [22] exhibited even lower carbon content (46.64–48.57%) and trace sulphur (0.10–0.19%). Similarly, the physicochemical properties of CH.LG differed from those reported in the literature. Char produced from Chinese Baorixile lignite under comparable conditions contained 80.60% C, 2.00% H, and 0.20% S [48], while char from Polish Bełchatów lignite had 62.0% C, 0.64% H, and 1.65% S [49].
On one hand, particularly regarding sulphur content, the observed discrepancies between the chars reported in the literature and those generated in this study can be attributed to the differing properties of the feedstock subjected to pyrolysis. On the other hand, given the relatively similar properties of CH.PF and CH.LG, the authors hypothesise that this convergence partly reflects the reactor conditions, which depend on the device design and the process methodology. The referenced studies typically used laboratory furnaces where the fuel was heated in a crucible as a layer, resulting in non-uniform conditions within the bed. Furthermore, the residence time at high temperature was predetermined. The reactor used in this work was designed to ensure uniform heating throughout the fuel volume and systematic removal of volatile and liquid products during the process. The process duration was determined by the fuel behaviour to maximise conversion.
Comparing the LHV of the chars, CH.PF and CH.LG exhibited very similar values of 26.1 and 25.6 MJ kg−1, respectively. These values exceed those reported in the literature by approximately 4–5 MJ kg−1 [16,49].
In summary, pyrolysis of PF and LG produces materials with comparable properties, consistent with the fundamental understanding of this process. The degree of carbonization and the LHV values exceeded those commonly reported in the literature, which the authors attribute to the reactor design and process control.
Analysing chars derived from PF, LG, and their mixtures, it is noteworthy that the carbon content in both mixtures was well predicted assuming no interaction between PF and LG. For CH.5PF:95LG obtained at 700 °C, the measured carbon content was 71.0%, closely matching the predicted 71.2%; for CH.20PF:80LG, the measured and predicted values were 71.9% and 70.7%, respectively. Differences ranged from 0.2 to 1.2 percentage points, with relative errors below 1.7%. Hydrogen content in CH.5PF:95LG and CH.20PF:80LG was 0.8 and 0.3 percentage points lower than predicted. Although these relative errors were substantial (34% and 11%), they appear negligible given the measurement uncertainties. Sulphur discrepancies were even smaller, 0.3 and 0.1 percentage points, with relative errors of 20% and 8%. LHV deviations were minimal, not exceeding 0.5 MJ kg−1 (2% relative error). Thus, the authors conclude that no significant interaction between PF and LG occurred during pyrolysis, and observed discrepancies likely arise from material heterogeneity and measurement limitations. Consequently, findings reported in [20] were not confirmed.
The effect of temperature on char properties manifested as an increase in carbon and sulphur contents and a decrease in hydrogen content. For carbon, the CH.5PF:95LG sample produced at 500 °C contained 66.5%, with a gradual increase of approximately 2.6 percentage points per 100 °C, reaching 74.2%. Sulphur content also increased steadily from 1.0% at 500 °C to 1.7% at 800 °C (average 0.23% per 100 °C). Hydrogen content decreased in a stepwise manner: samples produced at 500 and 600 °C contained 3.9% and 3.4% H, respectively, whereas those at 700 and 800 °C contained 2.3% and 2.1%. On average, hydrogen decreased by 0.6 percentage points per 100 °C. The increase in temperature was accompanied by a corresponding rise in LHV, from 22.9 MJ kg−1 at 500 °C to 26.0 MJ kg−1 at 800 °C.
This trend, rising C content and LHV alongside decreasing H content with increasing temperature, is typical for coal pyrolysis. For instance, in [42], carbon content increased by 3.2 percentage points (1.6 per 100 °C) and hydrogen decreased by 1.0 percentage points (0.5 per 100 °C) over 600–800 °C. Similarly, [50] reported an average increase in carbon of 2.37 percentage points per 100 °C and hydrogen decrease of 0.62 points per 100 °C for 500–900 °C. A comparable decrease in hydrogen content, amounting to 0.43 percentage points per 100 °C, was reported in [46]. As temperature rises, increased char carbonization brings its properties closer to those of graphite, which has an LHV of approximately 32.7 MJ kg−1 [51]. Literature data [52] confirm this, with chars from coal-biomass co-pyrolysis exhibiting LHVs of 20.1 MJ kg−1 at 350 °C, 22.5 MJ kg−1 at 450 °C, and 24.1 MJ kg−1 at 550 °C.
Sulphur behaviour during coal pyrolysis is more complex and strongly dependent on its chemical form. As noted in [53], increased temperature promotes sulphur retention in char for some coals, while for others it facilitates sulphur release. It is believed that sulphur tends to remain in ash if present as mineral sulphur, but more readily evolves if present as organic sulphur. Additionally, sulphur content can increase via transformation from sulfidic to organic sulphur and retention within the organic matrix surrounding pyrite particles [54].
Speciation of elements in chars from poultry feather pyrolysis is considerably less understood than for lignite or bituminous coals. Study [16] reports that H content decreased by an average of 0.72 percentage points per 100 °C over 400–900 °C. Carbon initially increased from 69.04% at 400 °C to 75.60% at 500 °C, then declined to 40.91% at 900 °C. Contrastingly, [22] observed an increase in carbon content by 0.67 to 5.59 percentage points when raising the temperature from 300 to 600 °C. This study also reported a sulphur decrease with rising temperature, from 0.66 to 1.03% at 300 °C to 0.10–0.19% at 600 °C. No studies were found addressing the LHV of chars derived from poultry feathers; however, [16] provides HHV data, showing an increase of 2.8 MJ kg−1 for char produced at 500 °C compared to 400 °C (25.6 MJ kg−1), with further temperature increase reducing HHV to 16.8 MJ kg−1 at 900 °C.
The present results demonstrate that char properties evolve with increasing process pressure. Carbon content increased from 71.0% to 72.6% and 72.8% at 0.1, 0.5, and 1.0 MPa, respectively. Hydrogen and sulphur contents changed accordingly; H increased from 2.3% to 2.9% and 3.5%, and S varied slightly at 1.4%, 1.4%, and 1.2%. Similar trends for carbon and sulphur were reported in [44], where coal pyrolysis at temperatures up to 1000 °C and pressures from 0.1 to 5 MPa showed a 1.67 percentage point increase in carbon and sulphur fluctuations within 0.07 points. However, H content decreased slightly (by 0.16 points), contrasting with the increase observed here. A decline in hydrogen content with increasing pyrolysis pressure was also observed in [46]. Tests on Chinese Naomaohu coal showed hydrogen content decreases of 0.29, 0.35, and 0.23 percentage points at 600, 700, and 800 °C, respectively, when pressure increased from 0.1 to 1.0 MPa.
Considering that the analysed fuel (CH.5PF:95LG) was 95% lignite, the observed increase in hydrogen content with pressure is surprising and lacks confirmation from studies on pressure pyrolysis of lignite or hard coals under nitrogen atmospheres. Unfortunately, no literature is available on pressure pyrolysis of poultry feathers to verify whether this trend is characteristic of feather decomposition. However, biomass fuels such as wheat straw [55] and miscanthus [56] exhibit increased hydrogen content in chars with rising pyrolysis pressure. Given that PF contains a relatively high hydrogen content (6.9%), its rapid release and presence in the surrounding atmosphere could induce hydropyrolysis, leading to increased hydrogen content in the char [57]. Nevertheless, this hydrogen behaviour remains unexplained and warrants further investigation.
3.4. Gas Composition
The analysis of the gaseous product composition, shown in Figure 8, indicates distinct characteristics of the gases produced from PF and LG. For tests conducted at 700 °C and atmospheric pressure, the dominant gas components from PF were CO (32.9%) and H2 (28.2%), with CH4 constituting 22.0%, and the smallest fraction being CO2 (16.9%). In the case of LG, the gas was predominantly composed of CO2 (44.2%), followed by H2 (22.1%), CO (17.6%), and CH4 (16.1%).
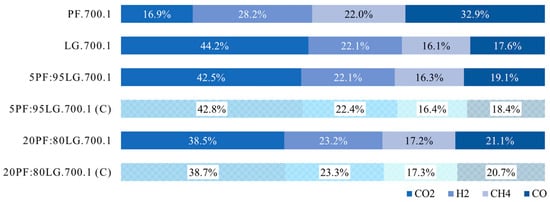
Figure 8.
Gas composition measured during the pyrolysis of PF, LG, and their blends.
The obtained results appear to correlate well with the characteristics of the raw materials and the resulting chars. As previously noted, PF contained a significant hydrogen content (6.9%), while CH.PF had only 3.7% H. These data suggest that the gaseous and/or liquid products formed concurrently with char formation should be rich in hydrogen-containing compounds, which is confirmed by the gas composition. For LG, the hydrogen content was lower (5.4%) compared to PF, but in CH.LG it was similar (3.1%) to that of CH.PF. Consequently, a smaller amount of hydrogen-containing compounds in the liquid and/or gaseous products resulting from LG pyrolysis was expected, which is also reflected in the gas composition.
The gas composition obtained from PF partially aligns with data reported in the literature [16]. Experiments conducted on turkey feathers under similar conditions showed a gas composition trend of CO > CH4 > CO2, consistent with this study. However, discrepancies were noted in the H2 content, 28.2% in the present study versus approximately 12.3% in [16]. Among the reviewed studies, the closest gas composition for lignite pyrolysis was reported in [58]. Pyrolysis of Chinese Fuxin lignite under comparable conditions yielded approximately 42.8% CO2, 21.9% H2, 16.0% CH4, and 15.4% CO.
The calculated LHV of the pyrolysis gas derived from PF, based on the gas composition (excluding the carrier gas), was 15.1 MJ Nm−3, whereas that of LG was 10.4 MJ Nm−3 (see Figure 9). The LHV value for PF gas is moderate, comparable to coke oven gases, and suitable for heating applications, electricity generation, or chemical processes. This value exceeds the LHV of gases derived from pyrolysis of poultry feathers reported at 700 °C in [16], which was 13.5 MJ Nm−3. The LHV obtained for the analysed lignite closely matches values for gases derived from pyrolysis of Yimin lignite at 650 °C [59], with an LHV of 11.1 MJ Nm−3. Similar LHV values, ranging from 8 to 11 MJ Nm−3, have also been reported for gases generated via thermal steam plasma gasification [60]. Such gases are classified as low-calorific but can be applied in cogeneration or raw material drying processes.
Figure 9.
LHV of pyrolytic gases and chars.
Gas compositions obtained from pyrolysis of 5PF:95LG and 20PF:80LG mixtures were consistent with expectations and did not indicate interactions between individual fuel components. The deviations between predicted and actual values averaged 0.35% (for 5PF:95LG) and 0.20% (for 20PF:80LG). The gas composition from pyrolysis of 5PF:95LG closely resembled that of pure lignite, though a 2.3 percentage point decrease in CO2 and a 1.5 percentage point increase in CO were observed. For the 20PF:80LG mixture, the gas composition was closer to that from PF pyrolysis, with a 1.1 percentage point increase in both H2 and CH4. The LHV values for gases from 5PF:95LG and 20PF:80LG pyrolysis did not differ significantly from that of LG, amounting to 10.6 and 11.3 MJ Nm−3, respectively.
Figure 10 indicates that increasing the pyrolysis temperature of 5PF:95LG resulted in significant changes in the gas composition. Raising the temperature from 500 to 800 °C decreased CO2 content by 9.5 percentage points and CH4 by 5.9 points. Concurrently, H2 concentration increased by 8.6 points and CO by 6.8 points. The LHV of the resulting gases slightly decreased with temperature, from 10.8 to 10.5 MJ Nm−3.
Figure 10.
Gas composition measured during the pyrolysis of 5PF:95LG at 500–800 °C.
Similar trends were documented in [58], where CO2 content from brown coal pyrolysis decreased by 10.1 percentage points from 42.8% at 700 °C to 32.7% at 1000 °C. CH4 decreased by 6.2 points, while H2 and CO increased by 7.9 and 9.4 points, respectively. A different trend was observed in pyrolysis of coal at 500–700 °C under 3 MPa pressure [61]. In these conditions, CO2 decreased and H2 and CO increased with temperature, as in previous studies, but an unexpected increase in CH4 concentration was also recorded. Changes reported in [61] were similar to those found in turkey feather pyrolysis [16], showing that temperature increase correlates with decreased CO2 and increased CH4 and H2. Up to 650 °C, CO content rose with temperature but decreased slightly above that threshold.
As Figure 11 reveals, increasing the pyrolysis pressure leads to an increase in CO2 and CH4 fractions, while H2 and CO contents decrease. The carbon dioxide fraction increased from 42.5% at 0.1 MPa to 47.4% at 1.0 MPa. For CH4, H2, and CO, the ranges were 16.3–33.7%, 22.1–10.2%, and 19.1–8.7%, respectively. LHV of the produced gas rose with pressure, from 10.6 MJ Nm−3 (0.1 MPa) to 12.9 and 14.3 MJ Nm−3 at 0.5 and 1.0 MPa, respectively.
Figure 11.
Gas composition measured during the pyrolysis of 5PF:95LG at 0.1 MPa (1 bar), 0.5 MPa (5 bar), and 1.0 MPa (10 bar).
Comparable results were reported in [45,61]. In [61], coal pyrolysis was performed at pressures from 0.1 to 3.0 MPa, showing systematic increases in CO2 and CH4 and decreases in H2 and CO with pressure. However, gas fractions differed, with 1 MPa compositions of 37.6% CH4, 26.3% H2, 20.0% CO2, and 14.0% CO. These trends were confirmed in [45], analysing lignite at 0.1, 2.0, and 4.0 MPa. At 2 MPa, gas composition was 40% CH4, 32% H2, 15% CO, and 13% CO2. Calculated LHVs based on these compositions showed increases with pressure: 18.1 MJ Nm−3 at 1 MPa [61] and 19.7 MJ Nm−3 at 2 MPa [45].
4. Conclusions
The article presents the results of slow pyrolysis of PF, LG, and their blends, conducted at a heating rate of 20 °C·min−1, at temperatures of 500, 600, 700, and 800 °C, as well as under pressures of 0.1, 0.5, and 1.0 MPa. Experiments were performed at pilot scale using a uniquely designed pyrolysis reactor, which has been submitted for patent protection.
The main detailed findings of the study are summarised below and organised into four thematic areas:
- (1)
- Impact of feedstock properties on pyrolysis products:
- The results confirmed previous literature reports [16,21] that the pyrolysis of PF primarily yields gas (70.1%), with smaller fractions of char and oil (15.3% and 14.6%, respectively).
- For LG, laboratory-scale observations [40,41] were confirmed, indicating that pyrolysis of this material produces the highest char fraction (59.9%), a smaller fraction of gas (32.4%), and the lowest fraction of oil (7.7%).
- Although PF and LG possess distinct physicochemical properties, pyrolysis produced chars with similar characteristics. Compared to the original feedstock, pyrolysis increased the LHV of the chars (26.1 and 25.6 MJ·kg−1), increased carbon content (67.7–71.4%), and decreased hydrogen (3.1–3.7%) and sulphur (0.6–1.2%) contents.
- Sulphur-containing compounds in PF were highly thermally unstable and tended to evolve from the char structure, whereas sulphur compounds in LG were more thermally stable and largely remained in the char.
- Gases produced during PF pyrolysis contained 32.9% CO, 28.8% H2, 22.0% CH4, and 16.9% CO2, partially aligning with literature data [16]; the main difference concerned the CH4 fraction.
- Gases from LG pyrolysis were predominantly composed of 44.2% CO2, followed by 22.1% H2, 17.6% CO, and 16.1% CH4, consistent with literature reports [58].
- The LHV of PF and LG gases was 26.1 and 25.6 MJ·Nm−3, respectively, similar to values reported in [16,59].
- (2)
- Impact of blend composition on pyrolysis products:
- The distribution of char, gas, and oil fractions in the 5PF:95LG and 20PF:80LG mixtures showed no evidence of interactions between PF and LG, contradicting the claims in [20] that co-pyrolysis positively affects solid matter retention.
- A similar lack of interaction was observed for C, H, and S contents.
- Gas compositions from 5PF:95LG and 20PF:80LG mixtures were consistent with expectations and showed no interactions between individual fuel components.
- (3)
- Impact of temperature on pyrolysis products:
- Observations [16,19,21,41] were confirmed; increasing the pyrolysis temperature from 500 to 800 °C reduced char yield (from 65.3% to 52.3%) while increasing gas yield (from 27.6% to 39.4%).
- A threshold temperature above which the liquid fraction decreases was confirmed. In this study, it was 700 °C, whereas literature reported 500 °C for PF [21] and 600 °C for LG [41]. This contradicts previous data on oil yield in [16].
- Increasing temperature led to higher char LHV (22.9 to 26.0 MJ·kg−1), higher C content (66.5% to 74.2%), and lower H content (3.9% to 2.1%), in agreement with [16,22,42,50,52].
- Sulphur content in chars increased with temperature (1.0% to 1.7%), a rare phenomenon previously noted in [53], likely related to the high proportion of mineral sulphur in LG.
- Raising the temperature from 500 to 800 °C decreased CO2 content by 9.5 percentage points and CH4 by 5.9 points, but increased H2 by 8.6 points and CO by 6.8 points, consistent with [58]. In contrast, studies [16,61] observed the opposite trend for CH4.
- LHV of gases slightly decreased with temperature, from 10.8 to 10.5 MJ Nm−3.
- (4)
- Impact of pressure on pyrolysis products:
- Increasing the pressure from 0.1 MPa to 1.0 MPa increased char yield (from 56.5% to 62.4%) and decreased gas (34.8% to 33.1%) and oil (8.7% to 4.5%) yields. No reference data were available for PF pressurised pyrolysis. However, pressure effects on char yield are consistent with studies on lignite and hard coal [42,43,44,45].
- The decrease in gas fraction with increasing pressure aligns with [42,45], although the opposite trend is observed for other fuels [46,47].
- The reduction in oil yield confirms trends reported in [42,45], but contradicts observations in [46,47].
- Increasing pressure led to higher C (71.0% to 72.8%) and H (2.3% to 3.5%) contents, with sulphur fluctuating between 1.2% and 1.4%. Similar observations for C and S were reported in [44].
- The behaviour of hydrogen is unusual and inconsistent with literature on lignite and hard coal [44,46], though similar trends were noted for biomass [55,56], possibly due to hydropyrolysis and hydrogen evolution. This observation remains unexplained and warrants further investigation.
- Increasing pressure increased CO2 (42.5% to 47.4%) and CH4 (16.3% to 33.7%) fractions, while H2 (22.1% to 10.2%) and CO (19.1% to 8.7%) contents decreased.
- Gas LHV increased with pressure, from 10.6 MJ Nm−3 (0.1 MPa) to 12.9 and 14.3 MJ Nm−3 at 0.5 and 1.0 MPa, respectively, consistent with [45,61].
In conclusion, the study demonstrates that many observations from laboratory-scale experiments are reproducible at a larger scale, and that the uniquely designed reactor is effective for the efficient and sustainable conversion of waste into energy, highlighting its potential for practical applications.
Author Contributions
Conceptualization, K.M.C., J.S., D.K. and B.R.; Methodology, K.M.C., J.S. and D.K.; Validation, K.M.C. and A.M.K.-C.; Formal Analysis, K.M.C. and A.M.K.-C.; Investigation, K.M.C., J.S., A.M.K.-C. and D.K.; Resources, J.S., D.K. and B.R.; Data Curation, K.M.C.; Writing—Original Draft Preparation, K.M.C. and A.M.K.-C.; Writing—Review and Editing, K.M.C., A.M.K.-C., D.K. and B.R.; Visualization, K.M.C. and A.M.K.-C.; Supervision, K.M.C. and B.R.; Funding Acquisition, D.K. and B.R. All authors have read and agreed to the published version of the manuscript.
Funding
Research co-financed by the Polish Ministry of Science and Higher Education under the project entitled “Modular reactor for pressurized gasification and pyrolysis of organic feedstock with a supply installation” (SPUB) No. 7/E-277/SPUB/SN/2020, carried out at the “Poltegor-Institute” Opencast Mining Institute.
Data Availability Statement
The original contributions presented in the study are included in the article; further enquiries can be directed to the corresponding author.
Conflicts of Interest
The authors declare no conflicts of interest.
Abbreviations
The following abbreviations are used in this manuscript:
| ABPs | animal by-products |
| C | carbon content in solid materials, % |
| CH4 | methane share in pyrolysis gas, % |
| CO | carbon monoxide share in pyrolysis gas, % |
| CO2 | carbon dioxide share in pyrolysis gas, % |
| FC | fixed carbon content in solid materials, % |
| H | hydrogen content in solid materials, % |
| H2 | hydrogen share in pyrolysis gas, % |
| HHV | higher heating value, MJ·Nm−3 (for gases) or MJ·kg−1 (for solids) |
| HR | heating rate |
| LG | lignite |
| LHV | lower heating value, MJ·Nm−3 (for gases) or MJ·kg−1 (for solids) |
| M | moisture content in solid materials, % |
| N | nitrogen content in solid materials, % |
| O | oxygen content in solid materials, % |
| PF | poultry feathers |
| S | sulphur content in solid materials, % |
| TGA | thermogravimetric analyzer |
| V | volatile content in solid materials, % |
| WtE | waste-to-energy |
References
- European Parliament and Council Regulation (EC). No 1069/2009 of 21 October 2009 laying down health rules as regards animal by-products and derived products not intended for human consumption. Off. J. Eur. Union 2009, OJ L 300, 1–33. [Google Scholar]
- Tesfaye, T.; Sithole, B.; Ramjugernath, D. Valorisation of chicken feathers: A review on recycling and recovery route—Current status and future prospects. Clean Technol. Environ. Policy 2017, 19, 2363–2378. [Google Scholar] [CrossRef]
- European Parliament and Council Regulation (EC). No 1774/2002 of 3 October 2002 establishing health rules as regards animal by-products not intended for human consumption. Off. J. Eur. Union 2002, OJ L 273, 1–95. [Google Scholar]
- European Commission CORDIS. Converting Poultry Feathers from Discarded Waste into Valuable Raw Materials. Project ID: 723268—KARMA2020 Project Information. Available online: https://cordis.europa.eu/article/id/418077-converting-poultry-feathers-from-discarded-waste-into-valuable-raw-materials (accessed on 12 August 2025).
- European Commission CORDIS. Unlocking a Feather Bioeconomy for Keratin-Based Agricultural Applications. Project ID: 101023306—UNLOCK Project Information. Available online: https://cordis.europa.eu/project/id/101023306 (accessed on 12 August 2025).
- European Commission CORDIS. Industrial Feather Waste Valorisation for Sustainable KeRatin Based MAterials. Project ID: 723268—KARMA2020 Project Reporting. Available online: https://cordis.europa.eu/project/id/723268/reporting (accessed on 12 August 2025).
- El Salamony, D.H.; Hassouna, M.S.E.; Zaghloul, T.I.; He, Z.; Abdallah, M.H. Bioenergy production from chicken feather waste by anaerobic digestion and bioelectrochemical systems. Microb. Cell Fact. 2024, 23, 102. [Google Scholar] [CrossRef] [PubMed]
- World Bank. Study of Livestock; World Bank Report. 2012. Available online: https://documents1.worldbank.org/curated/en/156701468147583817/pdf/696530esw0p1000l0study0of0livestock.pdf (accessed on 12 August 2025).
- Singh, P.; Mondal, T.; Sharma, R.; Mahalakshmi, N.; Gupta, M. Poultry Waste Management. Int. J. Curr. Microbiol. Appl. Sci. 2018, 7, 701–712. [Google Scholar] [CrossRef]
- Talha, M.; Tanveer, M.; Abid, A.; Maan, A.A.; Khan, M.K.I.; Shair, H.; Tanveer, N.; Mustafa, A. Valorization of poultry slaughter wastes via extraction of three structural proteins (collagen, gelatin, keratin): A sustainable approach for circular economy. Trends Food Sci. Technol. 2024, 152, 104667. [Google Scholar] [CrossRef]
- Dudyński, M.; Kwiatkowski, K.; Bajer, K. From feathers to syngas—Technologies and devices. Waste Manag. 2012, 32, 685–691. [Google Scholar] [CrossRef]
- Kwiatkowski, K.; Krzysztoforski, J.; Bajer, K.; Dudyński, M. Bioenergy from feathers gasification—Efficiency and performance analysis. Biomass Bioenergy 2013, 59, 402–411. [Google Scholar] [CrossRef]
- Gusiatin, Z.M.; Kumpiene, J.; Janiszewska, S.; Kasiński, S.; Pecio, M.; Piec, R.; Radziemska, M. A mineral by-product from gasification of poultry feathers for removing Cd from highly contaminated synthetic wastewater. Minerals 2020, 10, 1048. [Google Scholar] [CrossRef]
- Sitka, A.; Szulc, P.; Smykowski, D.; Jodkowski, W. Application of poultry manure as an energy resource by its gasification in a prototype rotary counterflow gasifier. Renew. Energy 2021, 175, 422–429. [Google Scholar] [CrossRef]
- Arauzo, P.J.; Maziarka, P.A.; Olszewski, M.P.; Isemin, R.L.; Muratova, N.S.; Ronsse, F.; Kruse, A. Valorization of the poultry litter through wet torrefaction and different activation treatments. Sci. Total Environ. 2020, 732, 139288. [Google Scholar] [CrossRef]
- Kluska, J.; Karas, D.; Heda, L.; Szumowski, M.; Szuszkiewicz, J. Thermal and chemical effects of turkey feathers pyrolysis. Waste Manag. 2016, 49, 411–419. [Google Scholar] [CrossRef]
- Brebu, M.; Spiridon, I. Thermal degradation of keratin waste. J. Anal. Appl. Pyrolysis. 2011, 91, 288–295. [Google Scholar] [CrossRef]
- Tuna, A.; Okumus, Y.; Celebi, H.; Seyhan, A.T. Thermochemical conversion of poultry chicken feather fibers of different colors into microporous fibers. J. Anal. Appl. Pyrolysis. 2015, 115, 112–124. [Google Scholar] [CrossRef]
- Senoz, E.; Wool, R.P. Hydrogen storage on pyrolyzed chicken feather fibers. Int. J. Hydrogen Energy 2011, 36, 7122–7127. [Google Scholar] [CrossRef]
- Vercruysse, W.; Muniz, R.R.; Joos, B.; Hardy, A.; Hamed, H.; Desta, D.; Boyen, H.-G.; Safari, M.; Marchal, W.; Vandamme, D.; et al. Co-pyrolysis of chicken feathers and macadamia nut shells, a promising strategy to create nitrogen-enriched electrode materials for supercapacitor applications. Bioresour. Technol. 2024, 396, 130417. [Google Scholar] [CrossRef] [PubMed]
- Liu, S.; Zhang, G.; Bi, D.; Ni, Y.; Song, J.; Song, X.; Wang, H. Effect of pyrolysis conditions on the preparation of nitrogen-containing chemicals and nitrogen-doped carbon from cock feathers: Nitrogen migration and transformation. Energy 2025, 315, 134328. [Google Scholar] [CrossRef]
- Li, Z.; Reimer, C.; Picard, M.; Mohanty, A.K.; Misra, M. Characterization of Chicken Feather Biocarbon for Use in Sustainable Biocomposites. Front. Mater. 2020, 7, 3. [Google Scholar] [CrossRef]
- Senoz, E.; Wool, R.P.; McChalicher, C.W.J.; Hong, C.K. Physical and chemical changes in feather keratin during pyrolysis. Polym. Degrad. Stab. 2012, 97, 297–307. [Google Scholar] [CrossRef]
- Zhao, N.; Lehmann, J.; You, F. Poultry waste valorization via pyrolysis technologies: Economic and environmental life cycle optimization for sustainable bioenergy systems. ACS Sustain. Chem. Eng. 2020, 8, 4633–4646. [Google Scholar] [CrossRef]
- Agblevor, F.A.; Beis, S.; Kim, S.S.; Tarrant, R.; Mante, N.O. Biocrude oils from the fast pyrolysis of poultry litter and hardwood. Waste Manag. 2010, 30, 298–307. [Google Scholar] [CrossRef]
- Mante, O.D.; Agblevor, F.A. Influence of pine wood shavings on the pyrolysis of poultry litter. Waste Manag. 2010, 30, 2537–2547. [Google Scholar] [CrossRef]
- Kim, S.-S.; Agblevor, F.A. Pyrolysis characteristics and kinetics of chicken litter. Waste Manag. 2007, 27, 135–140. [Google Scholar] [CrossRef]
- Poltegor-Institute. Reactor for Catalytic Pyrolysis and gasification of Solid Fuels. WIPO ST 10/C PL448440, 29 February 2024. [Google Scholar]
- ISO 18134-1:2022; Solid Biofuels—Determination of Moisture Content—Oven Dry Method. International Standard published: Geneva, Switzerland, 2022.
- ISO 18123:2023; Solid Biofuels—Determination of Volatile Matter Content—Thermogravimetric Method. International Standard published: Geneva, Switzerland, 2023.
- ISO 18122:2022; Solid Biofuels—Determination of Ash Content. International Standard published: Geneva, Switzerland, 2022.
- ISO 5068-2:2025; Brown Coals and Lignites—Determination of Moisture—Part 2: Indirect Gravimetric Method for Moisture in the Analysis Sample. International Standard published: Geneva, Switzerland, 2025.
- ISO 5071-1:2021; Brown Coals and Lignites—Determination of Volatile Matter in the Analysis Sample—Part 1: Two-Furnace Method. International Standard published: Geneva, Switzerland, 2021.
- ISO 1171:2024; Coal and Coke—Determination of Ash. International Standard published: Geneva, Switzerland, 2024.
- ISO 21663:2020; Solid Recovered Fuels—Methods for the Determination of Carbon (C), Hydrogen (H), Nitrogen (N) and Sulphur (S) by the Instrumental Method. International Standard published: Geneva, Switzerland, 2020.
- ISO 1928:2020; Coal and Coke—Determination of Gross Calorific Value. International Standard published: Geneva, Switzerland, 2020.
- Czajka, K.M.; Kisiela, A.M.; Moroń, W.; Ferens, W.; Rybak, W. Pyrolysis of solid fuels: Thermochemical behaviour, kinetics and compensation effect. Fuel Process. Technol. 2016, 142, 42–53. [Google Scholar] [CrossRef]
- Alvarez, S.; Raydan, N.D.V.; Svahn, I.; Gontier, E.; Rischka, K.; Charrier, B.; Robles, E. Assessment and characterization of duck feathers as potential source of biopolymers from an upcycling perspective. Sustainability 2023, 15, 14201. [Google Scholar] [CrossRef]
- Tesfaye, T.; Sithole, B.; Ramjugernath, D.; Chunilall, V. Valorisation of chicken feathers: Characterisation of chemical properties. Waste Manag. 2017, 68, 626–635. [Google Scholar] [CrossRef] [PubMed]
- Kuznetsov, P.N.; Fetisova, O.Y.; Kuznetsova, L.I.; Avid, B.; Purevsuren, B. Insight into the key kinetic steps in the pyrolysis of coking and non-coking coals, characterization of the pyrolysis products. Int. J. Coal Sci. Technol. 2023, 10, 16. [Google Scholar] [CrossRef]
- Lv, T.; Fang, M.; Li, H.; Yan, J.; Cen, J.; Xia, Z.; Tian, J.; Wang, Q. Pyrolysis of a typical low-rank coal: Application and modification of the chemical percolation devolatilization model. RSC Adv. 2021, 11, 17993–18002. [Google Scholar] [CrossRef]
- Matsuoka, K.; Ma, Z.-X.; Akiho, H.; Zhang, Z.-G.; Tomita, A.; Fletcher, T.H.; Wójtowicz, M.A.; Niksa, S. High-Pressure Coal Pyrolysis in a Drop Tube Furnace. Energy Fuels 2003, 17, 1595–1601. [Google Scholar] [CrossRef]
- Zeng, D.; Fletcher, T.H. Effects of Pressure on Coal Pyrolysis and Char Morphology. Energy Fuels 2005, 19, 1828–1837. [Google Scholar] [CrossRef]
- Chen, H.; Yang, H.; Ju, F.; Wang, J.; Zhang, S. The influence of pressure and temperature on coal pyrolysis/gasification. Asia-Pac. J. Chem. Eng. 2007, 2, 203–212. [Google Scholar] [CrossRef]
- Wu, F.; Huang, S.; Jiang, Q.; Jiang, G. Effects of Pressure and Heating Rate on Coal Pyrolysis: A Study in Simulated Underground Coal Gasification. J. Anal. Appl. Pyrolysis 2023, 175, 106179. [Google Scholar] [CrossRef]
- Zhu, Y.; Wang, Q.; Yan, J.; Cen, J.; Fang, M.; Ye, C. Influence and action mechanism of pressure on pyrolysis process of a low rank Naomaohu coal at different temperatures. J. Anal. Appl. Pyrolysis 2022, 167, 105682. [Google Scholar] [CrossRef]
- Canel, M.; Misirlioglu, Z.; Sinag, A. Hydropyrolysis of a Turkish lignite (Tuncbilek) and effect of temperature and pressure on product distribution. Energy Convers. Manag. 2005, 46, 2185–2197. [Google Scholar] [CrossRef]
- Li, Y.; Wang, Z.-H.; Huang, Z.-Y.; Liu, J.-Z.; Zhou, J.-H.; Cen, K.-F. Effect of pyrolysis temperature on lignite char properties and slurrying ability. Fuel Process. Technol. 2015, 134, 52–58. [Google Scholar] [CrossRef]
- Jewulski, J.; Skrzypkiewicz, M.; Struzik, M.; Lubarska-Radziejewska, I. Lignite as a fuel for direct carbon fuel cell system. Int. J. Hydrogen Energy 2014, 39, 21778–21785. [Google Scholar] [CrossRef]
- Du, Z.; Guo, W.; Han, L. Thermal transformation of coal molecular structures and their impact on reactivity in metallurgical-grade silicon production. Processes 2025, 13, 1371. [Google Scholar] [CrossRef]
- Jessup, R.S. Heats of Combustion of Diamond and of Graphite. J. Res. Natl. Bur. Stand. 1934, 12, 75–84. [Google Scholar] [CrossRef]
- Jefriadi, J.; Oktaviani, M.; Rahmi, L.; Jelita, R. Characteristics of hybrid coal from co-pyrolysis of lignite and corn cob. J. Bahan Alam Terbarukan 2023, 12, 1–8. [Google Scholar] [CrossRef]
- Hu, H.; Zhou, Q.; Zhu, S.; Meyer, B.; Krzack, S.; Chen, G. Product distribution and sulfur behavior in coal pyrolysis. Fuel Process. Technol. 2004, 85, 849–861. [Google Scholar] [CrossRef]
- Cheah, S.; Malone, S.C.; Feik, C.J. Speciation of sulfur in biochar produced from pyrolysis and gasification of oak and corn stover. Environ. Sci. Technol. 2014, 48, 8474–8480. [Google Scholar] [CrossRef]
- Mahinpey, N.; Murugan, P.; Mani, T.; Raina, R. Analysis of bio-oil, biogas, and biochar from pressurized pyrolysis of wheat straw using a tubular reactor. Energy Fuels 2009, 23, 2736–2742. [Google Scholar] [CrossRef]
- Wafiq, A.; Reichel, D.; Hanafy, M. Pressure influence on pyrolysis product properties of raw and torrefied Miscanthus: Role of particle structure. Fuel 2016, 179, 156–167. [Google Scholar] [CrossRef]
- Stummann, M.Z.; Høj, M.; Schandel, C.B.; Hansen, A.B.; Wiwel, P.; Gabrielsen, J.; Jensen, P.A.; Jensen, A.D. Hydrogen assisted catalytic biomass pyrolysis. Effect of temperature and pressure. Biomass Bioenergy 2018, 115, 97–107. [Google Scholar] [CrossRef]
- Yang, F.; Yu, Q.; Qi, Z.; Qin, Q. Study of pyrolysis product distribution characteristics of lignite in the context of electrochemical catalytic gasification. RSC Adv. 2021, 11, 38434–38443. [Google Scholar] [CrossRef]
- Lei, Z.; Jin, S.; Hao, S.; Yang, J.; Wei, K.; De, T.; Weiwei, X. Investigation on the Distribution of Yimin Lignite Pyrolysis Products and the Stability of its Char. ACS Omega 2021, 6, 13953–13961. [Google Scholar] [CrossRef] [PubMed]
- Serov, A.A.; Hrabovský, M.; Kopecký, V.; Maslani, A.; Hlina, M.; Hurba, O. Lignite gasification in thermal steam plasma. Plasma Chem. Plasma Process. 2019, 39, 395–406. [Google Scholar] [CrossRef]
- Niu, M.; Xin, L.; Cheng, W.; Liu, S.; Wang, B.; Xu, W. Effects of Pressurized Pyrolysis on the Chemical and Porous Structure Evolution of Coal Core during Deep Underground Coal Gasification. ACS Omega 2023, 8, 40153–40161. [Google Scholar] [CrossRef] [PubMed]
Disclaimer/Publisher’s Note: The statements, opinions and data contained in all publications are solely those of the individual author(s) and contributor(s) and not of MDPI and/or the editor(s). MDPI and/or the editor(s) disclaim responsibility for any injury to people or property resulting from any ideas, methods, instructions or products referred to in the content. |
© 2025 by the authors. Licensee MDPI, Basel, Switzerland. This article is an open access article distributed under the terms and conditions of the Creative Commons Attribution (CC BY) license (https://creativecommons.org/licenses/by/4.0/).