1. Introduction
Meeting net-zero targets requires a major rethink of where the world’s energy comes from. The International Energy Agency’s 2023 Net-Zero Roadmap still sets 2050 as the deadline for carbon-neutral energy [
1]. Meanwhile, the European Green Deal aims for at least a 55% cut in emissions by 2030 and full climate neutrality by 2050 [
2]. At the same time, electricity demand continues to rise; it reached a new record in 2023 at 29,471 TWh, which is an increase of 627 TWh compared to the previous year [
3]. Ocean waves, a virtually unexplored and renewable resource, can help balance ambitious electricity supply targets with increasing demand whilst diversifying the energy mix. The global gross theoretical wave power potential is estimated at roughly 3.7 terawatts [
4], which is already comparable to the world’s average electricity demand. Along Europe’s Atlantic coast, the resource is especially strong: the west coast of Portugal sees average annual wave power values of around 40 kW per meter of wave crest [
5], making the country one of the continent’s key energy “hotspots.” But beyond the sheer magnitude of the wave energy resource, functionality is crucial for power grid integration (i.e., an aspect related to how and when this energy can be practically be supplied). Indeed, wave energy can be predicted reliably several days in advance [
6] and often reaches its peak when solar power is low, making it a natural complement to solar generation [
7]. The predictability of wave energy also helps smooth out the variability of wind power, contributing to a more stable and balanced energy system. In short, harnessing even a small portion of this reliable, high-density energy source could assist ongoing decarbonization efforts whilst ensuring sufficient electricity supply.
Wave-energy technology is remarkably varied: over 6400 patents have been filed worldwide [
8]. Yet, only a small number of these designs have reached full-scale for sea trials. In general, wave energy converters fall into three main hydrodynamic categories: oscillating water columns, overtopping devices, and wave-activated bodies such as point absorbers, attenuators, and surge flaps [
9]. These systems also differ by location: some are fixed to the shore, others are mounted on the seabed in shallow waters, and others float offshore in deeper waters. Each setting influences the WEC–wave interactions, device accessibility, conversion performance and the overall cost [
10]. Several prototypes highlight the range of wave energy technologies. On the shoreline, Spain’s Mutriku breakwater plant features 16 oscillating water column chambers with a total capacity of 259 kW and has produced over 3 GWh since it began operating in 2011 [
11]. Offshore, the Pelamis P1, an articulated attenuator, enabled the world’s first wave farm in 2008 with three 750 kW machines (2.25 MW total) connected to the grid at Aguçadoura, Portugal [
12]. WECs, such as the EcoWavePower, Oyster, and WaveRoller devices, located on or near the shore, have the advantage of requiring shorter power transmission lines and are easier to maintain due to their proximity to the shore. This makes them favorable candidates for earlier development over offshore devices.
Despite the aforementioned milestones, wave energy deployment remains limited. By the end of 2023, 13.3 MW of wave energy had been installed in Europe since 2010, but only about 1 MW was still operating [
13]. A key barrier is cost, as the levelized cost of wave electricity in 2020 ranged between 0.35 and 0.85 USD/kWh [
14]. This was about seven times higher than the average cost of new offshore wind projects commissioned that same year, which was estimated at 0.084 USD/kWh [
15]. A closer look at these costs reveals that capital expenditures (CAPEX) dominate the levelized cost of electricity (LCOE), while operating costs (OPEX) are smaller but still significant [
14]. The high costs are largely due to the challenges of survivability, as shown by field experience [
16]. Failures such as the withdrawal of Pelamis P1 after technical issues [
12], the shutdown of Oyster-800 (Aquamarine Power Ltd., Edinburgh, UK) in 2015 after testing [
17], and storm damage to CETO-4 in 2014 [
18] highlight how extreme ocean loads lead to overengineered structures, unexpected downtime, and investor hesitation. In short, reducing LCOE requires modeling tools that can accurately predict the complex, non-linear forces acting on devices, allowing for lower yet more reliable safety margins without compromising structural integrity. This need sets the foundation for the CFD-based approach introduced in the next section.
The hydrodynamic modeling of a wave-energy converter (WEC) typically begins with linear potential-flow theory [
19]. In this approach, dynamic equations and forces are described using Newton’s second law and the Cummins formulation, which via convolution terms allow including the hydrodynamic effect of the device’s past motion [
20]. The hydrodynamic coefficients needed for these type of models are rapidly calculated using boundary-element methods based on solving a potential-flow domain. Recent comparative studies of this approach applied to WECs evaluate open-source tools (e.g., NEMOH v2.0, HAMS v3.2, Capytaine v1.4.0) and their computational trade-offs against commercial alternatives [
21,
22]. However, potential-flow theory does not account for viscosity and cannot reproduce the strongly non-linear interactions that dominate during large body motions/free surface elevation amplitudes in energetic seas [
23]. As a result, large safety margins are still used when designing for near-breaking [
16], motivating the use of nonlinear and high-fidelity Computational Fluid Dynamics (CFD) to capture these extreme phenomena. Beyond the study of WECs, CFD has also proven its versatility in other engineering contexts, offering the ability to capture viscous dissipation and turbulence while reducing reliance on costly experimental campaigns and thereby shortening research duration and development costs. For instance, it has been successfully applied to analyzing hydraulic energy losses in complex pipeline and fitting configurations [
24], demonstrating its capability to resolve intricate hydrodynamic processes and energy dissipation mechanisms. Building on this broader foundation, Reynolds-Averaged Navier–Stokes (RANS) simulations coupled with Volume-of-Fluid (VOF) schemes have been employed in the marine field to resolve the air–water interface and strongly non-linear effects. Such approaches are increasingly validated for the survivability assessment of WECs under extreme sea- states [
25,
26]. The applicability of OpenFOAM to the study of WECs, including the modeling of steep and breaking waves, has been confirmed by several recent studies [
27,
28]. This has particularly been demonstrated through the use of specialized open-source tools such as waves2Foam [
29], IHFoam [
30], and olaFlow [
31]. Because full CFD simulations remain computationally expensive, a targeted strategy is to select extreme wave conditions directly from long-term hindcasts and reproduce only those in RANS–VOF models, keeping costs manageable while providing high-fidelity survival load estimates needed to optimize design margins and lower the levelized cost of energy [
25,
32].
This study focuses on the Pivoting WEC (PWEC), which is a redesigned version of the original CECO WEC [
33,
34] developed at the Faculty of Engineering of the University of Porto (FEUP). PWEC, in contrast to CECO (translating WEC), consists of a rigid flap-shaped floater that swings around an upper hinge and activates a rotational-like power-take-off (PTO), which is placed above the waterline for easier maintenance. The hinge and PTO are attached to a fixed structure. An initial assessment of the PWEC was carried out using a time-domain potential-flow framework based on the Cummins equation with no CFD employed at this stage [
35,
36]. Thanks to the simpler structure and dry PTO, the design promises a 28% reduction in capital costs and could shorten the expected payback time by roughly 2.5 years [
35]. The key innovation of this device is the introduction of a passive duck diving survival mode, which was specifically designed to limit the loads experienced by the device during storm conditions [
36]. It was found that this mode could significantly reduce the floater’s exposure to wave forces and structural loads by up to 65% during storms. This preliminary finding justifies the motivation for more accurate numerical modeling of the present study, which is aimed at testing the survivability under non-linear waves loading conditions.
The primary objective of this study is to develop a high-fidelity CFD model to evaluate extreme loads on a PWEC using a fully viscous approach based on RANS-VOF simulations implemented in olaFlow. The novelty of the work lies in the numerical modeling of a new PWEC concept, which is aimed at supporting the structural design process through accurate hydrodynamic load predictions. This, positively, enables the development of resilient wave energy converter structures while minimizing the risk of overengineering. The passive duck diving survival mode of the PWEC involves locking the flap-shaped floater in a submerged position beneath the wave crest during storm conditions, thereby significantly reducing the loads acting on the device. The proposed CFD framework is intended not only to assess the performance of this specific WEC configuration but also to be applicable to similar nearshore devices. Additionally, the study seeks to validate the effectiveness of the survival strategy in mitigating extreme wave-induced forces, enhancing structural integrity, and promoting the long-term viability of wave energy as a dependable renewable energy source.
The paper is divided into three main parts: Materials and Methods, which outlines the PWEC concept, site conditions, and the CFD modeling approach; Results, which presents simulation outcomes and validation against experimental data; and Discussion and Conclusion, which interpret the findings in terms of structural resilience and the effectiveness of the passive duck diving survival mode under extreme wave conditions.
2. Materials and Methods
2.1. Description of the PWEC
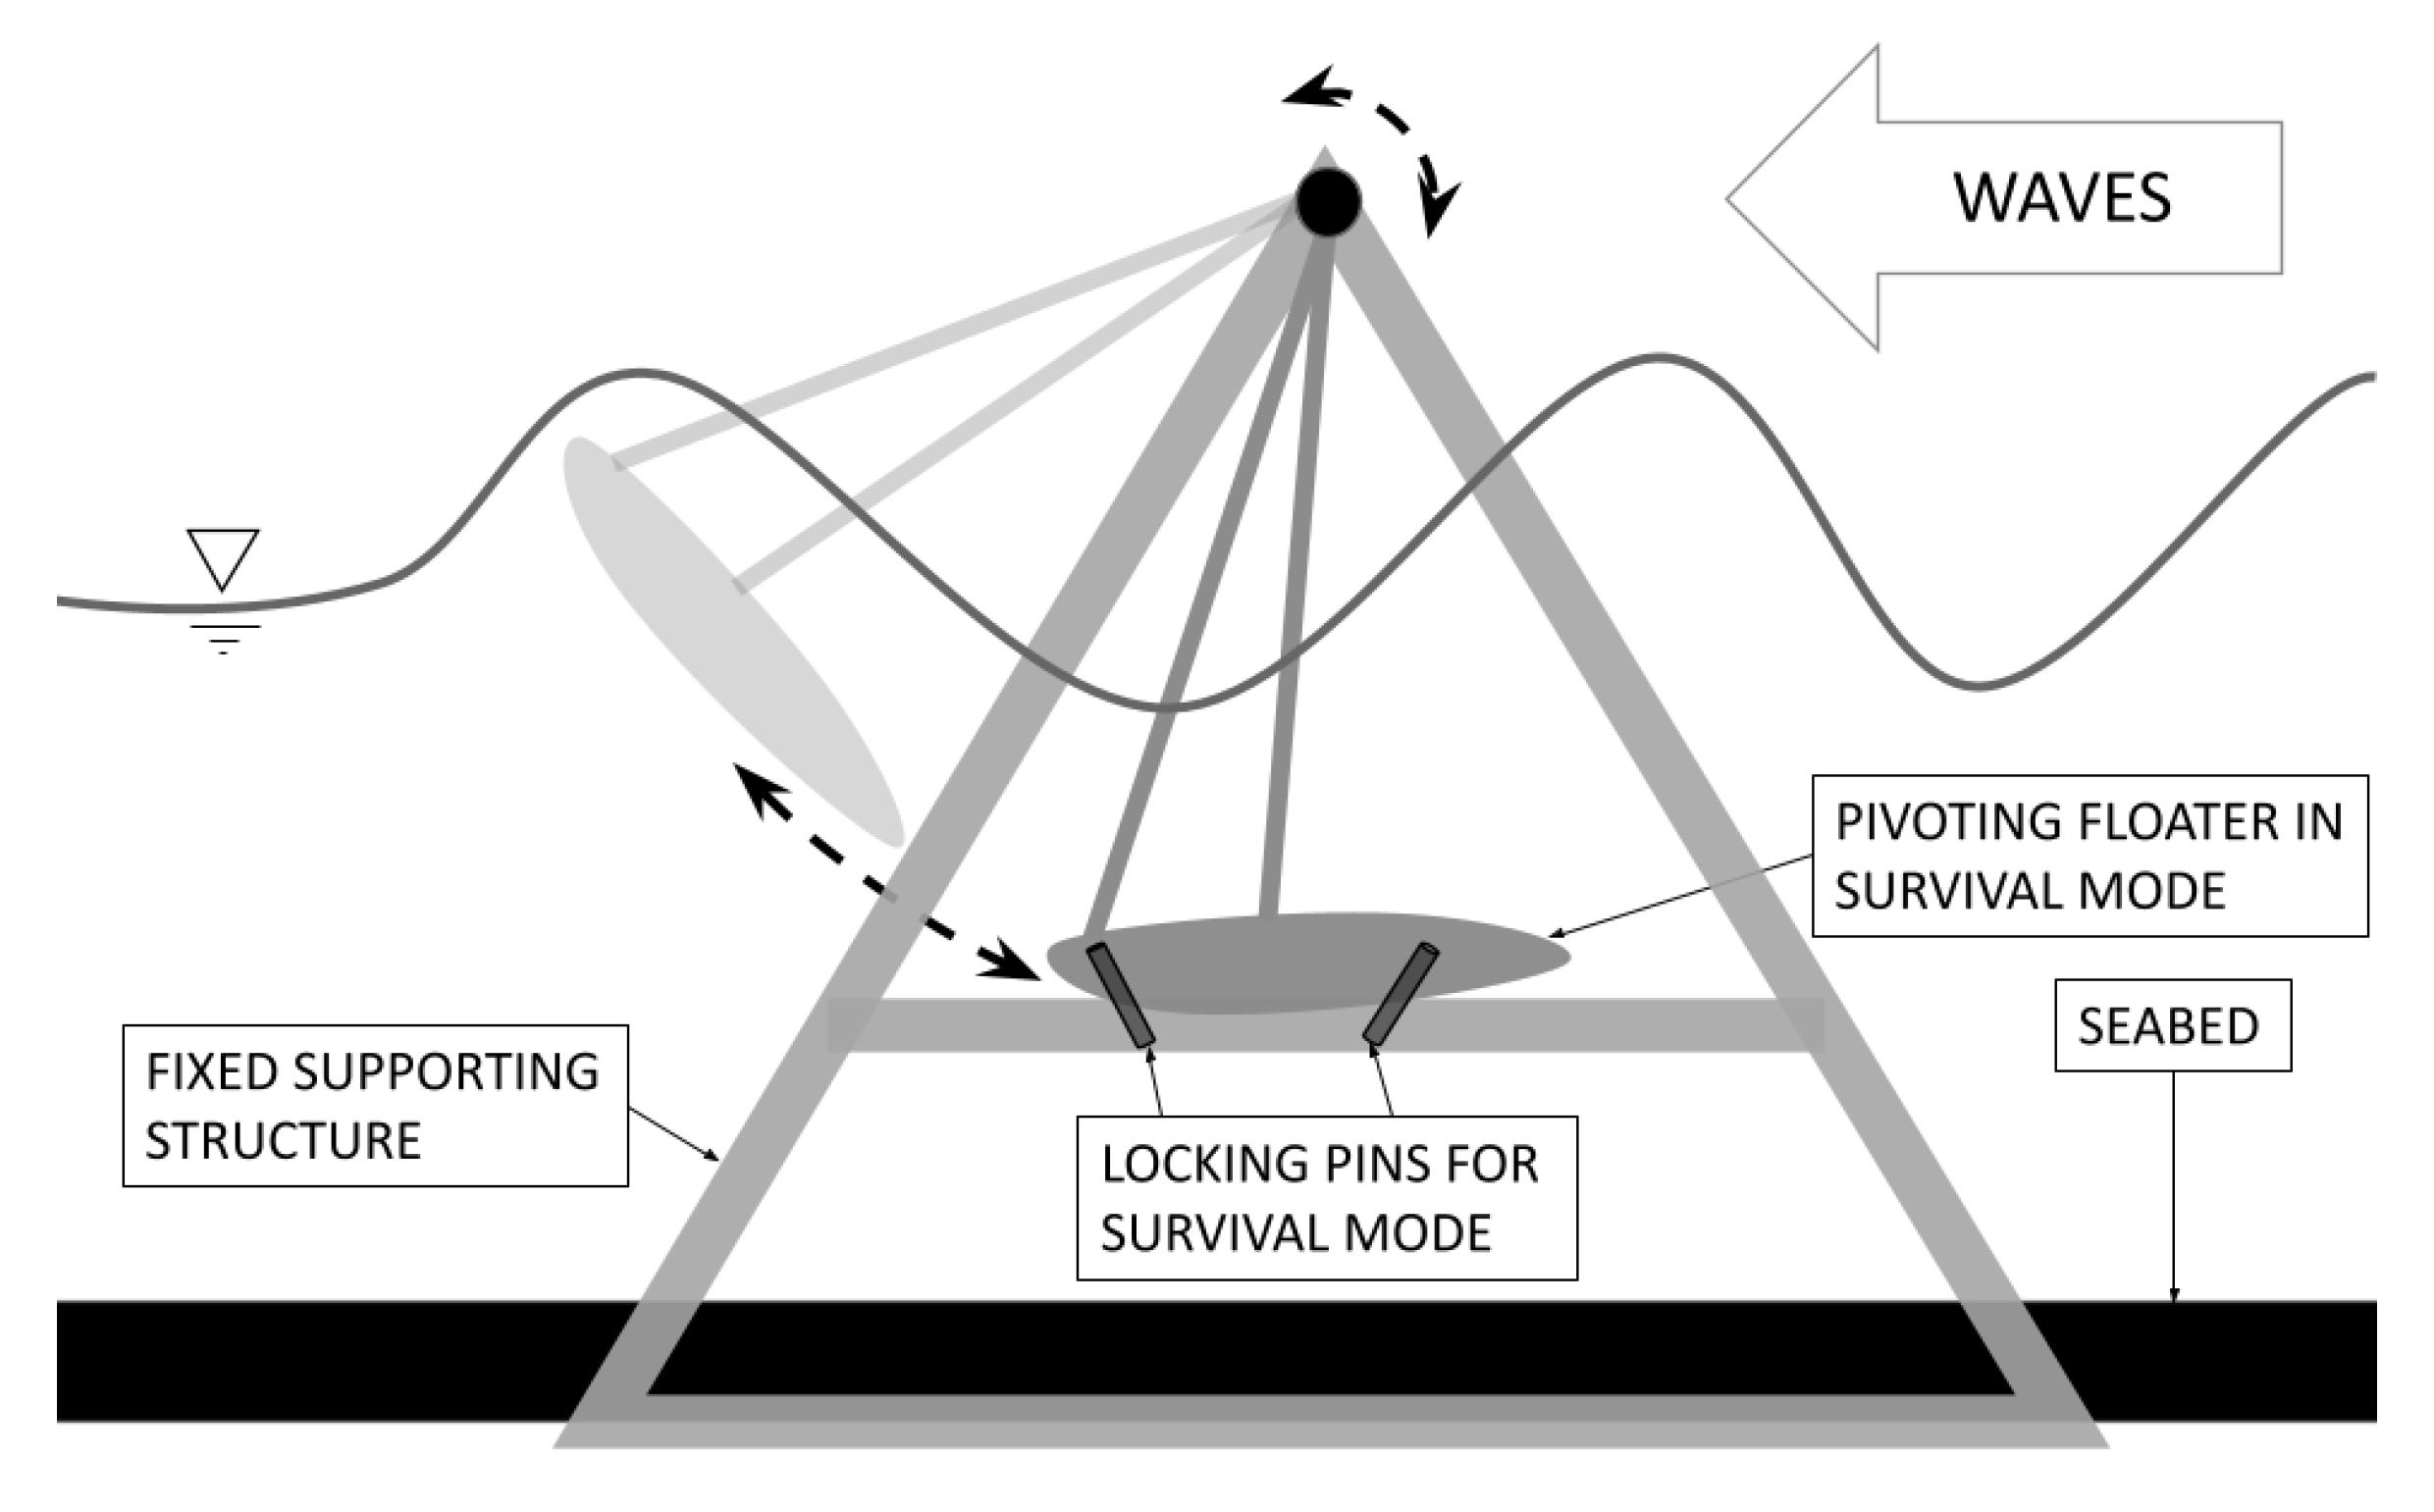
The PWEC is a near-shore wave energy device designed to harness the kinetic energy of ocean waves, as shown in
Figure 1. It uses a single floater that pivots around a joint fixed above the water, which is supported by a rigid structure anchored to the seabed. Under operational conditions, the floater oscillates in response to waves, and this motion is transmitted to a rotary generator positioned at the pivot point. The conversion of mechanical energy into electricity is achieved through a compact, above-water mechanical setup. By placing the mechanical components above the water surface, the PWEC offers practical advantages in terms of accessibility while also lowering installation and maintenance requirements compared to traditional submerged systems.
The PWEC’s ability to withstand extreme wave conditions was a key consideration in its design, which is why a dedicated passive duck diving survival mode was included. This mode, inspired by the duck-dive technique used by surfers to pass beneath breaking waves and avoid their full force, submerges the floater and locks it in a low-profile position beneath the wave crest using electrically controlled pins. Combined numerical simulations and 1/20 scale physical tests show that this configuration can reduce total hydrodynamic loads by up to 65% compared to normal operation [
36]. This significant load reduction allows for lighter locking pins, a more streamlined support frame, and ultimately, tighter safety margins across the entire structure.
2.2. Deployment Site and Environmental Conditions
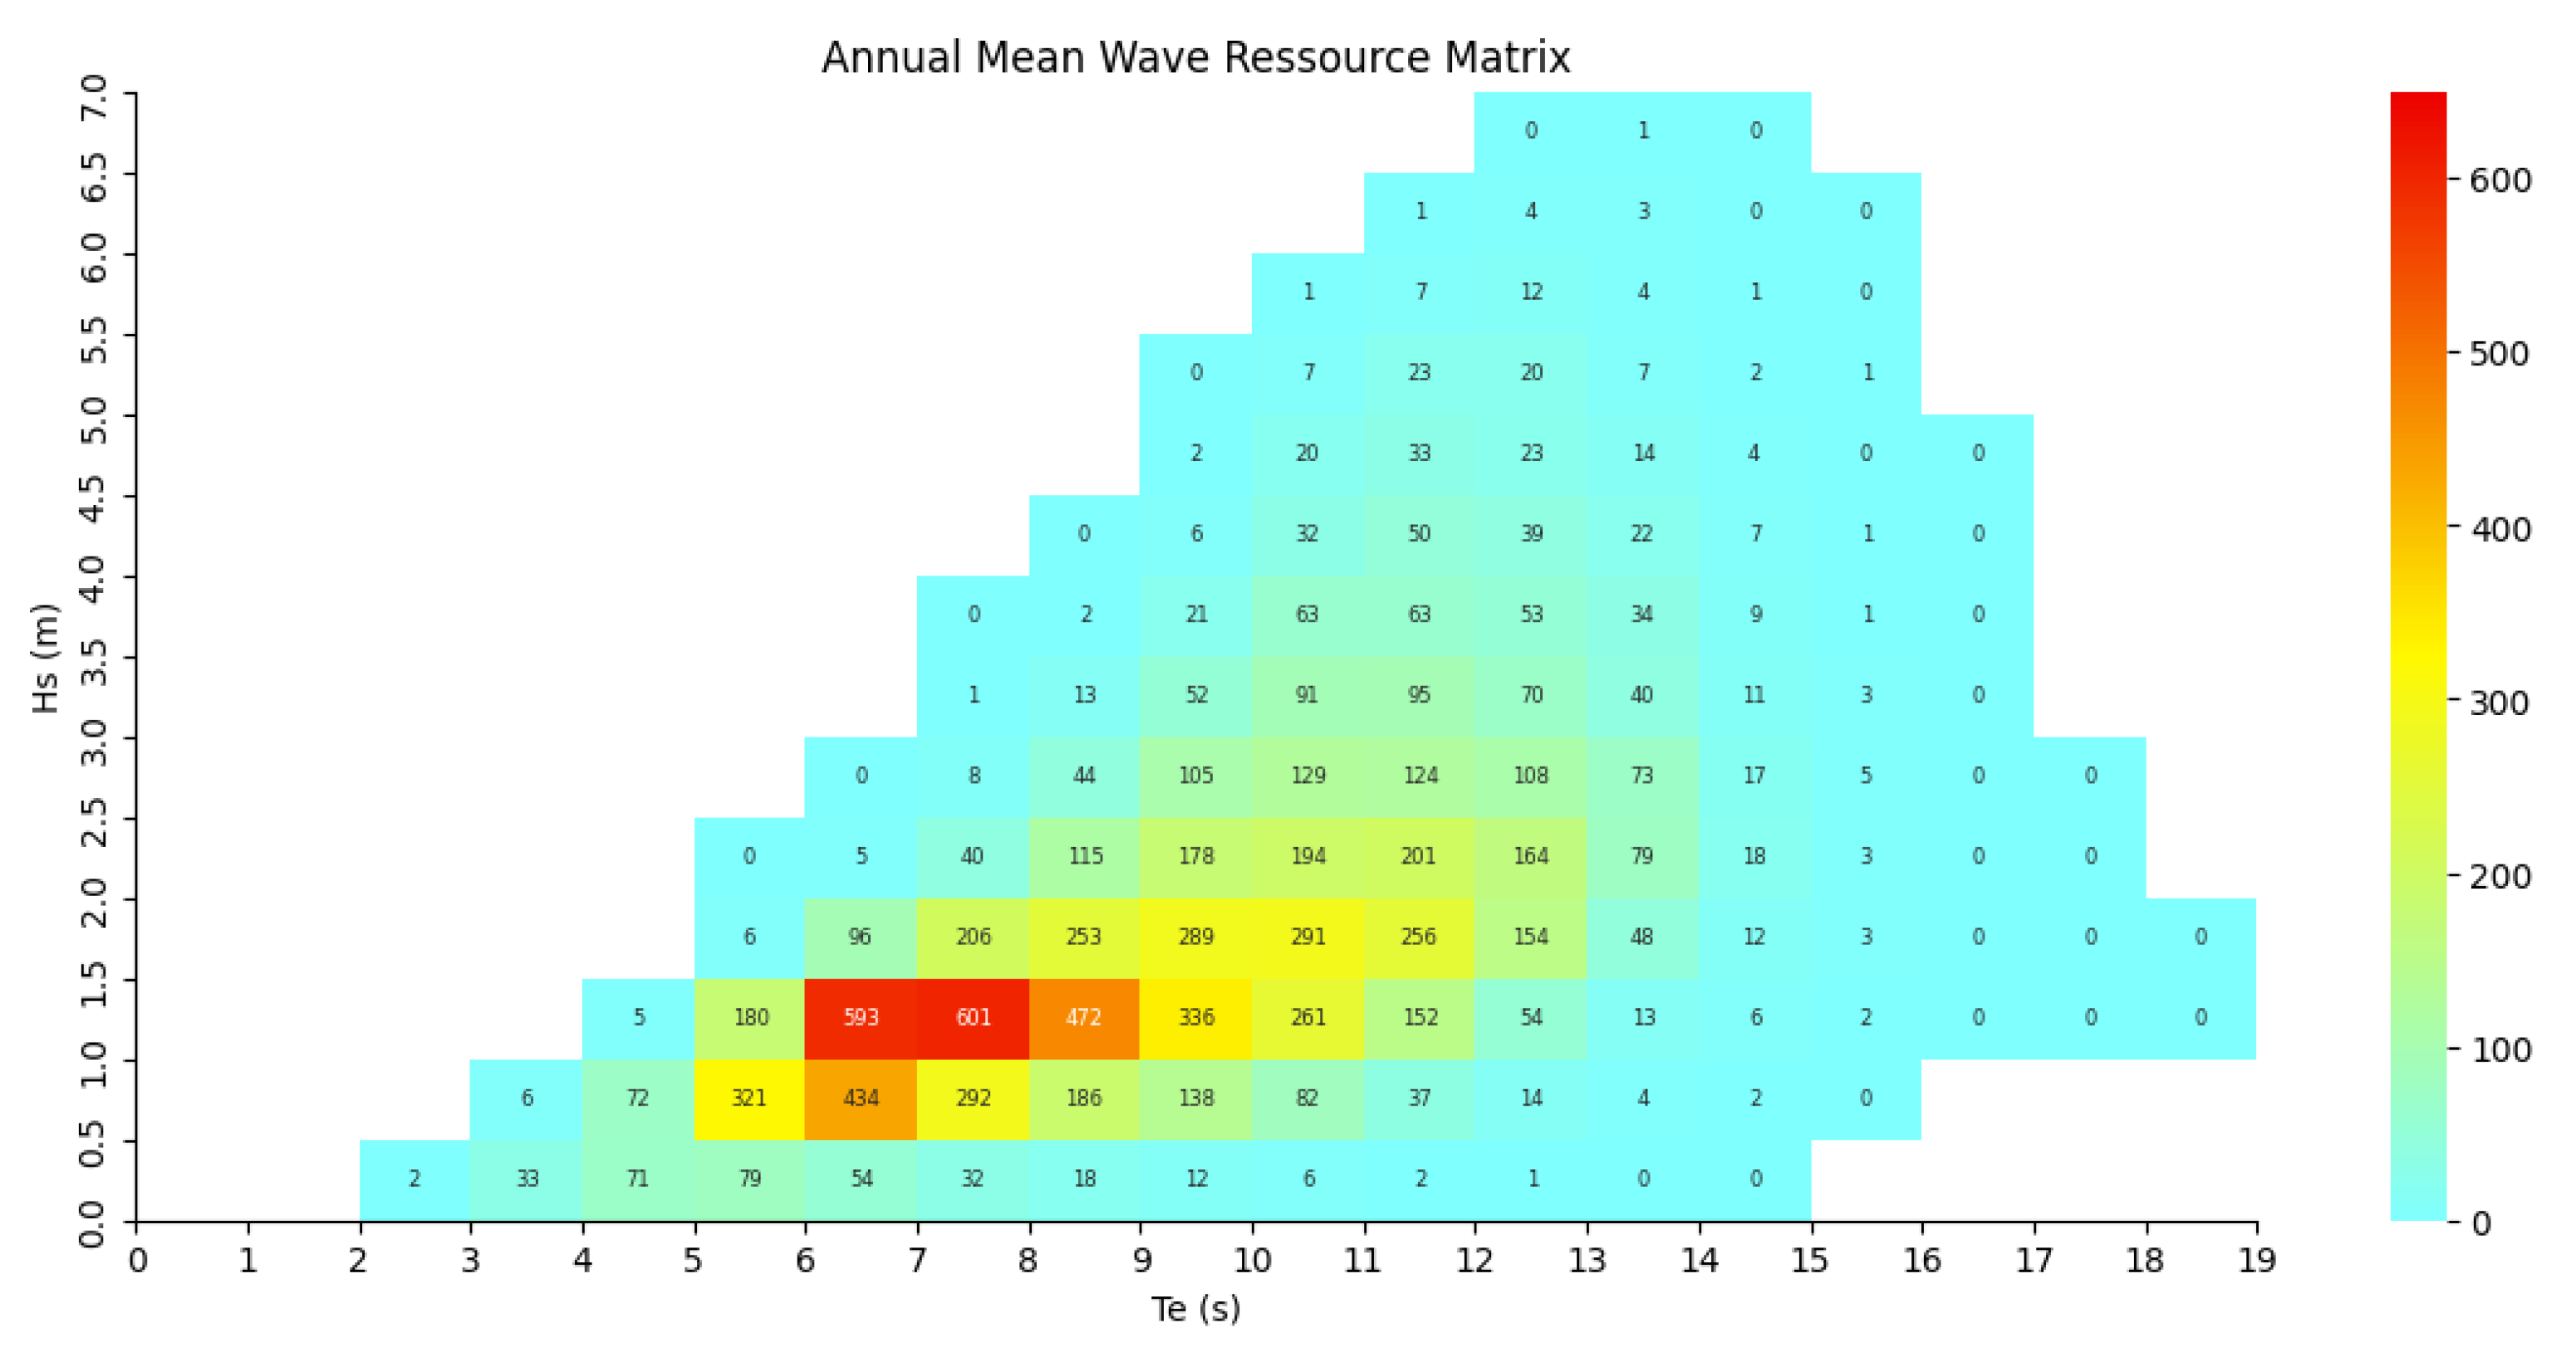
The full-scale PWEC prototype is being studied for potential deployment off the coast of Matosinhos, Portugal (coordinates: 41.17830° N, −8.71047° W). The device is developed to operate and withstand realistic Atlantic Ocean wave conditions. For such scope, a wave resource matrix based on 44 years of wave observations at the deployment site is shown in
Figure 2.
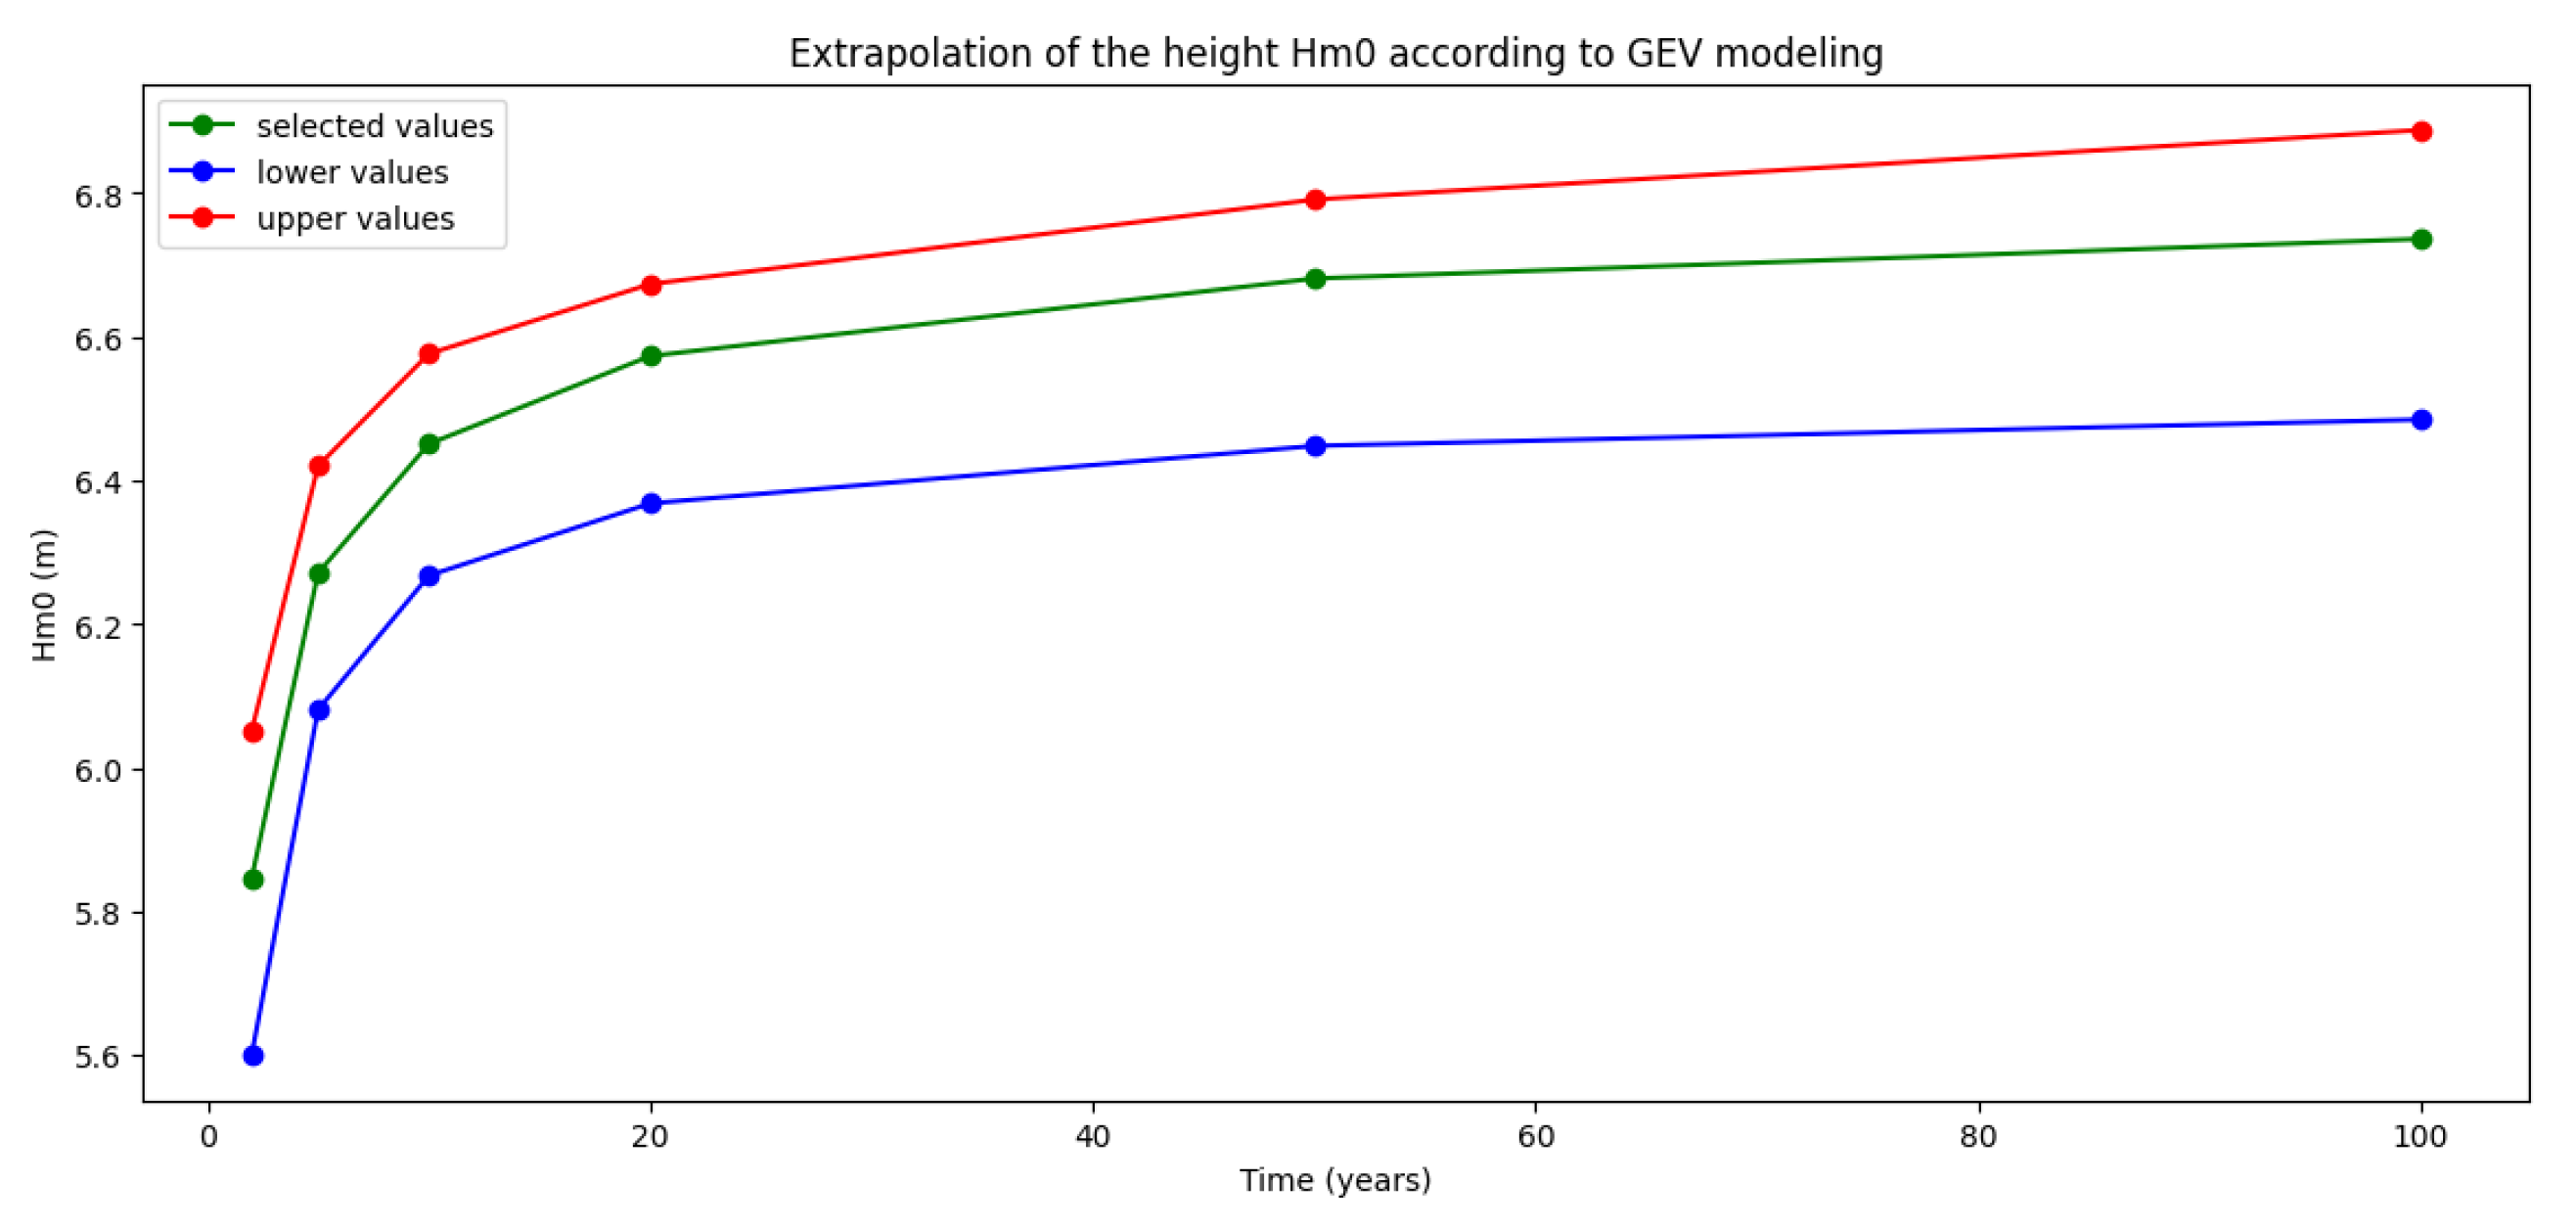
To assess the long-term survival capability of the WEC, it is essential to characterize the most extreme sea states it may encounter over its operational lifetime. To this end, a Block Maxima (BM) sampling method was employed by selecting the annual maximum significant wave heights (Hm0) from the past 44 years. However, for the purposes of distribution fitting, only the first 43 years were considered, as the most recent value appeared anomalous. Although it could not be definitively confirmed as an outlier, its exclusion led to improved Hm0 estimates. These maxima were then used to fit a Generalized Extreme Value (GEV) distribution, allowing us to extrapolate the probability of future extreme sea states [
37]. Based on this modeling, spectral significant wave heights expected over a 100-year period were estimated. The GEV model produced three representative cases: a central estimate, a lower prediction bound, and an upper prediction bound.
Figure 3 shows the evolution of Hm0 over 100 years for these three scenarios. The upper bound represents the reference survival conditions the PWEC must endure, serving as a basis for structural integrity assessment and design validation.
2.3. Numerical Setup
Three-dimensional (3D) numerical simulations were carried out using OpenFOAM-10, an open-source CFD platform, coupled with the olaFlow library, which is specifically adapted for simulating wave propagation and interactions with stationary structures. Only the floater was represented in this study to reduce computational costs (in terms of simulation time and memory requirements) and to simplify the geometry. The floater was modeled as a rigid, fixed body to analyze the passive duck diving survival mode of the PWEC (submerged fixed floater), matching the operational scope of the olaFlow solver.
The flow is described by the incompressible, multiphase Navier–Stokes equations and is discretized with the finite-volume method:
The density and viscosity depend on the volume fraction
:
and
. The term
comes from the Continuum-Surface-Force formulation for surface tension [
38].
To capture the air–water interface, the Volume-of-Fluid (VOF) method solves a transport equation for
, as shown in Equation (
3).
with
sharpening the interface. The MULES limiter maintains
while conserving mass [
39,
40].
The pressure–velocity coupling is addressed through the PIMPLE algorithm, which is a hybrid approach that merges SIMPLE under-relaxation with PISO pressure corrections. By combining the stability of SIMPLE with the time accuracy of PISO, this method is particularly effective for transient multiphase simulations [
38,
41].
In all simulations, three outer correctors, two pressure correctors, and one non-orthogonal corrector were applied per time step, in line with best practices suggested by Wolf Dynamics [
42], to ensure numerical stability and convergence, particularly for strongly coupled flows, large domains, or when using meshes with non-orthogonal cells.
2.3.1. Computational Domain
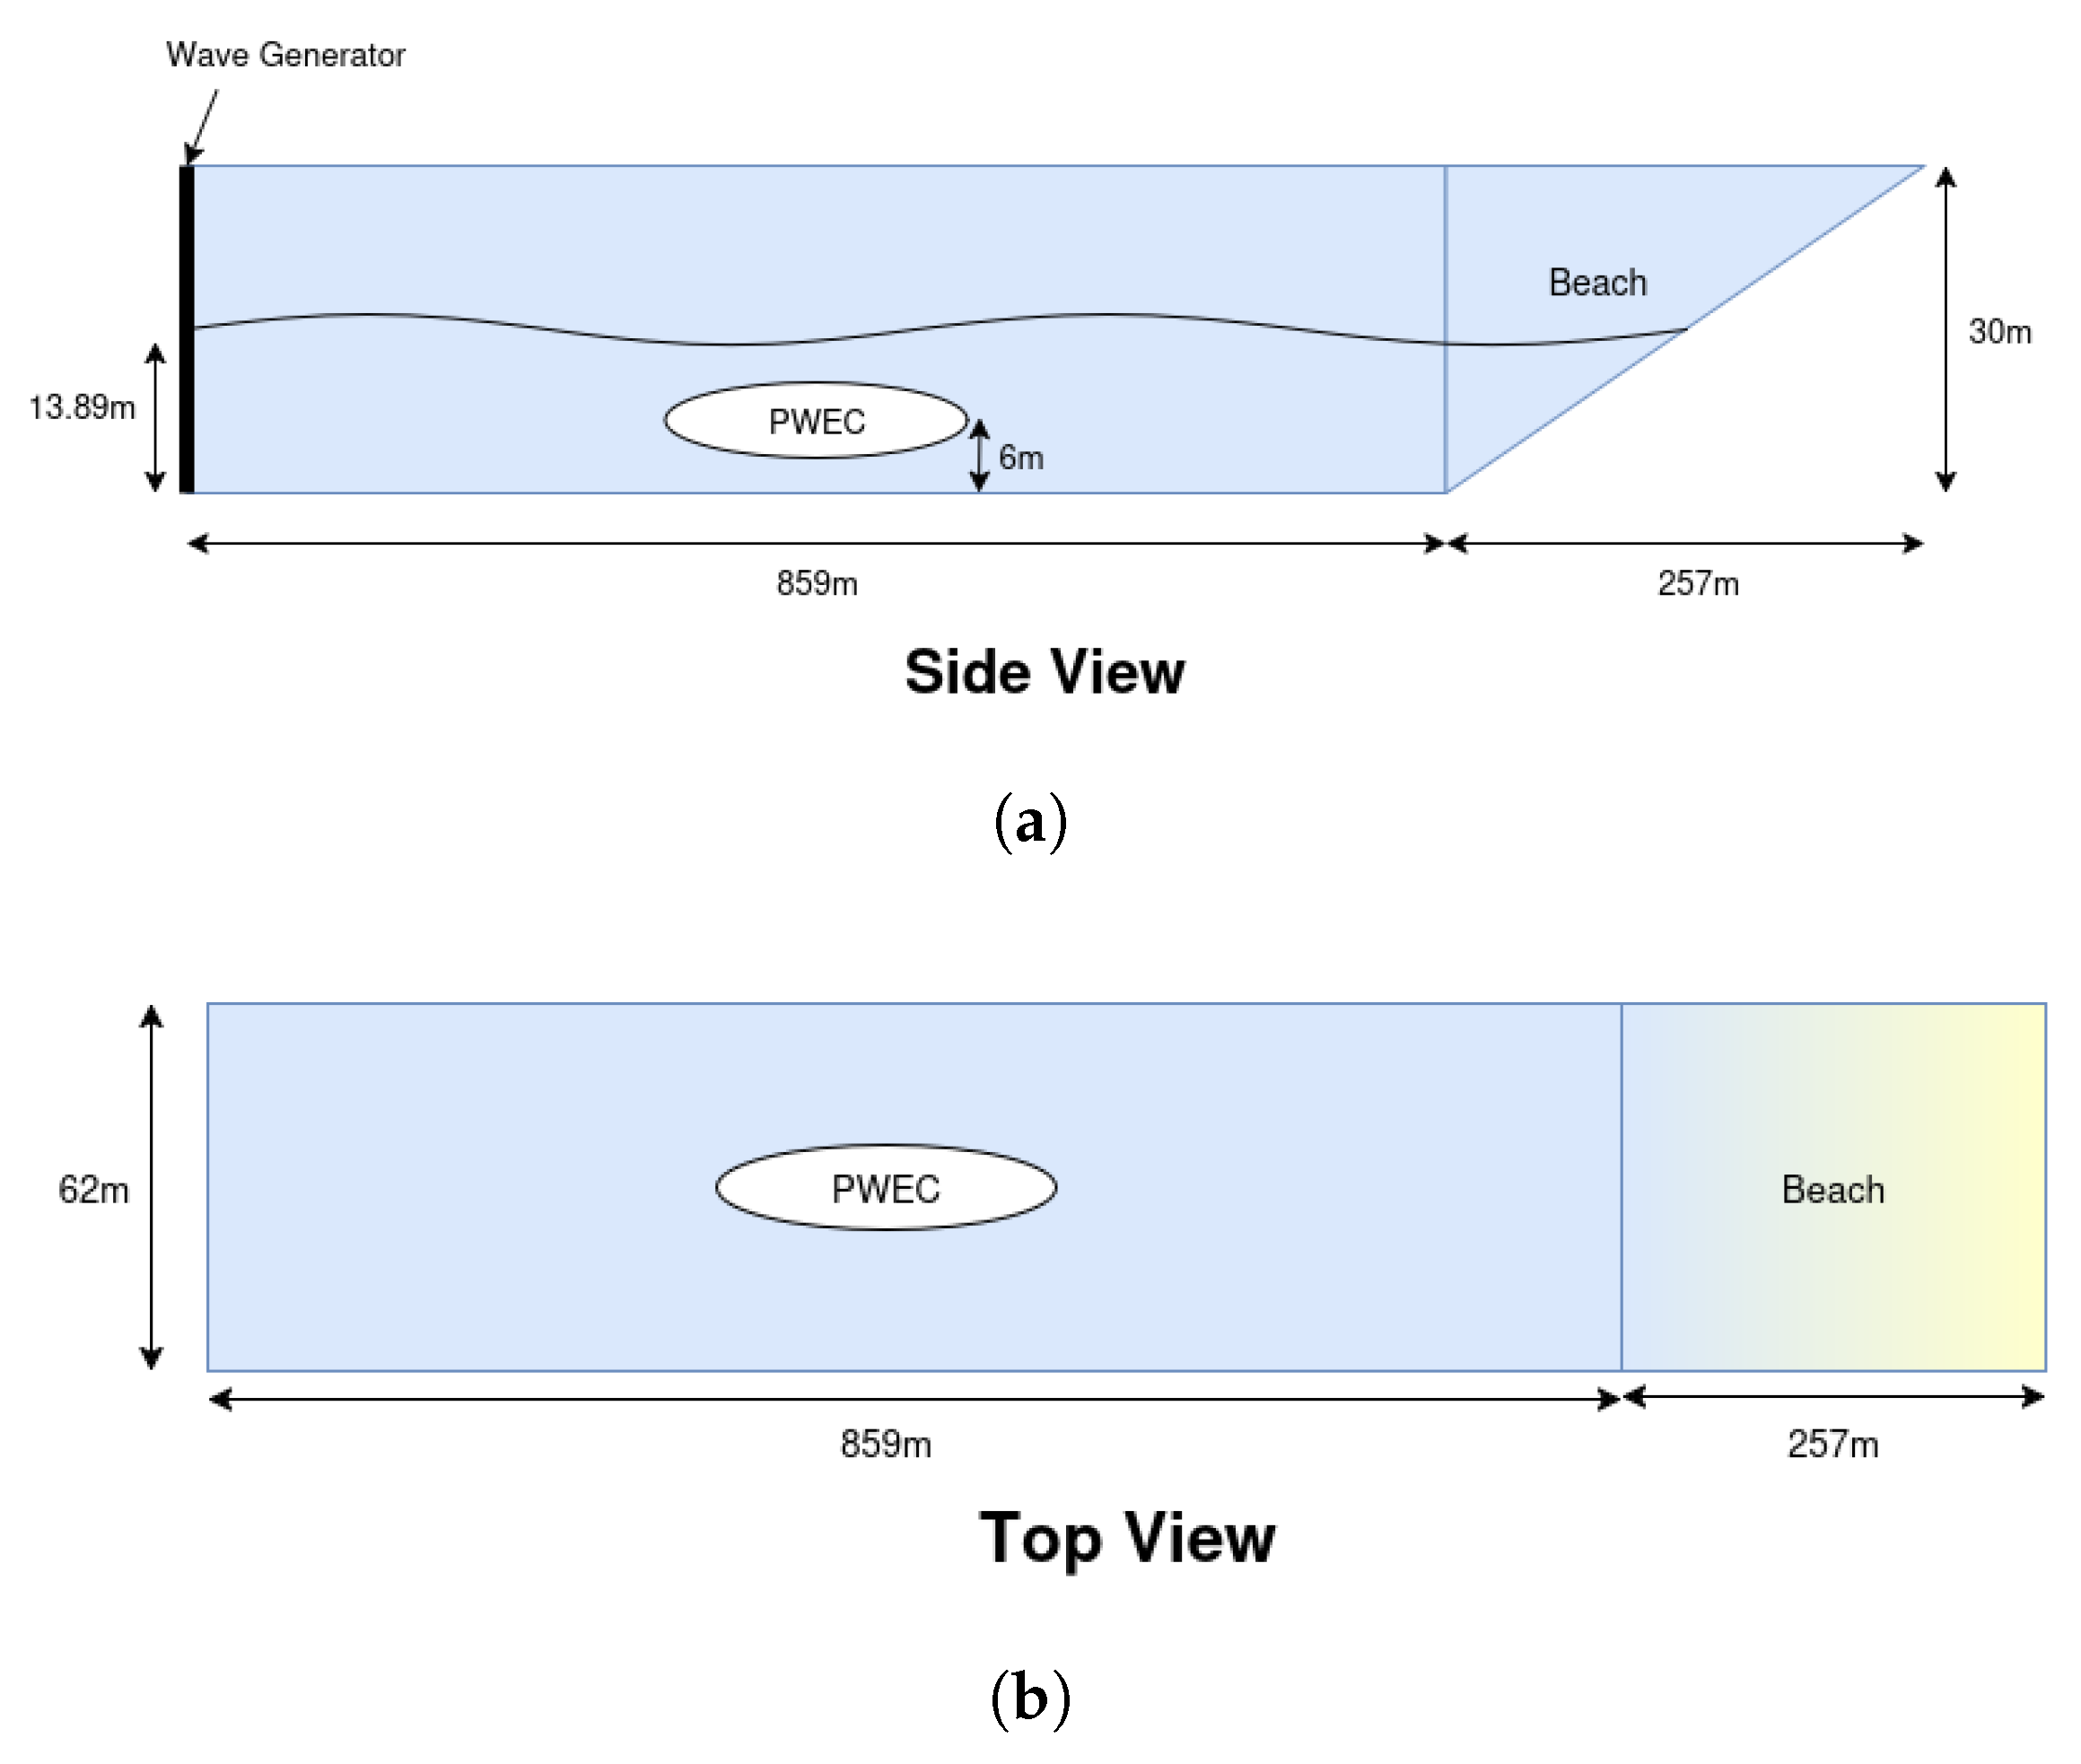
The computational domain was designed to provide adequate space for generating and propagating waves, as well as for capturing their interaction with the structure, whether in breaking or non-breaking conditions. In the streamwise direction, the domain length was set to six or eight times the incident wavelength plus the length of the floater: six times for model validation cases, which involve a set of regular waves [
43] used for model validation, and eight times for extreme wave cases, in which waves are more likely to break and potentially generate strong reflections [
44]. In all cases, the position where waves were generated was selected based on a preliminary analysis of the wave field in order to observe the exact target wave characteristics at the point of the WEC. A uniform bottom slope of 4°, approximately the bathymetry slope existing at the case study site, was applied consistently across all scenarios independent of the wave regime. This setup ensures that the free surface at the shoreline remains below the top of the slope under all wave conditions, effectively mimicking a beach profile. The 4° inclination encourages gradual changes in wave shape, concentrates wave energy through shoaling, and allows waves to break naturally when conditions favor it [
45].
In the transverse direction, the domain width was set to half a wavelength plus the floater’s width, allowing the development of a single wave crest without interference from lateral boundaries [
46]. In the vertical direction, the domain height was defined as 20 m or 30 m depending on the wave amplitude to provide adequate clearance above the free surface. This configuration kept the wave fully contained within the computational domain and contributed to stable tracking of the interface throughout the simulation.
Figure 4 shows the schematic of the overall computational domain used in the simulations.
Table 1 summarizes the different wave tank dimensions used in this study.
2.3.2. Mesh Generation
The mesh was generated through a two-step process: first, a coarse base grid was created using blockMesh, which was followed by local refinement with snappyHexMesh (OpenFOAM v10). This method provided precise control over mesh density in key areas while preserving overall computational efficiency across the domain.
Refinement was particularly focused on the free surface and the floater, as shown in
Figure 5. Following classical mesh design criteria to ensure an accurate resolution of wave elevation and interface dynamics, the mesh in the vertical direction near the surface was refined to achieve a resolution of
[
47]. In the horizontal direction along the wave propagation axis, a spatial resolution of
was enforced to resolve wave steepness and phase speed accurately according to recommended practices [
48].
Additional refinement levels were applied to the floater to capture pressure gradients and flow separation. In accordance with the fixed survival configuration studied in this work, a refinement level of 4-4 (base level plus four layers of local refinement) was applied to the floater surface. This configuration was selected based on prior mesh sensitivity analyses to ensure the convergence of hydrodynamic forces while limiting computational cost.
2.3.3. Boundary Conditions
To ensure valid waves generation and numerical stability, a set of tailored configurations and boundary conditions were implemented. Specific settings included wave absorption parameters to avoid wave reflections and track the water surface.
Table 2 summarizes the boundary conditions used for each domain boundary and their respective purposes.
This boundary setup was chosen to closely mimic real hydrodynamic conditions in wave–structure interaction simulations while reducing numerical issues like artificial reflections or energy build-up at the edges of the domain.
2.3.4. Temporal Discretization
To maintain numerical stability throughout the simulations, two Courant number limits were enforced: one for the overall flow (maxCo) and another for the volume fraction field (maxAlphaCo), which were both capped at 0.5. In areas where the flow changed rapidly, particularly near the interface or during strong wave impacts, a minimum time step ( s) was used to avoid solver divergence. The time integration itself was accomplished using the implicit Euler method, which, although first-order accurate, proved reliable when dealing with sharp gradients and non-linear wave behavior.
2.3.5. Interface Capturing
The air–water interface was accurately captured using the VOF method along with the MULES (Multidimensional Universal Limiter for Explicit Solution) algorithm. To maintain a sharp interface and limit numerical diffusion, the MULES settings were adjusted to nAlphaCorr = 3, nAlphaSubCycles = 2, and cAlpha = 2. These parameters, respectively, control the number of correction steps, the number of sub-cycles within each time step, and the intensity of interface compression. This configuration follows guidance from the Wolf Dynamics OpenFOAM guiding materials [
42], which recommend 3 or more alpha corrections for highly transient flow, high-Reynolds-number, or high-CFL-number flows, as well as using 2 or more sub-cycles when applying explicit MULES. In addition, interface sharpening was enhanced by activating the term div(phirb, alpha), which improves the capture of steep wave fronts, particularly in strongly non-linear and breaking wave scenarios [
42].
2.3.6. Turbulence Modeling
Turbulence modeling is adapted to the wave regime: for non-breaking waves, a laminar flow assumption is applied, while for breaking or post-breaking conditions, a RANS approach with a standard turbulence closure is used. This combined approach ensures adequate resolution of wave dynamics while keeping the simulations efficient in both regular and highly non-linear wave conditions.
2.4. Post-Processing Strategy for Free Surface Elevation
To verify the accuracy of wave generation and ensure consistency with target wave conditions, a post-processing approach was implemented to extract and analyze the free surface elevation from the numerical domain.
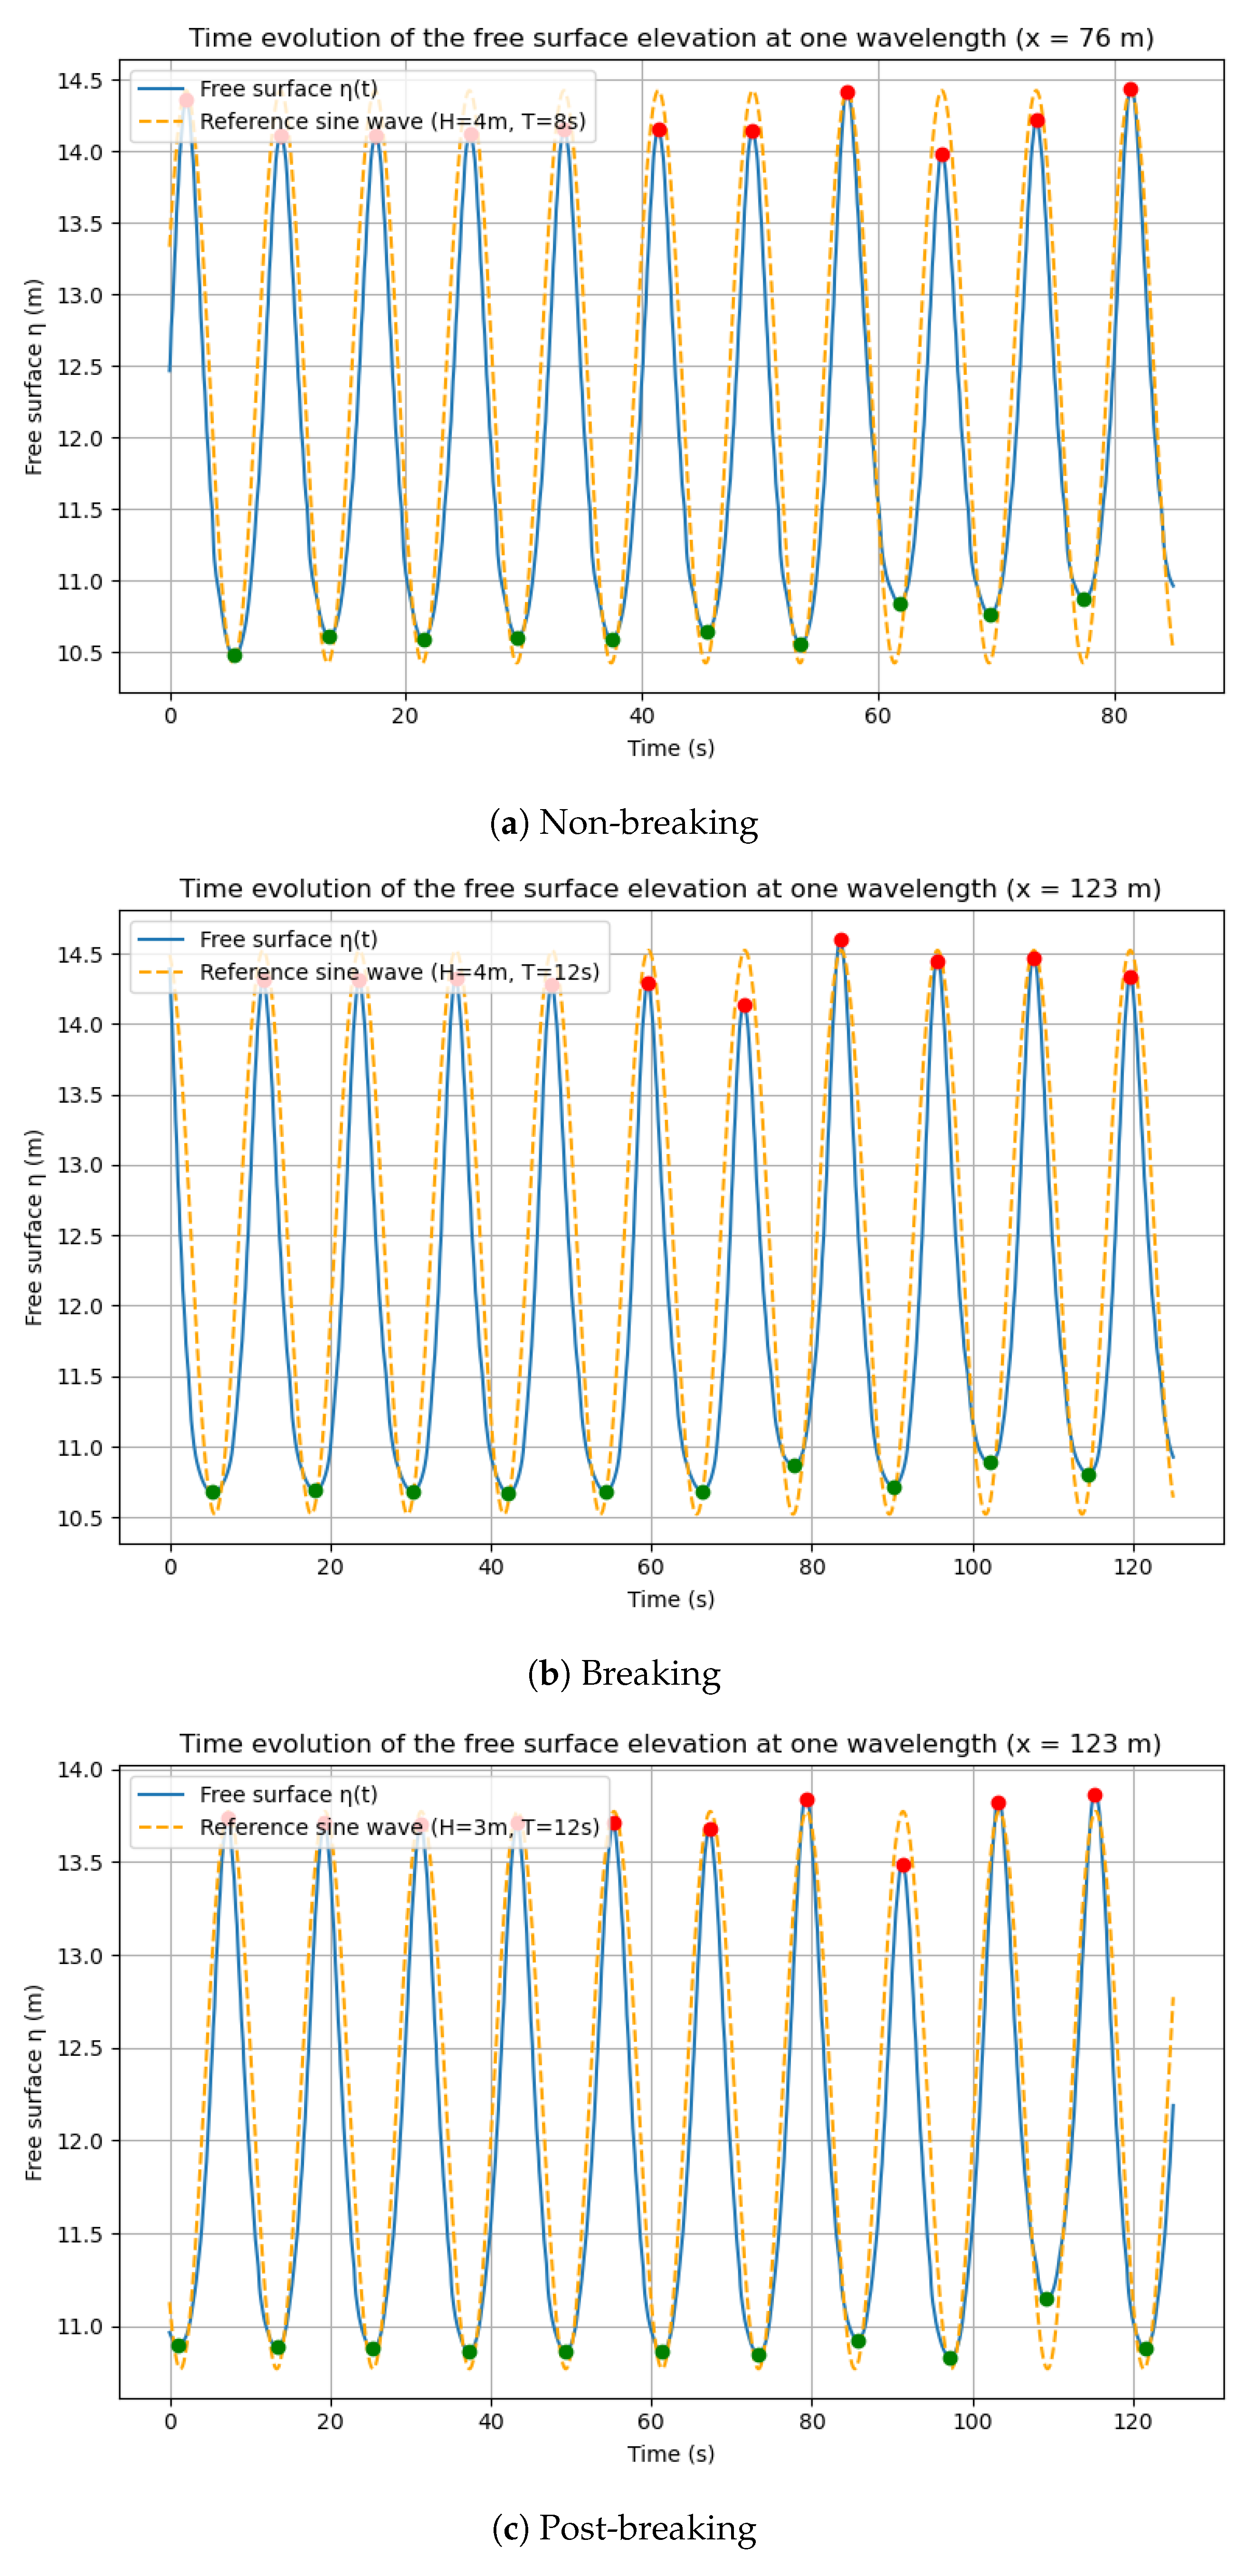
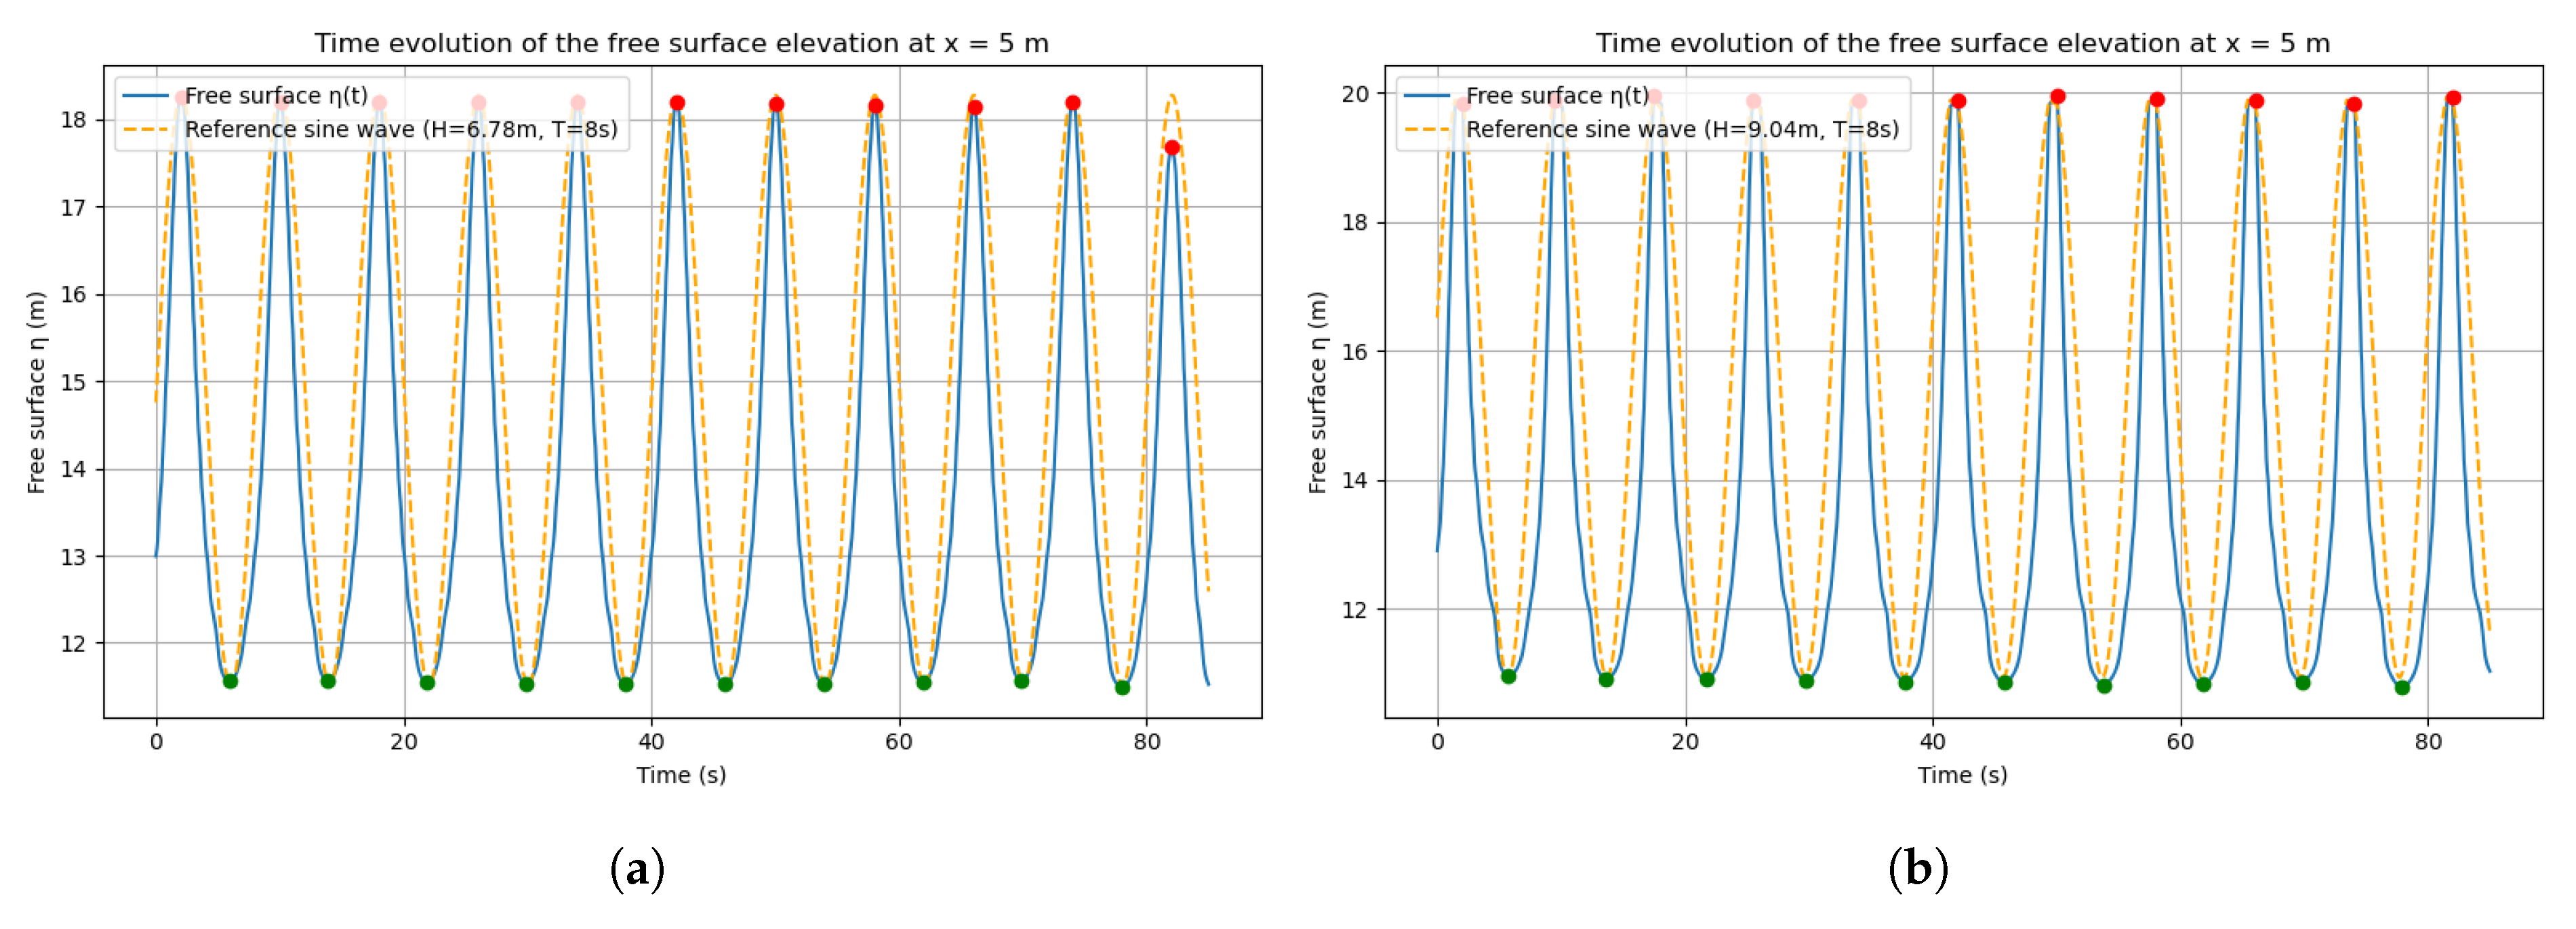
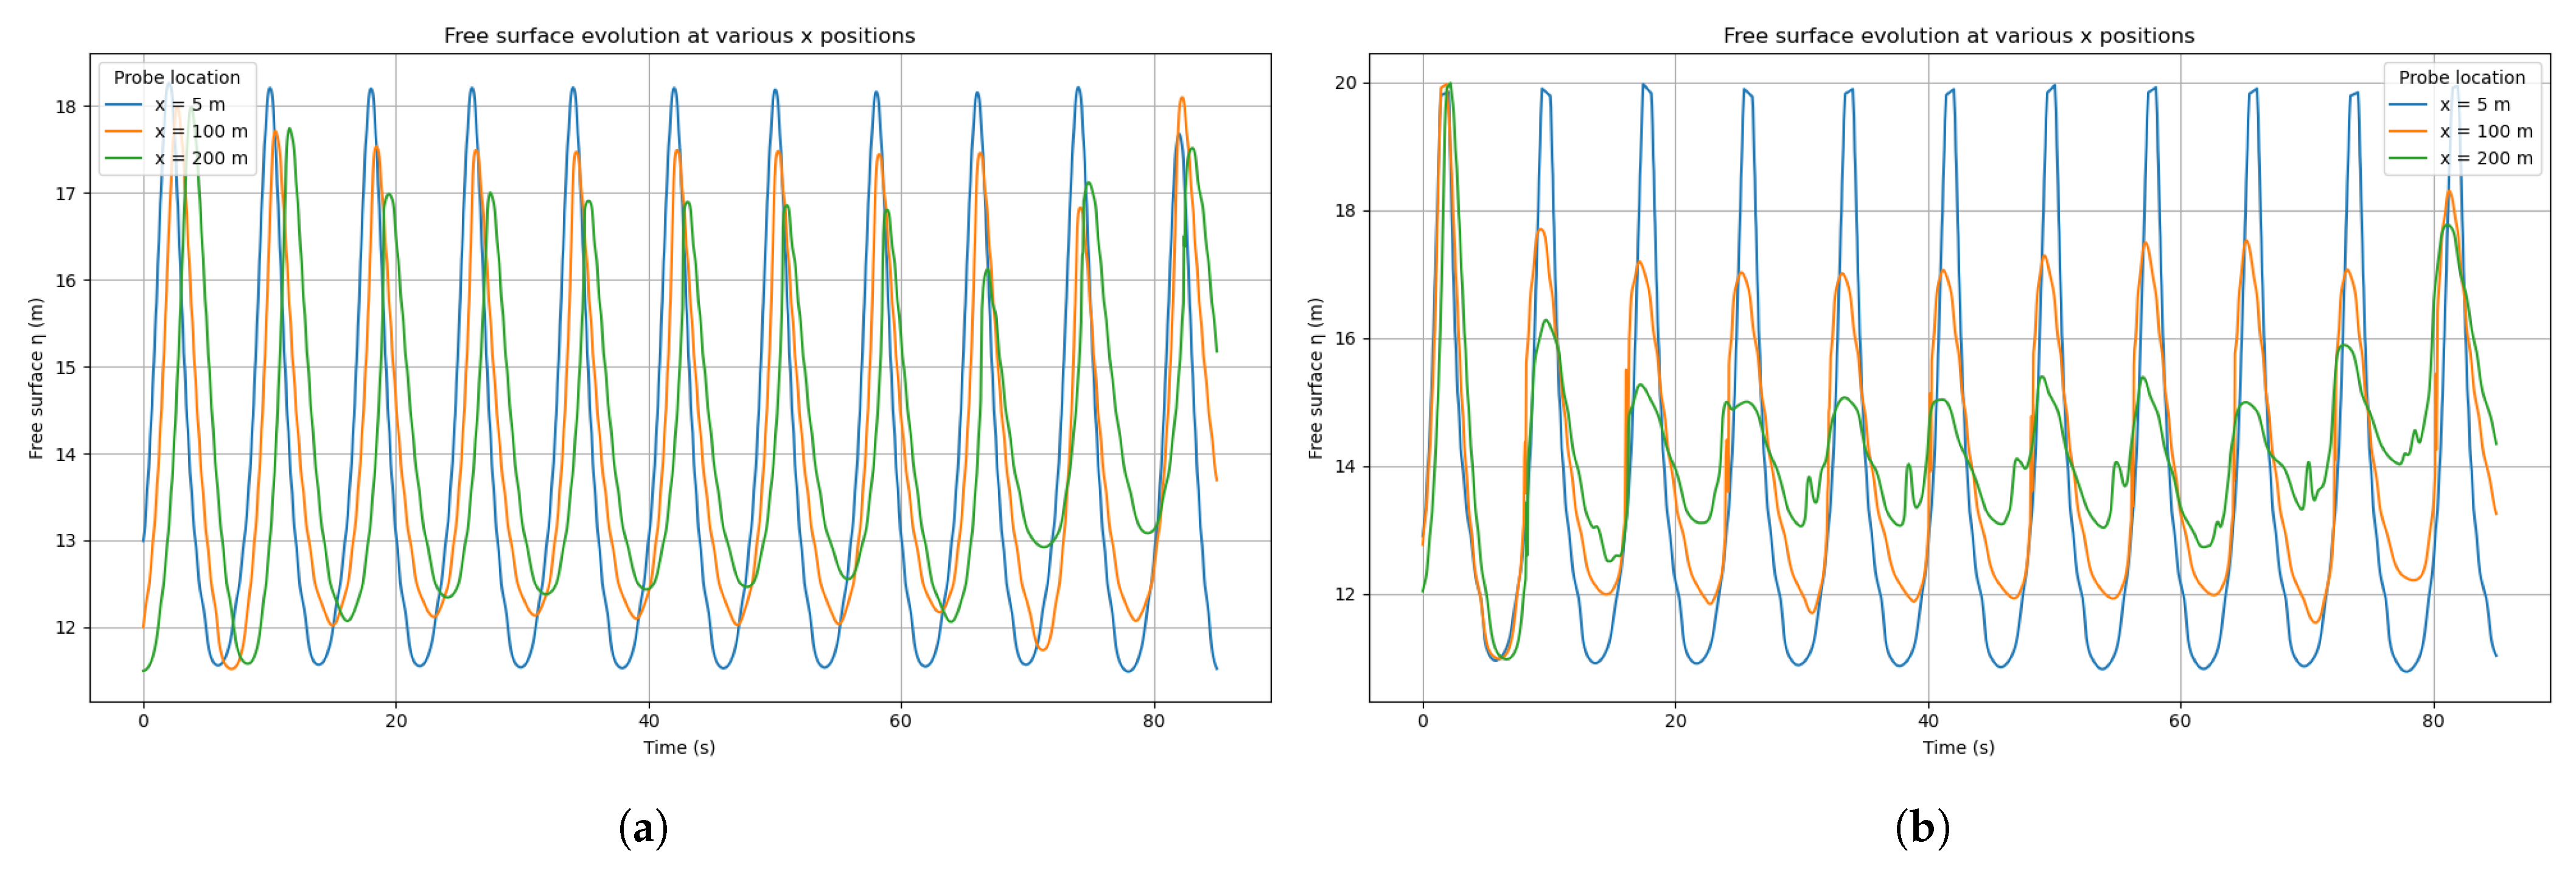
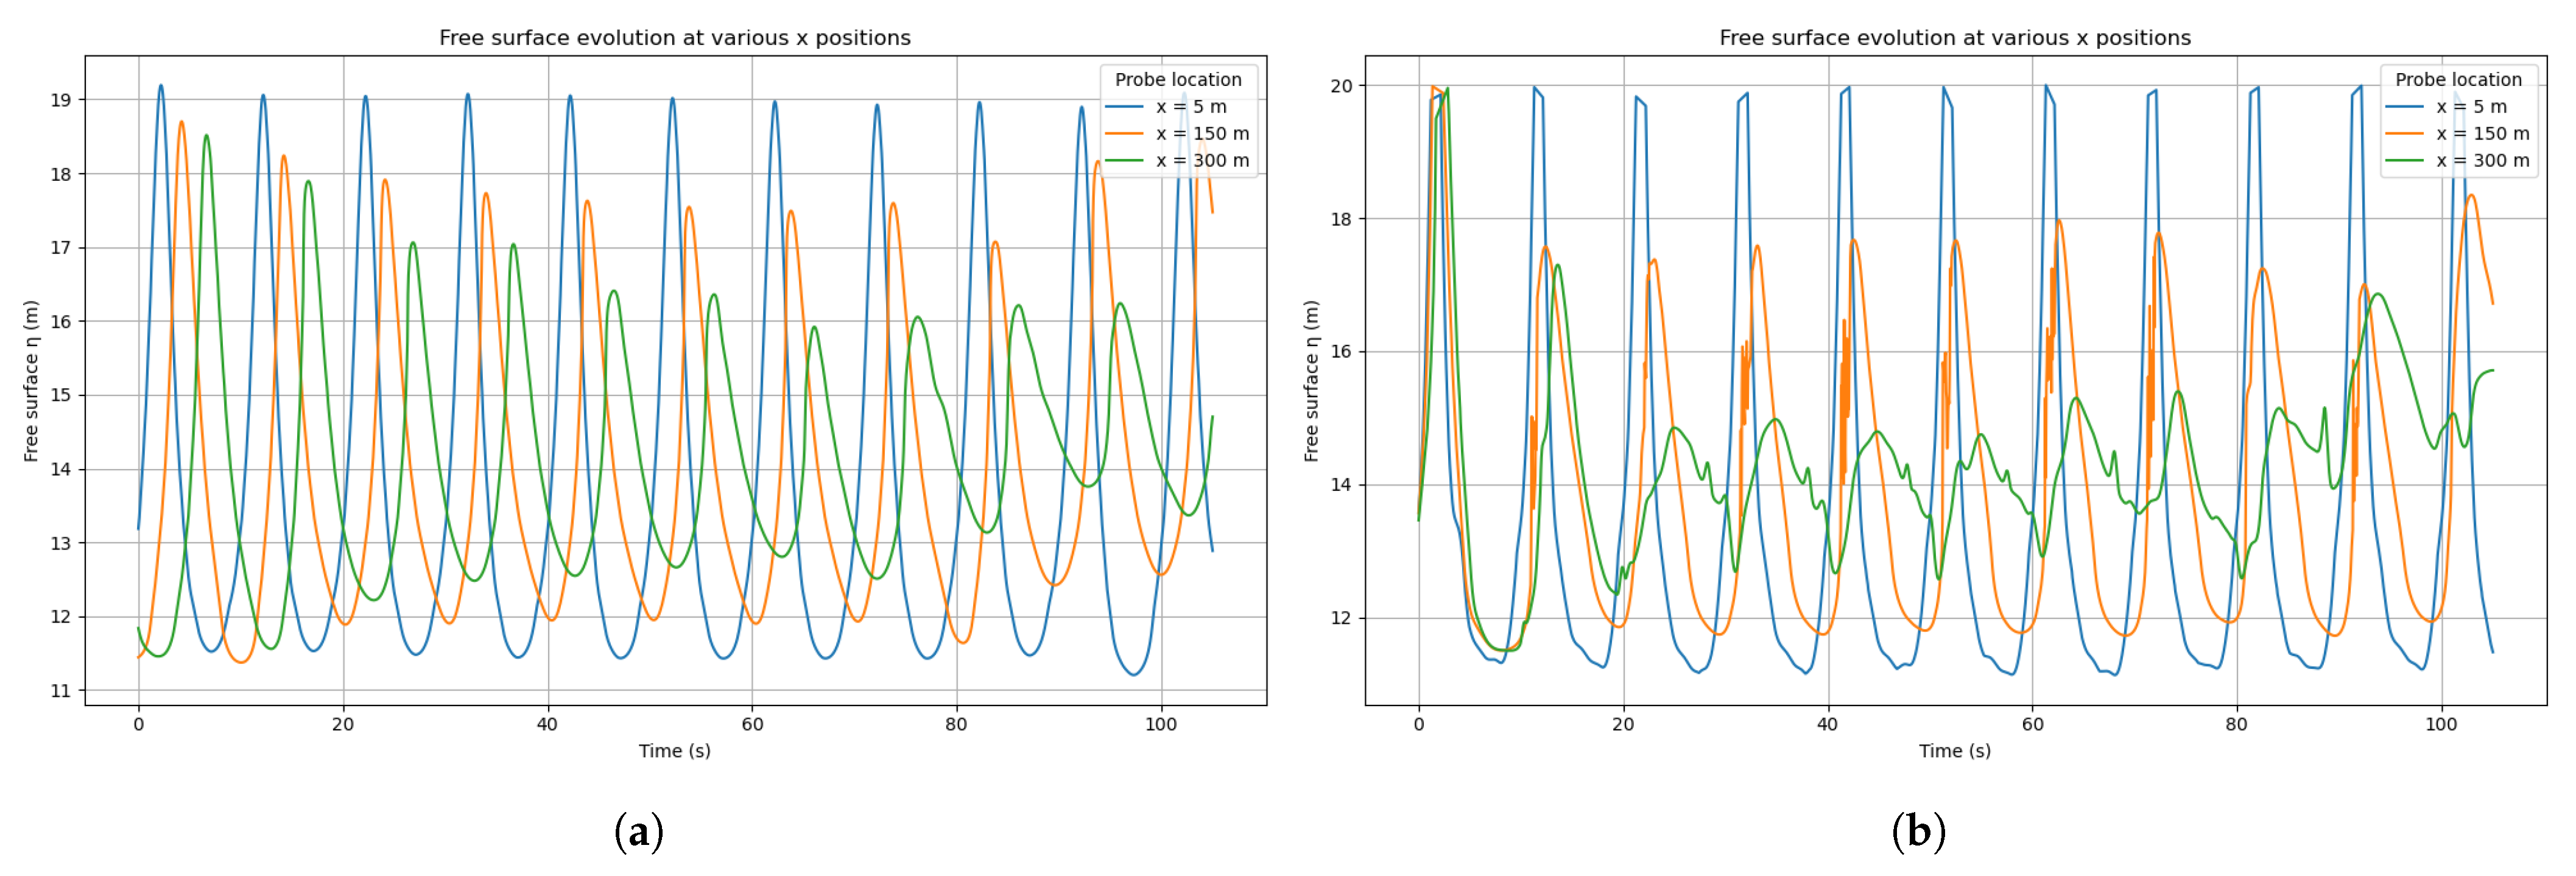
Measurements were performed at multiple probe locations spaced every 25 m along the wave propagation direction, starting from x = 25 m. These locations covered the first three wavelengths of the domain. To ensure that the wave field remained unaffected, the floater was intentionally excluded from the simulation during this validation phase.
At each probe point, the free surface elevation was reconstructed from the multiphase VOF field by identifying the vertical position where the phase fraction , corresponding to the air–water interface. When this threshold was crossed between adjacent cells, a linear interpolation was used to estimate the interface position.
Each simulation ran for a little over 10 wave periods, ensuring that a sufficient number of waves were available for the analysis. The surface elevation signal was then post-processed using a Python (v3.10) script to detect wave crests and troughs and estimate individual wave heights and periods.
Since experimental data of the free surface were not available, a theoretical sinusoidal wave profile was constructed as a reference for validation, using the wave input parameters defined in the waveDict file, notably the target period and amplitude. The relative errors on wave height and period can be computed using Equation (
4).
where the measured value is the OpenFOAM simulated wave height/period and the reference value is the target sinusoidal input value. The comparison was intended to validate the consistency of the wave generation system with its own configuration rather than against experimental measurements.
2.5. Hydrodynamic Force Extraction and Analysis
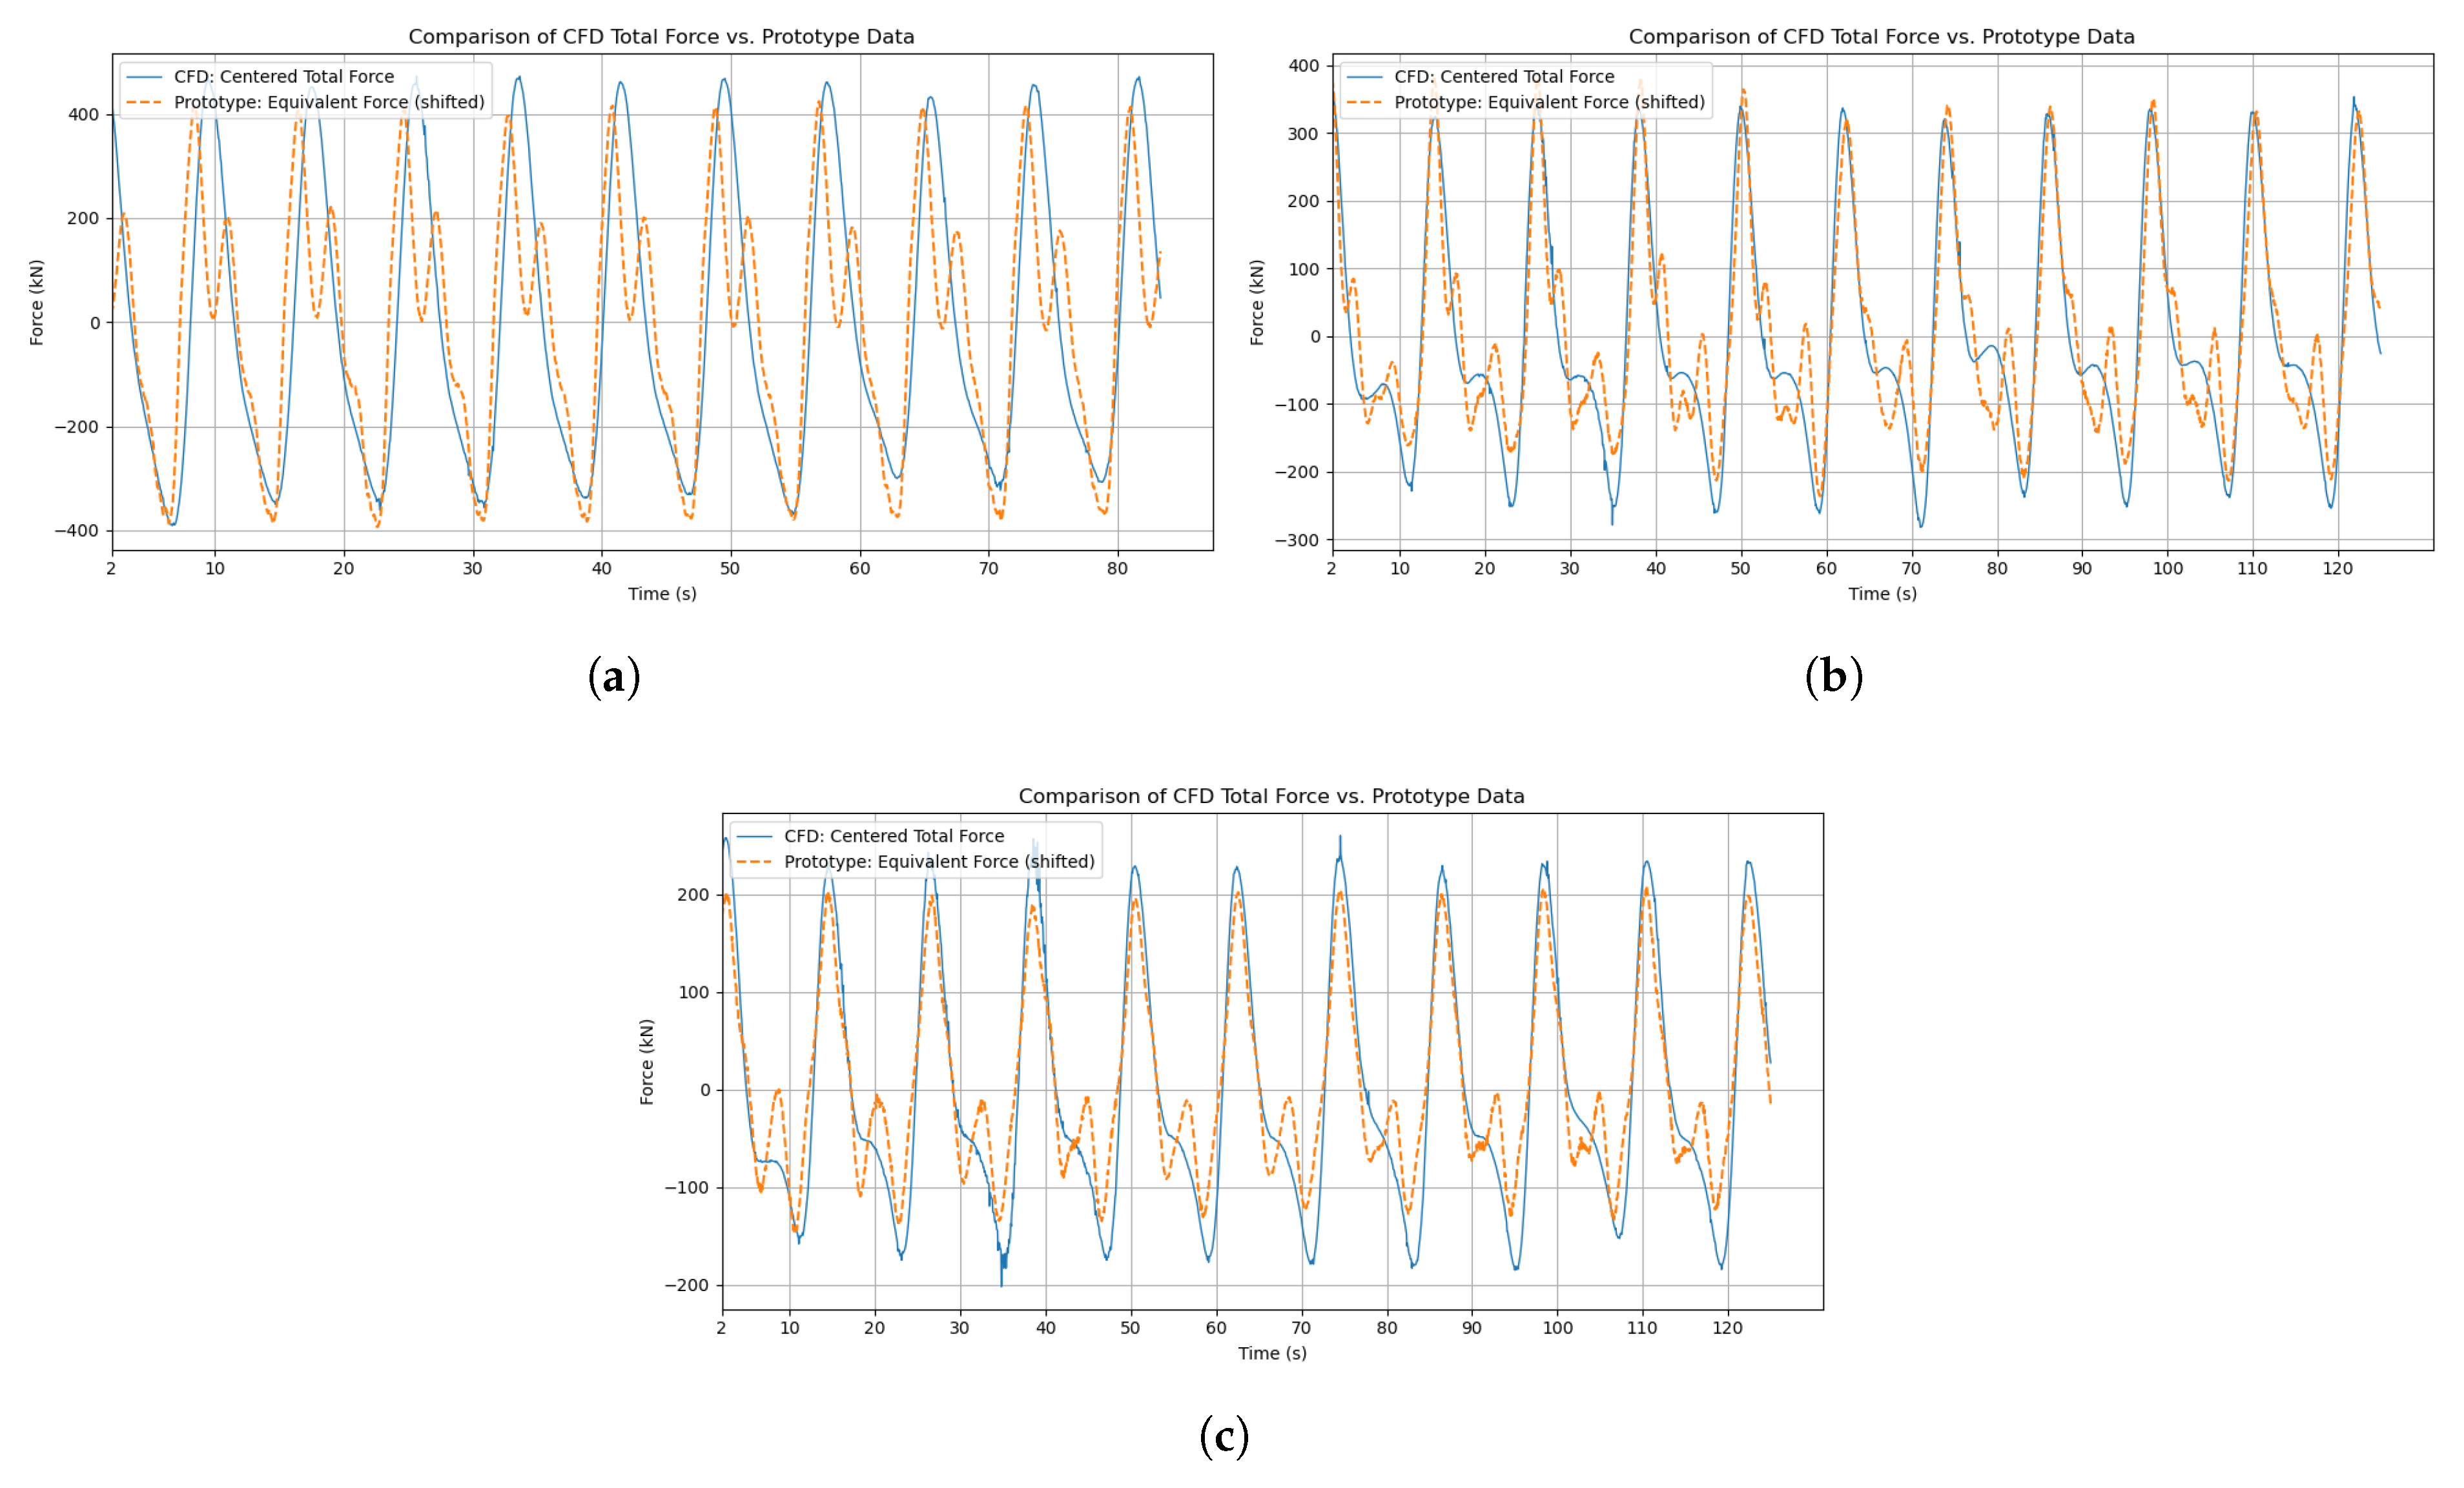
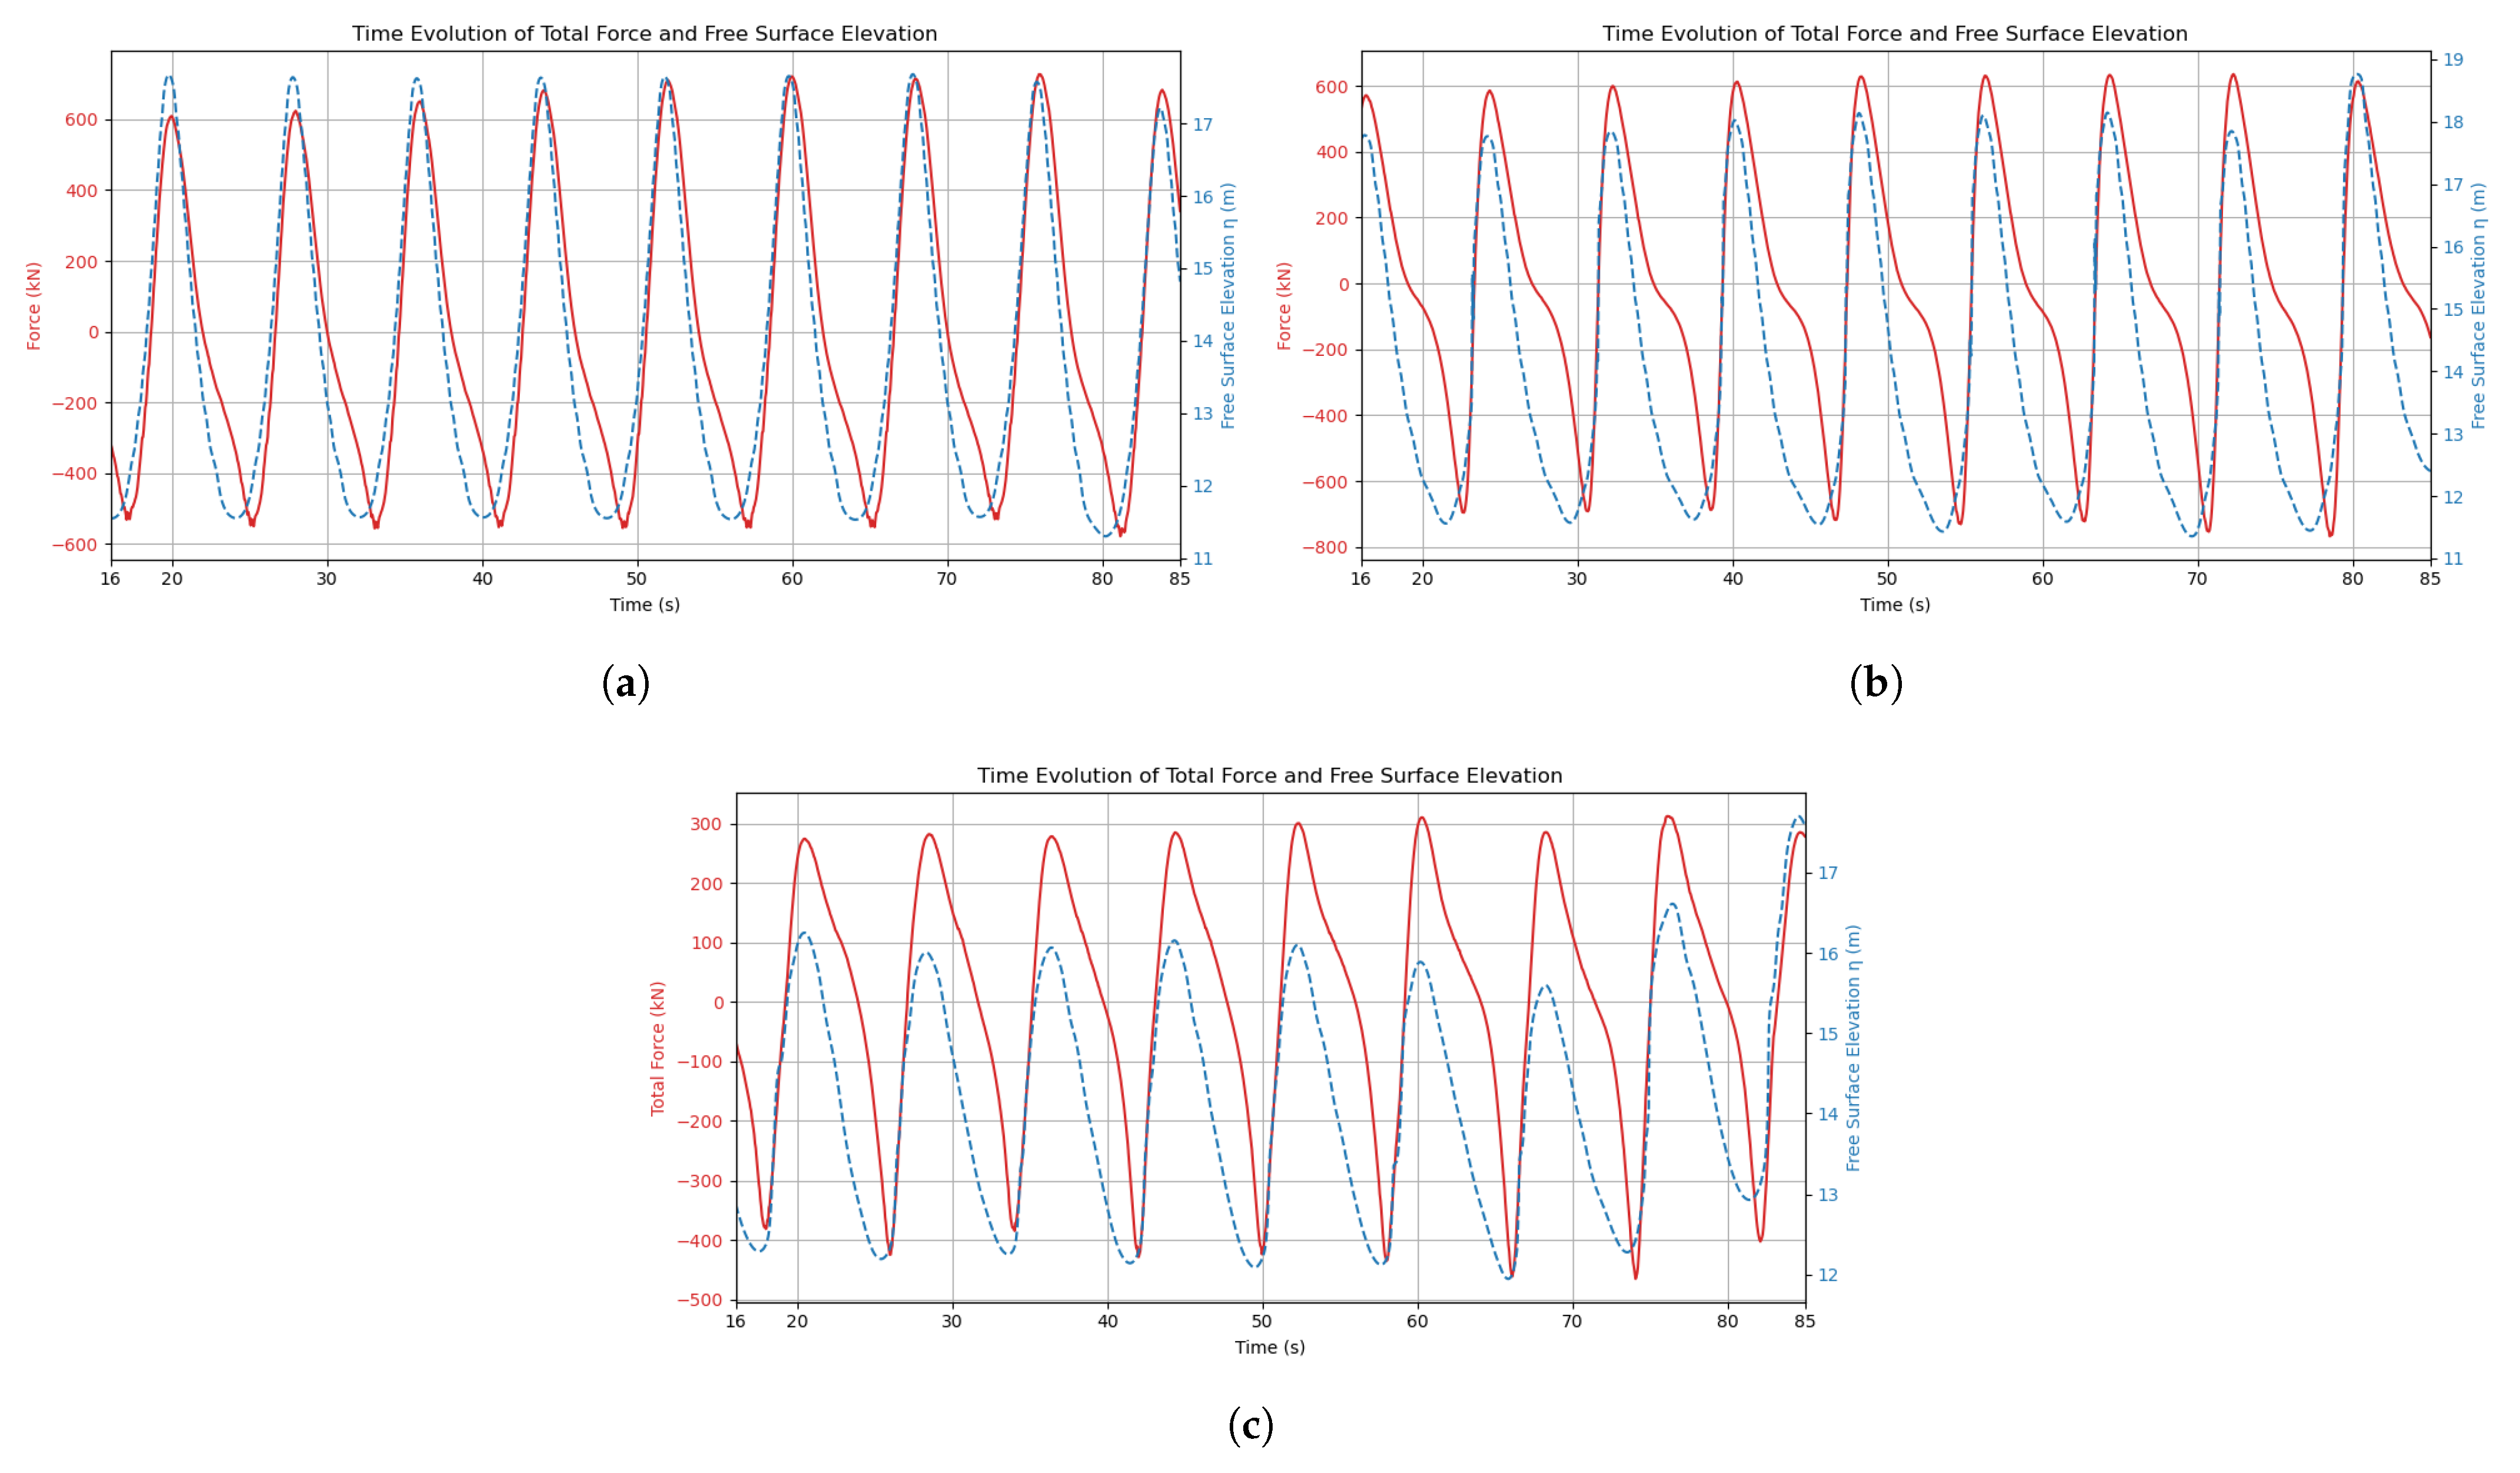
In order to complement the free surface elevation analysis and further validate the numerical model, a dedicated post-processing approach was implemented to evaluate the hydrodynamic forces exerted by waves on the floater.
To carry out this part of the validation, the total wave-induced forces acting on the floater were monitored and analyzed. Specifically, the focus was placed on the horizontal (Fx) and vertical (Fz) components of the global hydrodynamic force, which are directly relevant for evaluating the structural loading in survival conditions.
The force signals were extracted using OpenFOAM’s built-in post-processing utilities. In particular, the forces function object was employed to compute both pressure and viscous contributions over the entire surface of the floater. This method relies on the integration of the surface stress tensor over the patch corresponding to the floater surface.
Force data were sampled throughout the simulation with a temporal resolution of 0.05 s (20 Hz), providing sufficient resolution to capture the full temporal evolution of the load signals. The resulting time series Ftotal reflects the dynamic interaction between the incoming wave field and the structure, including all non-linearities due to wave steepness, viscous effects, and, where relevant, wave breaking.
As in the free surface elevation validation, simulations were run for more than 10 wave periods to ensure statistical convergence and robustness of the results. The obtained force histories were then post-processed using a Python script to extract key statistical indicators (mean, maxima, error assessment) and enable direct comparison with experimental measurements when needed.
2.6. Miche Criterion for Extreme Waves
This study aims to study the highest breaking and non-breaking waves at a water depth of 13.89 m (depth at location 41.178303° N, −8.71047° W). To carry out the analysis, the modified Miche criterion was used to determine the limiting wave conditions and distinguish between waves that break and those that do not. This criterion offers a theoretical estimation of the maximum wave height before breaking, taking into account both wave steepness and water depth, as shown in Equation (
5) [
49].
The Miche criterion is widely used in coastal and ocean engineering due to its simplicity and relevance, especially in intermediate water depths where both depth-induced and steepness-induced breaking can occur [
50]. Compared to its original form, the modified criterion offers better accuracy in practical applications, making it more suitable for realistic CFD simulations. Because of its ability to define a theoretical upper limit for wave height before breaking, it is particularly useful for establishing reference conditions for numerical simulations.
In the simulations, the breaking waves were modeled using a wave height input equal to 1.1 × Hmax given by the modified Miche criterion, not because a wave can stably exceed this limit in practice, but to intentionally surpass the theoretical breaking threshold and ensure that breaking would occur within the computational domain. For the non-breaking waves, a height of 0.75 × Hmax was selected, as heights as high as 0.8 × Hmax still led to marginal breaking.
The premature wave breaking, even below the theoretical threshold, may occur by several factors. First, the modified Miche criterion offers an idealized estimate of the breaking limit without considering transient effects, turbulence, or energy dissipation. As a result, it may fail to accurately predict the onset of breaking under realistic, non-ideal conditions involving shear effects or reflections. Additionally, numerical instabilities or slight overshoots in wave amplitude caused by the generator can trigger marginal breaking. Numerical dissipation, turbulence, and implicit viscosity modeled within OpenFOAM’s RANS or VOF frameworks may further destabilize the wave prematurely. Mismatches in the velocity field phase can also promote crest overturning. These factors highlight the challenges of accurately capturing wave breaking in CFD and emphasize the importance of carefully configuring the simulation setup.
2.7. Previous Experiment
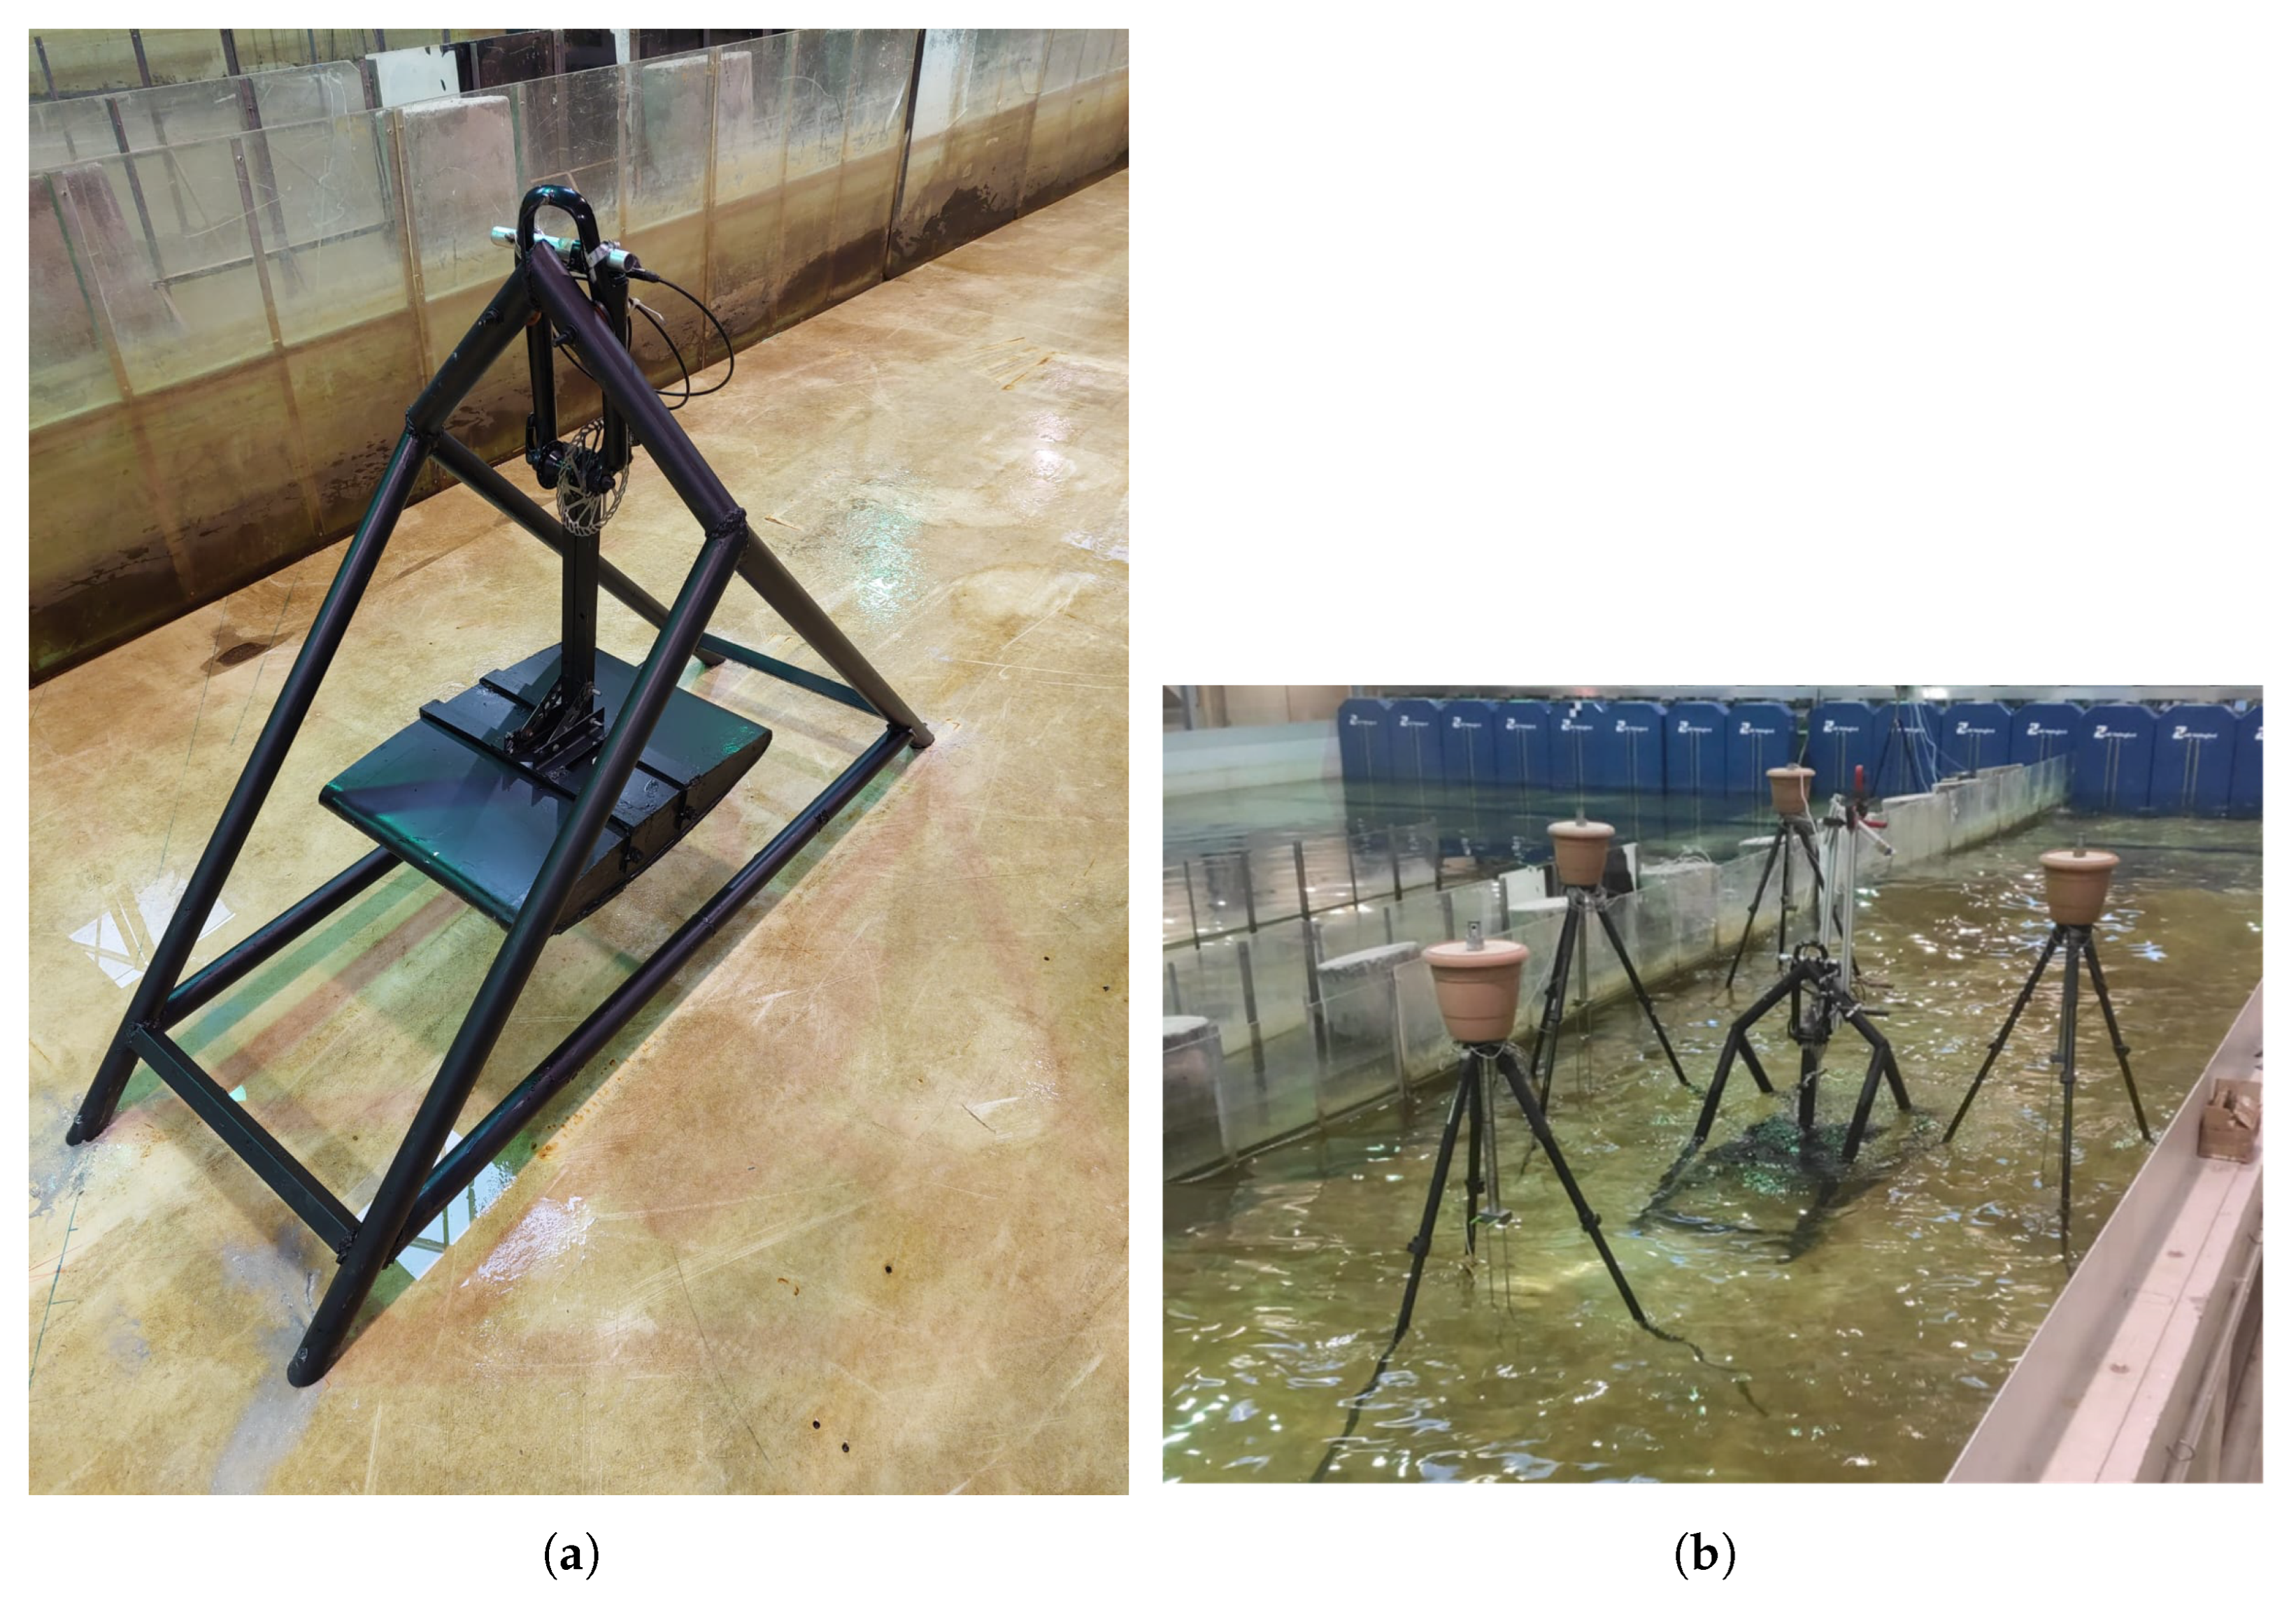
A physical modeling campaign was conducted at FEUP’s Hydraulics Laboratory in the 28 m × 12 m × 1.2 m ocean basin. The experiments used the four-paddle feature of the wavemaker system (tests’ channel width ≈ 3.07 m) and a still water depth of h = 0.6 m. A simplified 1:20 scale PWEC physical model (shown in
Figure 6a,b) under Froude similitude was used, following established scaling and experimental recommendations [
51]. This experiment aimed to validate the concept and quantify loads in three configurations: operational (moving), standard locked, and a passive duck diving survival mode. The floor-anchored model was built from a welded steel frame with a bicycle fork pivot and a hydraulic disc brake to emulate a tunable PTO, which was calibrated by dry oscillation tests.
The PWEC model was positioned along the central axis of the basin, providing a symmetric lateral clearance of approximately 1.54 m from each sidewall to minimize wall effects. Longitudinally, the center of the model was located about 2.50 m from the dissipative beach (upstream) and 2.00 m from the wave maker (downstream). This placement was selected to reduce both lateral and end reflections, ensuring a quasi-two-dimensional incident wave field in the interaction zone with the PWEC.
The instrumentation included four resistive wave probes for free-surface elevation measurement (sampling frequency 128 Hz; accuracy ±1 mm), an optical motion-capture system with three Qualisys IR cameras (sub-millimetric precision, 200 Hz), and, in survival tests, a horizontal load cell mounted out of the water to improve signal quality (capacity 10 kg; resolution 0.01 N). Operating condition control methods involved calibration of the PTO damping through dry oscillation tests, the continuous monitoring of wave probe baselines, and motion tracking synchronization with wave generation signals. All instruments were periodically calibrated according to the manufacturers’ guidelines [
36].
Tests under regular waves (T = 8–16 s; H = 4 m at full scale) and irregular waves (Tp = 10–18 s; Hs = 4 m) showed good repeatability (RAO variability < 10%) and confirmed the effectiveness of the passive duck diving survival mode with reductions in horizontal load of up to ≈65% compared to operational functioning (≈40% vs. the standard position). For the scope of the present study, a set of regular tests results, of such an experimental campaign relative to the passive duck diving survival mode configuration, is considered for validation purposes. These experimental results provide the basis for validating the OpenFOAM/olaFlow CFD simulations presented in this paper.
To enhance the reliability of the dataset, an uncertainty analysis was performed considering sensor resolution, calibration drift, repeatability of trials, and wave maker control accuracy. Following standard procedures for hydrodynamic experiments, the combined expanded uncertainty for free-surface elevation was estimated at
, while motion-capture displacement errors remained below
mm. Load cell measurements showed an uncertainty of
under dynamic conditions [
36]. These quantified uncertainties are reported to strengthen the validation of the numerical simulations.
2.8. Test Matrix
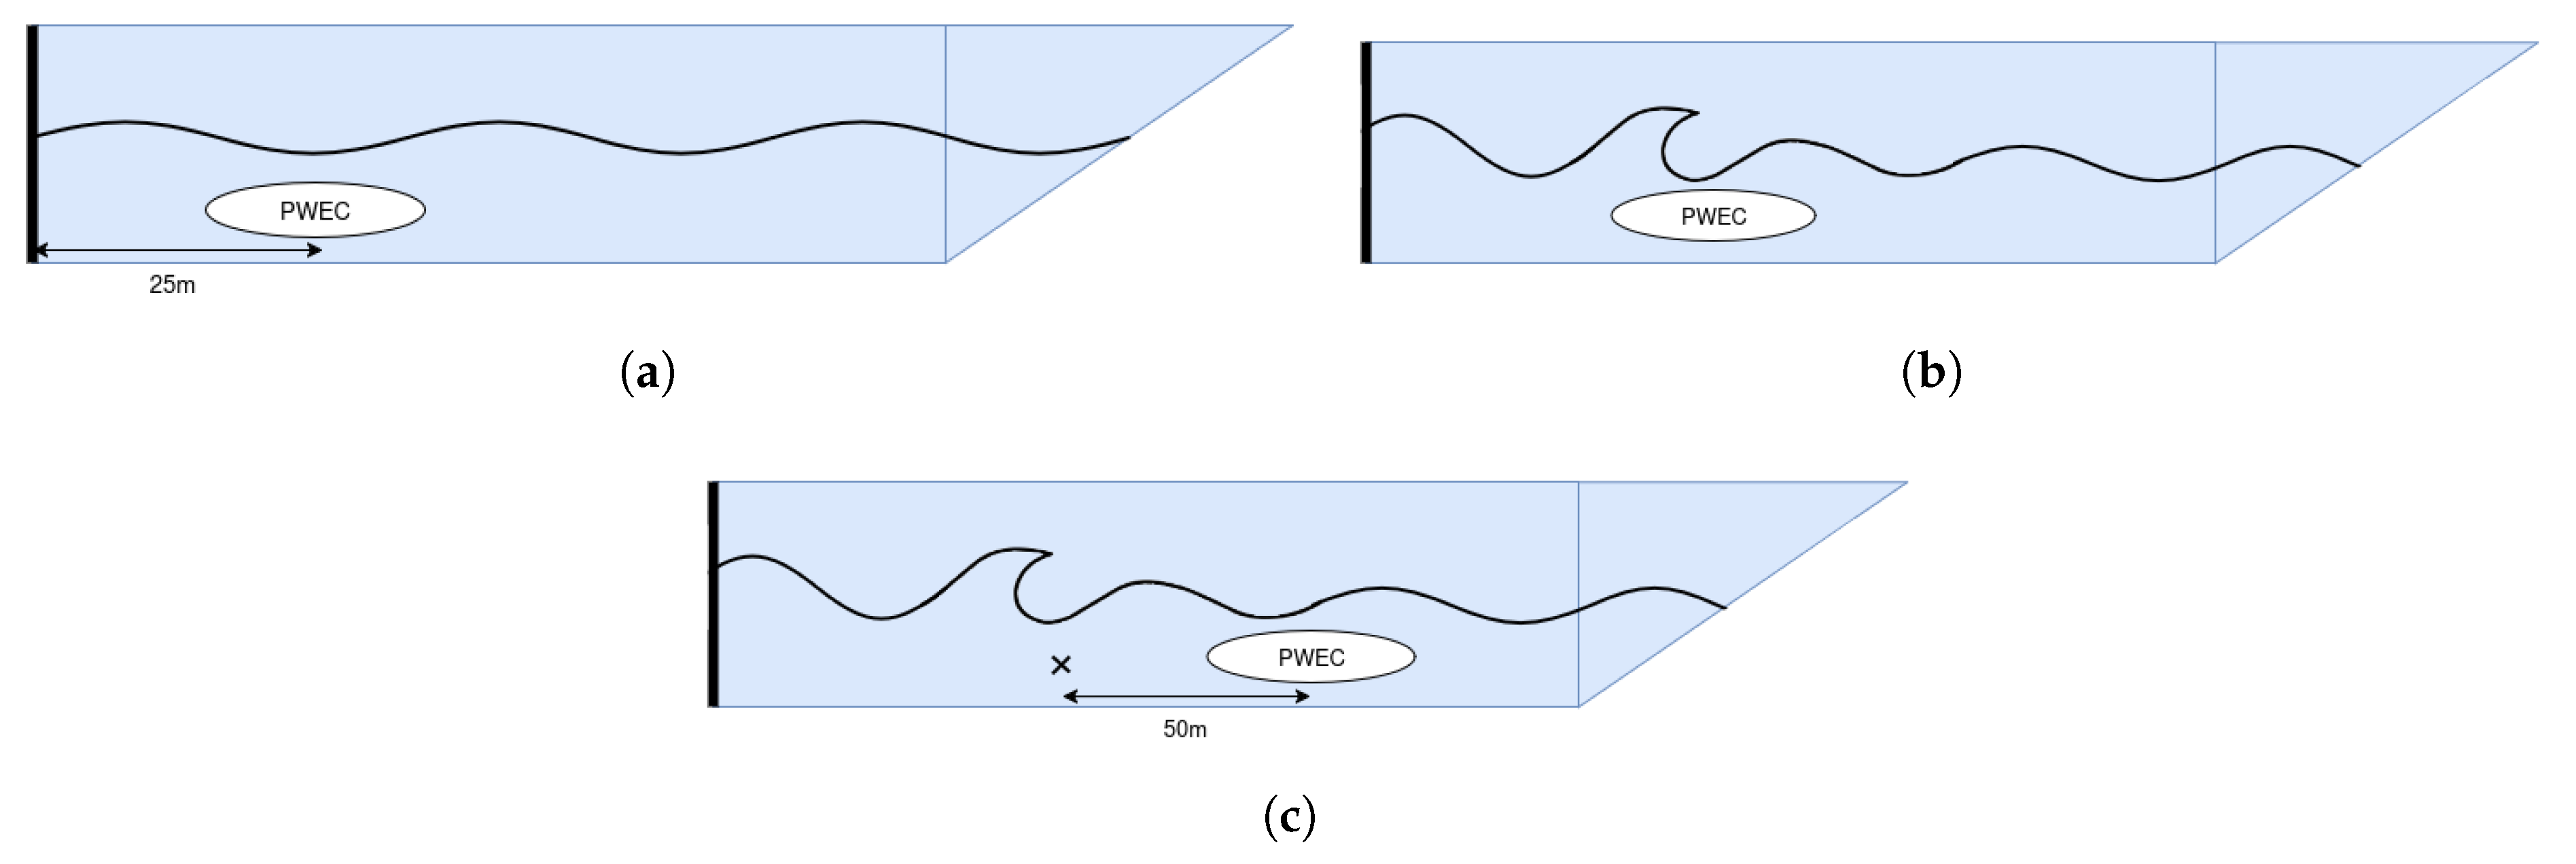
The numerical study involves two parts: regular wave validation with three cases and extreme wave tests using two wave periods (T = 8 s and T = 10 s), as shown in
Table 3. For the extreme wave campaign, two regimes were simulated per period: non-breaking at 0.75 ×
and breaking at 1.10 ×
. Wave loads were extracted at three floater positions: a non-breaking location (near the inlet), the breaking point, and a post-breaking location downstream.
4. Conclusions
This study presents, for the first time, a CFD assessment of a pivotal, single-pin wave energy converter operating in a passive duck diving survival modee, coupling RANS–VOF simulations in OpenFOAM/olaFlow with 1:20 scale basin tests. Across the study, the simulated wave field matches the target kinematics with a mean wave-height error of 5.13% and period errors below 0.75%. The model predicts global loads with RMSE values below 20% of peak values and values up to 0.80.
The results in this study underscore that accurately representing wave kinematics is essential for predicting hydrodynamic loads: load accuracy closely tracks wave-height fidelity, and a one-percentage-point reduction in height error typically lowers the global-force RMSE by about 40–50%. Accuracy degrades as waves become steeper due to crest smoothing from the mesh and limitations in the turbulence and structural modeling. Within the tested envelope ( m, T = 8–12 s, depth = 12 m), the framework delivers reliable load estimates suitable for early-stage design.
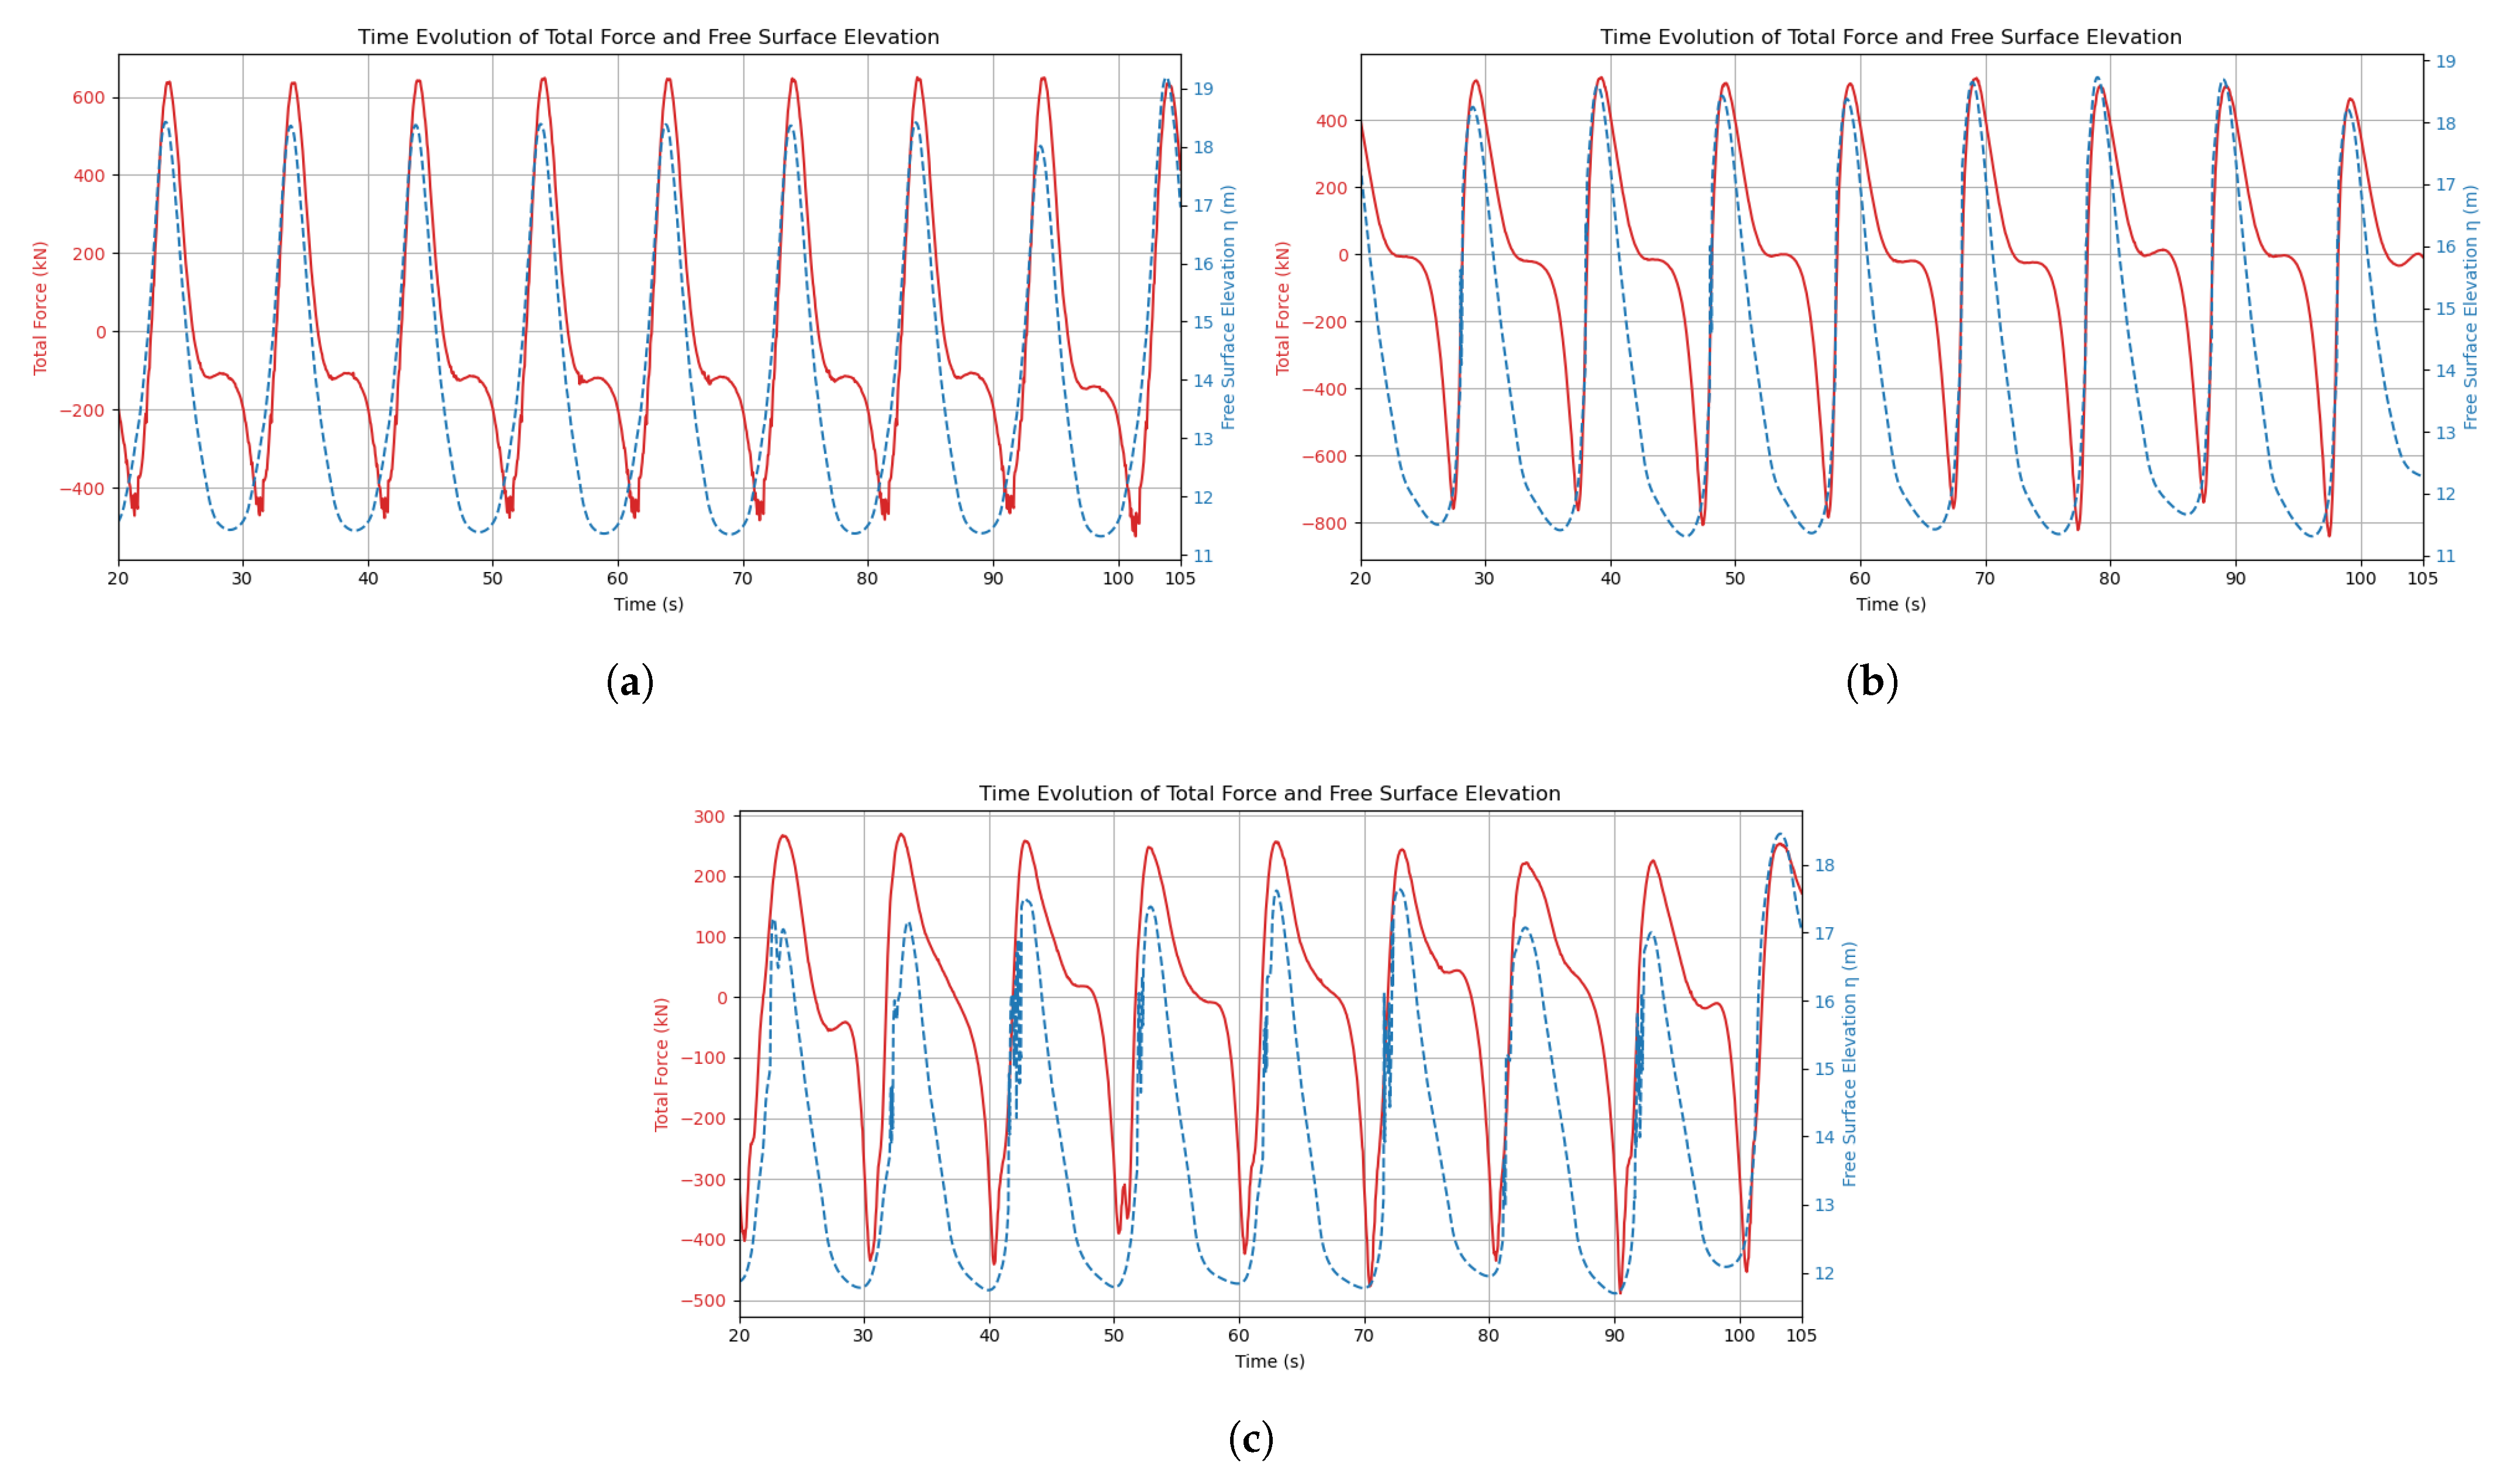
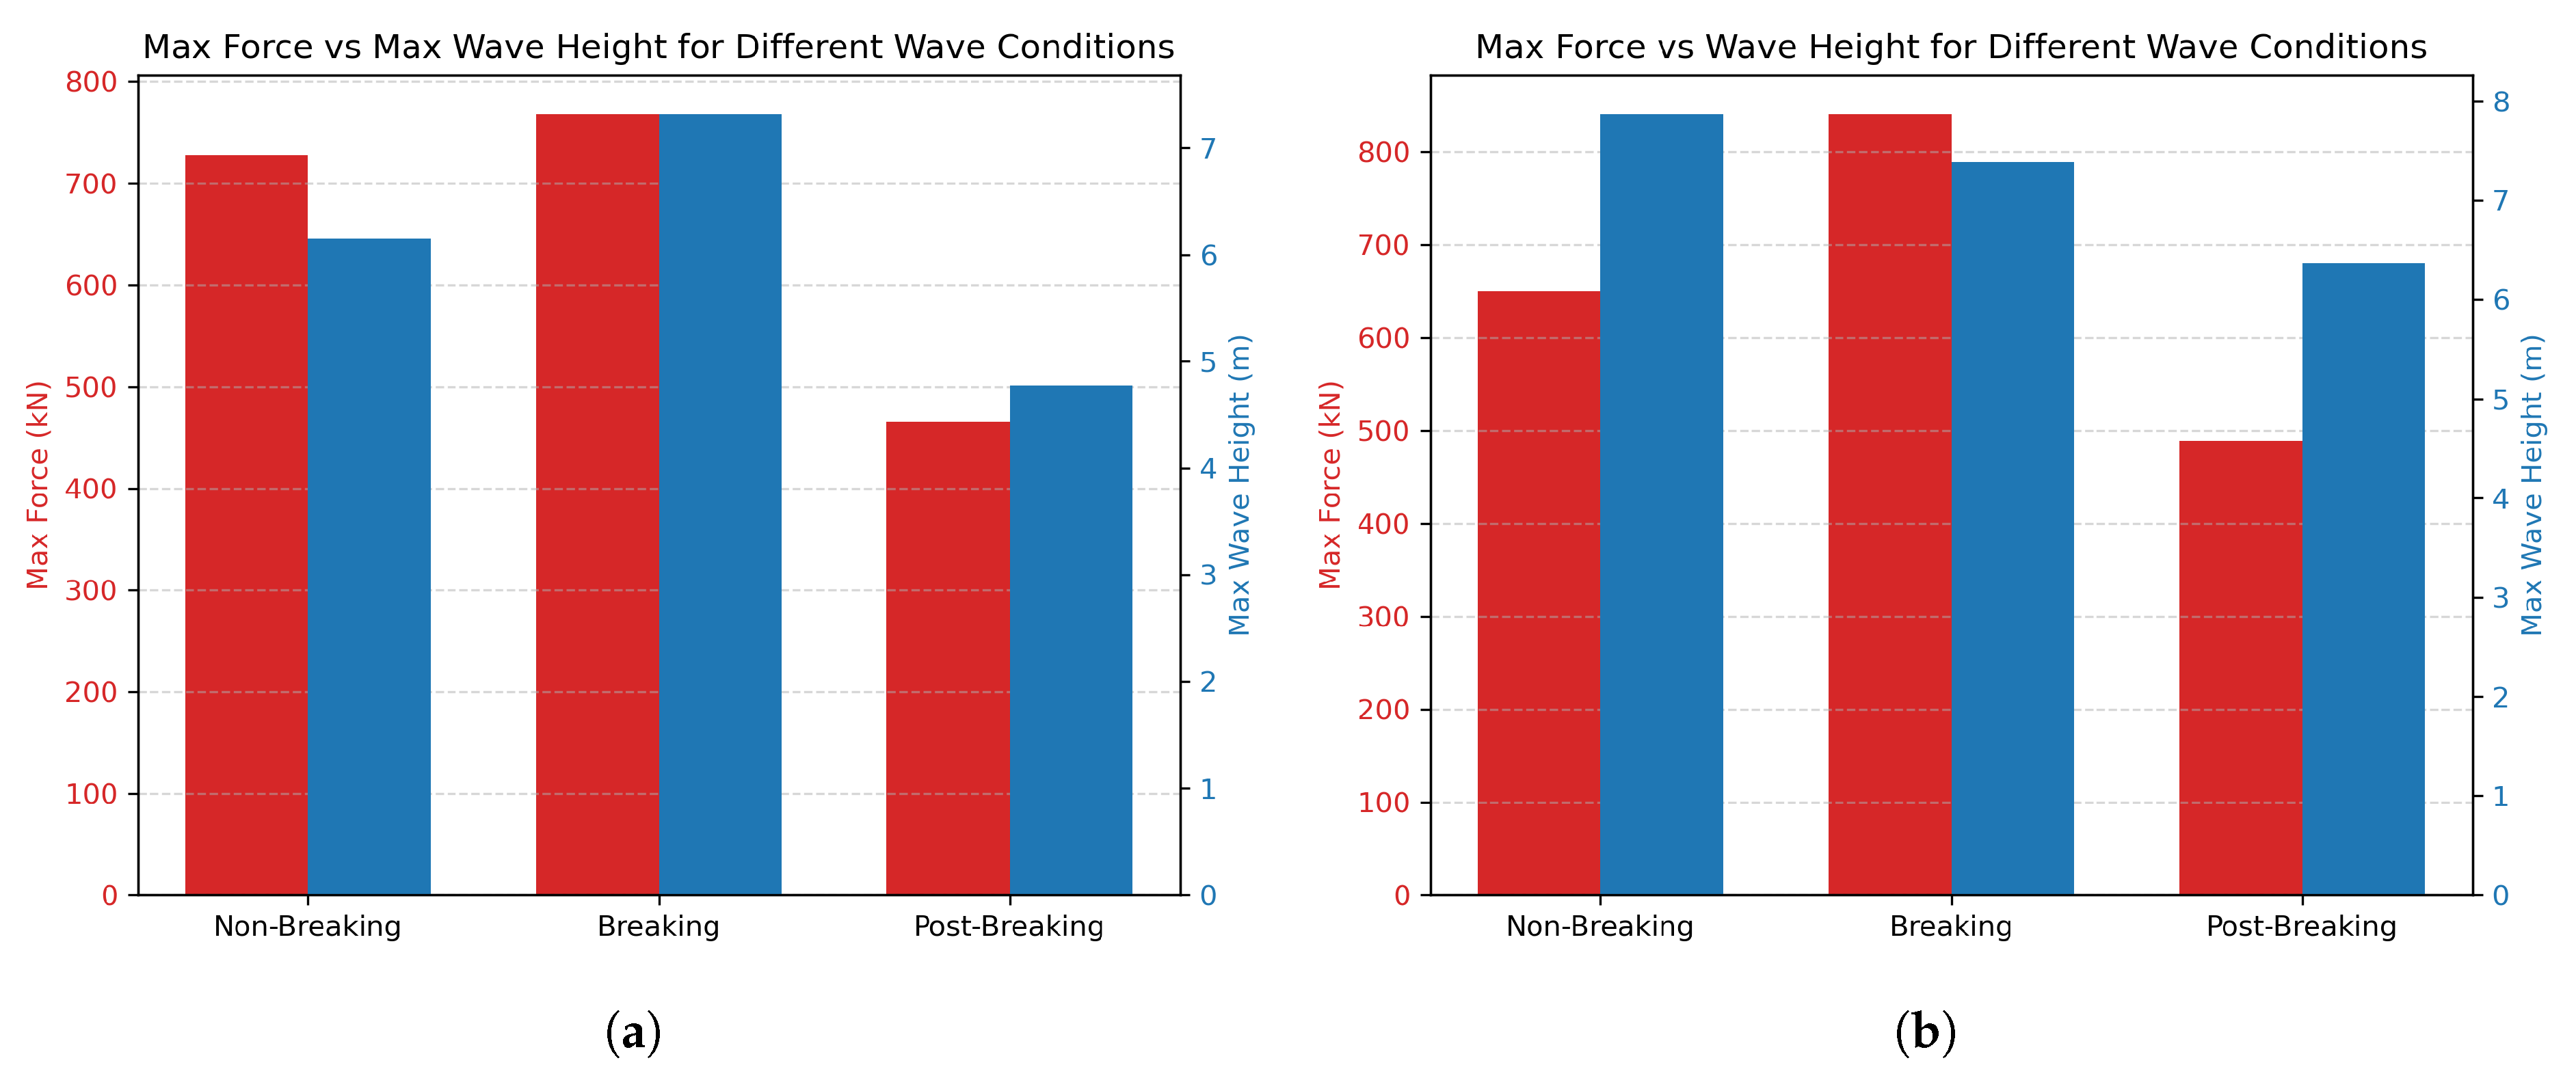
Major findings show that plunging breaker impacts govern survivability. Compared to the highest non-breaking crests, breaking waves increase peak loads by 6% to 29%, even when their crest heights are lower. This highlights that the impact mechanism, rather than wave height alone, is the main driver of load amplification. Among the two breaking wave cases, both exhibit similar peak loads and crest heights at impact, yet their post-impact evolution differs considerably with amplitude losses over 50 m of 35% for one and only 13% for the other. Despite this difference in wave decay, both cases show a similar reduction in load of around 40% to 50% at 50 m downstream, reinforcing the idea that the energy dissipated during breaking, rather than the wave height itself, governs the spatial evolution of impact loads.
Extreme cases were selected using a 100-year return analysis for Matosinhos and a modified Miche criterion, reinforcing relevance to site-specific design. Overall, the validated CFD–experiment framework provides reliable survival-load predictions for the PWEC and supports the effectiveness of its passive duck diving survival mode configuration, demonstrating its structural resilience under extreme wave conditions.
Beyond the hydrodynamic performance demonstrated in this study, the passive duck diving survival mode also carries important implications for the LCOE. The high LCOE of wave energy systems is strongly driven by CAPEX, which is largely inflated by the need to over-dimension structures to withstand extreme loads. By reducing peak forces by up to 65% in survival conditions, the PWEC enables designers to safely lower structural safety margins, limiting material requirements and simplifying support infrastructure. As a result, the design leads to lighter and more modular structures, shorter installation times, reduced transport expenses, and improved maintainability, all of which contribute to lowering the LCOE. Moreover, this highlights the value of survival mode: instead of relying only on structural strength, the device adapts intelligently to the environment, combining resilience with economic competitiveness.
Despite the model’s accuracy, several limitations affect its capacity. The 1:20 scale respects Froude but not Reynolds similarity, potentially not well representing viscous and air–water effects for extreme wave tests. The VOF method can overly smooth fragmented flows, underestimating slamming pressures. Tests were limited to unidirectional waves, excluding off-axis loads typical of real seas and, finally, the flap was modeled as a fixed rigid body, neglecting potential motions due to structural flexibility or imperfect locking.
Beyond these modeling constraints, the findings also point to the need for complementary investigations under operational conditions, where the floater is free to move and interact dynamically with incoming waves. In such scenarios, the PTO system becomes a key factor, as its damping behavior directly influences both energy extraction and hydrodynamic loading. Future campaigns should therefore include tests with a mobile floater, coupled with an actively controlled PTO in order to fully capture the load–motion–energy interactions. This would allow for a more complete evaluation of the system’s performance and durability under realistic sea states, bridging the gap between survival-mode analysis and continuous operation.
