Abstract
The oil content in a produced fluid plays a crucial role in oil production engineering. In this paper, a predictive model for the oil and water proportions in produced fluid was established through nuclear magnetic resonance coupling displacement. This model successfully predicts the oil proportion in the produced fluid from each block within the Gaotaizi oil reservoir of the Songliao Basin and elucidates the reasons for its variation across different blocks. The production of pure oil in a vertical well area was attributed to the reservoir fluid exhibiting high bound water saturation, resulting in oil being the primary movable phase. In the testing and extended areas, variations in oil saturation combined with the pore size distribution governing oil and water occupancy are likely responsible for the differing oil-water ratios observed in the produced fluid. Specifically, a higher oil-to-water ratio (7:3) was produced in the testing area, while the extended area yielded a lower oil-to-water ratio (3:7). Furthermore, the model predicts an oil-to-water ratio of 4:6 for the produced fluid in the Fangxing area. To enhance oil production in the extended area, narrowing the fracture interval is proposed. However, this measure may not prove effective in other blocks.
1. Introduction
In 2024, China’s crude oil output reached 213 million tons. However, the country’s dependence on foreign oil remained high at 71.9%, presenting a challenging energy security situation. To address this, China has established a “Conventional-Unconventional” dual-track strategy and a “Two Deep + Unconventional” (deep earth, deep sea, and unconventional resources) oil and gas development strategy [1,2,3,4]. In recent years, tight oil development has advanced through practices such as horizontal drilling, with productive outcomes observed across multiple oil blocks. However, production performance varies significantly among different tight oil formations. Given the substantial potential of tight oil resources—where development progress remains relatively slow—enhanced evaluation and exploitation efforts are imperative [5].
The water content in the produced liquid, which is included in the basic production data in the development process, plays an important role in oil production engineering, storage and transportation engineering, and the petrochemical industry [6,7,8,9,10,11,12,13,14]. The precise value of water content directly affects many aspects of oilfield production, such as well test production management, crude oil transportation pipelines, multiphase flow measurements, and crude oil analysis systems. Therefore, accurate predictions of the oil content of produced liquids is key to formulating a reasonable exploitation plan and improving the level of development management for oilfields, which is a requirement for the realization of digital and intelligent oilfield management [15,16]. There are two methods to determine the water content in produced liquid: offline and online. Offline measurement methods primarily include distillation [17,18,19], Karl Fischer [20,21], and electrochemical desorption [22]. However, some defects exist in offline measurement methods, such as significant randomness, untimely sampling, poor continuity, high labor intensity, and low degree of automation [23], which make it difficult to meet the requirements of automated oilfield production. Therefore, the online method has gradually replaced the offline method because it is more compatible with the development of oilfields. The online method includes density [24], conductivity [25,26], capacitance [27], radiofrequency, microwave [28], and radiation methods [27]. Although these methods are affected by different factors, they can be used to determine the water content in produced fluids.
The oil and water proportions in oil-produced fluids are related to the following factors: ① the oil and water content in tight reservoirs determining the source basis of the produced fluids and ② the flow capacity of oil and water in tight reservoirs, determining the exploitation difficulty [29]. Item ① depends on the relationship between the source and reservoir during the oil accumulation period, including the charging power, oil amount, and pore throat structure, which ultimately determines the distribution characteristics of the oil and water, such as the saturation and pore size distribution occupied by oil and water [30]. Item ② is controlled by the displacement power, the pore size distribution of oil and water, and the interfacial tension between oil water and rock. Therefore, the oil and water proportions in tight oil-produced fluids are primarily controlled by the reservoir characteristics (porosity and pore structure), oil–water characteristics (oil water saturation and pore size distribution occupied by oil and water), interfacial tension, and external displacement pressure (Figure 1). The greater the charging pressure and the larger better the pore-throat size, the wider the range of pore sizes in the porous medium containing oil and the higher the oil saturation; therefore, more oil and less water is produced (Figure 1a–c). In addition, the wettability also affects the oil-water content in the produced fluid (Figure 1d). Therefore, the microscopic pore structure of tight reservoirs and the content, distribution, and properties of the oil and water are the basis for determining the proportion of oil and water in the produced fluid.
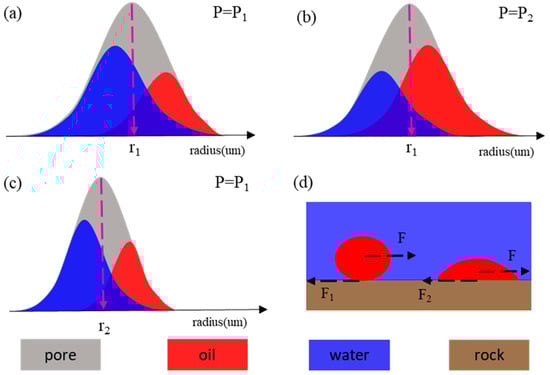
Figure 1.
Schematic diagram of the factors affecting oil and water content in the produced liquid. P is the charging power during the oil accumulation period, P1 < P2; (a,b) represent the difference in the oil and water distribution in the reservoir pore space due to charging power; r is the average pore radius, r1 > r2; (a,c) represent the differences in the pore size distribution of oil and water due to the reservoir pore structure; (d) F is the production pressure, and F1 and F2 are the oil-water interfacial tension, F1 < F2; the more oil–wet the rock, the faster the oil will flow and more oil will be produced.
Numerous measurements have been used to characterize reservoir pore structure. Although each has its scope of application, advantages, and disadvantages, the appropriate technologies can still characterize the pore-throat distribution of reservoirs [31,32,33,34,35,36]. There are three key research methods to determine the oil and water distribution in the reservoir: the indirect, direct, and simulation methods. The indirect method measures the residual oil in the core and estimates the original oil content through after model calibration, including dry distillation [37,38], organic solvent distillation [39,40,41], and ethanol (methanol) extraction [20,21,42]. The direct method can directly obtain the original oil saturation by measuring the oil content in the core that is hermetically sealed after being drilled out from the formation or constructing a geophysical model to predict the oil content [43,44,45,46]. However, these two methods can only obtain the oil content but cannot accurately determine the pore size distribution occupied by oil and water. The nuclear magnetic resonance coupling displacement (NMR-DP) provides a method for simulating the oil saturation and its pore size distribution [47,48].
In recent years, the tight oil of the Gaotaizi reservoir has been developed on a large scale and has made significant contributions to oil production in the Daqing Oilfield. However, in the Longhupao area, even though the same development method has been adopted, the proportions of oil and water in the produced liquid in adjacent blocks vary substantially. Therefore, the objectives of this study are to (1) establish a prediction model for the oil and water proportions in the tight oil-produced fluid and (2) analyze the reasons the oil and water content in the produced fluid vary in the adjacent blocks and provide development advice.
2. Geological and Development Background
The Gaotaizi oil layer in the Longhupao Oilfield is in the central depression area of the Songliao Basin, spanning the Longhupao-Da’an Terrace and the Qijia-Gulong Sag (Figure 2a). It is adjacent to the Qijia Oilfield in the north and the Qiping area in the west (Figure 2b) [47]. Wang et al. [48] described the geological background and stratum distribution. The Longhupao area is divided into the Fangxing, vertical well, testing, and extended areas (Figure 2c).
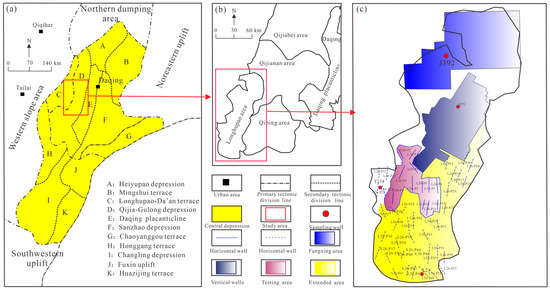
Figure 2.
(a) Generalized geological map of the Songliao Basin showing the study area. (b) Regional geological map of the Qijia-Longhupao area. (c) Geological maps of different blocks in the Longhupao area, showing the sampling wells and the distribution of horizontal wells in this study (modified from Wang et al. [48]).
The Fangxing area belongs to the Fangxing company, whose exploration and development status is unknown. Development of the vertical well area began in 1998, and it progressed to a large-scale oil production by 2000. A total of 12.97 million tons of tight oil has been exploited, and 652 wells are being used for production, with an initial daily oil production of 2.3 t. Due to the poor physical properties and the rapid decline in production, the contradiction of “no injection and no production” has been exposed. Currently, the daily oil production of a single well is 0.2 t, and the water content in the produced fluid is low. The testing and extended areas are in the southern vertical well area, in which the tight oil reservoir is thin, and it has low porosity and ultra-low permeability. Due to its sand body type, reservoir physical properties, and scale of reconstruction, the oil production by vertical well testing is low with poor benefits; however, the oil production can be brought to the industrial level. Therefore, block Long 26 was selected as the pilot test area for horizontal well development. 54 horizontal wells were installed in the tight oil reservoirs of the Gaotaizi oil layer, of which 12 wells were in the testing area, and 42 wells were in the extended area. However, even with similar development methods, there were significant differences in oil and water production in these two regions. In the Long 26 testing area, the time it takes to start oil production is short, the flowback rate is low, and the oil production is high. The average number of days needed by any single well to start oil production was 9 days, and the flowback rate was 20.0%. In the early stage of oil production, the average daily fluid production of a single well was 35.2 t, of which the oil production was 21.6 t, and the water proportion was 38.4%. In the stable production stage, the average daily fluid production of a single well is currently 4.5 t, oil production is 3.2 t, water content is 27.9%, and flow back rate is 75.2%. A total of 12,845 t of oil has been cumulatively produced over 1202 days, with an average oil pressure of 0.74 Mpa. In the Long 26 extended area, the time it took to start oil production was long, the flow back rate was high, and the oil production was low. The average number of days taken by a single well to start production of oil was 62 days, and the flowback rate was 27.9%. In the early stage of oil production, the average daily fluid production of a single well was 28.1 t, of which the oil production was 5.7 t, and the water content was 79.9%. In the current stable production stage, the average daily production volume of a single well is 7.9 t, of which the oil production is 2.0 t, the comprehensive water content is 75%, and the flow back rate is 82.4%. Over 722 days of production, a total of 2263 tons of oil has been produced, with an average oil pressure of 0.67 Mpa (Table 1).

Table 1.
Production of horizontal wells in testing and extended area of the Gaotaizi oil layer in Longhupao area.
3. Sample and Experiment
3.1. Samples Collections and Pretreatment
Considering the differences in tight oil productivity in various areas, four samples from four typical wells that could represent the development characteristics of the study area were selected to carry out related experiments. The sampling depths of these four samples were all located in the main oil-producing interval. Wells J392, J191, and L23 were selected as representative wells in the Fangxing, vertical well, and extended areas, respectively, because these wells are typical wells in their internal areas. Considering that there is no suitable coring well in the testing area, the nearby T234 well was selected as a typical representative well for the testing area after relevant communication with experts in the Daqing Oilfield. The specific information of the four samples is presented in Table 2.
Table 2.
The information of sample from Gaotaizi oil layer, Songliao Basin.
Before the experiment, all samples were immersed in a mixture of ethanol and chloroform for 15 d to remove residual oil and asphalt and then dried in a vacuum oven at 105 °C for 24 h. After the sample was naturally cooled in a desiccator, it was cut parallel to the layering direction into a cylinder with a diameter of approximately 2.5 cm and a length of 3 cm, and the fragments were retained. The fragment samples were used to carry out thin-section experiments or drilled to form cylinders with diameters of 3 mm for micro-CT experiments. The cylindrical plunger sample was first used for routine porosity and permeability tests, then for the low-field nuclear magnetic test (LF-NMR), and finally for the destructive high-pressure mercury intrusion test.
3.2. Experimental Methods and Procedures
To better characterize the microscopic pore structure of the reservoir, various experiments, such as routine porosity and permeability, thin sections, micro-CT, high-pressure mercury intrusion, and nuclear magnetic resonance experiments, were carried out. The routine porosity and permeability were determined using the American Core Company (Houston, TX, USA) PorePDP-200, followed by the GB/T 34533-2023 standard [49]. The thin section experiment was conducted in the Key Laboratory of Deep Oil and Gas of China University of Petroleum (East China), and the production process for the thin section followed the GB/T 35206-2017 standard [50]. The micro-CT experiment, conducted with a Zeiss Xradia 520 Versa 3D X-ray microscope (Zeiss, Oberkochen, Baden-Württemberg, Germany) (with a resolution of 0.3 μm) at the Institute of Geology and Geophysics, Chinese Academy of Sciences, enabled detailed characterization of the pore structures in most pores of tight sandstones. The high-pressure mercury intrusion experiment was conducted, with a maximum pressure reaching 200 Mpa according to the GB/T 21650.3-2011 standard [51].
The nuclear magnetic experiments included nuclear magnetic resonance coupling centrifugal (NMR-CF) and nuclear magnetic resonance coupling displacement (NMR-DP) [52]. The nuclear magnetic instrument used a MesoMR23-060H-I low-field NMR instrument (Niumag Corporation, Suzhou, China). In the NMR-CF experiment, the prepared column samples were dried in a vacuum drying oven for 24 h at 110 °C (383.15 K). After these samples cooled naturally, they were placed in a nuclear magnetic instrument to obtain the T2 spectrum of the dry sample. Then, these samples were placed in a ZYB-II vacuum saturation instrument (Nantong Huaxing Petroleum Instrument Co., Ltd., Hai’an, China) for 24 h with a vacuum pressure of <−0.1 Mpa and 10 Mpa external pressure to pressurize them and saturate them with saltwater, the salinity of which was the same as the simulated formation salinity (8500 ppm). In the process, the T2 spectrums of the sample with water saturation were obtained. Then, the water-saturated samples were centrifuged at 12,000 rp/min for 4 h, leaving only the remaining bound fluid. Finally, the centrifuged sample was tested using an NMR instrument to obtain the T2 spectrum. Based on the NMR signal of the first dry sample, the NMR signals of the second saturated sample and the third sample containing bound water were inverted to obtain the T2 spectra of the saturated water and bound water fluid. The NMR test process used a 25 mm coil, and the parameters of the NMR instrument included an operating frequency of 21.3 MHz, waiting time of 3000 ms, echo interval of 0.25 ms, 12,000 echoes, and 64 stacking layers. The centrifugal experiment was carried out with a GL-21M centrifuge with a maximum speed of 21,000 rp/min, with an accuracy of ±50 rp/min, and an operating temperature range of −20 to 40 °C.
A three-phase system (including water, gas, and rock) was formed after the water-saturated core was placed into a sample cell filled with air. For the water to flow out of the core, a driving force (centrifugal force) is necessary to overcome the resistance (i.e., capillary pressure). The capillary pressure is related to the pore size and increases as the pore size decreases. Therefore, when the core is centrifuged, owing to the density difference between water and air, a centrifugal pressure (ΔP) is generated, which overcomes a portion of the capillary resistance and causes a part of the water to be discharged from the pores of the rock. As the centrifugal speed increases, the centrifugal pressure gradually increases, causing the movable fluid in the rock to be driven out gradually until there is only bound water remaining in the sample.
The NMR-DP experiment used fluorinated oil (FC-40) to displace the saturated formation water (a hydrogen-containing signal fluid, 8500 mg/L brine based on the formation water) in the sample. During oil flooding, the formation water in the pores is gradually displaced by the fluorinated oil, and the signal intensity detected in the NMR T2 spectrum continuously decreases. The specific experimental steps are as follows: (1) Before the experiment, the sample was washed with oil, dried, and the T2 spectrum of the dried sample was measured; (2) The NMR signal of the saturated water sample was measured after the sample was first evacuated to a high vacuum (<−0.1 Mpa) and then saturated with brine under an external confining pressure of 15 Mpa; (3) fluorinated oil was used to displace the saturated water sample at a constant speed (0.05 mL/min), and the T2 spectrum was measured every 10 min; (4) when the amplitude of the NMR signal did not change significantly between two consecutive times, the inlet pressure was increased and process (3) was repeated until the NMR signal did not change after the pressure increased. The process details are provided in Wang et al. [48].
4. Results
4.1. Microscopic Characteristics
The microscopic observations demonstrated that the reservoirs in the Longhupao area are dominated by feldspar and quartz and contain a small amount of carbonate cement and authigenic clay. The diameter of most of the clastic particles is smaller than 200 μm, which is typical of fine silt sandstone. The pore types are predominantly intergranular pores, intergranular dissolution pores, and clay mineral intercrystalline pores, while there is a significant difference in the sandstone reservoirs in each block. The sandstone reservoirs in the northernmost Fangxing area (represented by J392-C) are dominated by intergranular pores and intergranular dissolved pores, and there is a small amount of calcite in the intergranular pore volume. The micro-CT indicated that the pores and throats are well connected, but in the connected pore-throat systems, the throats are longer and thinner. High-pressure mercury intrusion experiments revealed that the pore-throat size distribution is generally less than 1 μm, and the main peak is approximately at 0.1 μm. The NMR-CF experiment determined that the peak value of the T2 spectrum of the bound water is smaller than that of the saturated water, and the pore fluid with a relaxation time greater than 7 ms was centrifuged out during the centrifugation process. The total signal volume of the bound water NMR curve accounts for 47.36% of the NMR signal of the saturated water (Figure 3(a1–a4)).
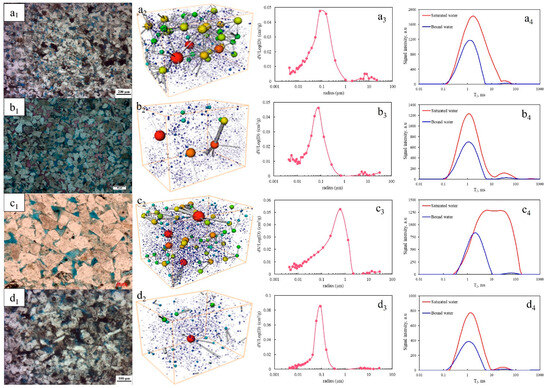
Figure 3.
Reservoir characteristics of different blocks of Gaotaizi oil layer in Longhupao Oilfield. (a1–a4) J392-C represented in Fangxing area; (b1–b4) J191-E represented in vertical well area; (c1–c4) T234-A represented the testing area; (d1–d4) L23-B represented in extended area. 1: Microscopy observation by casting thin section; 2: Three-dimensional ball and stick model constructed by CT; 3: Pore-throat size distribution by high pressure mercury injection; 4: NMR T2 spectra before and after centrifugation in saturated water.
The sandstone reservoir in the vertical well area (represented by J191-E) contains predominantly intergranular pores and intergranular dissolved pores, with a substantial amount of calcite cement in the intergranular pore volume. The three-dimensional pore-throat space comprises pores and throats that are poorly connected; the throats are long and narrow and the pores are isolated. The pore-throat size distribution exhibits pore-throat sizes that are generally less than 1 μm, and the main peak is approximately at 0.08 μm. The saturation-centrifugal NMR T2 spectrum determined that the main peak T2 value of the bound water coincides with that of the saturated water with a lower signal amplitude. Because the pore fluid is driven out during centrifugation, the signal of the centrifuged sample with a relaxation time greater than 10 ms was 0 (Figure 3(b1–b4)), and the total signal of the bound water accounts for 51.7% of the saturated water signals.
The pore types of sample T234-A in the testing area are mainly intergranular pores and intergranular dissolution pores, with no cement in the intergranular pore volume. The three-dimensional pore-throat space indicates that the pore-throat connection in this area is better than that in other areas, and the throats in the pore-throat connection system are thicker, shorter, and connect more pores. The pore-throat size has a large range of values, from a few nanometers to 2 microns, with the main peak at 0.8 μm, and the NMR T2 spectrum demonstrated a wide distribution range, with a nearly bimodal distribution, indicating larger pore throats and better pore-throat connectivity in this area compared with other areas. The NMR curves indicates that the main peak position of the T2 spectrum moves from approximately 10 ms to the left to approximately 2 ms after centrifugation, indicating that the fluid in the macropores was driven out, and the total signal of the residual bound water accounted for 30.28% of the signal volume of the saturated water sample (Figure 3(c1–c4)).
Compared with the reservoir in the testing area, the reservoir in the extended area was tighter. The microscope demonstrated that the reservoir space types of the L23-B sample are primarily intergranular dissolved pores and clay mineral intercrystalline pores. Clay minerals occupy the intergranular pores in the form of cement with numerous new small intercrystalline pores. The pore-throat connection in this type of reservoir is poor, with few connected large pore throats and numerous isolated pores. The peak value of the pore throat size in its distribution is located at approximately 0.08 µm, and pore throats above 0.3 μm do not exist in this sample. The NMR spectrum of the saturated water exhibits a single peak distribution, with a narrower range from 0.2 ms to 10 ms, and the main peak is approximately at 1 ms. The bound water NMR curve demonstrated that the main peak position of the NMR after centrifugation was unchanged, only a small amount of fluid was driven out, and the total signal of the residual bound water accounts for 79.74% of the signal of the saturated water sample (Figure 3(d1–d4)).
4.2. Distribution Characteristics of Oil and Water
As time and pressure was increased, the maximum peak of the T2 spectrum gradually moved to the left, its height gradually decreased, and the distribution interval gradually narrowed, thus indicating the entry of fluoride oil into the pores and the expulsion of water (Figure 4). In the Fangxing area, the relaxation time of the NMR T2 spectrum is mainly distributed between 0.1 ms and 8 ms, and its height continues to decrease while its distribution interval does not change. For the reservoir in the vertical well area, the signal amplitude with T2 between 0.1 ms and 10 ms is reduced slightly, and the signal amplitude does not change with T2 > 10 ms. In the testing area, the relaxation time width transitioned from 0.1 to 100 ms to 0.1–10 ms, the main peak position moved left from 3 ms to 1 ms, and the peak amplitude changed from 5000 a.u to 3200 a.u. In comparison, the NMR signal amplitude of the reservoir in the extended area decreased slightly, indicating that the water was not driven out and only a small amount of oil entered the pores. It should also be noted that fluids with a relaxation time of approximately 1000 ms are generally free fluids that are attached to the rock surface, and they do not belong to the fluid inside the pore space of the reservoir.
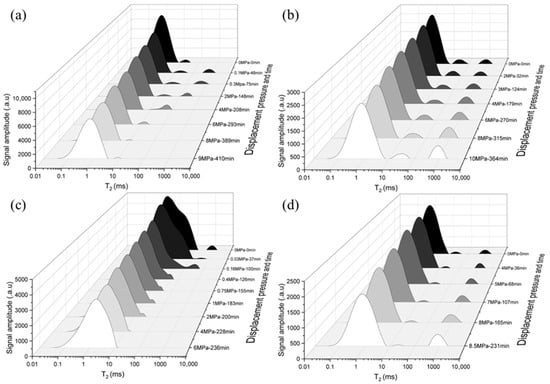
Figure 4.
NMR T2 spectra of tight oil charging process (a) J392-C; (b) J191-E; (c) T234-A; (d) L23-B.
Although the NMR-DP experiment can simulate the oil-water distribution at different oil saturations, the NMR spectrum characterizes the pore relaxation time, not the pore size. Therefore, it is necessary to use the relationship between the T2 spectrum of water saturation and the pore size distribution characterized by high-pressure mercury intrusion to obtain the pore size distribution occupied by oil and water under different oil saturations. Taking T234-A as an example, when the displacement pressure was 0 Mpa, the fluorine oil did not enter the reservoir, the oil saturation was 0%, and the pore size distribution of the reservoir was the pore size distribution of water. The fluorine oil then entered the pore space, and the oil saturation reached 41.39% when the displacement pressure was increased to 0.4 Mpa. At this time, the water was primarily distributed in the pore throats with relaxation times T2 between 1 ms and 100 ms, while fluorinated oil was mainly distributed in pore throats with T2 values between 0.1 ms and 80 ms. When the displacement pressure was further increased to 6 Mpa, the oil saturation was 55.08%. Although the pore size range of oil and water did not change, the signal amplitude of oil increased, while the signal amplitude of water decreased (Figure 5).
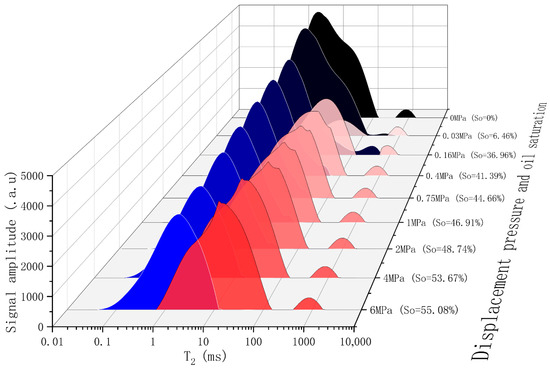
Figure 5.
Schematic diagram of oil-water distribution characteristics during nuclear magnetic displacement. T234-A as an example.
5. Discussion
5.1. Prediction of Oil-Water Content in Produced Liquid
Water injection is adopted in the tight oil exploitation of the Gaotaizi oil layer; therefore, only the three phases of oil-water-rock need to be considered in the process of fluid flow. During the displacement process, we assume that the effects of internal viscosity and fluid friction are negligible. The oil in the pores with radius r needs a pressure difference in Δp to be driven out during the water flooding process (Equation (1)). This relationship can be expressed using the following formula:
where σ is the oil-water interfacial tension, which is 48 mN/m at a temperature of 25 °C and atmospheric pressure, and θ is the wetting angle, which is 40° in the Gaotaizi area [48]. If there are only two phases—oil and water in the pore space of a tight oil reservoir, which account for So and Sw, respectively, the pore size range of the oil and water distribution in the two phases is shown in Figure 1. Assuming that the proportion of irreducible water content in the reservoir is Swr, the proportion of movable water content is Swp. Under the pressure difference P, the oil in the pores with a radius greater than r can be driven out, and its corresponding volume ratio is Sop; then, oil in the pores with a radius less than r remains in the reservoir, and the corresponding volume is Sor. Therefore, the oil content (Lo) and water content (Lw) of the tight oil-produced fluid can be expressed by Equations (2) and (3):
Based on the pore size distribution of the oil and water characterized by NMR-DP, the oil content of the produced fluid at various production pressures and oil saturations was calculated, and a chart was established (Figure 6). Because the oil saturation is 20% and the oil pressure is 0.67 Mpa in the extended area, the oil content in the produced fluid was predicted to be 25%. This predicted result was consistent with the actual oil content of the produced fluid. In the testing area, the oil saturation is 50% and the oil pressure during the production process is 0.74 Mpa, thus the oil content in the produced fluid was predicted to be 72%, which is also close to the actual oil content of 75% in the produced fluid. For the reservoir in the vertical well area, the oil saturation was 47.1%, but unfortunately, the oil pressure data during production were not collected in this block. Because the vertical well area is not far from the testing area and the extended area, the oil pressure was assumed to be 0.7 Mpa, and the predicted oil content in the produced liquid was 100%, which also corresponds to the characteristics of the actual pure oil production. In the Fangxing area, it was predicted that the oil–water content in the produced liquid would be approximately 40%.
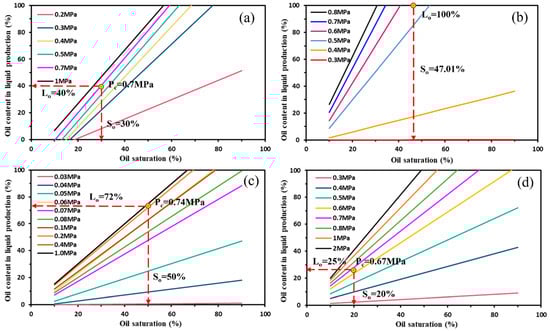
Figure 6.
The prediction chart of the oil content in the produced fluid of each block. (a) Extended area, (b) Testing area; (c) Vertical well area; (d) Fangxing area.
5.2. Main Controlling Factors of Various Oil Content in the Produced Liquid
During tight oil development, the oil content in the produced fluid is mainly related to the pore size distribution of oil and water, oil–water–rock wettability, and displacement pressure. Figure 7a indicates that the oil proportion in the produced fluid increases linearly with an increase in the original oil saturation if the pore structure and wettability of the reservoir are similar. As the displacement pressure is increased, the oil content in the produced fluid increases in an inverse “S” shape. The oil content in the produced fluid is initially 0, and after reaching the breakthrough pressure, it increases rapidly to the maximum value as the growth rate gradually slows down (Figure 7b). For samples with various pore structures, the inflection point of the S-curve is significantly different, including the production pressures at which the oil saturation starts to increase and reaches the highest value. When the oil saturation is similar and the oil–water interfacial tension is equal, as the displacement pressure is increased, the reservoir in the testing area begins to produce oil at a lower pressure and reaches a stable maximum faster, which indicates that the oil in the reservoir in the experimental area was easier to reach. Moreover, the interfacial tension increases from 10 mN/m to 80 mN/m, and it is expected that the oil content in the produced fluid in the testing area will decrease from 80% to less than 10% (Figure 7c).
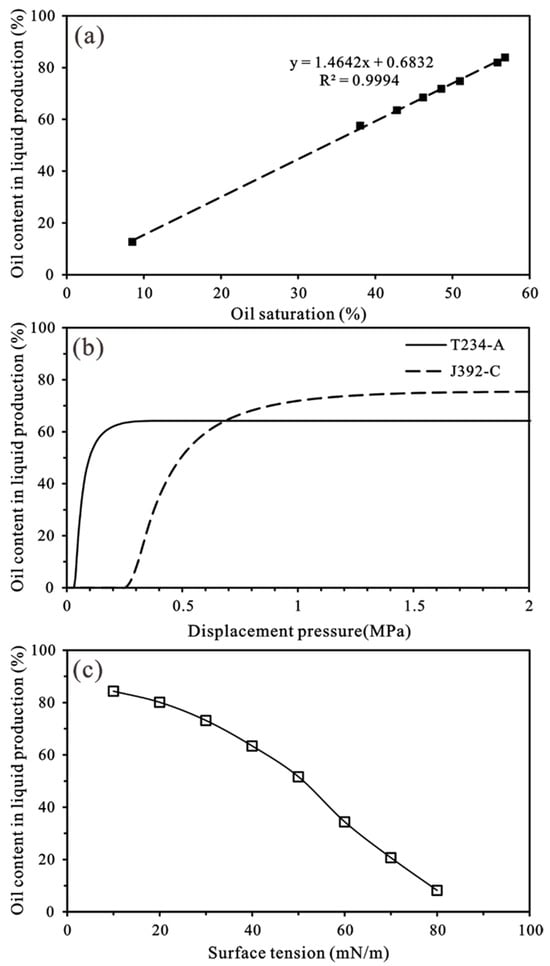
Figure 7.
The main controlling factors of oil proportion in the produced liquid. (a) The influence of the oil saturation on the oil proportion in the produced liquid. T234-A, σ = 48 mN/m, Pc = 0.25 MPa; (b) the influence of the oil–water interfacial tension on the oil content in the produced liquid. T234-A, Pc = 0.06 MPa, So = 55.84%; (c) The influence of pore throat structure and displacement pressure on the oil content in the produced fluid. Take T234-A and J392-C as examples, ST234-A = 42.81%, SJ392-C = 42.17%, σ = 48 mN/m.
In various blocks of Longhupao, there is little difference in rock wettability and production pressure. Therefore, the pore size distribution of oil and water is the key factor affecting the liquid production. The original oil saturation in the vertical well area was 47.1%, and the irreducible water content was as high as 51.7%, indicating that there was no movable water in the reservoir; therefore, only oil was produced. The oil saturation in the testing area was 51.1%, and the irreducible water content was 30.48%. Therefore, only a small amount of water could be displaced, resulting in more oil and less water in the produced liquid. Compared with the testing area, the reservoir pore structure in the extended area is poorer, with an oil saturation of only 20%. Although the irreducible water content is as high as 47.29%, a large amount of movable water is derived from tight oil production, resulting in the production of more oil and less water in the liquid produced. Moreover, Figure 6a indicates that the water content in the produced liquid will be reduced if the production pressure is increased; therefore, narrowing the fracture interval is suggested to be a suitable measure to increase oil production in the extended area. However, this measure may not be as effective in other blocks.
6. Conclusions
This study has developed a predictive model for oil-water content in tight oil-produced fluids. The model accurately predicts the oil-water content in the produced fluids from various blocks of the Longhupao Oilfield, showing strong agreement with actual production data, and provides guidance for exploration activities. The following conclusions were drawn:
- 1.
- The primary reasons for the presence of more oil and less water in the produced fluid in the testing area (7:3) and the presence more of water and less oil in the extended area (3:7) are the differences in the pore throat structure and oil saturation.
- 2.
- The pure oil production in the vertical well area is attributed to the high proportion of bound water as high as 51.7%; under such conditions, the capillary forces immobilize the water phase, making oil the dominant movable fluid.
- 3.
- It is predicted that the proportion of oil content in the fluid produced in Fangxing District is 40%.
- 4.
- Narrowing the fracture interval increases oil production and decreases the water content in the produced liquid in the extended area, but this measure may not be as effective in the other blocks.
Author Contributions
Conceptualization, J.L. (Junhui Li) and X.F.; Methodology, J.L. (Junhui Li), J.L. (Jie Li) and N.Z.; Software, J.L. (Jie Li) and J.L. (Junwen Li); Investigation, J.L. (Junhui Li), X.F., Z.C. and N.Z.; Data curation, J.L. (Jie Li), X.F. and Z.C.; Writing—original draft, N.Z.; Writing—review & editing, S.L. All authors have read and agreed to the published version of the manuscript.
Funding
This work was supported by the Research Project Funded by the Sanya City Science and Technology Innovation Project (Grant No. 2022KJCX51), the National Natural Science Foundation of China (Grant No. 42302183), and the Hainan Provincial Natural Science Foundation of China (Grant No. 424MS083).
Data Availability Statement
The original contributions presented in this study are included in the article. Further inquiries can be directed to the corresponding author.
Conflicts of Interest
Authors Junhui Li, Jie Li, Xiuli Fu and Junwen Li were employed by the Exploration and Development Research Institute of PetroChina Daqing Oilfield Company Limited. The remaining authors declare that the research was conducted in the absence of any commercial or financial relationships that could be construed as a potential conflict of interest.
References
- Li, G.; Zhu, R. Progress, challenges and key issues of unconventional oil and gas development of CNPC. China Pet. Explor. 2020, 25, 1–13. [Google Scholar]
- Sinopec News. Continuous Breakthroughs in Depth Limits: ‘Deep, Ultra-Deep, and Unconventional’ Resources Achieve Multiple Successes. Available online: http://sinopecnews.com.cn (accessed on 19 May 2025).
- Sinopec News. Fulfilling the Mission to Fully Promote Simultaneous Development of Oil and Gas, Conventional and Unconventional Resources. Available online: http://sinopecnews.com.cn (accessed on 15 March 2022).
- CNPC News Center. Southwest Oil and Gas Field: Economic Development with ‘Simultaneous Conventional and Unconventional Efforts’ Advancing on Three Fronts. Available online: http://news.cnpc.com.cn/system/2024/06/11/030134272 (accessed on 19 May 2025).
- Lu, S.; Huang, W.; Li, W.; Xue, H.; Xiao, D.; Li, J.; Wang, M.; Wang, W.; Chen, F.; Zhang, J.; et al. Lower limits and grading evaluation criteria of tight oil source rocks of southern Songliao Basin, NE China. Pet. Explor. Dev. 2017, 44, 473–480. [Google Scholar] [CrossRef]
- Basu, S. Plant Flow Measurement and Control Handbook; Elserier: Amsterdam, The Netherlands, 2018; pp. 846–848. [Google Scholar]
- Fan, Z.; Liu, X.; Wang, Z.; Liu, P.; Wang, Y. A Novel Ensemble Machine Learning Model for Oil Production Prediction with Two-Stage Data Preprocessing. Processes 2024, 12, 587. [Google Scholar] [CrossRef]
- Zhang, T.; Guan, X.; Zhao, Y.; Kang, B.; Zhou, H.; Zhang, R.; Lu, H.; Martyushev, D.; Thanh, H.V. Microscopic simulations of oil–water two-phase flow in high-porosity and low-permeability carbonate porous media. Phys. Fluids 2025, 37, 043605. [Google Scholar] [CrossRef]
- Wu, Y.; Tahmasebi, P.; Liu, K.; Fagbemi, S.; Lin, C.; An, S.; Ren, L. Two-phase flow in heterogeneous porous media: A multiscale digital model approach. Int. J. Heat Mass Transf. 2022, 194, 123080. [Google Scholar] [CrossRef]
- Zhao, G.; Cheng, L.; Jia, P.; Liu, Y.; Feng, H.; Kuang, T.; Wang, Q. Initial Occurrence State and Movability Evaluation of the Gulong Shale Oil Reservoir, Songliao Basin. Energies 2024, 17, 1358. [Google Scholar] [CrossRef]
- Meng, L.; Shi, X.; Yang, W.; Zhang, C.; Xu, W. Study on the Evaluation Method of the Water Saturation Logging of a Low-Resistance Oil Reservoir in the Guantao Formation, Bohai Basin. Processes 2023, 11, 2890. [Google Scholar] [CrossRef]
- Ge, Y.; Zhao, K.; Niu, H.; Song, X.; Qiao, L.; Cheng, X.; Feng, C. Logging Identification Methods for Oil-Bearing Formations in the Chang 6 Tight Sandstone Reservoir in the Qingcheng Area, Ordos Basin. Energies 2024, 17, 3966. [Google Scholar] [CrossRef]
- Bai, Z.; Tan, M.; Li, B.; Shi, Y.; Zhang, H.; Li, G. Fluid Identification Method of Nuclear Magnetic Resonance and Array Acoustic Logging for Complex Oil and Water Layers in Tight Sandstone Reservoir. Processes 2023, 11, 3051. [Google Scholar] [CrossRef]
- Sun, F.; Sun, J.; Wang, M.; Chi, P. Analysis and Application of Fluid Components in High-Clay Matrix Shale Oil: A Case Study of Gulong Shale Oil. Energies 2024, 17, 3770. [Google Scholar] [CrossRef]
- Sun, W.; Zhang, J. Study on the Distillation for Determining Moisture Content in the Crude Oil. Chem. Eng. Oil Gas 2007, 36, 247–249. [Google Scholar]
- Chen, X.; Zhu, W.; Zhao, J.; Ren, L. Method of Predicting Water Content in Crude Oil Based on Measuring Range Automatic Switching. J. Beijing Inst. Technol. 2010, 19, 87–91. [Google Scholar]
- Dean, E.W.; Stark, D.D. A Convenient method for the determination of water in petroleum and other organic emulsions. Ind. Eng. Chem. Res. 1920, 12, 486–490. [Google Scholar] [CrossRef]
- Luffel, D.L.; Guidry, F.K. New core analysis methods for measuring reservoir rock properties of Devonian shale. J. Pet. Technol. 1992, 44, 1184–1190. [Google Scholar] [CrossRef]
- Handwerger, D.A.; Keller, J.; Vaughn, K.I. Improved petrophysical core measurements on tight shale reservoirs using retort and crushed samples. In Proceedings of the SPE Annual Technical Conference and Exhibition, Denver, CO, USA, 5–8 October 2011. [Google Scholar]
- Handwerger, D.A.; Willberg, D.; Pagels, M.; Rowland, B.; Keller, J.F. Reconciling retort versus dean stark measurements on tight shales. In Proceedings of the SPE Annual Technical Conference and Exhibition, San Antonio, TX, USA, 8–10 October 2012. [Google Scholar]
- Tan, Z.; Cheng, Y.; Liu, Y.; Zhang, Q.; Gao, Y. Research and Application of Core Fluid Saturation Analysis Technique in Low Permeability Reservoirs; IFEDC: Beijing, China, 2018. [Google Scholar]
- Ji, Q.L.; Gao, P.; Chen, Z.G.; Wu, Q. Research on the structure design of offshore crude oil electric dehydrator. J. Filtr. Sep. 2013, 23, 29–34. [Google Scholar]
- Zhao, Z. Study of Measuring Technique on the Water Content of the Crude Oil. Ph.D. Thesis, Shenyang University of Technology, Shenyang, China, 2007. [Google Scholar]
- Du, S. Research on an Array-Type Electromagnetic Correlation Flowrate Measuring Method for Oil-Gas-Water Three-Phase Flow in Oil Well. Ph.D. Thesis, Yanshan University, Qinhuangdao, China, 2016. [Google Scholar]
- Tsochatzidis, N.A.; Karapantsios, T.D.; Kostoglou, M.V.; Karabelas, A.J. A conductance probe for measuring liquid fraction in pipes and packed beds. Int. J. Multiph. Flow 1992, 18, 653–667. [Google Scholar] [CrossRef]
- You, B.; Sun, R.; Zhang, T. Method for Optimizing Moisture Content of Crude Oil Based on Electric Conductivity Method. Chinses J. Sens. Actuators 2019, 32, 1308–1312. [Google Scholar]
- Xia, M.; Zhang, J. Research Progress and Development Trend of Determination Methods of Water Cut in Crude Oil. Chem. Manag. 2014, 161. [Google Scholar]
- Evdokimov, I.N.; Losev, A.P. Microwave treatment of crude oil emulsions: Effects of water content. J. Pet. Sci. Eng. 2014, 115, 24–30. [Google Scholar] [CrossRef]
- Lu, S.; Xue, H.; Wang, M.; Xiao, D.; Huang, W.; Li, J.; Xie, L.; Tian, S.; Wang, S.; Li, J.; et al. Several key issues and research trends in evaluation of shale oil. Acta Pctrolci Sin. 2016, 37, 1309–1322. [Google Scholar]
- Zhou, N.W.; Lu, S.F.; Zhang, P.F.; Lin, Z.Z.; Xiao, D.S.; Lu, J.M.; Zhu, Y.K.; Liu, Y.C.; Lin, L.M.; Wang, M.; et al. Tight gas charging and accumulation mechanisms and mathematical model. Pet. Explor. Dev. 2023, 50, 1411–1425. [Google Scholar] [CrossRef]
- Webb, P.A. An Introduction to the Physical Characterization of Materials by Mercury Intrusion Porosimetry with Emphasis on Reduction and Presentation of Experimental Data 2 CONTENTS; Micromeritics Instrument Corp: Norcross, GA, USA, 2001. [Google Scholar]
- Giesche, H. Mercury Porosimetry: A General (Practical) Overview. Part. Part. Syst. Charact. 2006, 23, 9–19. [Google Scholar] [CrossRef]
- Clarkson, C.R.; Freeman, M.; He, L.; Agamalian, M.; Melnichenko, Y.B.; Mastalerz, M.; Radlin’ski, A.P.; Blach, T.P. Characterization of tight gas reservoir pore structure using USANS/SANS and gas adsorption analysis. Fuel 2012, 95, 371–385. [Google Scholar] [CrossRef]
- Zhang, P.; Lu, S.; Li, J.; Xue, H.; Li, W.; Zhang, P. Characterization of shale pore system: A case study of paleogene Xin’gouzui formation in the Jianghan basin, China. Mar. Pet. Geol. 2016, 79, 321–334. [Google Scholar] [CrossRef]
- Li, J.; Yin, J.; Zhang, Y.; Lu, S.; Wang, W.; Li, J.; Chen, F.; Meng, Y. A comparison of experimental methods for describing shale pore features—A case study in the Bohai Bay Basin of eastern China. Int. J. Coal Geol. 2015, 152, 39–49. [Google Scholar] [CrossRef]
- Wang, M.; Xue, H.; Tian, S.; Wilkins, R.W.T.; Wang, Z. Fractal characteristics of Upper Cretaceous lacustrine shale from the Songliao Basin, NE China. Mar. Pet. Geol. 2015, 67, 144–153. [Google Scholar] [CrossRef]
- Crabtree, E.H. Oil shale and shale oil. In Proceedings of the Annual Meeting of the American Institute of Mining, Metallurgical, and Petroleum Engineers, Chicago, IL, USA, 14–18 February 1965. [Google Scholar]
- Konoshonkin, D.V.; Parnachev, S.V. Existing approaches to tight rock laboratory petrophysics: A critical review. IOP Conf. Ser. Earth Environ. Sci. 2015, 24, 012042. [Google Scholar] [CrossRef]
- Guidry, K.; Luffel, D.; Curtis, J. Development of Laboratory and Petrophysical Techniques for Evaluating Shale Reservoirs, Final Technical Report, October 1986–September 1993; GRI-95/0496; ResTech Houston, Inc.: Houston, TX, USA, 1996. [Google Scholar]
- Bao, Y. Effective reservoir spaces of Paleogene shale oil in the Dongying Depression, Bohai Bay Basin. Pet. Geol. Exp. 2018, 40, 479–484. [Google Scholar]
- Fu, J.; Li, S.; Hou, Y.; Zhou, X.; Liu, J.; Li, S. Breakthrough of risk exploration of Class Ⅱ shale oil in Chang 7 member of Yanchang Formation in the Ordos Basin and its significance. China Pet. Explor. 2020, 25, 78–92. [Google Scholar]
- Zhang, Z.; Liu, Y.; Qu, B.; Tan, Z.; Chen, Y.; Qu, H. Ethanol Extraction Analysis Method for Core Oil-Water Saturation. CN106769377A, 17 November 2016. [Google Scholar]
- Passey, Q.R.; Bohacs, K.M.; Esch, W.L.; Klimentidis, R.; Sinha, S. From oil-prone source rock to gas-producing shale reservoir—Geologic and petrophysical characterization of unconventional shale-gas reservoirs. In Proceedings of the International Oil and Gas Conference and Exhibition in China, Beijing, China, 6–8 June 2010. [Google Scholar]
- Kethireddy, N.; Heidari, Z.; Chen, H. Quantifying the effect of kerogen on electrical resistivity measurements in organic-rich source rocks. In Proceedings of the SPWLA 54th Annual Logging Symposium, New Orleans, LA, USA, 22–26 June 2013. [Google Scholar]
- Chen, H.; Firdaus, G.; Heidari, Z. Impact of anisotropic nature of organic-rich source rocks on electrical resistivity measurements. In Proceedings of the SPWLA 55th Annual Logging Symposium, Abu Dhabi, United Arab Emirates, 18–22 May 2014. [Google Scholar]
- Habina, N.; Radzik, N.; Topór, T.; Krzyzak, A.T. Insight into oil and gas-shales compounds signatures in low field 1H NMR and its application in porosity evaluation. Microporous Mesoporous Mater. 2017, 252, 37–49. [Google Scholar] [CrossRef]
- Zhou, N.; Wang, M.; Lu, S.; Liu, W.; Guan, Y.; Yu, C. Evolution of pore space in tight sandstone: The roles of dissolution, calcite cementation, and clay growth. AAPG Bull. 2023, 107, 1609–1635. [Google Scholar] [CrossRef]
- Wang, M.; Guan, Y.; Zhang, J.; Zhou, N.; Liu, W.; Tan, H.; Lu, S. Oil charging model and controlling factors revealed by an online nuclear magnetic resonance (NMR) system. Mar. Pet. Geol. 2020, 118, 104442. [Google Scholar] [CrossRef]
- GB/T 34533-2023; Determination of Porosity, Permeability and Saturation of Shale. The Standardization Administration of the People’s Republic of China: Beijing, China, 2023.
- GB/T 35206-2017; Thin Section Examination of Shale and Mudstone. The Standardization Administration of the People’s Republic of China: Beijing, China, 2017.
- GB/T 21650.3-2011; Pore size Distribution and Porosity of Solid Materials by Mercury Porosimetry and Gas Adsorption. Part 3: Analysis of Micropores by Gas Adsorption. The Standardization Administration of the People’s Republic of China: Beijing, China, 2011.
- Wang, B.Y.; Cao, R.Y.; Zheng, X.Y.; Cheng, L.S.; Hu, J.P.; Jia, Z.H.; Duan, W.H.; Hassanzadeh, H. Real-time NMR experimental study of displacement–imbibition coupling in tight/shale oil reservoirs: Lithological variations, influencing factors, and key insights. Pet. Sci. 2025; in press. [Google Scholar] [CrossRef]
Disclaimer/Publisher’s Note: The statements, opinions and data contained in all publications are solely those of the individual author(s) and contributor(s) and not of MDPI and/or the editor(s). MDPI and/or the editor(s) disclaim responsibility for any injury to people or property resulting from any ideas, methods, instructions or products referred to in the content. |
© 2025 by the authors. Licensee MDPI, Basel, Switzerland. This article is an open access article distributed under the terms and conditions of the Creative Commons Attribution (CC BY) license (https://creativecommons.org/licenses/by/4.0/).