Abstract
This research focuses on a methodological study of the fault activation mechanisms associated with carbon dioxide (CO2) storage, with a focus on determining the underlying geomechanical properties of the caprock. The study uses an analytic hierarchy process (AHP) to prioritize these parameters in order to improve the process for selecting the critical geomechanical design data that underpin the analysis of potential CO2 storage sites. By integrating expert knowledge through a structured questionnaire, this study extends the process and provides a weighting methodology to provide realistic parameters as input for advanced numerical simulations. The ratings achieved indicated that the injection pressure was the most significant parameter, while fault cohesion was found to be the least significant parameter, having minimal impact on fault displacement. To validate the weighting methodology, a sensitivity analysis was performed using numerical modeling based on these parameters. The results confirmed the accuracy of the weighting methodology, demonstrating that injection pressure is indeed the most critical factor, while fault cohesion has the least impact on displacement. Additionally, the study advances our understanding of key geomechanical parameters, facilitating the development of customized CO2 injection and containment strategies aimed at reducing risk and enhancing site integrity.
1. Introduction
Emerging as a pivotal strategy in the global combat against the harmful impacts of greenhouse gas emissions, carbon capture and storage (CCS) has become increasingly vital in our efforts to mitigate the effects of climate change. CO2 emissions have experienced a significant increase globally, with a record high of 36.4 billion metric tons recorded in 2020. Potential storage sites, such as deep saline aquifers and depleted oil and gas reservoirs, have emerged as promising sites for storing significant volumes of CO2 [1].
Among these storage sites, CO2 is retained through a series of natural trapping mechanisms that enhance long-term containment. Initially, structural and stratigraphic trapping confines the CO2 beneath impermeable caprock or within geological closures. As the plume migrates, a portion of the CO2 becomes immobilized in pore spaces through residual trapping. Over time, geochemical processes increase storage security by dissolving the CO2 into formation fluids and, eventually, forming stable carbonate minerals [2]. These mechanisms act progressively to reduce mobility and leakage risks.
With the growing need to combat climate change, CCS has drawn significant attention globally, being recognized as an essential component of climate mitigation strategies. As highlighted by Song et al. [3], this recognition is reiterated in the Paris Agreement, which underscores the pressing need for nations to limit the global temperature rise to well below 2 degrees Celsius, thereby positioning CCS as a critical piece in the puzzle of reaching international climate goals.
In parallel, recent review studies have highlighted significant global progress in CCS and CCUS technologies, with geological storage remaining a central focus. A bibliometric analysis by Li et al. [4] revealed that research efforts have increasingly concentrated on refining subsurface storage strategies, enhancing the safety and efficiency of CO2 injection, and developing robust risk assessment methodologies. Of particular relevance is the growing emphasis on understanding fault behavior and the role of geomechanical parameters in ensuring long-term storage integrity [5,6]. These insights reinforce the necessity for structured approaches to evaluate the influence of key factors, such as in situ stress, fault cohesion, and injection pressure, on fault stability and caprock sealing performance.
However, the journey toward the widespread adoption of CCS is fraught with challenges. In particular, the geomechanical risks associated with fault activation in CO2 storage reservoirs pose significant obstacles. The injection of large volumes of CO2 into deep subsurface formations can instigate complex geomechanical reactions, including fault activation, caprock breaches and reservoir deformation, and induced seismicity [7]. Therefore, understanding and mitigating these geomechanical risks are of paramount importance to ensure the security and efficiency of CCS projects [8].
At the core of the assessment of geomechanical risks in CO2 storage is the geomechanical parameters that dictate the stability and integrity of storage reservoirs. As noted by Pan et al. [9], variations in stresses, strains, and surface deformations can profoundly influence both the behavior of geological formations and the containment of injected CO2. Despite significant advancements in CCS technology, scientific understanding of the geomechanical behavior of CO2 storage reservoirs is marked by considerable knowledge gaps. Bridging these gaps and enhancing our understanding of fault activation mechanisms are crucial for informing regulatory frameworks and industry best practices in CCS initiatives [10,11]. This research, drawing upon insights from diverse CCS projects worldwide, aims to contribute to the understanding and management of the geomechanical risks associated with fault activation in CO2 storage [12,13].
While previous studies have applied AHP and other risk-ranking techniques to various aspects of CCS, they often lack integration with numerical modeling or omit the explicit treatment of expert confidence levels. This study bridges that gap by developing a structured weighting framework that not only ranks key geomechanical parameters based on expert input but also validates their impact through the simulation of a real CO2 storage site.
2. Materials and Methods
2.1. Identification of Key Geomechanical Parameters
In the complex field of underground CO2 storage design, the role of caprock geomechanical parameters becomes critical, directly impacting the safety and efficiency of operations. Assessment of these parameters is challenging due to the complex nature of in situ rock properties on a large scale, the influence of significant geological structures such as faults, and the interactions within hydromechanical stress fields. These factors, coupled with the complicated boundary conditions associated with CO2 storage sites, add complexity to the analysis and evaluation process.
This study aims to develop a practical weighting methodology to assess the significance of key geomechanical parameters that influence CO2 storage and fault activation. By investigating fault activation mechanisms and analyzing critical caprock geomechanical parameters, this research employs the analytic hierarchy process (AHP) to systematically prioritize these parameters. This study involves designing a comprehensive questionnaire to gather expert opinions from international specialists, which will refine the methodology and provide realistic input for numerical modeling. Understanding the significance levels of these parameters is crucial for accurate geomechanical risk assessment regarding CO2 storage. This prioritization enables the development of tailored mitigation strategies that address the most critical risks effectively. Ultimately, a thorough understanding of these parameters enhances the efficiency and safety of CO2 storage projects, ensuring their overall success and long-term sustainability.
To address the complexities of determining the key geomechanical parameters of the caprock for CO2 storage and geomechanical analysis design, a detailed selection process was employed, based on an extensive literature review. Through this methodological approach, the essential parameters for caprock integrity analysis were carefully assessed and incorporated into the proposed weighting procedure. This strategy ensures increased design accuracy and reliability while addressing the multifaceted challenges inherent in underground CO2 storage projects. Based on the conducted literature survey, the chosen key parameters were categorized and are presented in Table 1.

Table 1.
Classification of the key rock mass geomechanical and operational parameters affecting CO2 storage.
The twelve selected parameters are divided into two categories: geomechanical and operational. Geomechanical parameters (P1–P9) represent intrinsic rock properties and the in situ stress conditions that directly influence fault stability and reservoir integrity. These include permeability and porosity (fluid transport properties), the deformation modulus (stiffness), fault friction angle and cohesion (shear resistance), pore pressure field (driving stress), the degree of fracturing (discontinuity network), and in situ stress orientation and the stress ratio (stress regime descriptors).
Operational parameters (P10–P12), such as injection pressure, injection time, and reservoir temperature, are directly controlled during CO2 injection and significantly influence pore pressure propagation and the mechanical response of the reservoir and caprock system.
All parameters were selected based on their frequent inclusion in prior CCS-related geomechanical studies, their physical relevance to fault reactivation and containment integrity, and their measurability using available field or laboratory techniques [14,15].
2.2. Development of the Questionnaire and Collecting the Responses from Experts
Due to the limited data available for this study, international advice was sought from experts in the field to complete a survey and evaluate the key parameters, based on the significance level and confidence level in their answers. The development of the questionnaire and the process of gathering responses from these experts were meticulously designed to ensure comprehensive and reliable data collection for this study on the geomechanical and operational parameters affecting CO2 storage. The experts were instructed to assess each of the 12 parameters listed in the classification table. The assessment criteria were based on two key metrics:
- Significance level: The experts rated the significance of each parameter on a scale from 1 to 5, where 1 represented “very low” significance and 5 represented “very high” significance. This scale was chosen to capture a detailed view of each parameter’s impact on CO2 storage.
- Confidence level: In their assessments, the experts used a verbal scale ranging from VL (very low) to VH (very high). This scale aimed to measure the reliability of their evaluation, based on their expertise.
The use of two distinct but complementary evaluation metrics allowed the study to incorporate not only expert judgment on parameter importance but also the degree of certainty with which those judgments were made. This dual-layer approach increased the robustness of the resulting weights used in the AHP model.
To ensure consistency and scientific rigor, the experts completed two pairwise comparison matrices: one for significance and one for confidence, structured according to the analytic hierarchy process (AHP). Each expert compared all parameters relative to one another using a 1–5 scale adapted from Saaty’s original 1–9 scale. This method allowed the quantification of both qualitative judgments and subjective expertise.
The responses were screened for logical consistency using the consistency ratio (CR), calculated for each expert’s input. Only matrices with were accepted for further analysis. This threshold ensured that the judgments were internally coherent and suitable for aggregation.
Once validated, the weights were computed by normalizing each matrix and calculating the priority vector (eigenvector) for each expert. Final weights for each parameter were obtained by averaging across all consistent expert inputs. This process is described in greater detail in Section 2.4.
The template of the questionnaire is presented in Table 2.

Table 2.
The designed questionnaire template.
The original questionnaire methodology presented difficulties for both data collectors and expert respondents, resulting in significant operational inefficiencies and a time-consuming process. To address these issues, a revised questionnaire as shown in Figure 1 was developed using Microsoft Forms, which automatically integrated responses into Microsoft Excel, simplifying the data analysis and weighting procedures. This new approach improved convenience for respondents, allowing for quick survey completion via a direct link or QR code on smartphones or computers, thereby enhancing operational efficiency and data reliability.
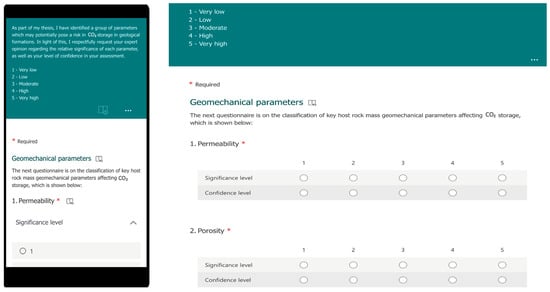
Figure 1.
Questionnaire form developed within the Microsoft Forms environment.
The transparent design and rigorous validation of the experts’ input process add credibility to the study’s findings and ensure that the resulting geomechanical parameter rankings are both scientifically sound and practically applicable.
This questionnaire was sent to internationally recognized experts, and their responses on the significance of the selected parameters were collected. These expert responses were used as input data for the proposed weighting methodology.
2.3. Questionnaire Survey Results
A questionnaire was sent to 237 experts in the fields of geomechanical engineering, mining engineering, petroleum engineering, geology, chemical engineering, and CO2 storage, who were selected based on their published works and practical experience. Despite facing operational challenges, the study garnered responses from a diverse group of anonymous experts, including leading figures such as the Chief Operating Officer (COO) of the Petroleum Technology Research Center, professors specializing in various engineering fields, and the president of an international organization focused on carbon capture. Respondents represented a global perspective, with expertise from countries like Norway, Canada, Malaysia, China, Denmark, and Kazakhstan, emphasizing the international interest of the subject and their extensive experience in CO2 storage.
A total of 15 completed responses were obtained from the international questionnaire. In addition, follow-up discussions and personal communications with local experts in both academia and industry yielded 33 further inputs, resulting in 48 expert contributions overall. Although this number may appear modest, it is consistent with the norms of structured expert elicitation in CO2 storage research, where the high degree of specialization within the field often limits sample sizes.
Comparable studies demonstrate that small yet carefully selected expert groups can provide methodologically robust insights. For instance, a structured elicitation on risk management in carbon capture and geological storage involved twelve international experts to quantify uncertainties associated with long-term CO2 storage and leakage risks [16], while another assessment in the United States relied on probability distributions elicited from only three subject-matter experts to evaluate the regulatory clearance stages for CO2 sequestration wells [17]. These precedents highlight that rigorous uncertainty quantification in CO2 geomechanical studies can be effectively conducted with limited participant numbers, thereby reinforcing the validity of the 48 responses incorporated in this study.
Among the valid responses, the response distribution included experts from both academia and industry. Approximately 60% had backgrounds in geomechanics and rock engineering, while the remaining respondents brought experience in petroleum engineering, geological modeling, and carbon storage project implementation.
After the application of Microsoft Forms to the data, the results were transformed into the format shown in Table 3, where each row corresponded to an expert’s response. Each column displayed the ID number and email of the experts, as well as the ratings for all 12 parameters, based on significance and confidence level.

Table 3.
Appearance of the responses in Microsoft Excel for each parameter.
2.4. Weighting Procedure Using the Analytic Hierarchy Process (AHP)
Addressing geomechanical risks in CO2 storage necessitates the development of precise criteria for measuring rock properties and assigning weights based on their significance and reliability. The inherent variability in rock masses and the complexities associated with carbon capture and storage (CCS) exacerbate these challenges.
To address these issues, this study aims to establish a robust mechanism for evaluating the importance of geomechanical parameters through the analytic hierarchy process (AHP), which was developed by Thomas L. Saaty in 1970 [18]. AHP offers a systematic approach for decomposing complex decisions into manageable components through pairwise comparisons and numerical scaling, thereby integrating both subjective and objective assessments. AHP is particularly effective for handling both tangible and intangible criteria, making it ideal for prioritizing geomechanical risks in CO2 storage projects. It facilitates comprehensive analysis by structuring decisions hierarchically, synthesizing qualitative and quantitative data, and supporting informed decision-making. The goal was to develop a methodology for selecting essential geomechanical design data for CO2 storage site analysis.
Considering the use of Saaty’s fundamental 1–9 scale for pairwise comparisons, a simplified 1–5 scale was adopted in this study to evaluate both the significance and confidence levels of expert responses. This modification was made to ensure consistency with the evaluation framework, which was applied to both the perceived importance of parameters and the associated level of confidence expressed by experts.
For each expert and for both evaluation criteria (significance and confidence), pairwise comparison matrices were constructed to assess the relative importance of the parameters. These matrices were subsequently normalized, and priority vectors were computed to derive the local weights of each parameter. Following this, the weighted sum vector and consistency vector were calculated to evaluate the internal consistency of each matrix. The consistency index (CI) and consistency ratio (CR) were then determined for every expert and criterion to ensure the logical coherence and reliability of the judgments that had been provided.
The following algorithm was used to code these equations within Microsoft Excel to develop the proposed weighting methodology.
Step 1: Construction of the AHP judgment matrix
A square matrix of size n × n is created for each expert and evaluation criterion (significance and confidence). Each element reflects the expert’s judgment on how much more important parameter i is relative to parameter j, using a fundamental scale adapted from Saaty’s 1–9 scale to a simplified 1–5 range.
Step 2: Normalization of the matrix
Each column of the matrix is normalized by dividing each element in the column by the sum of the column :
where is the parameter of the original pairwise matrix A at row i and column j; is the sum of the j-th column in matrix A.
This operation is performed for each parameter in matrix A, leading to creation of normalized matrix N, where the sum of each column equals 1.
Step 3: Calculation of the priority vector (eigenvector)
After normalization, the priority vector is calculated by taking the average of each row in the normalized matrix N.
This eigenvector represents the relative weights of each parameter.
Step 4: Derivation of the weighted sum vector
We multiply the original pairwise comparison matrix A by the priority vector P to obtain the weighted sum vector. If A is an n × n matrix and P is an n × 1 vector, then .
Step 5: Consistency vector calculation
We divide the weighted sum WS by the priority vector P elementwise to obtain the consistency vector (CV); if is the i-th element of WS and is the i-th element of P, then each element c of CV is calculated by the following formula:
Step 6: Calculation of the average consistency vector and consistency index (CI)
The consistency index (CI) is calculated by subtracting the number of parameters (n) from the average of the consistency vector () and then dividing it by . The average of the consistency vector is often referred to as , which represents the principal eigenvalue of matrix A.
Step 7: Consistency ratio (CR) evaluation
The consistency ratio (CR) is calculated by dividing the CI by the random index (RI), where RI values are based on the number of parameters (n). For , as illustrated in Table 4.

Table 4.
The calculated random inconsistency index.
Step 8: Consistency check
If , the judgment within the pairwise comparison matrix is considered consistent. Otherwise, if , the judgments are deemed to be inconsistent, indicating a need to review and possibly revise the pairwise comparison.
Step 9: Repetition for each expert
There is a need to repeat these steps to assess each expert’s ratings and establish both significance and confidence level.
Step 10: Aggregation of expert judgments
The final weights for each parameter can be calculated as the average of the weights obtained from each expert’s ratings, using the following formula:
where is the final weight for parameter i; is the weight assigned to parameter i by expert j; m is the total number of experts.
The process involves an individual assessment of each expert’s ratings on significance and confidence levels, followed by the calculation of the average weights to determine the final parameter weights. This algorithm is implemented in an Excel spreadsheet, enabling automatic updates to ratings with any new expert responses.
2.5. Weighting Results of Key Parameters Involved in CO2 Storage
As outlined in the methodology section (Section 2.4), all calculations were performed from step 1 to step 10. The comparison matrix had a dimension of n = 12, with a maximal eigenvalue (λ_max) of 12 and a random index (RI) of 1.54. The evaluation of the questionnaire results was facilitated by the developed spreadsheet. The questionnaire survey results were read into the developed spreadsheet, and the weight and significance of the selected parameters were determined and are presented in Table 5.

Table 5.
The determined weights of the selected key parameters involved in CO2 storage.
Table 5 presents the sorted weights of key parameters in CO2 storage, ranked from 1 to 12 based on the assessments from all experts, considering significance and confidence levels. Additionally, this table provides the groups and full names of the parameters. The obtained weighting is in accordance with practical observations and engineering judgment.
3. Numerical Modeling
3.1. Key Parameters and Weighting Results Discussion
A methodical and precise approach for the weighting of geomechanical design parameters for CO2 storage is crucial for ensuring site stability, environmental protection, and effective CO2 sequestration and storage. This precision simplifies workflows, offering economic and safety benefits, and supports robust risk management strategies focused on storage site caprock stability. If validated against practical observations, the developed weighting methodology can be integrated into upcoming CCS initiatives, both in Kazakhstan and worldwide.
According to the weighting results presented in Table 5, the injection pressure (P10) is the most critical parameter, with the highest weight of 9.67%, emphasizing its role in storage site stability. Permeability (P1) and porosity (P2) follow, with weights of 9.24% and 8.77%, respectively; these are crucial for assessing storage capacity and fluid movement. Fault cohesion (P5) has the least impact, having a weight of 7.27%. This prioritization highlights the detailed approach needed to manage and mitigate geomechanical risks effectively. The obtained results, presented in the form of a bar chart in Figure 2, display the distribution of the determined weights for the key parameters.
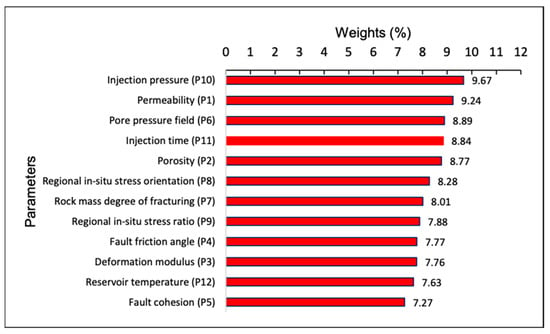
Figure 2.
Bar chart presentation of the determined weight and significance of each of the selected parameters.
Numerical modeling was used to perform a sensitivity analysis of the two parameters that had the highest and lowest weight and significance, to validate the suggested weighting methodology. The weighted results demonstrated the degrees of significance for 12 parameters related to CO2 storage, with a focus on their influence on fault plane movements as a component of caprock breach mechanisms. Fault cohesion was found to have the least significance, whereas injection pressure was found to be the most important parameter, ranking first, based on the established weighting.
The initial data used for these weighting results came from the responses provided by global experts. However, a typical CO2 storage scenario was simulated using the 2D finite element method (FEM), in order to validate the applicability of the suggested weighting procedure. A 2D section of a typical CO2 storage site was simulated using the RS2 code (Rocscience, 2021; Toronto, ON, Canada), taking into account a large fault within the caprock that intersected the CO2 plume zone. The following section aims to demonstrate whether the developed weighting methodology holds true through a detailed numerical modeling exercise.
3.2. Numerical Modeling of a Typical CO2 Storage Site
To demonstrate the applicability of the weightings determined for the key parameters involved in CO2 storage, the well-documented In Salah CO2 storage site in Algeria was selected. A two-dimensional section of the In Salah site was selected, and a 2D finite element model was constructed using the RS2 code. Model input data, including geology, caprock configuration, the caprock rock mass’s mechanical and strength parameters, injection pressure history, etc., were compiled from published data and were used as input in the conducted numerical modeling process [19,20].
To initiate the creation of the model, initial data were gathered from materials describing the In Salah storage site and were then adapted for this study. For the numerical analysis, a 2D domain was considered, which included four hydrogeological formations, namely, caprock layers 1, 2, and 3, as well as the basement. The material properties of the reservoir, situated at a depth of between 1800 and 1820m, were also distinct, and all parameters were realistically selected for the analysis.
Mechanical and strength properties for each geological unit, including Young’s modulus, Poisson’s ratio, cohesion, friction angle, and tensile strength, were assigned based on sources in the literature, particularly well log and laboratory data, as summarized in Table 6 and Table 7. The caprock was modeled using the Mohr–Coulomb failure criterion with plastic behavior, while the reservoir and basement were assigned elastic or excavated zones based on their injection and deformation characteristics.
Additionally, a fault with a dip angle of 60 degrees was integrated into the model. Assuming an oval-shaped CO2 plume region at the injection point, a similar opening was considered to internally pressurize the model, in line with the pressurization history of the In Salah site [21]. The dimensions of the internal pressurization chamber were considered to be 20 m in height and 165 m in length, in the vicinity of the implemented major fault. An analysis domain of 500 m in width and 300 m in height was considered. Considering the In Salah reservoir’s depth, the effect of an additional overburden depth was applied as a uniform load at the model top boundary to achieve an initial caprock in situ equilibrium state within the RS2 model.
In the constructed numerical model, the boundary conditions were carefully defined to simulate realistic geological constraints and to ensure accurate stress redistribution around the CO2 injection zone. The bottom boundary was fully fixed in both horizontal and vertical directions, representing the rigid and immobile nature of the underlying basement rock. The lateral boundaries on the left and right sides were assigned roller conditions, being constrained in the horizontal direction but free to move vertically, allowing the model to realistically capture tangential displacements while preventing artificial lateral expansion or compression. The top boundary was set to be free, enabling vertical displacement to occur and simulating a traction-free surface. This configuration is widely accepted in geomechanical simulations, as it maintains a balance between computational stability and geological realism, ensuring that fault reactivation, caprock response, and stress evolution due to CO2 injection are properly represented.
Figure 3, below, demonstrates the 2D model at the initial stage, with stress conditions as established before any excavation or fluid injection occurs. The first three layers represent various caprock materials, with each differing in its mechanical and strength parameters. The yellow layer indicates “Caprock 1”, the cyan layer represents “Caprock 2”, the pink layer denotes “Caprock 3”, the light purple layer is the model base, and the outlined oval shape represents the “Reservoir” itself. Each color corresponds to a distinct geological layer within the model, showcasing the stratification and composition of the subsurface materials.
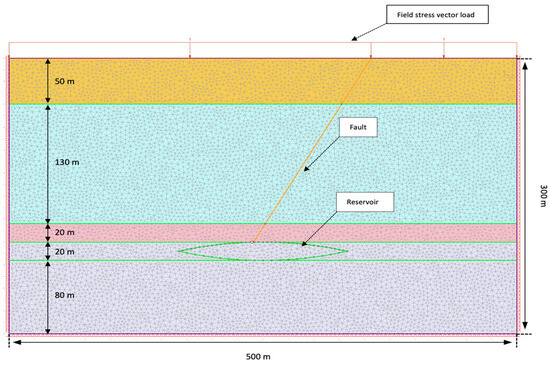
Figure 3.
The constructed 2D model of the considered CO2 storage site.
According to Rinaldi et al. [22], the In Salah storage site is located at a depth of between 1800 and 1820 m. This water-filled reservoir contains approximately 4 million tons of carbon dioxide, which was injected through three horizontal injection wells, each spanning lengths of between 1 and 1.5 km. The model spans an area of 20 × 4 km and is divided into four hydrogeological formations. Moreover, the model includes the design of a fault and its connection to an injection well. Additionally, as outlined in Table 6, the geomechanical properties were determined based on well log analysis, with depth adjustments being made to suit the geological model.

Table 6.
Geomechanical properties of CO2 storage (Rinaldi et al. [22]).
Table 6.
Geomechanical properties of CO2 storage (Rinaldi et al. [22]).
| Depth (m) | Young’s Modulus E (GPa) | Poisson’s Ratio ν (-) |
|---|---|---|
| 0–900 | 3 | 0.25 |
| 900–1650 | 5 | 0.3 |
| 1650–1780 | 2 | 0.3 |
| 1780–1800 | 20 | 0.25 |
| 1800–1820 | 10 | 0.2 |
| 1820–4000 | 15 | 0.3 |
Table 7 illustrates the compiled material properties of the different caprock layers, as adapted from the case study.

Table 7.
Material properties of the simulated CO2 storage model.
Table 7.
Material properties of the simulated CO2 storage model.
| Material Properties | Caprock 1 | Caprock 2 | Caprock 3 | Reservoir | Basement | |
|---|---|---|---|---|---|---|
| Geometry | Depth in the model of In Salah (m) | 900–1650 | 1650–1780 | 1780–1800 | 1800–1820 | 1820–4000 |
| Depth in simulated 2D model (m) | 0–50 | 50–180 | 180–200 | 200–220 | 220–300 | |
| Initial conditions | Unit weight (MN/m3) | 0.027 | ||||
| Porosity value | 0.5 | |||||
| Stiffness | Poisson’s ratio | 0.3 | 0.3 | 0.25 | excavated | 0.3 |
| Young’s modulus (MPa) | 5000 | 2000 | 20,000 | excavated | 15,000 | |
| Strength | Failure criterion | Mohr-Coulomb | ||||
| Material type | Plastic | |||||
| Peak tensile strength (MPa) | 0.05 | 0.08 | 0.01 | excavated | 0 | |
| Peak friction angle (degrees) | 22 | 25 | 37 | excavated | 35 | |
| Peak Cohesion (MPa) | 1.7 | 5.8 | 7.5 | excavated | 12.1 | |
3.3. Numerical Simulation of the In Situ State of the Model
The numerical simulation of stress distribution under initial conditions, and prior to the excavation of the pressurization chamber, is presented in Figure 4. The color gradient from blue to red illustrates variations in the vertical stress (Sigma YY), with stress increasing with depth, as indicated in the legend. A set of monitoring points along both vertical and inclined paths was considered to more accurately analyze the changes in stress and displacement fields. Figure 4 shows contours illustrating the variations in vertical stress as a function of depth within the simulated caprock layers.
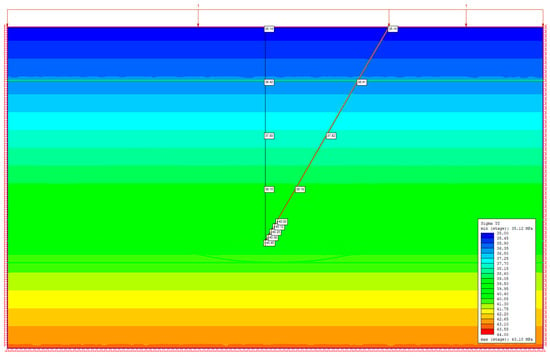
Figure 4.
Variation of vertical stress distribution within the model under in situ conditions.
Following this process, the considered internal pressurization chamber was excavated within the model, as illustrated in Figure 5, after which 40 MPa of internal pressure was applied to achieve the original equilibrium within the model and before the CO2 pressurization cycles. This internal pressurization level was extracted from the results presented in Figure 4. This internal pressurization (after relaxation of the stress field due to chamber excavation) led to a redistribution of stress, particularly around the fault zone and the surrounding reservoir. Overall, the model equilibrium state was achieved with acceptable accuracy before the simulation of CO2 injection cycles. As shown in Figure 5a, the system progressively reached equilibrium under the applied pressure, demonstrating how fluid injection influences stress patterns within the fault zone and the adjacent rock formations.
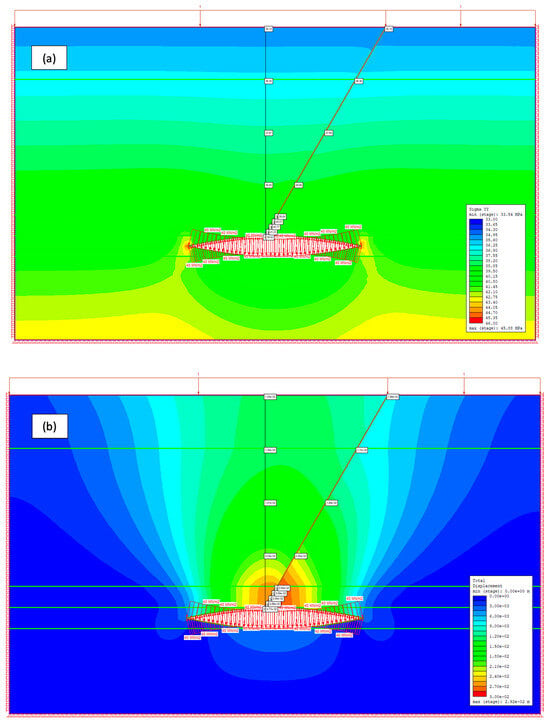
Figure 5.
Initial model equilibrium stage prior to CO2 pressurization cycles: (a) vertical stress (σyy) contours; (b) total displacement contours.
To further analyze the effects of pressure variations, a base case scenario was established with an injection pressure of 42 MPa and a fault cohesion of 3.5 MPa. The results indicated significant stress redistribution, particularly in the fault zone, suggesting its high sensitivity to pressure fluctuations. Figure 6 presents the total displacement and stress distribution seen under the base case conditions, highlighting the critical role of precise pressure control in preventing unintended fault reactivation.
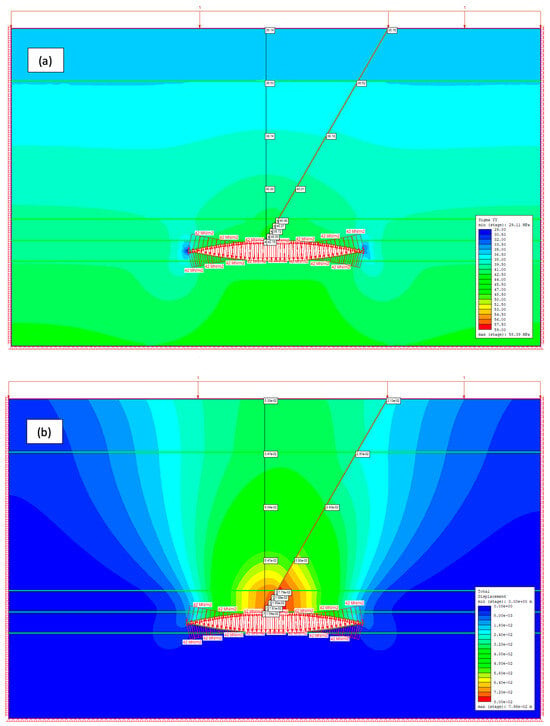
Figure 6.
Stress distribution and fault displacement in the base case scenario analysis: (a) vertical stress (σyy) distribution; (b) total displacement contours.
3.4. Simulation Analysis and Verification of the Proposed Weighting Methodology
After constructing the model, a parametric study was carried out to evaluate the impact of varying injection pressures and fault strength parameters on caprock integrity and, in particular, fault activation. The examination focused on five distinct cases, with specific values assigned for both injection pressure and fault properties. To evaluate the validity of the proposed weighting methodology, two geomechanical parameters were selected, and their role was evaluated numerically. Table 8 presents the variation of injection pressure from the base case injection pressure value (42 MPa). The simulation explores variations in injection pressure within ±10% while maintaining constant fault cohesion. Table 9 illustrates the variation of fault cohesion by ±20% while under a constant injection pressure of 42 MPa.

Table 8.
Simulation parameters of injection pressure with constant fault cohesion (3.5 MPa).

Table 9.
Simulation parameters of fault cohesion with constant injection pressure (42 MPa).
Accordingly, five sets of numerical analyses were conducted to validate the results obtained from the weighting methodology. As illustrated in the bar chart in Figure 2, injection pressure was expected to have the greatest impact on fault displacement, while fault cohesion was anticipated to have a lesser effect. This understanding is crucial for accurately assessing geomechanical responses under different CO2 storage conditions, highlighting the need to carefully consider the influence of the top-ranked parameters in the evaluation process. Therefore, during the simulation, 10 monitoring points were selected: points 1–5 on the hanging wall of the fault and points 6–10 on the footwall, in order to observe and compare how the two selected parameters affected the total displacement.
According to Figure 7 and Table 10, it is evident that increasing and decreasing the injection pressure, while keeping the cohesion constant, directly increases the displacement around the reservoir. At an initial pressure of 37.8 MPa, the displacements range from 0.1 to 0.2 m, with slightly higher values being observed on the footwall. When the injection pressure increases to 42.0 MPa, the hanging wall shows a slight decrease in displacement, whereas the footwall values remain relatively unchanged. However, at the highest pressure level of 46.2 MPa, displacement uniformly increases to 0.3 m across all monitoring points, indicating the pronounced sensitivity of the fault structure to elevated injection pressures. This suggests that the geomechanical response is primarily triggered by the degree of increased pressure within the storage site. In addition, a displacement of 7.16–7.93 cm in the base case might be acceptable in some contexts and concerning in others. To determine the response’s significance for a particular CO2 storage project, a detailed site-specific analysis is essential.
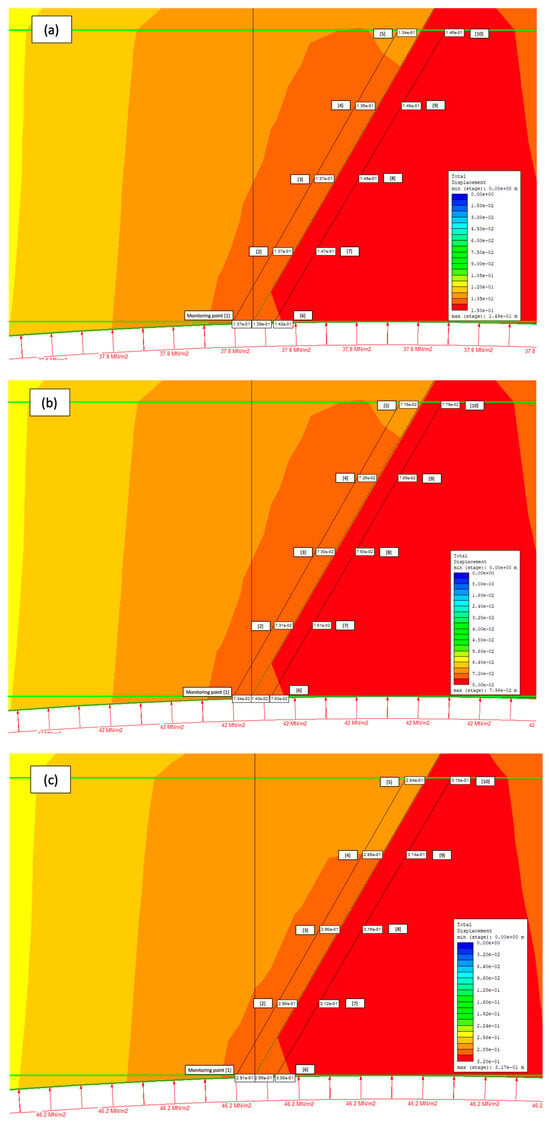
Figure 7.
Computed displacement field in the fault-reservoir zone with varying injection pressure and constant fault cohesion: (a) P = 37.8 MPa, (b) P = 42 MPa (base case), and (c) P = 46.2 MPa.

Table 10.
Impact of injection pressure on total displacement at constant fault cohesion.
Figure 8 and Table 11 present the total displacement values under conditions where fault cohesion varies by ±20%, while maintaining a constant injection pressure of 42 MPa. The displacement values on both the hanging wall (0.07 m) and the footwall (0.08 m) remain constant across all cohesion cases, further confirming that changes in fault cohesion have a negligible effect on fault displacement under steady injection pressure. Therefore, the results indicate that within the specified range of cohesion variation, the mechanical stability of the fault-reservoir system is predominantly influenced by the injection pressure rather than by cohesion.
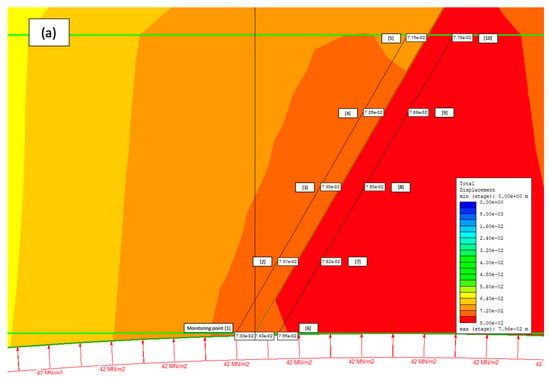
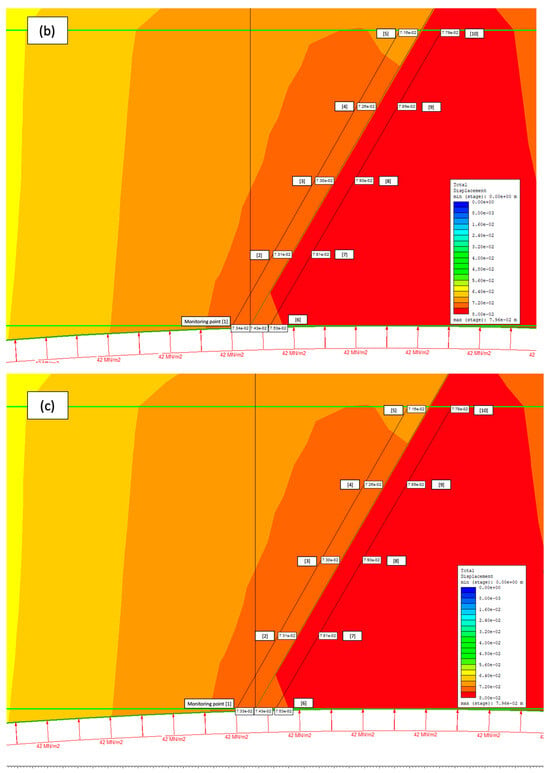
Figure 8.
Total displacement in the fault-reservoir zone with varying fault cohesion and constant injection pressure: (a) fault cohesion = 2.8 MPa, (b) fault cohesion = 3.5 MPa (base case), and (c) fault cohesion = 4.2 MPa.

Table 11.
Impact of fault cohesion on total displacement at a constant injection pressure.
This study supports the hypothesis that geomechanical parameters critical to CO2 storage can be quantified for their relative importance and reliability using the analytical hierarchy process (AHP) method. The simulations validated the assumption that the weighting methodology used is effective and that the results are consistent with expectations. The application of AHP in this context can significantly improve geomechanical risk assessment, which is critical for the planning and safety of CO2 storage projects. By identifying and understanding the relative importance of these parameters, this approach allows for the development of safer and more efficient storage strategies.
Moreover, the insights gained through parameter prioritization can directly inform operational decisions such as pressure control during injection, optimal well placement relative to fault structures, and the targeted monitoring of parameters with the greatest influence on fault stability.
From a policy perspective, this methodology provides a structured framework that could support the development of performance-based regulations for site selection, injection limits, and long-term monitoring plans, ultimately contributing to more robust and adaptive CO2 storage governance.
4. Conclusions
In summary, this research introduces a weighting methodology intended to rank geomechanical parameters by their significance during CO2 storage. This study represents a comprehensive investigation into how various geomechanical parameters influence the stability of geological formations during CO2 storage. The importance of injection pressure as a critical factor was emphasized, underscoring its high significance, followed by permeability and porosity; these play pivotal roles in assessing storage capacity and the dynamics of fluid flow within the reservoir. Conversely, while fault cohesion is considered the least influential factor, it should not be overlooked due to its potential impact on fault stability under certain conditions.
The application of the analytic hierarchy process (AHP) represents a significant advancement in CO2 storage research. AHP enhances the assessment of geomechanical risks, contributing to better planning and operational safety in CO2 storage projects. By focusing on significant factors and their interactions, engineers and geologists can improve CO2 injection and containment approaches, thereby minimizing the risks and enhancing storage site integrity. Numerical modeling supports the hypothesis that injection pressure directly influences total displacement, while fault cohesion has a minimal effect. This insight is essential for optimizing injection strategies and minimizing the geomechanical risks associated with CO2 storage.
Nevertheless, the findings of this study should be interpreted within the context of certain limitations. The methodology is primarily based on expert elicitation and numerical modeling from a single case study, which may not fully capture the complexity and variability of all CO2 storage environments. Therefore, caution should be exercised when generalizing the results for broader engineering applications.
The numerical simulation, while effective in demonstrating parameter influence, is based on a simplified 2D representation of the In Salah site. It does not explicitly account for geological heterogeneity, discontinuities within the caprock, or the geometry of real-world well paths, all of which can have critical effects on system behavior. Additionally, 2D modeling inherently limits the model’s ability to capture three-dimensional processes such as complex fault geometries, plume migration, and caprock deformation, which are critical for accurate geomechanical assessments.
To enhance the robustness and generalizability of the proposed framework, future research should incorporate synthetic cases with contrasting geological features and uncertainty considerations. Full 3D coupled hydro-mechanical simulations should be explored in future studies to better reflect subsurface complexity and provide more realistic insights into system behavior under varying stress and injection conditions. Furthermore, extended simulations across multiple geological contexts and long-term monitoring are recommended to validate the model outputs and refine the parameter weighting procedures under dynamic, real-world storage conditions.
While this study examined injection pressure and fault cohesion, future research should also assess other key parameters, such as permeability, pore pressure, and tensile strength, both individually and in combination. Incorporating uncertainty quantification methods like Latin hypercube sampling or Monte Carlo simulations would further improve the robustness and reliability of the modeling framework. These steps, although beyond the scope of the current study, are critical for advancing real-world applicability.
Author Contributions
Conceptualization, A.M. and D.Z.; methodology, D.Z. and A.M.; validation, D.Z. and A.M.; formal analysis, D.Z.; writing—original draft preparation, D.Z.; writing—review and editing, D.Z. and A.M.; supervision, A.M.; project administration, A.M.; funding acquisition, A.M. All authors have read and agreed to the published version of the manuscript.
Funding
The funding was provided by Nazarbayev University as part of the FDCRG 2023-2025 (Grant ID 55431188) small grant research project.
Data Availability Statement
The data presented in this study are available on request due to ethical from the corresponding author.
Acknowledgments
The authors gratefully acknowledge the funding provided by Nazarbayev University as part of the FDCRG 2023-2025 (Grant ID 55431188) small grant research project.
Conflicts of Interest
The authors declare no conflicts of interest.
References
- Ringrose, P.; Mathieson, A.; Wright, I.; Selama, F.; Hansen, O.; Bissell, R.C.; Saoula, N.; Midgley, J. The In Salah CO2 Storage Project: Lessons Learned and Knowledge Transfer. Energy Procedia 2013, 37, 6226–6236. [Google Scholar] [CrossRef]
- Dumitrache, L.N.; Suditu, S.; Ghețiu, I.; Pană, I.; Brănoiu, G.; Eparu, C. Using Numerical Reservoir Simulation to Assess CO2 Capture and Underground Storage, Case Study on a Romanian Power Plant and Its Surrounding Hydrocarbon Reservoirs. Processes 2023, 11, 805. [Google Scholar] [CrossRef]
- Song, Y.; Jun, S.; Na, Y.; Kim, K.; Jang, Y.; Wang, J. Geomechanical Challenges during Geological CO2 Storage: A Review. Chem. Eng. J. 2023, 456, 140968. [Google Scholar] [CrossRef]
- Li, X.; Li, Q.; Bai, B.; Zhao, J.; Yuan, W. The Geomechanics of Shenhua Carbon Dioxide Capture and Storage (CCS) Demonstration Project in Ordos Basin, China. J. Rock Mech. Geotech. Eng. 2016, 8, 948–966. [Google Scholar] [CrossRef]
- Eyinla, D.S.; Oladunjoye, M.A.; Gan, Q.; Olayinka, A.I. Fault Reactivation Potential and Associated Permeability Evolution under Changing Injection Conditions. Petroleum 2021, 7, 282–293. [Google Scholar] [CrossRef]
- Guglielmi, Y.; Nussbaum, C.; Cappa, F.; De Barros, L.; Rutqvist, J.; Birkholzer, J. Field-Scale Fault Reactivation Experiments by Fluid Injection Highlight Aseismic Leakage in Caprock Analogs: Implications for CO2 Sequestration. Int. J. Greenh. Gas Control 2021, 111, 103471. [Google Scholar] [CrossRef]
- Cerasi, P.; Stroisz, A.; Sønstebø, E.; Stanchits, S.; Øye, V.; Bauer, R.A. Experimental Investigation of Injection Pressure Effects on Fault Reactivation for CO2 Storage. Int. J. Greenh. Gas Control 2018, 78, 218–227. [Google Scholar] [CrossRef]
- Khan, S.; Khulief, Y.A.; Al-Shuhail, A.A.; Bashmal, S.; Iqbal, N. The Geomechanical and Fault Activation Modeling during CO2 Injection into Deep Minjur Reservoir, Eastern Saudi Arabia. Sustainability 2020, 12, 9800. [Google Scholar] [CrossRef]
- Pan, P.; Wu, Z.; Feng, X.; Yan, F. Geomechanical Modeling of CO2 Geological Storage: A Review. J. Rock Mech. Geotech. Eng. 2016, 8, 936–947. [Google Scholar] [CrossRef]
- Rutqvist, J. The Geomechanics of CO2 Storage in Deep Sedimentary Formations. Geotech. Geol. Eng. 2012, 30, 525–551. [Google Scholar] [CrossRef]
- Rutqvist, J.; Cappa, F.; Mazzoldi, A.; Rinaldi, A.P. Geomechanical Modeling of Fault Responses and the Potential for Notable Seismic Events during Underground CO2 Injection. Energy Procedia 2013, 37, 4774–4784. [Google Scholar] [CrossRef]
- White, J.A.; Chiaramonte, L.; Ezzedine, S.M.; Foxall, W.; Ye, H.; Ramirez, A.; McNab, W.W. Geomechanical Behavior of the Reservoir and Caprock System at the In Salah CO2 Storage Project. Proc. Natl. Acad. Sci. USA 2014, 111, 8747–8752. [Google Scholar] [CrossRef] [PubMed]
- Zappone, A.; Rinaldi, A.P.; Grab, M.; Wenning, Q.; Roques, C.; Madonna, C.; Obermann, A.; Bernasconi, S.M.; Soom, F.; Cook, P.; et al. Fault Sealing and Caprock Integrity for CO2 Storage: An In-Situ Injection Experiment. Solid Earth 2021, 12, 319–343. [Google Scholar] [CrossRef]
- Hawkes, C.D.; McLellan, P.; Bachu, S. Geomechanical Factors Affecting Geological Storage of CO2 in Depleted Oil and Gas Reservoirs. J. Can. Pet. Technol. 2005, 44, PETSOC-05-10-05. [Google Scholar] [CrossRef]
- Schimmel, M.T.W.; Liu, W.; Worrell, E. Facilitating Sustainable Geo-Resources Exploitation: A Review of Environmental and Geological Risks of Fluid Injection into Hydrocarbon Reservoirs. Earth-Sci. Rev. 2019, 194, 455–471. [Google Scholar] [CrossRef]
- Larkin, P.; Gracie, R.; Shafiei, A.; Dusseault, M.; Sarkarfarshi, M.; Aspinall, W.; Krewski, D. Risk Management in Carbon Capture and Geological Storage: Insights from a Structured Expert Elicitation. Int. J. Risk Assess. Manag. 2019, 22, 404–427. [Google Scholar] [CrossRef]
- Moore, E.J.; Karplus, V.J.; Morgan, M.G. Expert elicitation of the timing and uncertainty to establish a geologic sequestration well for CO2 in the United States. Proc. Natl. Acad. Sci. USA 2023, 121, e2307984120. [Google Scholar] [CrossRef]
- Saaty, R.W. The Analytic Hierarchy Process-What It Is and How It Is Used. Math. Model. 1987, 9, 161–176. [Google Scholar] [CrossRef]
- Zheng, F.; Jahandideh, A.; Jha, B.; Jafarpour, B. Geologic CO2 Storage Optimization under Geomechanical Risk Using Coupled-Physics Models. Int. J. Greenh. Gas Control 2021, 110, 103385. [Google Scholar] [CrossRef]
- Li, H. Advancing “Carbon Peak” and “Carbon Neutrality” in China: A Comprehensive Review of Current Global Research on Carbon Capture, Utilization, and Storage Technology and Its Implications. ACS Omega 2023, 8, 42086–42101. [Google Scholar] [CrossRef]
- Urpi, L.; Rinaldi, A.P.; Rutqvist, J.; Cappa, F.; Spiers, C.J. Dynamic Simulation of CO2-Injection-Induced Fault Rupture with Slip-Rate Dependent Friction Coefficient. Geomech. Energy Environ. 2016, 7, 47–65. [Google Scholar] [CrossRef]
- Rinaldi, A.P.; Rutqvist, J.; Finsterle, S.; Liu, H. Inverse Modeling of Ground Surface Uplift and Pressure with iTOUGH-PEST and TOUGH-FLAC: The Case of CO2 Injection at In Salah, Algeria. Comput. Geosci. 2017, 108, 98–109. [Google Scholar] [CrossRef]
Disclaimer/Publisher’s Note: The statements, opinions and data contained in all publications are solely those of the individual author(s) and contributor(s) and not of MDPI and/or the editor(s). MDPI and/or the editor(s) disclaim responsibility for any injury to people or property resulting from any ideas, methods, instructions or products referred to in the content. |
© 2025 by the authors. Licensee MDPI, Basel, Switzerland. This article is an open access article distributed under the terms and conditions of the Creative Commons Attribution (CC BY) license (https://creativecommons.org/licenses/by/4.0/).