Abstract
To address the problem of flow-induced resonance in the valve core assembly of a pilot-operated molten salt regulating valve in a concentrated solar thermal power generation molten salt energy storage system under high pressure differential and high flow rate conditions, the flow-induced vibration characteristics of the pilot-operated molten salt regulating valve were analyzed using computational fluid dynamics (CFD) and fluid–structure interaction modal analysis. The vibration characteristics of the valve core assembly under the excitation force of the molten salt medium were analyzed using the harmonic response method, and the influence of different parameters on the valve core assembly’s vibration characteristics was studied. The results show that under typical operating openings, the first six modal frequencies of the valve core motion assembly are not close to the fluid excitation frequency, indicating that flow-induced resonance does not occur. The maximum vibration stress and displacement of the valve core assembly decrease with increasing damping ratio. With increasing pressure differential, the maximum stress and maximum amplitude of the valve core assembly increase. By changing the valve stem constraint conditions, the vibration stress of the valve core assembly can be reduced. This study provides a reference for the design of flow-induced vibration suppression for pilot-operated molten salt regulating valves and provides guidance for the safe operation of concentrated solar thermal power generation molten salt regulating valves under high pressure differential and high flow rate conditions.
1. Introduction
In the context of the “dual carbon” era, the development of low-cost, environmentally friendly new energy to replace traditional fossil energy is of great significance to alleviating the greenhouse effect [1,2]. As a clean and efficient power generation method, solar thermal power generation mainly generates electricity in the form of a tower. Its working principle is to reflect sunlight onto the absorber of the heat absorption tower through a reflector, heating the working medium, binary nitrate, in the absorber. The heated molten salt enters the steam generation system, heats the low-temperature steam in the heat exchanger, and then drives the steam turbine to generate electricity [3]. The high-temperature molten salt regulating valve is a key component of the heat absorption tower and energy storage system. It is installed at the outlet of the absorber and before and after the hot salt tank [4]. It undertakes multi-stage pressure reduction and heat regulation functions and ensures stable operation of the system by controlling the pressure difference and flow. The flow chart of the solar thermal power generation system is shown in Figure 1. Under such large pressure difference and high flow rate conditions, the flow-induced vibration of the valve core movement component of the molten salt regulating valve is easily induced, and resonance is induced in severe cases. Therefore, conducting research on the flow-induced vibration of the valve core assembly of the pilot-operated molten salt regulating valve (hereinafter referred to as the “molten salt regulating valve”) is of great significance to ensuring the safe operation of the tower-type solar thermal power generation system.
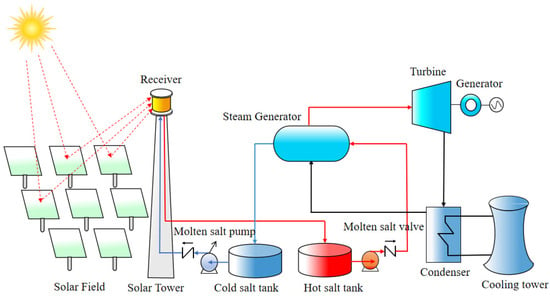
Figure 1.
Flow chart of solar thermal power generation system.
Most of the vibrations of control valves are caused by flow-induced vibrations, which are mainly due to the significant influence of the valve core structure on the flow field characteristics, thereby generating unstable flow and causing the overall vibration of the valve. References [5,6,7] revealed the mechanism of valve core vibration caused by unstable flow in the valve and analyzed the noise and vibration characteristics of the valve. Domnick et al. [8] found that there were high-speed jets, impact layers, and shear layers at the throttling point of the control valve core, which led to vibration damage to the valve core. The pressure fluctuations caused by turbulence were solved by using a scale adaptive method. Li et al. [9] analyzed the frequency spectrum of the valve core vibration signal under different working conditions and found that the valve core vibration was caused by oil pressure fluctuations and turbulence of the liquid system. Xu Dongtao et al. [10] used the average lift and turbulent pressure pulsation during the vortex shedding process of the flow field to obtain the frequency spectrum information of the flow field flow-induced vibration and concluded that the flow-induced vibration in the flow field is the main reason for inducing flow-induced resonance and flow-induced noise of the control valve. Zhang Xian et al. [11] analyzed and discussed the flow characteristics of the control valve under low-flow conditions and studied the flow field excitation force that can cause flow-induced vibration of the control valve by using the velocity power spectrum density. References [12,13] used the FSI method to simulate the vibration characteristics of a sleeve-type control valve, studied the interaction mechanism between the medium and the valve core vibration, and analyzed the vibration characteristics of the valve stem and valve core at different valve openings. References [14,15], based on the flow-induced resonance theory and fluid–structure coupling method, analyzed the flow-induced vibration of the valve core assembly at different openings to address the problem of valve vibration in conventional nuclear power island systems.
Current research on flow-induced vibration of control valves mainly focuses on the vibration mechanism caused by complex flows within control valves for ordinary media, as well as the analysis of flow-induced resonance under different operating conditions. It does not address the problem of severe flow-induced vibration within the valve caused by the special medium, molten salt, nor the study of the vibration characteristics of the valve core assembly. Therefore, based on the fluid–structure coupling analysis method and the harmonious response analysis method, this paper conducts an analysis of the flow-induced resonance and harmonious response vibration characteristics of the valve core assembly of a molten salt control valve. The vibration response law of the valve core assembly and the influence of different parameters on the vibration of the molten salt control valve are studied. This can provide a reference for the study of flow-induced vibration suppression of molten salt control valves and ensure the safe operation of molten salt control valves in solar thermal power plants under large pressure differentials and high flow rates.
2. Numerical Modeling and Simulation Methodology
2.1. Molten Salt Regulating Valve Structure Model
Pilot-operated control valves are structurally divided into two types: pressure-charging pilot-operated control valves and pressure-relief pilot-operated control valves. This article focuses on PN40 and DN50 pressure-relief pilot-operated molten salt control valves with equal percentage flow characteristics. The performance parameters are shown in Table 1.

Table 1.
Performance parameters of molten salt regulating valves.
Before the numerical simulation, the spring structure was ignored, given its minimal impact on the flow of molten salt within the valve. Furthermore, small structural features such as chamfers and fillets were rationally simplified without affecting the numerical simulation results. The completed three-dimensional solid model is shown in Figure 2. The valve primarily consists of the valve body, valve stem, valve seat, pilot valve core, main valve core, and labyrinth sleeve. The structural dimensions of the main components are shown in Table 2.
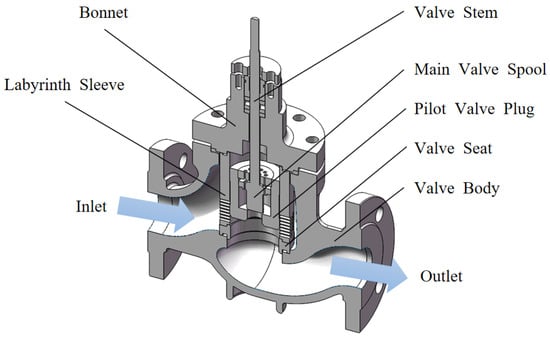
Figure 2.
3D solid model of the molten salt regulating valve.

Table 2.
Structural dimensions of the main components of the molten salt regulating valve.
2.2. Flow Channel Model Establishment and Mesh Division
Based on the three-dimensional solid model, the ANSYS 2022R1 DM module was used to establish the flow domain model inside the molten salt regulating valve at openings of 10%, 15%, 20%, 30%, 40%, 50%, 60%, and 70%. In order to accurately simulate the flow field inside the regulating valve, pipes with lengths of 2 times the nominal size and 6 times the nominal size were connected before and after the molten salt regulating valve, respectively [16]. Taking the molten salt regulating valve with an opening of 10% as an example, its flow domain model is shown in Figure 3.
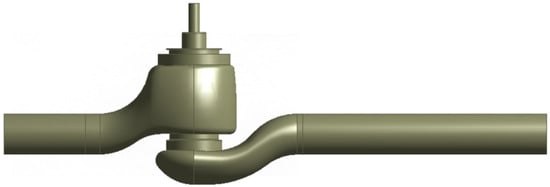
Figure 3.
Flow basin model of molten salt regulating valve with 10% opening.
The molten salt regulating valve flow domain model was meshed using an adaptive meshing and local refinement approach. The mesh primarily employed a hybrid of tetrahedral and hexahedral elements. The valve body’s main channel was meshed with tetrahedral elements. Local refinement was performed at the sleeve opening and at locations with mesh transitions, using different mesh sizes. Taking the molten salt regulating valve at 10% opening as an example, the inlet flow rate and average outlet flow velocity calculated using different mesh sizes were compared and analyzed, as shown in Figure 4. Considering accuracy and time efficiency, a mesh size of 2.89 million was used for flow field calculations. After meshing, a rigorous mesh quality check revealed that the orthogonal quality was greater than 0.1, the skewness was less than 0.9, and the average orthogonal quality was 0.81. This mesh fully met the requirements for flow field analysis. The meshing method for the regulating valve flow domain model at other openings remained consistent. The resulting 10% flow domain mesh for the molten salt regulating valve is shown in Figure 5.
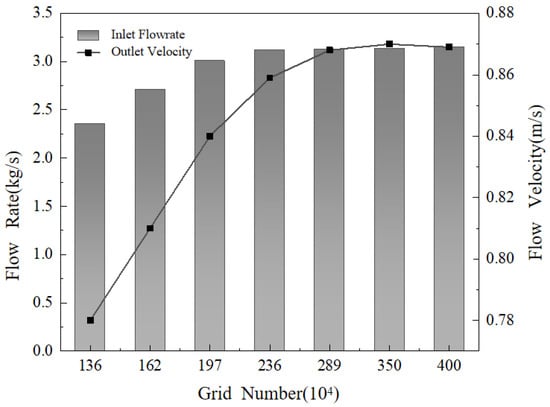
Figure 4.
Grid independence comparison chart.
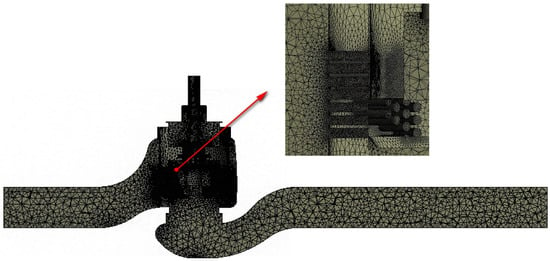
Figure 5.
Grid model of the watershed with molten salt regulating valve at 10% opening.
2.3. Flow Field Simulation Theory
In flow field analysis, turbulent flow has randomness and complexity, so numerical calculation has become the main research method. Numerical calculation methods can be divided into two categories: direct numerical simulation and indirect numerical simulation. Among them, indirect numerical simulation includes large eddy simulation (LES), discrete vortex method (DVM), and Reynolds average method (RANS). The latter has become the most widely used method due to the difficulty of solving the instantaneous N-S equation. The eddy viscosity model under the RANS framework has become popular in engineering due to its advantages of “high computational accuracy and low time cost”. According to the number of equations, the methods can be divided into zero equation, single equation, and two equation models: the zero equation model is suitable for simple flow, the single equation model describes turbulent dynamics through a single equation, and the two equation model can more comprehensively characterize turbulent characteristics through two key parameters (such as turbulent kinetic energy k and turbulent dissipation rate ε), which is the mainstream choice in actual engineering. Based on this, this paper uses the Realizable k-ε model with two equations to numerically simulate the flow in the control valve. Its theoretical equation is as follows [17]:
- (1)
- Turbulent kinetic energy k equation:
- (2)
- Turbulence dissipation rate ε equation:where C1 = max[0.43,η/(η + 5)]; η = Sk/ε; S is the modulus of the average strain rate tensor; C2 = 1.9,σk = 1.0; σε = 1.2; Gk is the generation term of k.
2.4. Boundary Condition Setting
Pressure boundary conditions were used at the inlet and outlet, with an inlet pressure of 3 MPa and no-slip walls. To ensure convergence, a steady-state flow field calculation was first performed. The steady-state results were then used as initial values for the transient calculation, and the transient flow field of the molten salt regulating valve at different openings was calculated. The reference pressure was set to 0.1 MPa absolute. In practical applications, the primary vibration excitation of molten salt regulating valves comes from low-frequency pulsations of the pipeline fluid. A time step of 0.001 s is sufficient to characterize these low-frequency-dominated macroscopic vibration trends, meeting the research objectives of this paper. From the perspective of computational efficiency, the computational cost of transient CFD analysis is significantly negatively correlated with the time step. The flow field structure of the molten salt regulating valve is complex, and comparative analysis of multiple operating conditions is required. Using a smaller time step, such as 0.0001 s, would significantly increase the computational workload and extend the simulation cycle within a total calculation time of 0.5 s. Selecting a time step of 0.001 s, within a total computation time of 0.5 s, ensures the accuracy of macroscopic flow field characteristics (such as pressure distribution trends and major pulsation frequencies) while significantly reducing the computational load, enabling efficient implementation of multiple operating conditions. In summary, the 0.001 s time step, combined with a total computation time of 0.5 s, effectively balances computational accuracy and efficiency while meeting the research objective of capturing macroscopic vibration patterns, ensuring the smooth progress of the research. Therefore, this paper sets a time step of 0.001 s and a total computation time of 0.5 s. A two-equation Realizable k-ε phase turbulence model is employed, and the flow field within the valve is solved using the Coupled Solution method. A high-resolution format is used for the discretization of the flow terms and turbulence equations, and the RMS method is used for the iterative convergence governing equations, with an accuracy of 1 × 10⁻⁴. The medium in the valve is binary molten salt (chemical composition: 60% NaNO3 + 40% KNO3), and its physical properties are shown in Table 3.

Table 3.
Physical properties of high-temperature molten salt.
2.5. Model Validation
According to the completed calculation settings of the flow field inside the molten salt regulating valve, the reliability of the numerical simulation is verified. Therefore, by establishing the same pipeline model as that in the literature [18], the calculation method of the flow field inside the molten salt regulating valve is used to calculate the resistance coefficient Cd and the Strouhal number St and compare them with the Cd and St obtained from the experiment in the literature. The specific results are shown in Table 4. As can be seen from the table, the error between the calculation results and the results in the literature is very small, both within 1%, with a high degree of consistency, thus verifying the accuracy of the flow field calculation of the molten salt regulating valve.

Table 4.
Model accuracy verification.
2.6. Results Analysis
2.6.1. Transient Flow Analysis
Taking the pressure, velocity, and velocity vorticity cloud diagrams of the molten salt regulating valve at 10%, 30%, 50%, and 70% opening at 0.25 s as an example, the fluid flow characteristics of the valve from 10% to 70% opening are studied, as shown in Figure 6, Figure 7 and Figure 8, respectively.
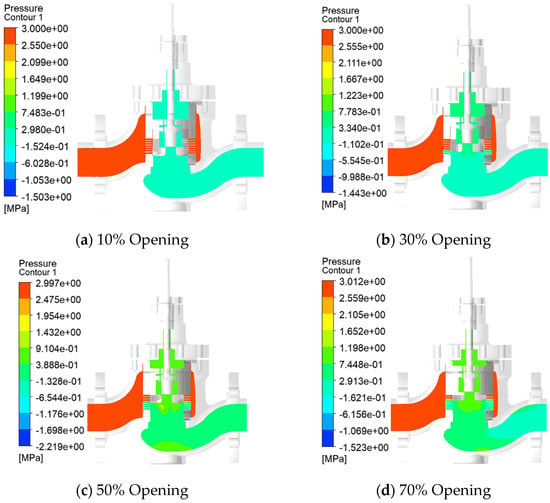
Figure 6.
Transient calculated pressure distribution of the molten salt regulating valve at 0.25 s.
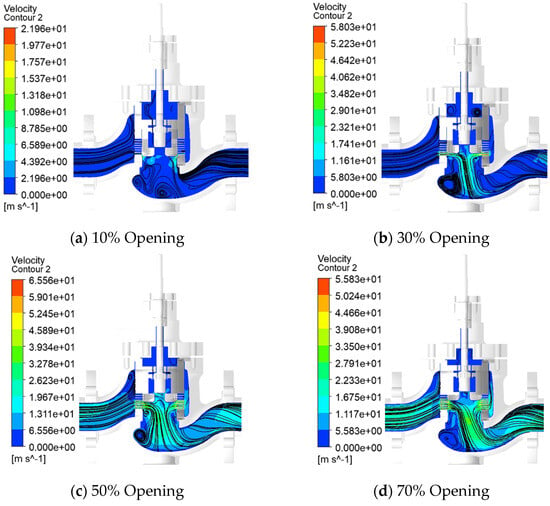
Figure 7.
Transient calculated velocity distribution of the molten salt regulating valve at 0.25 s.
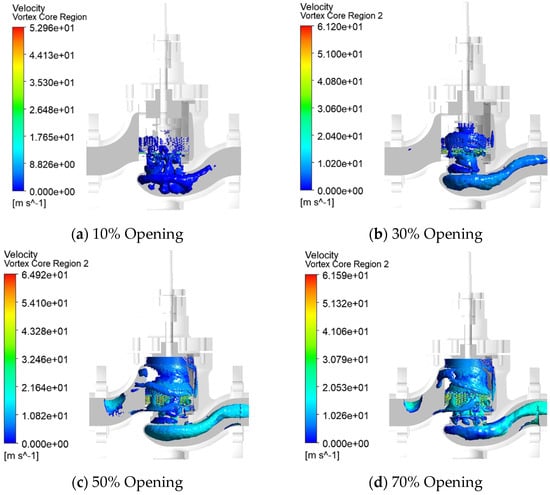
Figure 8.
Transient calculated velocity vortex distribution of the molten salt regulating valve at 0.25 s.
It can be seen from Figure 6, Figure 7 and Figure 8 that when the opening of the molten salt regulating valve increases from 10% to 70%, the local high-pressure area in the pilot valve cavity increases with the increase in the opening, mainly at the bottom of the valve cavity and the connection between the main valve core and the pilot valve core. As the opening increases, the fluid resistance decreases, and the pressure in the throttling area of the pilot valve cavity and the main flow channel after the valve gradually increases. At the same time, as the opening increases, the pressure difference between the pilot valve cavity and the valve after gradually increases; the maximum flow rate is always distributed in the sleeve and the throttling part of the valve core, while the minimum flow rate is distributed in the gap between the valve plug and the valve stem. There is always a vortex phenomenon in the upper cavity of the pilot valve core and the bottom of the valve cavity, and the vortex intensity gradually weakens with the increase in the opening. This is because the flow area of the valve cavity gradually increases with the increase in the opening, but the throttling effect of the sleeve and the valve core is still significant. At this point, vortices are primarily distributed in the upper chamber of the pilot valve core and at the bottom of the valve cavity. However, the widening of the flow path reduces the mainstream velocity gradient, gradually shrinking the spatial distribution of the vortices and weakening the overall disturbance, a phenomenon known as “gradual weakening of the vortex intensity.” At 70% valve opening, no significant vortices exist within the valve cavity, indicating that the flow is relatively stable. The maximum velocity in the vortex core region is located at the inlet of the throttling orifice and increases first and then decreases with increasing valve opening. The vortex core velocity is minimum at 10% opening, reaching 52.96 m/s, and maximum at 50% opening, reaching 64.92 m/s. The enhanced entrainment of high-speed fluid through the orifice causes a temporary increase in the local kinetic energy of the vortex core region, a phenomenon known as “increased vortex core velocity.” However, the vortex’s range of influence has significantly shrunk compared to the 10% opening. From 50% to 70% valve opening, the flow area increases significantly with increasing valve opening, significantly reducing fluid resistance and maintaining a relatively stable flow. At this time, the spatial distribution range of the vortex is further reduced, and even disappears in most areas of the valve cavity, that is, “the vortex intensity continues to weaken”; at the same time, the flow velocity at the throttling hole decreases due to the increase in the flow area, and the suction power of the vortex core is weakened, resulting in “the maximum velocity of the vortex core area decreasing.”
2.6.2. Fluid Excitation Frequency Analysis
It can be seen from the flow field calculation results that the bottom of the main valve core is an area with large pressure changes. Therefore, in order to obtain the pressure pulsation data information of the valve core motion component of the molten salt regulating valve, the contact parts of the main valve core and the pilot valve core with the medium are set as pressure pulsation monitoring surfaces, as shown in Figure 9.
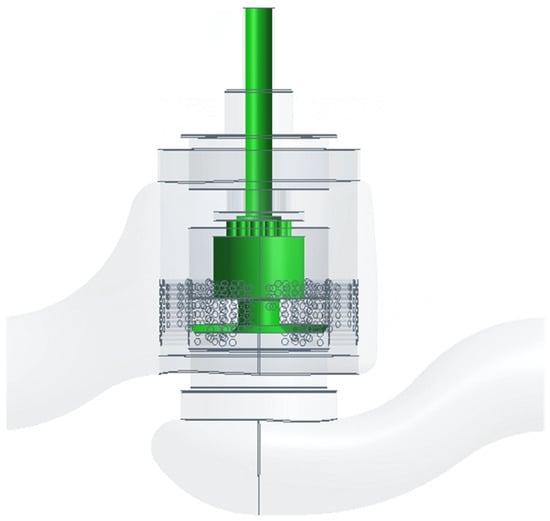
Figure 9.
Distribution diagram of pressure pulsation monitoring surface of molten salt regulating valve.
According to transient calculation results, the flow rate within the valve stabilizes after 0.005 s, indicating fully developed turbulent flow. As the opening increases, the flow field motion stabilizes. Therefore, the pressure pulsation monitoring results for the transient flow field calculation after 0.005 s are used to analyze the pressure pulsation characteristics of the molten salt regulating valve. This includes three aspects of analysis: time domain, frequency domain, and peak value.
- (1)
- Time domain analysis of pressure pulsation
In order to ensure the accuracy of time domain analysis, eliminate the influence of flow on valve core pressure pulsation, and facilitate comparative analysis of pressure pulsation characteristics under different openings, the transient pressure is dimensionlessly processed and the pressure pulsation coefficient Cp [19] is introduced, which is defined as follows:
where p0 is the inlet pressure of the regulating valve; p1 is the static pressure on the valve core monitoring surface at different times; ρ and u are the average flow velocity and average density at the inlet of the regulating valve, respectively.
The time domain curves of the pressure pulsation inside the valve of the valve core assembly under the fully developed turbulent state at different openings of the regulating valve are obtained through transient flow field calculation, as shown in Figure 10.
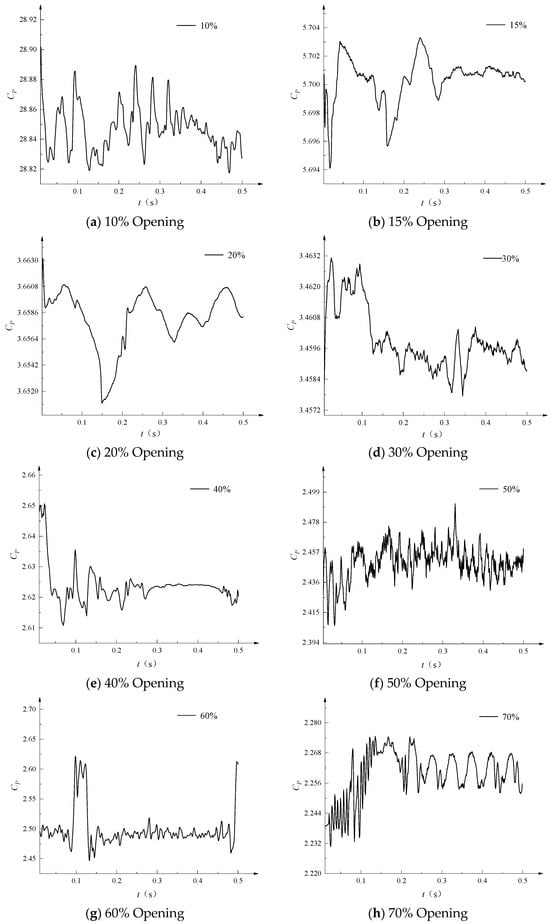
Figure 10.
Time domain distribution of pressure pulsation on the valve core monitoring surface at different openings of the molten salt regulating valve.
As shown in Figure 10, as the valve opening increases, the pressure inside the valve fluctuates within a certain range over time, exhibiting strong turbulent pulsation characteristics. The maximum pressure pulsation coefficient is 28.92 at 10% opening, 5.70 at 15% opening, 2.66 at 20% opening, 2.46 at 30% opening, 2.65 at 40% opening, 2.48 at 50% opening, 2.63 at 60% opening, and 2.27 at 70% opening. The above analysis shows that the pressure pulsation coefficient is maximum at a 10% opening. This is because at this opening, due to the small flow area, the fluid forms a high-speed jet at the throttling point, which induces a significant backflow vortex inside the valve cavity. At the same time, the backflow vortex interacts strongly with the valve cavity wall, exacerbating local pressure fluctuations and, in turn, maintaining a high pressure pulsation coefficient (Cp) at this opening. As the molten salt regulating valve opening increases, the pressure pulsation coefficient tends to stabilize at around 2.5.
- (2)
- Pressure pulsation frequency domain analysis
Time domain analysis can provide a preliminary analysis of pressure pulsation information, but under the same parameters, time domain analysis often cannot meet the requirements. Therefore, the pressure pulsation signal is further processed using frequency domain analysis. Through fast Fourier transform, the frequency domain curve of the pressure pulsation coefficient of the valve core monitoring surface at different openings is obtained, as shown in Figure 11.
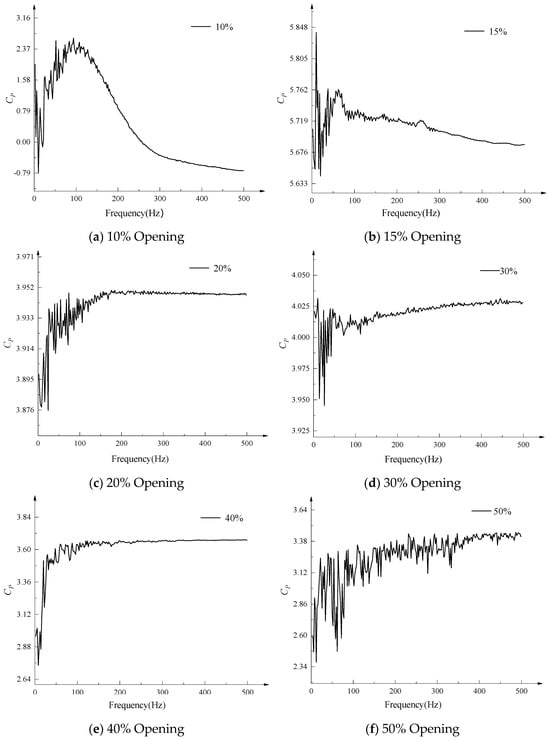
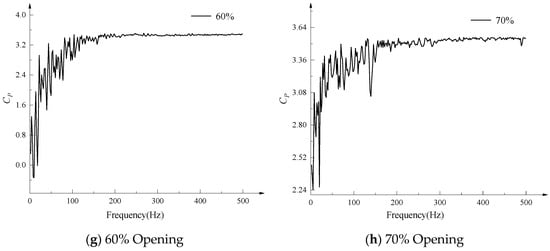
Figure 11.
Frequency domain distribution of pressure pulsation on the valve core monitoring surface at different openings of the molten salt regulating valve.
As shown in Figure 11, at a 10% opening, the pressure pulsation coefficient first increases and then decreases, fluctuating dramatically between 0 Hz and 100 Hz. The amplitude of the pressure pulsation coefficient spectrum fluctuates significantly. After 100 Hz, it gradually decreases with increasing frequency before stabilizing. The excitation force frequency is primarily within 200 Hz. At a 15% opening, the pressure pulsation fluctuation range is primarily within 100 Hz, with the dominant frequency around 15 Hz. The amplitude of the pressure pulsation coefficient spectrum fluctuates significantly within 100 Hz. At a 20% opening, the pressure pulsation ranges from 0 Hz to 200 Hz, with the amplitude of the pressure pulsation coefficient spectrum fluctuating significantly. At this time, the dominant frequency is primarily around 100 Hz. At a 30% opening, the pressure pulsation ranges from 0 Hz to 100 Hz, with the amplitude of the pressure pulsation coefficient spectrum fluctuating significantly. The dominant frequency is primarily around 24 Hz. At 40% opening, pressure pulsation occurs within the range of 0 Hz to 100 Hz, with the amplitude of the pressure pulsation coefficient spectrum fluctuating significantly. This fluctuation is slightly weaker than at 30% opening, and the dominant frequency is primarily within 50 Hz. At 50% opening, pressure pulsation occurs within the range of 0 Hz to 5000 Hz, with the amplitude of the pressure pulsation coefficient spectrum fluctuating significantly, including multiple peaks within 100 Hz. Compared to other openings, the pressure pulsation coefficient spectrum exhibits distinct narrowband and broadband characteristics, demonstrating a strong random nature. At 60% opening, pressure pulsation occurs within the range of 0 Hz to 200 Hz, with multiple peaks and a dominant frequency primarily around 50 Hz. At 70% opening, pressure pulsation occurs within the range of 0 Hz to 150 Hz, with the amplitude of the pressure pulsation coefficient spectrum fluctuating significantly, similar to the pressure pulsation spectrum curve at 60% opening.
- (3)
- Pressure pulsation peak analysis
Frequency domain analysis of pressure pulsation on the spool monitoring surface at different openings of the molten salt control valve reveals that, with increasing opening, the pressure pulsation on the spool surface does not increase or decrease linearly but rather exhibits periodic fluctuations, as shown in Figure 12. The figure shows that, with increasing opening, the pressure pulsation on the spool surface does not increase or decrease linearly but rather exhibits periodic fluctuations. The maximum main frequency of pressure pulsation is primarily at 60% opening, reaching a maximum of 3.07 MPa, and the fluctuations are very intense. At 50% opening, the pressure pulsation fluctuations persist until 400 Hz, then gradually stabilize, exhibiting the largest frequency range compared to other openings. At 10% and 15% openings, the pressure pulsation amplitude remains relatively stable, with little change. However, after 20%, pressure pulsation peaks begin to appear, and the number of excitation frequency maxima gradually increases, reaching the highest number at 60% opening. This indicates that at 60% opening, the flow instability within the control valve is most intense, while at 70% opening, the pressure pulsation fluctuations are on a decaying trend.
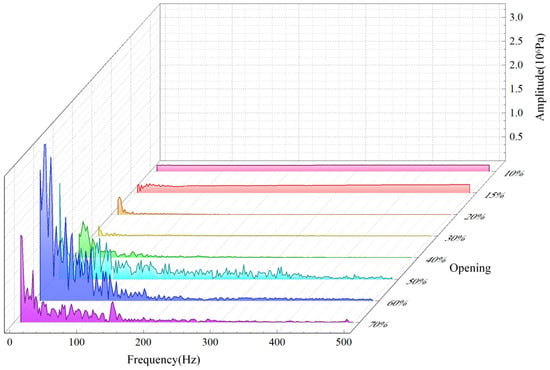
Figure 12.
Frequency domain distribution of pressure pulsation at different openings of the molten salt regulating valve.
Based on the frequency domain distribution of pressure pulsation at different openings of the molten salt regulating valve, the main peak value of pressure pulsation at each opening was extracted to quantify the intensity characteristics of the fluid excitation force at different openings. The extracted pressure pulsation peak distribution is shown in Figure 13.
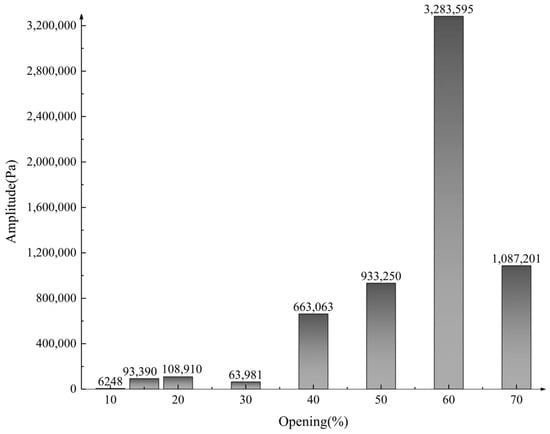
Figure 13.
Pressure pulsation peak distribution diagram of molten salt regulating valve at different openings.
As shown in Figure 13, the maximum pressure pulsation peak is 3,283,595 Pa, and the minimum is 6247.9 Pa. As the opening increases, the pressure pulsation peak has two peaks, at 20% and 60% openings. The peak at 60% opening varies significantly compared to 50% and 70% openings, indicating that at 60% opening of the control valve, the pressure pulsation fluctuates violently and the valve core assembly is subjected to a large excitation force. The pressure pulsation peak of the control valve at 20% opening varies very little compared to 15% and 30% openings, indicating that the pressure pulsation is less severe at this time. Overall, the pressure pulsation peaks at different openings of the control valve show a trend of first increasing and then decreasing.
3. Analysis of Flow-Induced Vibration of Valve Core Assembly
3.1. Fluid–Structure Coupling Modal Analysis
3.1.1. Fluid–Structure Coupling Model Establishment and Meshing
The constructed 3D model of the molten salt regulating valve was imported into the ANSYS Workbench 2022R1 DM module. Reverse modeling was used to generate a model of the valve’s internal fluid domain and define the coupling surface of the valve core assembly’s fluid domain. The resulting fluid–structure interaction numerical analysis model for the molten salt regulating valve is shown in Figure 14.
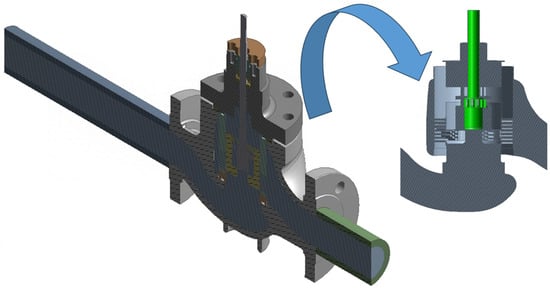
Figure 14.
Fluid–structure coupling model of the molten salt regulating valve.
To simplify the calculation, the solid domain model of the molten salt regulating valve is simplified. The mass concentration method is used to superimpose the spring mass on the pilot valve core. That is, it is simplified to a linear system of valve stem, pilot valve core, and spring (the pilot valve core is connected to the main valve core through a spring with a spring stiffness coefficient of 28 N/mm and a damping coefficient of 0.1), as shown in Figure 15.
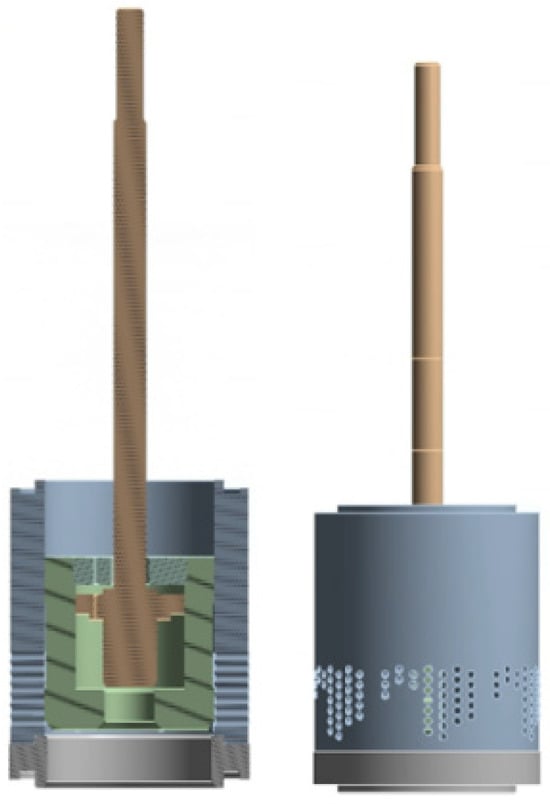
Figure 15.
Simplified schematic diagram of the valve core assembly.
Taking the meshing of a 10% opening valve core assembly as an example, the fluid domain meshing method and mesh data are consistent with those used in flow field simulation analysis. The valve core assembly is meshed using adaptive meshing and local mesh control techniques. The mesh is primarily tetrahedral, and the sleeve drainage holes are meshed with surface mesh refinement. To improve the accuracy of the calculation results, the mesh independence of the molten salt regulating valve core assembly was verified, as shown in Table 5. As the number of mesh elements increases, the maximum stress value increases accordingly. When the number of mesh elements increases from 204,963 to 335,614, the maximum stress value increases from 171.65 MPa to 190.25 MPa, a 9.78% increase. When the number of mesh elements increases from 335,614 to 471,624, the maximum stress value increases from 190.25 MPa to 203.63 MPa, a 6.56% increase. When the number of mesh elements increases from 471,624 to 567,251, the maximum stress value increases from 203.63 MPa to 204.56 MPa, a 0.46% increase. When the number of mesh elements increases from 567,251 to 601,256, the maximum stress value increases from 204.56 MPa to 204.89 MPa, a 0.16% increase. Taking into account both the calculation accuracy and the calculation cost, a smaller number of cells with a maximum stress value difference of no more than 1% was selected for numerical simulation [20]. The number of grid cells was finally determined to be 471,624 and the number of grid nodes was 798,163 as the grid model of the regulating valve core assembly, as shown in Figure 16.

Table 5.
Grid independence test of molten salt regulating valve core assembly.
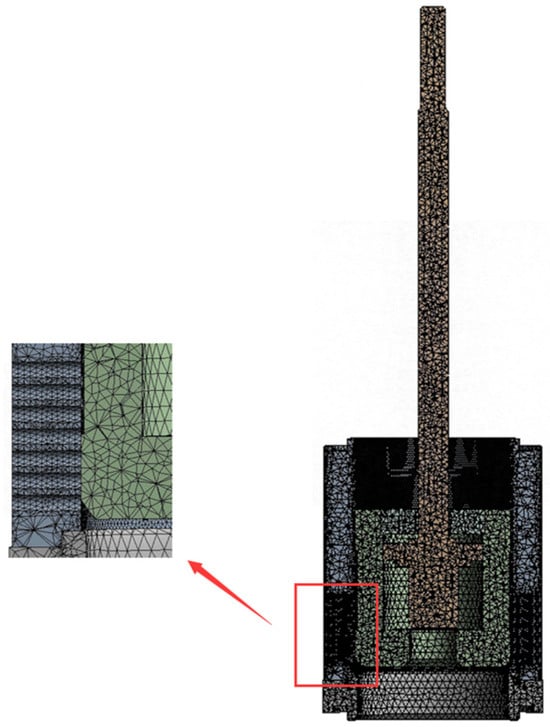
Figure 16.
Grid model of the spool assembly of the molten salt regulating valve.
3.1.2. Material Performance Parameters
The material parameters of the valve core assembly were obtained according to reference [21], as shown in Table 6.

Table 6.
Physical performance parameters of molten salt regulating valve core assembly materials.
3.1.3. Fluid–Structure Interaction Modal Analysis Calculation Theory
The theoretical equation for the thermal-fluid–solid coupling modal analysis of the molten salt regulating valve is as follows [22]:
- (1)
- Governing equations of fluid-induced solid vibration and displacement:
- (2)
- Coupling control equations:
- (3)
- Modal equation with prestress:where Ms is the mass matrix of the structure, Cs is the damping matrix of the structure, Ks is the stiffness matrix of the structure, τs and τf are the solid stress and fluid stress of the fluid–solid coupling surface, rs and rf are the solid displacement and fluid displacement of the fluid–solid coupling surface, qs and qf are the solid and fluid heat flow rates of the fluid–solid coupling surface, Ts and Tf are the solid and fluid temperatures of the fluid–solid coupling surface, S is the stress stiffness matrix, ωi is the i-th order natural frequency of the structure, and {φi} is the i-th order formation vector of the structure.
3.1.4. Modal Analysis
Based on the flow field analysis, the flow field calculation results of the valve core assembly coupling surface are first loaded into the temperature field for calculation, and then the temperature field and flow field results are loaded into the static analysis module for calculation. Finally, based on the static analysis results, coupled with the modal analysis module, the Lanczons method is used to analyze the natural frequency of the valve core assembly [23]. By solving the 50th order mode, its mass participation ratio reaches above 0.86, and the result is considered reliable at this time.
- (1)
- Modal vibration analysis
The vibration characteristics of the system can be determined by modal analysis. The linear combination of each order natural vibration mode is used to represent the vibration mode of the structure. However, the vibration characteristics of the system are usually determined by the low-order natural frequencies, and the external excitation is mostly low-frequency excitation. Therefore, when performing modal analysis, only focusing on low-order frequencies can meet actual engineering needs [24]. Based on this, taking 10% opening as an example, the first six modes and vibration mode characteristics of the valve core component are selected for analysis. The specific results are shown in Figure 17.
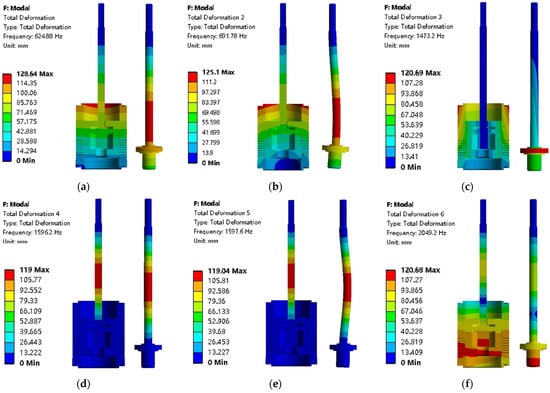
Figure 17.
The first six modes and vibration shapes of the spool assembly of the molten salt regulating valve at 10% opening. (a) First-order mode and vibration shape. (b) Second-order mode and vibration shape. (c) The third mode and vibration shape. (d) 4th-order mode and vibration shape. (e) The fifth mode and vibration shape. (f) 6th mode and vibration shape.
As shown in Figure 17, the first-order natural frequency of the valve core assembly is 624.88 Hz, the vibration mode of the valve stem is mainly manifested as the valve stem swinging back and forth in the horizontal direction, and the violent vibration part is mainly in the middle and lower part of the valve stem; the second-order natural frequency of the valve core assembly is 691.78 Hz, the vibration mode of the valve stem is mainly manifested as the valve stem swinging left and right in the horizontal direction, and the violent vibration part is mainly in the middle and lower part of the valve stem; the third-order natural frequency of the valve core assembly is 1473.20 Hz, the vibration mode of the valve stem is mainly manifested as the valve stem swinging back and forth in the horizontal direction, and the violent vibration part is mainly the pressure plate; the fourth-order natural frequency of the valve core assembly is 1596.20 Hz, the vibration mode of the valve stem is mainly manifested as the valve stem swinging up and down in the vertical direction, and the violent vibration part is mainly in the middle section of the valve stem; the fifth-order natural frequency of the valve core assembly is 1597.60 Hz, the vibration mode of the valve stem is mainly manifested as the valve stem swinging back and forth in the horizontal direction, and the violent vibration part is mainly in the middle section of the valve stem; the sixth-order natural frequency of the valve core assembly is 2049.20 Hz, the vibration mode of the valve stem is mainly manifested as the valve stem swinging up and down in the vertical direction, and the violent vibration part is mainly at the valve core.
- (2)
- Comparative analysis of different opening modes
As the opening of the molten salt control valve changes, the load on the valve core assembly also changes. This load change affects the vibration characteristics of the valve core assembly, causing changes in the natural frequency and mode shape. Therefore, based on the wet modal analysis method, modal analysis of the control valve core assembly was conducted at openings of 10%, 15%, 20%, 30%, 40%, 50%, 60%, and 70%. The first six modal frequencies at different openings are shown in Table 7.

Table 7.
Modal frequencies of valve core components at different openings of the molten salt regulating valve.
As shown in Table 7, when the opening of the regulating valve increases from 10% to 70%, the modal frequencies of each order increase with the increase in the modal order; the 3rd- to 5th-order modal frequencies all reach their minimum values at an opening of 40%. According to the vibration mode of the valve core assembly, the most intense vibration location is in the middle section of the valve stem.
3.2. Flow-Induced Resonance Analysis
The range of 0.8 to 1.2 times the excitation frequency of the pressure pulsation of the molten salt regulating valve is called the resonance zone [25]. When the natural frequency of the valve core assembly is within the resonance zone, flow-induced resonance will occur, and in severe cases, the valve core assembly will break. According to the pressure pulsation frequency domain distribution diagram at different openings obtained by calculating the transient flow field of the regulating valve, it can be seen that with the increase in the opening, the pressure pulsation fluctuation gradually increases and the excitation frequency of the peak point gradually approaches the natural frequency. Therefore, based on the transient calculation results and modal calculation results of the flow field at 40%, 50%, 60%, and 70% openings of the regulating valve, the flow-induced resonance analysis of the valve core motion assembly of the molten salt regulating valve is carried out by extracting the frequency of the peak point of the frequency domain spectrum. By comparing and analyzing the main frequency of the fluid excitation and the modal frequency, it is determined whether the valve core assembly will have flow-induced resonance, as shown in Figure 18. In order to further study the flow-induced resonance of the molten salt regulating valve, by drawing a comparison diagram of the natural frequency and the maximum frequency of the flow-induced resonance, the numerical difference of the frequency distribution of the valve core assembly under typical working conditions is deeply analyzed, as shown in Figure 19.
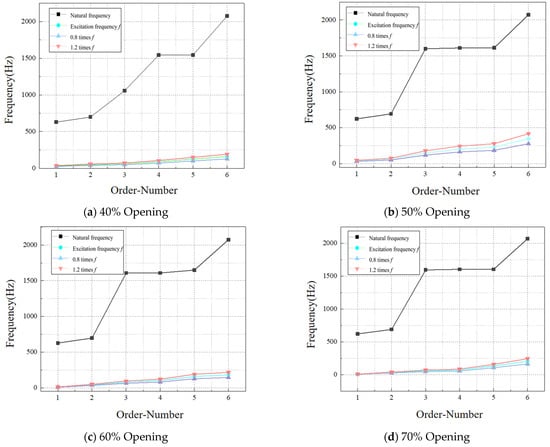
Figure 18.
Analysis of flow-induced resonance of valve core assembly at 40% to 70% opening.
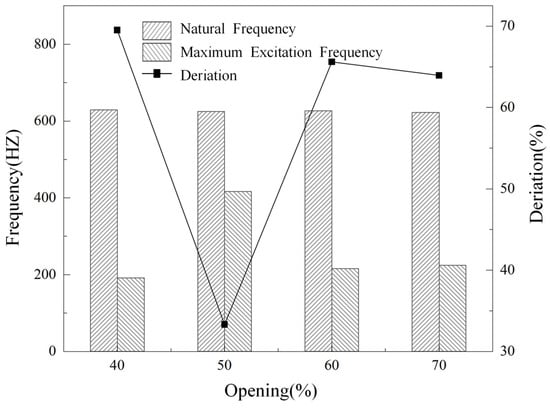
Figure 19.
Comparison of the natural frequency of the valve core assembly and the maximum frequency of flow-induced resonance at 40% to 70% opening.
As shown in Figure 19, at a 40% valve opening, the maximum excitation frequency caused by turbulent flow is 191.63 Hz, which differs by 69.53% from the first-order natural frequency of the valve core motion component. At a 50% valve opening, the maximum excitation frequency is 416.73 Hz, which differs by 33.31% from the first-order natural frequency of the valve core motion component. At a 60% valve opening, the maximum excitation frequency is 215.57 Hz, which differs by 65.61% from the first-order natural frequency of the valve core motion component. At a 70% valve opening, the maximum excitation frequency is 224.31 Hz, which differs by 63.94% from the first-order natural frequency of the valve core motion component. In summary, when the molten salt control valve has an opening of 40% to 70%, the low-order modal frequencies of the valve core component are far away from the fluid excitation frequency resonance region, and flow-induced resonance does not occur.
3.3. Analysis of Vibration Response Characteristics
To further investigate the vibration characteristics of the pilot-operated control valve’s spool assembly under the influence of molten salt pressure pulsation, a harmonic response vibration stress analysis of the molten salt control valve was conducted. Frequency domain analysis of the spool’s pressure pulsation revealed significant fluctuations in the 0 Hz to 200 Hz range at 50% to 60% valve opening. Therefore, based on the frequency domain distribution of pressure pulsation within the valve, a modal superposition method was used to analyze the harmonic response vibration stress of the spool’s motion components at 50% and 60% valve openings.
Vibration analysis is performed by extracting the stress and amplitude of the valve core assembly in the X, Y, and Z directions, as shown in Figure 20.
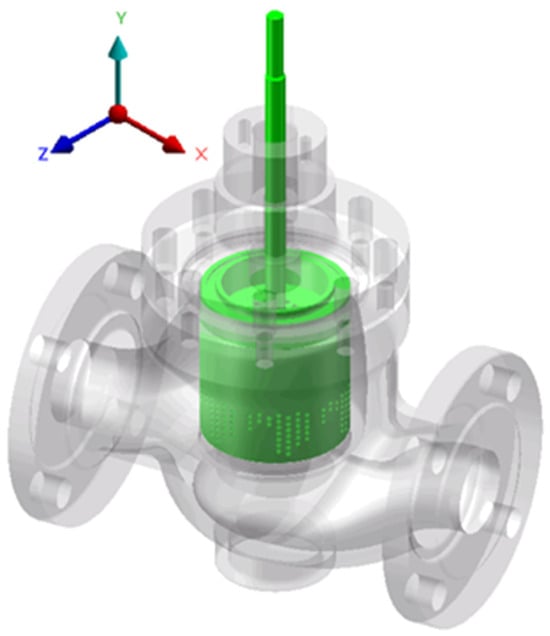
Figure 20.
Schematic diagram of the spool assembly of the molten salt regulating valve in the X, Y, and Z directions.
Based on the harmonic response analysis results, stress and amplitude distribution curves in three directions at two openings were plotted, as shown in Figure 21. Figure 21a shows that the Y-direction vibration stress of the valve core assembly reaches its maximum at both 50% and 60% openings, with values of 8.86 × 10⁻⁶ MPa and 3.26 × 10⁻⁸ MPa, respectively. The stress fluctuation at 50% opening is significantly higher than at 60% opening. Figure 21b shows that the Z-direction amplitude is maximum at 50% opening, with a value of 1.32 × 10⁻⁶ mm, while the Y-direction amplitude is maximum at 60% opening, with a value of 1.33 × 10⁻⁸ mm. The most dramatic amplitude fluctuation occurs at 50% opening. In summary, when the molten salt regulating valve is at 50% opening, the damage to the valve core assembly caused by the drastic change in amplitude is more prominent. In practical applications, long-term continuous operation of the molten salt regulating valve at this opening should be avoided as much as possible to reduce vibration damage. At the same time, the selection of the valve core assembly material can be optimized based on the stress characteristics under this working condition, thereby achieving a limited extension of the valve core assembly’s service life.
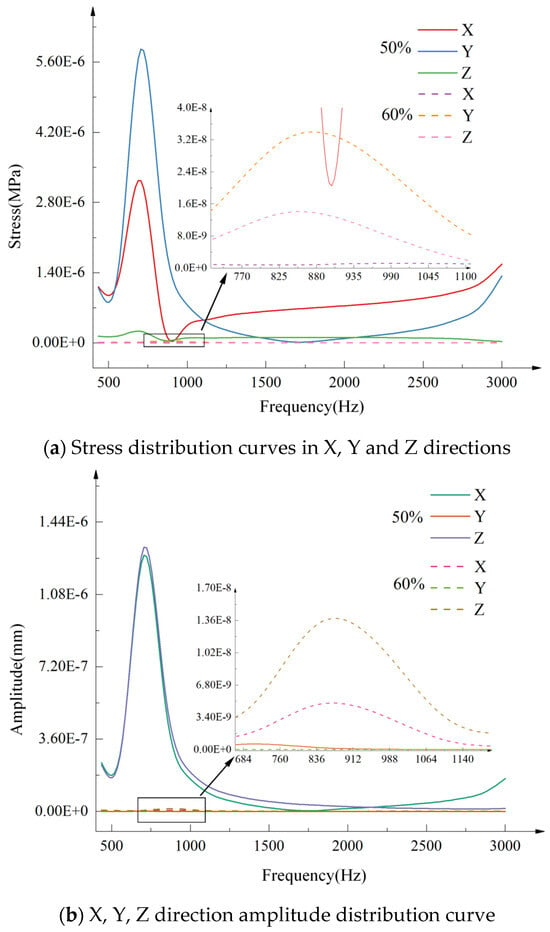
Figure 21.
Response distribution curves in the X, Y, and Z directions of the valve core assembly at 50% and 60% opening.
3.4. Effects of Different Parameters on the Vibration Characteristics of the Valve Core Assembly
The main vibration source of the spool motion component of the molten salt regulating valve comes from the pressure pulsation caused by the throttling part inside the valve. In order to study the influence of different parameters on the vibration of the regulating valve, it can be seen from the results of harmonic response analysis that the vibration of the molten salt regulating valve at 50% opening is relatively severe. Therefore, taking the 50% opening of the molten salt regulating valve as an example, the influence of different damping ratios, different pressure differences, and constraint conditions on the vibration characteristics of the valve core component are studied.
3.4.1. Influence of Different Damping Ratios
Molten salt control valves typically exhibit damping in their actual structures. Therefore, during simulation analysis, damping parameters must be set to simulate the vibration damping effects of the actual system. This approach aims to adjust the vibration amplitude so that the simulated vibration response curve more closely resembles actual operating conditions, enabling more accurate prediction of the dynamic response of the molten salt control valve. The damping ratio of a structure is typically set between 0.01 and 0.1. However, in complex, practical operating environments, the damping characteristics of molten salt control valves are influenced by a combination of factors, and the typical damping ratio fluctuates depending on specific operating conditions and structural design. For this reason, this study selected a damping ratio range of 0.01 to 0.1. This range offers significant advantages: it fully encompasses the damping ratio range expected for molten salt valve core components in actual engineering applications, and by providing a gradient setting within this range, it clearly demonstrates the varying effects of different damping levels on vibration characteristics. To further explore the relationship between changes in damping ratio and valve core vibration stress and displacement, this study systematically conducted correlation analysis within the range of 0.01 to 0.1, clarifying the vibration response characteristics of the valve core assembly at different damping levels. This research finding has important practical application value and can directly provide guidance to engineers, helping them improve the vibration performance of valve core assemblies by manipulating damping characteristics during the actual design process. Based on the above research ideas, this study selected damping ratios of 0.01, 0.03, 0.05, 0.07, and 0.1 for calculations. Based on the calculation results, the vibration stress and displacement of the valve core assembly were selected for comparative analysis, as shown in Figure 22.
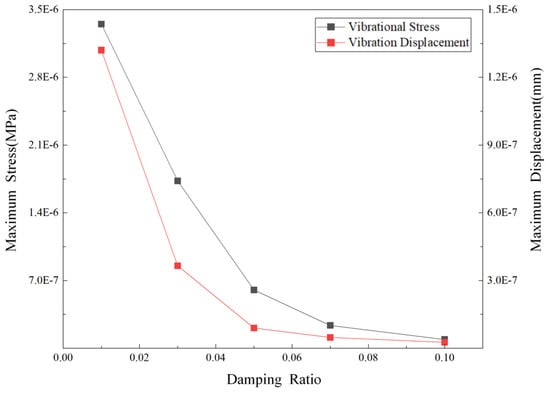
Figure 22.
Maximum stress and displacement versus damping ratio.
Figure 22 shows that the maximum stress and maximum displacement of the control valve core assembly decrease with increasing damping ratio. When the damping ratio increases from 0.01 to 0.03, the maximum vibration stress and maximum displacement of the valve core assembly decrease by 48.36% and 72.50%, respectively. When the damping ratio increases from 0.03 to 0.05, the maximum vibration stress and maximum displacement of the valve core assembly decrease by 65.14% and 75.45%, respectively. When the damping ratio increases from 0.05 to 0.07, the maximum vibration stress and maximum displacement of the valve core assembly decrease by 60.86% and 46.65%, respectively. When the damping ratio increases from 0.07 to 0.10, the maximum vibration stress and maximum displacement of the valve core assembly decrease by 61.74% and 44.56%, respectively. In summary, as the damping ratio gradually increases, the maximum vibration stress of the valve core assembly maintains a significant downward trend, while the decline in the maximum vibration displacement gradually decreases, that is, the decline is more significant in the early stage and slows down in the later stage. In summary, this study can provide a basis for the material selection, parameter design, and structural optimization of the spring of the spool assembly of the molten salt regulating valve by quantifying the relationship between the damping ratio and the vibration characteristics. It can not only control the vibration stress and displacement of the valve core by regulating the spring damping characteristics and reduce problems such as valve core fatigue damage caused by vibration but also avoid the cost increase and dynamic response performance degradation caused by blindly selecting high-damping springs and ultimately achieve a safe and stable operation and economic balance of the molten salt regulating valve in the pipeline.
3.4.2. Influence of Different Average Flow Rates
Based on the flow field analysis results, the pressure pulsation vibration characteristics at different average flow rates were numerically simulated and calculated, and the stress and amplitude of the valve core component at different average flow rates were obtained, as shown in Figure 23.
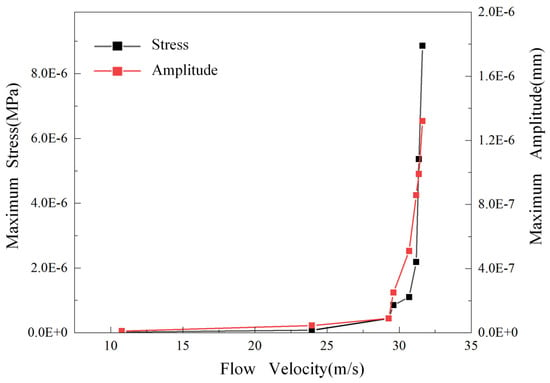
Figure 23.
Stress and amplitude changing with pressure difference.
Figure 23 shows that as the average flow rate of the molten salt medium within the valve increases, the maximum vibration stress of the valve core assembly increases, and the maximum amplitude also gradually increases. At an average flow rate of 31.19 m/s, both stress and amplitude experience a sudden increase. This corresponds to a 50% opening of the regulating valve, which is consistent with the results of flow-induced resonance analysis. According to vibration theory, when the excitation frequency approaches but does not enter the resonance region, the structural dynamic response is amplified due to the “frequency proximity effect”: the energy coupling efficiency between the excitation force and the structural inherent characteristics is significantly improved compared to the farther-away region, resulting in a sudden increase in stress and amplitude. However, this enhancement effect is essentially a gradient amplification of the dynamic response, which is fundamentally different from the “precise frequency matching leading to a sharp divergence in amplitude” required for resonance. The pressure pulsation excitation frequency approaches the first-order natural frequency of the structure, thus triggering violent vibration. Therefore, the following pattern can be derived: as the average flow rate increases, the maximum stress and maximum amplitude change in a similar manner, both increasing with increasing flow rate.
3.4.3. The Influence of Constraints
In order to explore the influence of different constraints on the vibration of the valve core assembly, three different constraints were applied based on the results of the harmonic response vibration stress analysis to calculate the vibration stress and amplitude of the pilot valve core and valve stem. Constraint 1 is the reference group, which is the valve stem boundary condition during the wet modal analysis, that is, a cylindrical constraint is applied to the valve stem head. Constraint 2 applies a cylindrical constraint in the form of a contact surface based on constraint 1, that is, it is applied to the contact areas between the valve stem, the valve cover, and the packing. Constraint 3 increases the friction torque provided to the valve stem by the drive device based on constraint 1. Based on the above three constraints, the vibration analysis of the valve core assembly was carried out, and the obtained stress and amplitude change curves are shown in Figure 24.
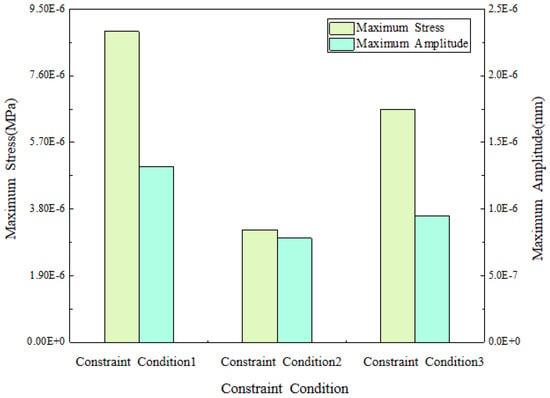
Figure 24.
Maximum stress and maximum amplitude changing with constraint conditions.
As shown in Figure 24, the maximum vibration stress and amplitude of the valve core assembly gradually decrease with the increase in constraints. Under constraint 2, the maximum stress and amplitude of the valve core assembly decrease by 63.8% and 40.9%, respectively. Under constraint 3, the maximum stress and amplitude of the valve core assembly decrease by 24.9% and 28.0%, respectively. Therefore, under constraint 2, the amplitude and stress of the valve core assembly are significantly reduced. Compared with constraint 3, changing the valve stem constraint can effectively reduce vibration. In summary, in engineering practice, systematically improving the valve stem contact constraint conditions by optimizing the clearance between the valve stem and the bonnet and moderately increasing the radial clamping force of the stuffing box can effectively reduce the maximum stress and amplitude of the valve core assembly.
4. Conclusions
In order to solve the problem that molten salt regulating valves in solar thermal power generation systems are prone to flow-induced resonance under the dual working conditions of large pressure difference and high flow rate, a flow-induced vibration analysis of molten salt regulating valves was carried out based on numerical simulation methods. Computational fluid dynamics methods were used to study the fluid-induced vibration force characteristics of the valve core assembly under different openings of the molten salt regulating valve. The results were compared with the fluid-solid coupling wet modal frequency of the valve core assembly to study whether flow-induced resonance would occur in the valve core motion assembly under typical openings. The harmonic response analysis method was used to analyze the variation of the vibration response of the regulating valve core assembly with frequency. The main research conclusions are as follows:
- (1)
- As the opening of the molten salt regulating valve increases, the flow resistance of the medium in the valve decreases, the pressure in the throttling area of the sleeve and the pilot valve cavity gradually increases, the flow velocity of the medium in the valve shows an increasing trend, and vortices are formed at the bottom of the valve cavity and the top of the pilot valve cavity.
- (2)
- The time-domain stability of the valve core assembly pressure pulsation is poor within 40% opening and tends to be stable as the opening increases. Frequency-domain analysis shows that the pressure pulsation amplitude at 50% to 60% opening fluctuates greatly within the range of 0 Hz to 200 Hz. The peak characteristic shows a trend of first increasing and then decreasing, reaching a maximum value at 60% opening. The above research rules can provide a basis for determining the structural strength verification range under critical operating conditions.
- (3)
- Wet modal analysis shows that the modal frequencies of the valve core assembly increase with the order, and the third to fifth modal frequencies all reach their minimum values at 40% opening. At typical openings of 40% to 70%, the maximum excitation frequency of the valve core assembly avoids its natural frequency, and flow-induced resonance does not occur. This result provides a reference for the safe range of valve operating opening.
- (4)
- At 50% opening, the valve core assembly’s stress and amplitude fluctuate dramatically. A variable parameter study revealed that the vibration response decreases with increasing damping ratio, increases with increasing flow rate, and decreases with stronger constraints. This pattern provides guidance for improving the valve core assembly’s vibration characteristics through design methods such as structural damping optimization, flow rate control, and constraint strengthening.
This study focuses on the flow-induced vibration characteristics of the spool assembly, confirms the safety of the design, and reveals the influence of key parameters. In fact, in the pipeline control system of photothermal power generation, due to the constraint of the pipe system before and after the valve, the whole control valve will vibrate, and even the valve body will break in severe cases. In the later stage, the valve body of the molten salt regulating valve can be taken as the research object, and its vibration characteristics under different constraints and different openings can be analyzed to provide guarantee for the stable operation of the molten salt regulating valve of the photothermal power generation system.
Author Contributions
Methodology, L.Y.; Software, X.L.; Data curation, J.Z.; Writing—review & editing, Y.Z.; Supervision and data organization, S.L. All authors have read and agreed to the published version of the manuscript.
Funding
This research was funded by Gansu Provincial Department of Education:Industrial Support Plan Project: 2025CYZC-048.
Data Availability Statement
The original contributions presented in the study are included in the article, further inquiries can be directed to the corresponding author.
Conflicts of Interest
The authors declare no conflict of interest.
References
- Kim, S.; Kim, K.H.; Oh, C.; Zhang, K.; Park, J.H. Artificial photosynthesis for high-value-added chemicals: Old material, new opportunity. Carbon Energy 2022, 4, 21–44. [Google Scholar] [CrossRef]
- Yun, J.S.; Choi, S.; Im, S.H. Advances in carbon-based thermoelectric materials for high-performance, flexible thermoelectric devices. Carbon Energy 2021, 3, 667–708. [Google Scholar] [CrossRef]
- Abid, M.; Ratlamwala, T.A.H.; Atikol, U. Performance assessment of parabolic dish and parabolic trough solar thermal power plant using nanofluids and molten salts. Int. J. Energy Res. 2016, 40, 550–563. [Google Scholar] [CrossRef]
- Yang, X.; Zheng, S.; Chang, J. Research on CCHP Design and Optimal Scheduling Based on Concentrating Solar Power, Compressed Air Energy Storage, and Absorption Refrigeration. ACS Omega 2023, 8, 42126–42143. [Google Scholar] [CrossRef] [PubMed]
- Bolin, C.; Engeda, A. Analysis of flow-induced instability in a redesigned steam control valve. Appl. Therm. Eng. 2015, 83, 40–47. [Google Scholar] [CrossRef]
- Yonezawa, K.; Ogawa, R.; Ogi, K.; Takino, T.; Tsujimoto, Y.; Endo, T.; Tezuka, K.; Morita, R.; Inada, F. Flow-induced vibration of a steam control valve. J. Fluids Struct. 2012, 35, 76–88. [Google Scholar] [CrossRef]
- Zeng, L.-F.; Liu, G.-W.; Mao, J.-R.; Wang, S.-S.; Yuan, Q.; Yuan, H.; Wang, K.-G.; Zhang, J.-J.; Xu, Y.-T. Flow-induced vibration and noise in control valve. Proc. Inst. Mech. Eng. Part C J. Mech. Eng. Sci. 2015, 229, 3368–3377. [Google Scholar] [CrossRef]
- Domnick, C.B.; Brillert, D. Flow-induced steam valve vibrations—A literature review of excitation mechanisms, preventive measures, and design improvements. J. Eng. Gas Turbines Power 2019, 141, 051009. [Google Scholar] [CrossRef]
- Li, B.; Yan, J.; Zhao, Q.; He, J.; Li, R.; Liu, X. Image recognition and diagnosis for vibration characteristics of cone valve core. Adv. Mech. Eng. 2020, 12, 1687814020916389. [Google Scholar] [CrossRef]
- Xu, D.; Sui, F.; Peng, S.; Lu, Q.; Meng, X.; An, L. Research on flow-induced vibration monitoring method of multi-stage step-down control valve. Hydraul. Pneum. 2023, 47, 98–106. [Google Scholar]
- Zhang, X.; Wang, K.; Meng, W.; Zhang, H.; Zhang, L.; Yuan, W. Study on flow field characteristics of conventional island condensate regulating valve under small flow conditions. Turbine Technol. 2023, 65, 241–246+255. [Google Scholar]
- Lin, Z.; Hou, C.; Zhang, L.; Guan, A.; Jin, Z.; Qian, J. Fluid-structure interaction analysis on vibration characteristics of sleeve control valve. Ann. Nucl. Energy 2023, 181, 109579. [Google Scholar] [CrossRef]
- Wei, A.; Gao, R.; Zhang, W.; Wang, S.; Zhou, R.; Zhang, X. Computational fluid dynamics analysis on flow-induced vibration of a cryogenic poppet valve in consideration of cavitation effect. J. Zhejiang Univ.-Sci. A 2022, 23, 83–100. [Google Scholar] [CrossRef]
- Yan, B.; Jin, H.; Huang, C.; Shen, H.; Hu, Y.; Li, S. Study on flow-induced resonance of bypass control valve of conventional island turbine. Fluid Mach. 2023, 51, 27–33. [Google Scholar]
- Wang, W.; Jiang, Y.; Zhu, X.; Wang, K.; Shao, J. Study on opening design and flow-induced resonance characteristics of multi-hole sleeve regulating valve. J. Instrum. Meter 2020, 41, 169–179. [Google Scholar]
- GB/T 17213.2-2017; Industrial Process Control Valves-Part 2-1: Calculation Formula of Fluid Flow Under the Condition of Flow Capacity Installation. China Standard Press: Beijing, China, 2017.
- Wang, F. Computational Fluid Dynamics Analysis; Tsinghua University Press: Beijing, China, 2004. [Google Scholar]
- Zhao, J. Study on Heat Transfer Enhancement of Molten Salt Heat Storage and Release Process Based on Fluid-Induced Vibration. Master’s Thesis, Shandong University, Jinan, China, 2023. [Google Scholar]
- Kan, K.; Huang, J.; Zheng, Y.; Xu, H.; Chen, H. The influence mechanism of non-uniform inflow on the force of reverse power generation impeller of axial flow pump device. J. Eng. Thermophys. 2023, 44, 3261–3271. [Google Scholar]
- Yin, H. Numerical Simulation Study on Sealing Structure Optimization and Thermal Ratchet Effect of High Temperature Butterfly Valve. Master’s Thesis, Lanzhou University of Technology, Lanzhou, China, 2023. [Google Scholar]
- American Society of Mechanical Engineers Boiler and Pressure Vessel Code, Section II, Part; The American Society of Mechanical Engineers: New York, NY, USA, 2023.
- Wang, W.; Hao, J.; Liu, B.; Yang, H.; Li, S. Flow-induced resonance analysis of LNG cryogenic control valve stem. Vib. Shock 2021, 40, 218–225. [Google Scholar]
- Li, Z. Research on Small Diameter Flow Accuracy Revision and Spool Vibration Suppression of Dynamic Flow Balance Valve. Master’s Thesis, Lanzhou University of Technology, Lanzhou, China, 2017. [Google Scholar]
- Liu, H. Research on Pointing Error and Imaging Quality of Three-Axis TDICCD Aerial Camera. Ph.D. Thesis, Jilin University, Changchun, China, 2022. [Google Scholar]
- Sun, D.; Ma, Y.; Feng, C.; Sun, S. Natural frequency and resonance analysis of pneumatic conveying pipeline. Mech. Des. Manuf. Eng. 2015, 44, 7–10. [Google Scholar]
Disclaimer/Publisher’s Note: The statements, opinions and data contained in all publications are solely those of the individual author(s) and contributor(s) and not of MDPI and/or the editor(s). MDPI and/or the editor(s) disclaim responsibility for any injury to people or property resulting from any ideas, methods, instructions or products referred to in the content. |
© 2025 by the authors. Licensee MDPI, Basel, Switzerland. This article is an open access article distributed under the terms and conditions of the Creative Commons Attribution (CC BY) license (https://creativecommons.org/licenses/by/4.0/).