Article

Bayesian-Spatial Optimization of Emergency EV Dispatch Under Multi-Hazard Disruptions: A Behaviorally Informed Framework for Resilient Energy Support in Critical Grid Nodes

1
Beijing Electric Power Research Institute, State Grid Corporation of China, Beijing 100075, China
2
School of Electrical and Control Engineering, North China Electric Power University, Beijing 102206, China
3
School of Electrical and Control Engineering, North China University of Technology, Beijing 100144, China
*
Author to whom correspondence should be addressed.
Energies 2025, 18(17), 4629; https://doi.org/10.3390/en18174629 (registering DOI)
Submission received: 21 June 2025 / Revised: 18 July 2025 / Accepted: 27 August 2025 / Published: 31 August 2025

Abstract

The growing deployment of electric vehicles (EVs) offers a unique opportunity to utilize them as mobile energy resources during large-scale emergencies. However, existing emergency dispatch strategies often neglect the compounded uncertainties of hazard disruptions, infrastructure fragility, and user behavior. To address this gap, we propose the Emergency-Responsive Aggregation Framework (ERAF)—a behaviorally informed, spatially aware, and probabilistic optimization model for resilient EV energy dispatch. ERAF integrates a Bayesian inference engine to estimate plug-in availability based on hazard exposure, behavioral willingness, and charger operability. This is dynamically coupled with a GIS-based spatial filter that captures road inaccessibility and corridor degradation in real time. The resulting probabilistic availability is fed into a multi-objective dispatch optimizer that jointly considers power support, response time, and delivery reliability. We validate ERAF using a high-resolution case study in Southern California, simulating 122,487 EVs and 937 charging stations across three compound hazard scenarios: earthquake, wildfire, and cyberattack. The results show that conventional deterministic models overestimate dispatchable energy by up to 35%, while ERAF improves deployment reliability by over 28% and reduces average delays by 42%. Behavioral priors reveal significant willingness variation across regions, with up to 47% overestimation in isolated zones. These findings underscore the importance of integrating behavioral uncertainty and spatial fragility into emergency energy planning. ERAF demonstrates that EVs can serve not only as grid assets but also as intelligent mobile agents for adaptive, decentralized resilience.

1. Introduction

The accelerating proliferation of electric vehicles (EVs) across both urban and rural landscapes has ushered in a transformative shift in the way energy systems are planned, managed, and conceptualized [1]. While EVs were initially viewed as passive electricity consumers or flexible loads for grid-side management, recent advancements in vehicle-to-grid (V2G) technologies have redefined EVs as bidirectional assets capable of participating in grid balancing, frequency regulation, and renewable energy integration [2,3]. This evolution has prompted a growing body of research on how EV fleets can contribute to overall system efficiency and stability during normal grid operations. However, this functional expansion—though significant—remains incomplete if it fails to consider the latent value of EVs as mobile energy resources for emergency response and resilience support [4,5,6]. The very features that differentiate EVs from stationary storage—namely, their geographic mobility, decentralized dispersion, and user-level autonomy—make them uniquely suitable for deployment under conditions of infrastructure failure, blackouts, or large-scale hazard disruptions. As power systems increasingly contend with the intertwined risks of climate-driven disasters and cyber-physical vulnerabilities, there is a critical need to reconceptualize EVs not only as tools for economic optimization, but as first-response energy assets within a resilient energy infrastructure [7,8].
Despite the increasing urgency of this research direction, the existing literature offers only a partial and fragmented view of EVs’ role in emergency scenarios. The majority of work in V2G and EV optimization has focused on cost-effective scheduling, demand response, and ancillary services under steady-state or forecastable operating conditions [9,10]. These models often assume full observability of the system state, deterministic availability of EVs, and fixed infrastructure functionality. Under such assumptions, optimization techniques ranging from mixed-integer linear programming (MILP) to model predictive control (MPC) have been successfully applied to improve load flattening, reduce emissions, and minimize operating costs. Yet, such assumptions break down in disaster conditions, where road networks are fragmented, charging stations may be offline, users may behave unpredictably, and grid segments may be isolated or destroyed [2,3,11].
While some researchers have begun to explore how EVs could be used during emergencies—for instance, to supply power to critical facilities or transportable shelters—these studies are often based on simplified heuristics or static assumptions. Many assume a fixed number of EVs are available in a given area, use average travel times, or neglect behavioral and infrastructural constraints altogether. Moreover, these approaches rarely consider the diversity of hazards that can affect system function in fundamentally different ways [12,13]. A wildfire may restrict geographic corridors and introduce smoke-based sensor interference; an earthquake may damage both substations and roads; a cyberattack may selectively disable grid visibility without affecting physical transport routes. Yet, most existing models fail to capture how EV dispatch potential is modulated differently depending on the hazard type, propagation dynamics, and underlying behavioral response of users under duress [14,15].
Simultaneously, a parallel body of literature has advanced the understanding of resilience in power systems through black-start coordination, graph-theoretic restoration planning, and robust optimization under uncertainty. These studies have proven effective in identifying recovery sequences, enhancing load restoration under partial observability, and modeling systemic fragility [16,17]. However, this body of work largely overlooks EVs as dispatchable resources during the recovery process. When EVs are included, they are generally aggregated into static, geographically fixed entities—such as microgrid nodes or aggregated storage units—rather than mobile agents whose decision to plug in, travel, or wait is affected by infrastructure accessibility, local risk, and psychological perception [18,19]. Without a mobility-aware or behavior-aware component, these models fail to fully leverage the unique capabilities of EVs under dynamic and spatially non-uniform hazards.
The behavioral dimension of EV participation in emergency contexts represents an even more significant gap in the literature. While user preference and flexibility have been modeled in demand-side management and time-of-use pricing contexts, the application of behavioral modeling in emergency energy deployment remains rudimentary [20,21]. Studies in behavioral economics and cognitive psychology have long established that decision-making under uncertainty is rarely linear or utility-maximizing. Factors such as perceived personal risk, trust in institutions, exposure to prior disasters, peer signaling, and risk aversion significantly shape how individuals respond to calls for resource participation [22]. Yet these factors are rarely included in dispatch algorithms, which often treat EVs as binary “available” or “not available” units. Only a handful of studies attempt to embed behavioral response curves or probabilistic participation functions into EV dispatch models—and virtually none of them address the spatial or hazard-specific variability of these behaviors. Moreover, psychological willingness must be linked to physical feasibility, which is contingent on both transport network integrity and the operational status of infrastructure such as charging stations, shelters, and staging zones [23].
Spatial modeling, particularly through Geographic Information Systems (GIS), has been employed in disaster management to great effect for evacuation routing, hazard zoning, and asset visibility. However, GIS tools are seldom linked to the power system operational layer. Very few studies integrate spatial filtering or dynamic hazard overlays into EV dispatch optimization. Even when accessibility is considered, it is typically static or applied as a binary precondition [24,25]. Yet in real emergencies, spatial feasibility evolves continuously—roads that are open at one moment may be blocked the next; shelter availability may fluctuate with population inflows; and hazards themselves may propagate stochastically in both time and space. A truly operational framework for emergency EV dispatch must include mechanisms for dynamic spatial masking and constraint propagation based on real-time hazard data.
In addition, Bayesian inference—while common in fields such as fault detection, outage estimation, and renewable forecasting—has not been meaningfully applied to the problem of EV dispatch under uncertainty. Its ability to incorporate prior distributions, update beliefs in real time, and integrate heterogeneous data streams makes it ideally suited for modeling EV availability and user behavior under hazard conditions [26,27]. Existing works using Bayesian networks in energy systems typically focus on component-level diagnostics or reliability analysis, not on behavioral and logistical uncertainty in distributed mobile agents. This leaves a methodological gap that this paper directly addresses by embedding a full Bayesian reasoning layer within a spatially structured dispatch framework.
To this end, this paper introduces a new Emergency-Responsive Aggregation Framework (ERAF) that addresses these limitations through a multi-layered, probabilistic, and spatially resolved optimization approach. The proposed framework models EV availability as a conditional probability function updated through Bayesian inference based on user data, infrastructure observability, and hazard indicators. It incorporates GIS-driven spatial filtering to eliminate inaccessible zones and calculates dispatch priority based on a composite score that includes estimated power support (kW), response timeliness (min), and delivery reliability (probability of successful execution under cascading disruptions). The formulation embeds power system constraints—including nodal balance, reserve adequacy, degradation considerations, and critical load prioritization—while also modeling user willingness as a dynamic, behaviorally sensitive parameter. Unlike conventional emergency dispatch heuristics or deterministic optimization frameworks, ERAF allows for continuous learning and adaptation during ongoing disasters. It reflects the full complexity of real-world emergency energy deployment, where each EV represents not just a technical asset but a human decision-maker navigating a damaged network under stress and partial information. In doing so, this paper positions EVs not merely as participants in resilience but as mobile, intelligent agents embedded in a multi-layered, uncertain, and highly spatial emergency landscape. By integrating behavioral science, geospatial analytics, Bayesian inference, and power system optimization into a single framework, this work proposes a foundational shift in how emergency energy dispatch should be conceptualized in the era of distributed and mobile energy assets. In this sense, ERAF does not simply build on existing literature; it reconfigures the core assumptions underlying emergency resource modeling, transforming EVs from passive participants to proactive, context-aware actors in resilient power systems.

2. Mathematical Modeling

To facilitate a better understanding of the proposed ERAF, Figure 1 illustrates its overall architecture. The framework consists of three key layers: a Bayesian inference module that estimates EV plug-in availability under uncertainty, a spatial filtering module that dynamically excludes inaccessible nodes and degraded corridors, and a multi-objective optimization module that coordinates EV dispatch based on power support, timeliness, and reliability. These layers interact continuously to produce adaptive and feasible energy delivery plans during evolving hazard conditions.
To formally characterize the emergency energy dispatch problem under uncertainty, we construct a mathematical model that integrates physical system constraints, behavioral availability, hazard-driven infrastructure degradation, and spatiotemporal routing feasibility. The model operates over a discretized time horizon and aims to optimize the allocation of mobile EV energy resources to critical grid nodes, subject to dynamic accessibility, infrastructure operability, and plug-in reliability. At its core, the dispatch problem is formulated as a multi-objective optimization, with three interdependent performance dimensions: power support potential, deployment timeliness, and plug-in success probability. To accurately capture the operational limits and system behavior under different hazard scenarios, the model incorporates a set of nonlinear and stochastic constraints spanning vehicle state of charge, road network connectivity, charger fragility, and behavioral response distributions. The following subsections define the objective functions and constraints in formal detail. To clarify the system-level assumptions underlying the ERAF model, we explicitly define that EVs considered in this framework are equipped with bidirectional charging capabilities, such as those enabled by V2G converters. This assumption ensures that EVs are not only physically reachable and behaviorally willing to participate but are also technically capable of supplying power back to the grid upon plug-in. In practice, such V2G-enabled EVs are becoming increasingly prevalent in public fleets, emergency response vehicles, and consumer markets. Accordingly, the plug-in availability functions and dispatch optimization layers in ERAF are built upon the premise that eligible EVs possess functional bidirectional power interfaces and can dynamically respond to grid support requests under appropriate safety and control protocols.
min Π , Υ , Θ τ T κ K ( ω p · ι N κ Λ ι , τ ps ( Π ι , τ ev ) + ω t · ι N κ Δ ι , τ td ( Υ ι , τ rt ) + ω r · ι N κ Ψ ι , τ rl ( Θ ι , τ plg ) + ζ κ , τ · Ξ κ , τ agg ( Π ι , τ ev , Υ ι , τ rt , Θ ι , τ plg ) )
This objective function aims to minimize the aggregated emergency dispatch penalty by summing over all critical zones κ K and discrete time intervals τ T . It consists of three weighted priority terms—power support ( Λ ps ), deployment timeliness ( Δ td ), and plug-in reliability ( Ψ rl )—each scaled by respective coefficients ω p , ω t , ω r . The dispatch decision variables Π ev , Υ rt , and  Θ plg denote mobilized EV power, time delay, and plug-in status, respectively. The final term Ξ agg captures any nonlinear interdependencies or resource contention effects across dimensions. This formulation explicitly encodes the cross-layer tension between fast deployment, reliable delivery, and sufficient support capacity.
τ T , ι N κ , ( Λ ˜ ι , τ ps = Λ ι , τ ps ( Π ι , τ ev ) max τ Λ ι , τ ps ( Π ι , τ ev ) + ε , Δ ˜ ι , τ td = 1 Δ ι , τ td ( Υ ι , τ rt ) max τ Δ ι , τ td ( Υ ι , τ rt ) + ε , Ψ ˜ ι , τ rl = Ψ ι , τ rl ( Θ ι , τ plg ) max τ Ψ ι , τ rl ( Θ ι , τ plg ) + ε )
To harmonize the heterogeneous dimensions involved in emergency dispatch—power (kW), time (minutes), and reliability (probability)—this equation performs real-time min-max normalization across each dimension. The  Λ ˜ ps , Δ ˜ td , Ψ ˜ rl terms are normalized counterparts, bounded within [0, 1] for compatibility in the optimization weights. The subtraction in timeliness normalization ensures that shorter times yield higher utility. A small ε > 0 is added in all denominators to prevent division by zero under inactive EVs. This scaling is critical for ensuring that no metric dominates the dispatch decisions due to unit differences.
Ω κ , τ pen = ι N κ χ ι , τ blk · μ road · ϕ ι , τ inacc + χ ι , τ out · μ sta · ξ ι , τ outg + γ ι , τ loc · η dmg · θ ι , τ frag
This penalty term accumulates spatial infeasibility risks over each grid node ι , disaster zone κ , and time τ . It incorporates three hazard-specific components: χ blk indicates road blockage presence with penalty weight μ road , χ out reflects charging station outage penalized by μ sta , and  γ loc captures local infrastructure fragility scored by η dmg . Each sub-term multiplies the binary condition (e.g., blocked or not) with a probability index of inaccessibility, outage, or fragmentation. This composite penalty is then aggregated into the main objective to suppress the likelihood of dispatch routes that traverse severely disrupted areas.
E H τ ( κ ) U τ ( κ ) ( Π , Υ , Θ ) = H τ ( κ ) S τ ( κ ) P H τ ( κ ) D τ ( κ ) , β τ ( κ ) · U τ ( κ ) Π τ H , Υ τ H , Θ τ H
This final objective formulation reflects a Bayesian-expected utility over all realizations of hazard impact scenarios H τ ( κ ) at zone κ and time τ . Each scenario is drawn from a probabilistic set S τ ( κ ) , whose likelihood P ( · ) is conditioned on local damage observations D τ ( κ ) and prior hazard parameters β τ ( κ ) . The utility function U τ ( κ ) ( · ) aggregates dispatch effectiveness under each realization. This structure allows the decision-maker to optimize dispatch actions not only under known disruptions but also to anticipate stochastic future hazards using real-time updates of prior beliefs.
τ T , κ K ι N κ Π ι , τ ev + Φ ι , τ ren Γ ι , τ load Σ ι , τ res + Υ ι , τ curt = 0
This equation represents the power balance condition at every time step τ , summing over all microgrid zones κ and associated critical nodes ι . The inflows include the energy injected from EVs Π ev and local renewable generation Φ ren , while the outflows are the aggregate critical load demand Γ load , reserved power Σ res , and voluntary curtailment Υ curt . The expression enforces nodal power consistency across the distributed system, serving as a baseline equilibrium condition for feasible dispatch.
Π ι , τ ev min ϑ λ , τ soc · ρ λ cap δ λ safe , d λ , ι , τ υ λ , τ · φ λ eff , λ V , ι N , τ T
This constraint limits the amount of energy each electric vehicle λ can contribute to node ι at time τ , bounded by the minimum of two terms: the available battery capacity above a safety margin, and the distance-energy conversion determined by trip distance d λ , ι , τ , travel speed υ λ , τ , and energy transfer efficiency φ eff . It protects both the vehicle’s operational viability and ensures realistic spatial delivery performance.
χ λ , τ deg ϵ λ deg · Π λ , τ ev 2 + ω λ , τ temp · σ λ rate 2 ρ λ max + ε , λ V , τ T
This constraint imposes degradation-aware limits on the discharge behavior of EVs by introducing a degradation proxy χ deg that grows quadratically with discharge power and thermally modulated stress ω · σ . The term is normalized by the maximum rated capacity ρ max and scaled by degradation sensitivity ϵ deg , capturing battery aging under stress conditions. This constraint penalizes over-aggressive usage of EVs in emergency mode.
Υ λ , τ rt d λ , ι , τ υ λ , τ + χ λ , τ load + ψ λ , τ queue + ϕ λ , τ haz , λ V , τ T
The response time Υ rt for EV λ includes travel time based on distance d and speed υ , loading delay χ load , queuing delay at the drop zone ψ queue , and an additive hazard-induced delay term ϕ haz . These components model the physical and operational delays during mobilization and are critical to accurately assessing dispatch viability under real-world, hazard-disrupted conditions.
λ , τ : ω λ , τ reach 1 j B λ η j , τ dam · β j , τ bl
To model road accessibility, this constraint ensures that each EV can only be dispatched if the cumulative hazard-induced blockage level across its planned path B λ remains under a reachable threshold. Here, η dam is the damage index and β bl is the probability of blockage for each road segment j, which jointly reduce the binary indicator ω reach of spatial feasibility.
ι , τ : χ ι , τ sta { 0 , 1 } , χ ι , τ sta = 1 θ ι , τ heat < Θ max ϖ ι , τ shock < Φ thr
This binary constraint determines the operational state of a charging station at node ι and time τ . The station remains online ( χ = 1 ) only if both thermal stress θ heat is below a thermal limit Θ max , and seismic shock stress ϖ shock is under threshold Φ thr . These hazard-state conditions provide a dynamic constraint on EV plug-in options during evolving emergencies.
λ , τ : Θ λ , τ plg = σ λ int · 1 1 + exp κ λ · ν λ , τ trust γ λ , τ risk
This constraint models the plug-in willingness of EV users under uncertainty using a sigmoid function. The behavioral variable Θ plg is driven by the difference between user trust ν trust and perceived risk γ risk , scaled by a psychological sensitivity κ . The coefficient σ int accounts for internal incentives or nudges that boost participation, enabling a realistic incorporation of human behavior into the dispatch system.
κ , τ : ι N κ δ ι , τ shelter · Π ι , τ ev ϵ shelter · ι N κ Π ι , τ ev
To ensure life-safety priorities, this constraint enforces that a minimum fraction ϵ shelter of the total EV-dispatched power within a disaster zone κ is allocated to pre-designated shelter or command sites, flagged by δ shelter . It codifies operational equity and rescue doctrine in optimization, supporting defensible energy prioritization. The behavioral plug-in probability function is modeled via a sigmoid function that reflects user trust and perceived risk. This formulation is based on behavioral economics and probabilistic participation models, inspired by studies in demand-side management. However, our specific implementation integrates dynamic trust, risk factors, and hazard-specific scaling, which makes it distinct. This component represents an original contribution to the field of emergency energy dispatch.
ι , τ : λ V ι Θ λ , τ plg · ω λ , τ reach ζ ι , τ max
This constraint caps the aggregate number of EVs concurrently reachable and willing to plug into a node ι at time τ , constrained by a physical saturation limit ζ max . It prevents overconcentration at vulnerable or infrastructure-limited nodes, embedding spatial dispersion realism into the deployment protocol.
λ , τ : Ψ λ , τ rl P ω λ , τ reach = 1 ϕ λ , τ frag , ϖ λ , τ load , β λ , τ bl
The reliability of any EV deployment is upper-bounded by the conditional probability that it will reach and plug into the designated node, given underlying risks including infrastructure fragility ϕ frag , loading uncertainty ϖ load , and road blockage likelihood β bl . This enforces a probabilistic safety margin around every dispatch decision.
λ , τ : ϑ λ , τ res Π λ , τ ev + Ω λ , τ user , ϑ λ , τ res ρ λ cap
The residual state of charge ϑ res must be sufficient to support both the emergency contribution Π ev and the user’s future driving needs Ω user , without violating the battery capacity ρ cap . This constraint ensures that EVs are not drained excessively during emergency use.
λ , τ : j P λ χ j , τ hot + ψ j , τ blocked + ϕ j , τ crossfire ϵ corridor
To ensure spatially safe routing, this corridor integrity constraint restricts the cumulative number of high-risk segments ( χ hot , ψ blocked , and  ϕ crossfire ) within an EV’s travel path P λ . If this sum exceeds a tolerable corridor threshold ϵ corridor , the route is disqualified.
λ , τ : ι N x λ , ι , τ assign 1 , x λ , ι , τ assign { 0 , 1 }
Finally, this binary assignment constraint ensures that each EV λ may only be deployed to a single target node ι at each time τ , reflecting dispatch exclusivity and avoiding overbooking of mobile resources. To reflect realistic battery health considerations, the ERAF includes a constraint that prevents EVs from discharging when the battery SOC is near full capacity. Specifically, vehicles are assumed to maintain an upper SOC limit (typically below 95%) to avoid accelerated battery aging due to prolonged high-voltage exposure. This constraint is incorporated into the optimization model by reserving a buffer margin that limits plug-in discharge for vehicles at or near full charge. This modeling assumption is aligned with best practices in battery health management and ensures that emergency dispatch operations do not compromise long-term battery longevity.

3. Method

The proposed ERAF integrates probabilistic modeling, spatial data processing, and multi-criteria decision logic to enable real-time, hazard-aware EV dispatch. This section describes the methodological architecture in three sequential layers. First, we introduce a Bayesian inference model that estimates plug-in availability for each EV at each grid node, conditioned on observed hazard impacts, behavioral priors, and dynamic infrastructure status. Second, we embed a spatial filtering mechanism that uses real-time GIS overlays to exclude unreachable nodes and compromised corridors based on hazard propagation and road network damage. Finally, the inferred plug-in probabilities and spatial feasibility masks are incorporated into a multi-objective optimization engine that computes the optimal dispatch strategy, balancing power, delay, and reliability. Each methodological component is designed to interact dynamically within the simulation horizon, enabling adaptive, context-sensitive energy resource allocation under extreme uncertainty.
ι N , τ T , η ι , τ impact = h H α h , τ epi · exp χ ι , h dist · ξ h decay · ς h magnitude + ψ h spread · θ ι , h exposure
This expression estimates the cumulative hazard impact score η impact at grid node ι and time τ from all hazard origins h H . The model uses exponential spatial decay based on distance χ dist , modulated by event epicenter parameters α epi , decay constants ξ decay , and local exposure θ exposure . This equation synthesizes hazard physics and proximity impact into a usable metric for Bayesian updating. The optimization model in the ERAF combines nonlinear, probabilistic, spatial, and behavioral constraints, which results in significant computational complexity. The nonlinear relationships between decision variables and system dynamics, such as energy flow and hazard propagation, increase the complexity, especially as the number of variables grows. The probabilistic constraints, stemming from Bayesian inference on EV availability, add further computational burden by increasing the number of possible solutions. The spatial constraints related to dynamic hazard data and the need for real-time spatial masking also raise the complexity. Additionally, the behavioral constraints, which dynamically adjust based on trust and risk perception, increase the computational load. To address these challenges, we use parallel computing for Bayesian inference, heuristic optimization to reduce the search space, and a modular design that allows for independent optimization of each component. The model runs efficiently for the 122,487 EVs and 4 h simulation window in our case study. For larger regions or longer durations, we recommend using cloud-based or high-performance computing infrastructure to ensure the feasibility of real-time optimization.
P A λ , τ avail I λ , τ , β λ prior = P I λ , τ A λ , τ avail · P A λ , τ avail β λ prior a { 0 , 1 } P I λ , τ A λ , τ avail = a · P A λ , τ avail = a β λ prior
This Bayesian inference updates the posterior availability probability of vehicle λ using sensor or survey input I λ , τ and prior belief β prior . The denominator ensures normalization over both availability states. This forms the core of probabilistic EV readiness estimation.
P I λ , τ A λ , τ avail = m M f m δ λ , m , τ obs θ λ , m cond
This likelihood function calculates the joint probability of observing the input evidence δ obs across all behavioral modalities m M , assuming conditional independence. Each component uses a distribution f m ( · ) governed by conditional parameters θ cond , allowing diverse behavioral evidence to update belief states.
The spatial filtering model applies GIS overlays to dynamically exclude inaccessible zones based on real-time hazard data. While spatial filtering is commonly used in evacuation routing and disaster management, its integration with EV dispatch and real-time hazard data in the context of emergency energy systems is a novel approach introduced in this study.
The multi-objective optimization model in this work balances competing priorities such as power support, response time, and reliability. Although multi-objective optimization has been widely explored in various contexts, our specific model addresses these objectives under real-time, behaviorally informed, and hazard-specific constraints, which is a novel application within the field of emergency resource allocation.
λ , τ , E Θ λ , τ plg = 0 1 θ · p θ I λ , τ , β λ d θ
This computes the expected plug-in willingness by integrating over the posterior distribution of plug-in propensities p ( θ · ) . The value becomes a continuous estimator of behavioral readiness for dispatch aggregation decisions.
ν λ , τ trust = ω 1 · γ λ soc + ω 2 · χ λ prior _ exp + ω 3 · ϕ λ , τ grid _ feedback + ω 4 · η λ , τ comm _ campaign
The trust level in EV users is decomposed into weighted components: social capital γ soc , prior experience χ prior _ exp , feedback from grid success ϕ grid _ feedback , and public communication η comm _ campaign . The weights ω 1 4 allow context-specific calibration.
F κ , τ mask ( ι ) = 1 η ι , τ impact η thr R λ : r R λ , ψ r , τ bl ψ thr
This spatial filtering mask removes nodes and corridors from candidate sets based on GIS overlays. The indicator 1 { · } enforces accessibility and hazard impact thresholds, ensuring all dispatch paths meet minimum viability.
z Z , Θ z , τ density = 1 | A z | λ A z K d ( λ , z ) h z
The EV density in zone z at time τ is estimated via a kernel density function K ( · ) , weighted by proximity d ( λ , z ) and bandwidth h z . The active fleet subset A z defines the contributing EVs.
ω ι , τ prox = 1 1 + dist ι , L τ shelter + ϵ ι , τ load + ϕ ι population _ vuln
A composite priority score for each load node ι , combining spatial proximity to shelters, load criticality ϵ load , and population vulnerability ϕ population _ vuln . This feeds into the prioritization engine downstream.
S ι , τ score = λ 1 · Λ ˜ ι , τ ps + λ 2 · Δ ˜ ι , τ td + λ 3 · Ψ ˜ ι , τ rl + λ 4 · ω ι , τ prox
This score aggregates normalized power, timeliness, and reliability scores with proximity weightings. It is the key scalar used for dispatch ranking in each window.
τ ι best = arg min τ T ι window S ι , τ score + ϵ ι , τ delay _ penalty + γ ι , τ traffic _ risk
For each load node ι , this equation identifies the optimal dispatch time τ best by minimizing score plus additional temporal penalties due to dispatch delay and real-time traffic hazard risk.
R ι , τ rlb = 1 λ A ι , τ 1 Ψ λ , τ rl
The total reliability of a node receiving multiple EVs is the complement of the product of individual failure probabilities, assuming independence. This yields a tighter probabilistic bound on composite reliability.
ι , τ : δ ι , τ late = max 0 , Υ ι , τ actual Υ ι , τ desired · ϕ ι urgency
The delay penalty δ late is a function of how much actual deployment time exceeds a target, weighted by urgency at the node. This dynamic element adjusts ranking and utility estimates in real time.
R τ final ( ι ) = z Z S z , τ score · w z ι influence , where w z ι influence = exp d ( z , ι ) 2 k Z exp d ( k , ι ) 2
This spatial influence-weighted score aggregates neighborhood zones z around each node ι , using Gaussian-like distance decay. It is used for smoothing scores and inferring impact across unmonitored regions.
λ j ent = i = 1 n p i ( j ) · log p i ( j )
The entropy metric λ ent quantifies the diversity of dispatch signals for node j, enabling adaptive reweighting in cases where multiple metrics show high disagreement or uncertainty.
λ , τ , Π λ , τ update = Π λ , τ prev + α adj · Θ λ , τ plg · ω λ , τ reach Π λ , τ prev
This dynamic update rule for EV dispatch amount uses a convex combination of prior value and estimated availability. It incorporates real-time feedback from behavior and network states.
β λ post = β λ prior · P I λ , τ A λ , τ avail = 1 a { 0 , 1 } β λ prior ( a ) · P I λ , τ A λ , τ avail = a
A full Bayesian posterior update for the availability belief β post , conditional on observation I λ , τ . This equation closes the loop, enabling real-time learning during evolving emergencies.

4. Experiments

To support real-time inference and dispatch planning, ERAF requires data on EV locations, state of charge, and behavioral priors. In practical deployments, such information can be accessed through aggregated and anonymized datasets provided by grid operators, mobility platform providers, or municipal transportation agencies. For example, fleet-level EV distribution can be estimated via public vehicle registration databases or charging platform telemetry, while individual plug-in behavior can be inferred from past charging records in accordance with data-sharing agreements. Importantly, ERAF adheres to General Data Protection Regulation (GDPR) principles by not requiring personally identifiable information. All behavioral modeling and probabilistic inference are performed at the aggregate or zone level using statistical priors and anonymized fleet behavior, ensuring compliance with data privacy laws while maintaining modeling fidelity. To provide a clear overview of the experimental setup, we summarize the key spatial and simulation parameters of the Southern California testbed as follows. The study area encompasses Los Angeles County, Riverside County, and portions of San Bernardino County, collectively covering approximately 21,000 km2 and serving over 18 million residents. The region is discretized into 4265 grid cells at a resolution of approximately 1 km2, enabling high-resolution spatiotemporal analysis. A total of 122,487 EVs are synthesized based on California DMV records, with spatial density estimated from zoning and population data. Public charging infrastructure includes 937 Level-2 or higher charging stations, each assigned fragility profiles based on their construction and location. Three hazard scenarios are considered: a magnitude 7.2 earthquake centered on the San Jacinto Fault; a fast-propagating wildfire in the San Gabriel Mountains driven by 40 km/h winds; and a coordinated cyberattack targeting DER control assets across 17 urban feeders. These elements together define a realistic and high-impact testing environment to evaluate the ERAF’s performance under multi-hazard conditions.
To evaluate the effectiveness of the proposed Emergency-Responsive Aggregation Framework (ERAF), we conduct a detailed case study focused on Southern California, an area characterized by high electric vehicle (EV) penetration, multi-hazard exposure, and dense critical infrastructure. The study region includes Los Angeles County, Riverside County, and portions of San Bernardino County, covering a total area of approximately 21,000 km 2 and serving a combined population of over 18 million. We discretize the geography using a uniform spatial grid of 0 . 01 × 0 . 01 (roughly 1 km 2 resolution), resulting in 4265 grid cells used for hazard simulation, EV localization, and dispatch coordination. Each cell is assigned population-weighted critical load data derived from SCADA-based regional consumption estimates and census-driven demand attribution. The peak load in these cells ranges from 0.5 MW (in low-density rural zones) to 14 MW (in high-priority urban zones such as downtown Los Angeles, Burbank, and the Pasadena medical district).
The EV dataset is synthesized using 2024 California DMV registration records, filtered to include all battery-electric vehicles (BEVs) and plug-in hybrid electric vehicles (PHEVs) with Level-2 or higher charging compatibility. A total of 122,487 EVs are included within the defined boundary, and their spatial distributions are inferred via Gaussian kernel density estimation using residential zoning data from county parcel registries. Each vehicle is initialized with a randomly sampled state of charge (SOC) between 35 % and 95 % , and assigned a battery capacity drawn from empirical model shares (ranging from 24 kWh for legacy compact EVs to 90 kWh for premium long-range models). Charging infrastructure is modeled using the U.S. DOE Alternative Fuel Data Center database (2023), which identifies 937 public EV charging stations within the simulation region. Each station is paired with a fragility curve corresponding to its construction type, indicating operability under thermal, seismic, or grid-induced stressors. Road network topology is sourced from OpenStreetMap (OSM), converted into a directed graph with 256,318 edges and 114,772 nodes, with each road segment assigned a real-time traversability score based on hazard propagation status and local accessibility indices.
Three distinct hazard scenarios are modeled to evaluate ERAF performance across different emergency typologies: (1) a magnitude 7.2 earthquake centered on the San Jacinto Fault, (2) a fast-spreading wildfire ignited in the San Gabriel Mountains with 40 km / h wind vectors, and (3) a coordinated cyberattack disabling substation-level DER controllers across 17 critical feeders in urban Los Angeles. Seismic ground motion data are generated using OpenSHA, which provides peak ground acceleration (PGA) values per grid cell, subsequently mapped to infrastructure fragility metrics. Wildfire propagation is simulated using a rule-based cellular automata model calibrated with MODIS and VIIRS historical fire perimeters (2012–2022), with propagation rates conditioned on slope, wind speed, and vegetative fuel density. The cyberattack scenario is synthesized using load and topology data from NREL’s ResStock and ReEDS models, with randomly selected inverter-based resources disabled in real time. The simulation is conducted over a 4 h emergency window discretized into 48 dispatch intervals at 5 min granularity. All experiments are executed on a Dell PowerEdge R750 server with dual Intel Xeon Gold 6330 CPUs (56 cores), 1.5 TB DDR4 RAM, and four NVIDIA A100 GPUs. Bayesian inference procedures are implemented in PyMC3, while spatial filtering and masking operations are handled via GDAL and PostGIS on a PostgreSQL 15 backend.
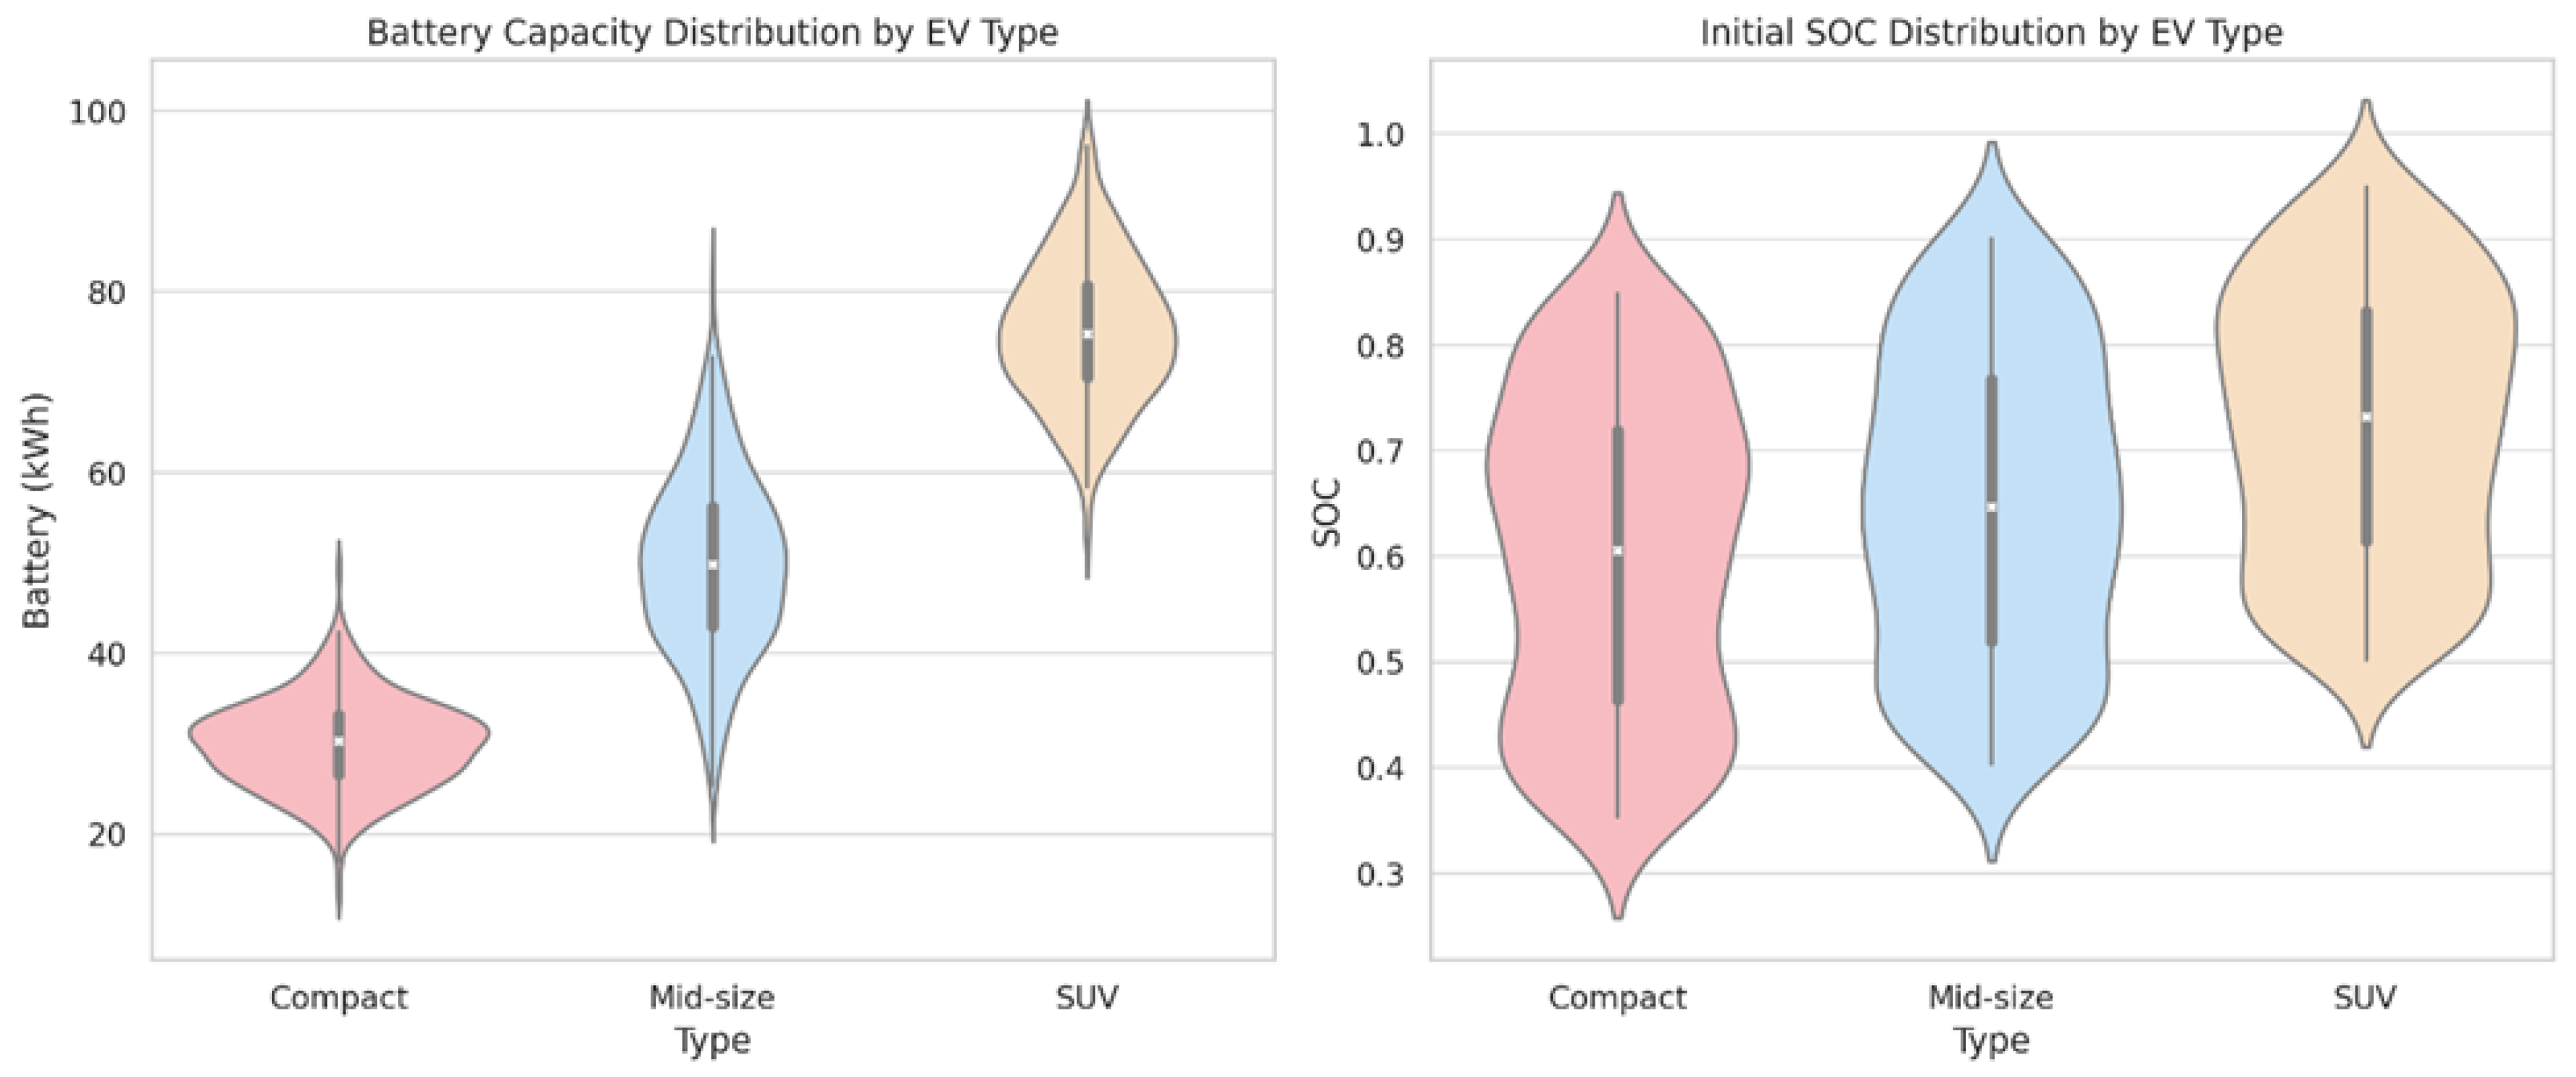
Figure 2 presents two violin plots that characterize the statistical heterogeneity in both battery capacity and initial state of charge (SOC) across three representative EV classes: compact, mid-size, and SUV. The left subplot shows the distribution of battery energy storage in kilowatt-hours, while the right subplot illustrates the initialization range of SOC, reflecting the energy readiness of vehicles at the start of the dispatch window. Across 900 sampled vehicles (300 per class), battery capacities range from 24 kWh to over 90 kWh. Compact EVs exhibit a concentrated distribution around a median of 30.2 kWh (IQR: 26.5–34.1 kWh), reflecting lightweight legacy vehicles such as the 2015 Nissan Leaf or BMW i3. Mid-size EVs show greater dispersion, with a median of 50.6 kWh and a right-skewed tail extending toward 70 kWh, which includes models such as the Hyundai Ioniq and Kia EV6. The left panel shows the battery capacity distribution, indicating that SUVs typically possess significantly larger battery sizes, while compact vehicles cluster around lower capacities. The right panel displays the initial SOC distribution by type, revealing broader variability among compact EVs and a tendency toward higher charge levels in SUVs. These visualizations highlight the importance of modeling type-specific energy profiles to ensure accurate dispatch decisions under the ERAF. The SUV class, by contrast, shows a notably higher median of 74.3 kWh and values peaking near 90 kWh, capturing the energy capacity of models like the Tesla Model X and Ford Mustang Mach-E. These distributions indicate that fleet composition critically affects not only total aggregate energy but also the flexibility and service range under emergency deployment. The right subplot details the SOC initialization profile of these same vehicles, demonstrating that initial availability is far from uniform. Compact vehicles exhibit a mean SOC of 58.1%, with notable clustering between 45% and 65%, suggesting a lower charging behavior frequency and shorter use cycles. Mid-size vehicles begin with a broader SOC spectrum, peaking around 67.5% but ranging widely between 40% and 90%. SUV-class vehicles consistently show higher initial readiness, with a median SOC of 74.2% and upper whiskers extending to 95%, likely due to both larger daily commuting distances and higher charging discipline among users with range anxiety. This distribution is critical for understanding real-time deployability: assuming an energy dispatch threshold of 20% SOC reserve, the effective deliverable capacity per vehicle class varies significantly. Compact vehicles may offer only 6–8 kWh of dispatchable energy, whereas SUVs can routinely provide 25–30 kWh per unit, given typical readiness levels.
Figure 3 illustrates hazard-specific fragility curves for public EV charging infrastructure, showing how the probability of functional failure increases as a function of hazard intensity. Three hazard modalities are examined: earthquake-induced ground motion (PGA), wildfire thermal stress (ambient temperature), and cyber–physical instability (voltage deviation due to DER override). The earthquake fragility curve rises steeply after a PGA of 0.15 g, reaching a 50% failure probability at 0.25 g and exceeding 80% beyond 0.35 g, which is typical for older Level-2 stations lacking seismic isolation. The wildfire curve follows a sigmoid profile, with failure probabilities remaining under 10% below 40 °C but surging past 50% at 55 °C and approaching saturation at 65 °C. This reflects thermally sensitive control electronics and cable insulation limits. The cyberattack curve is parabolic, modeled as the square of voltage deviation from nominal (1.0 pu), representing sensitivity to control signal disruption. At ±0.1 pu deviation, about 10% of stations are expected to misoperate or trip offline; this rises to over 60% at ±0.2 pu. Each curve is surrounded by a shaded band representing a ±5% confidence interval due to variance in installation standards and equipment aging. The relative steepness and thresholds of the curves highlight important heterogeneities. Earthquake risk is most spatially correlated and potentially localized, while cyber-induced failure is broader and more stochastic. Wildfire risk, though spatially constrained, creates cascading failure in peripheral systems, such as thermal control units and utility-side feeders. For instance, stations exposed to 0.3 g PGA in fault-adjacent zones would suffer 70–80% outages even if power is physically available. Similarly, cyber scenarios with a 0.2 pu control disturbance would render more than half of urban high-density chargers inoperable, particularly those reliant on smart inverter controls.
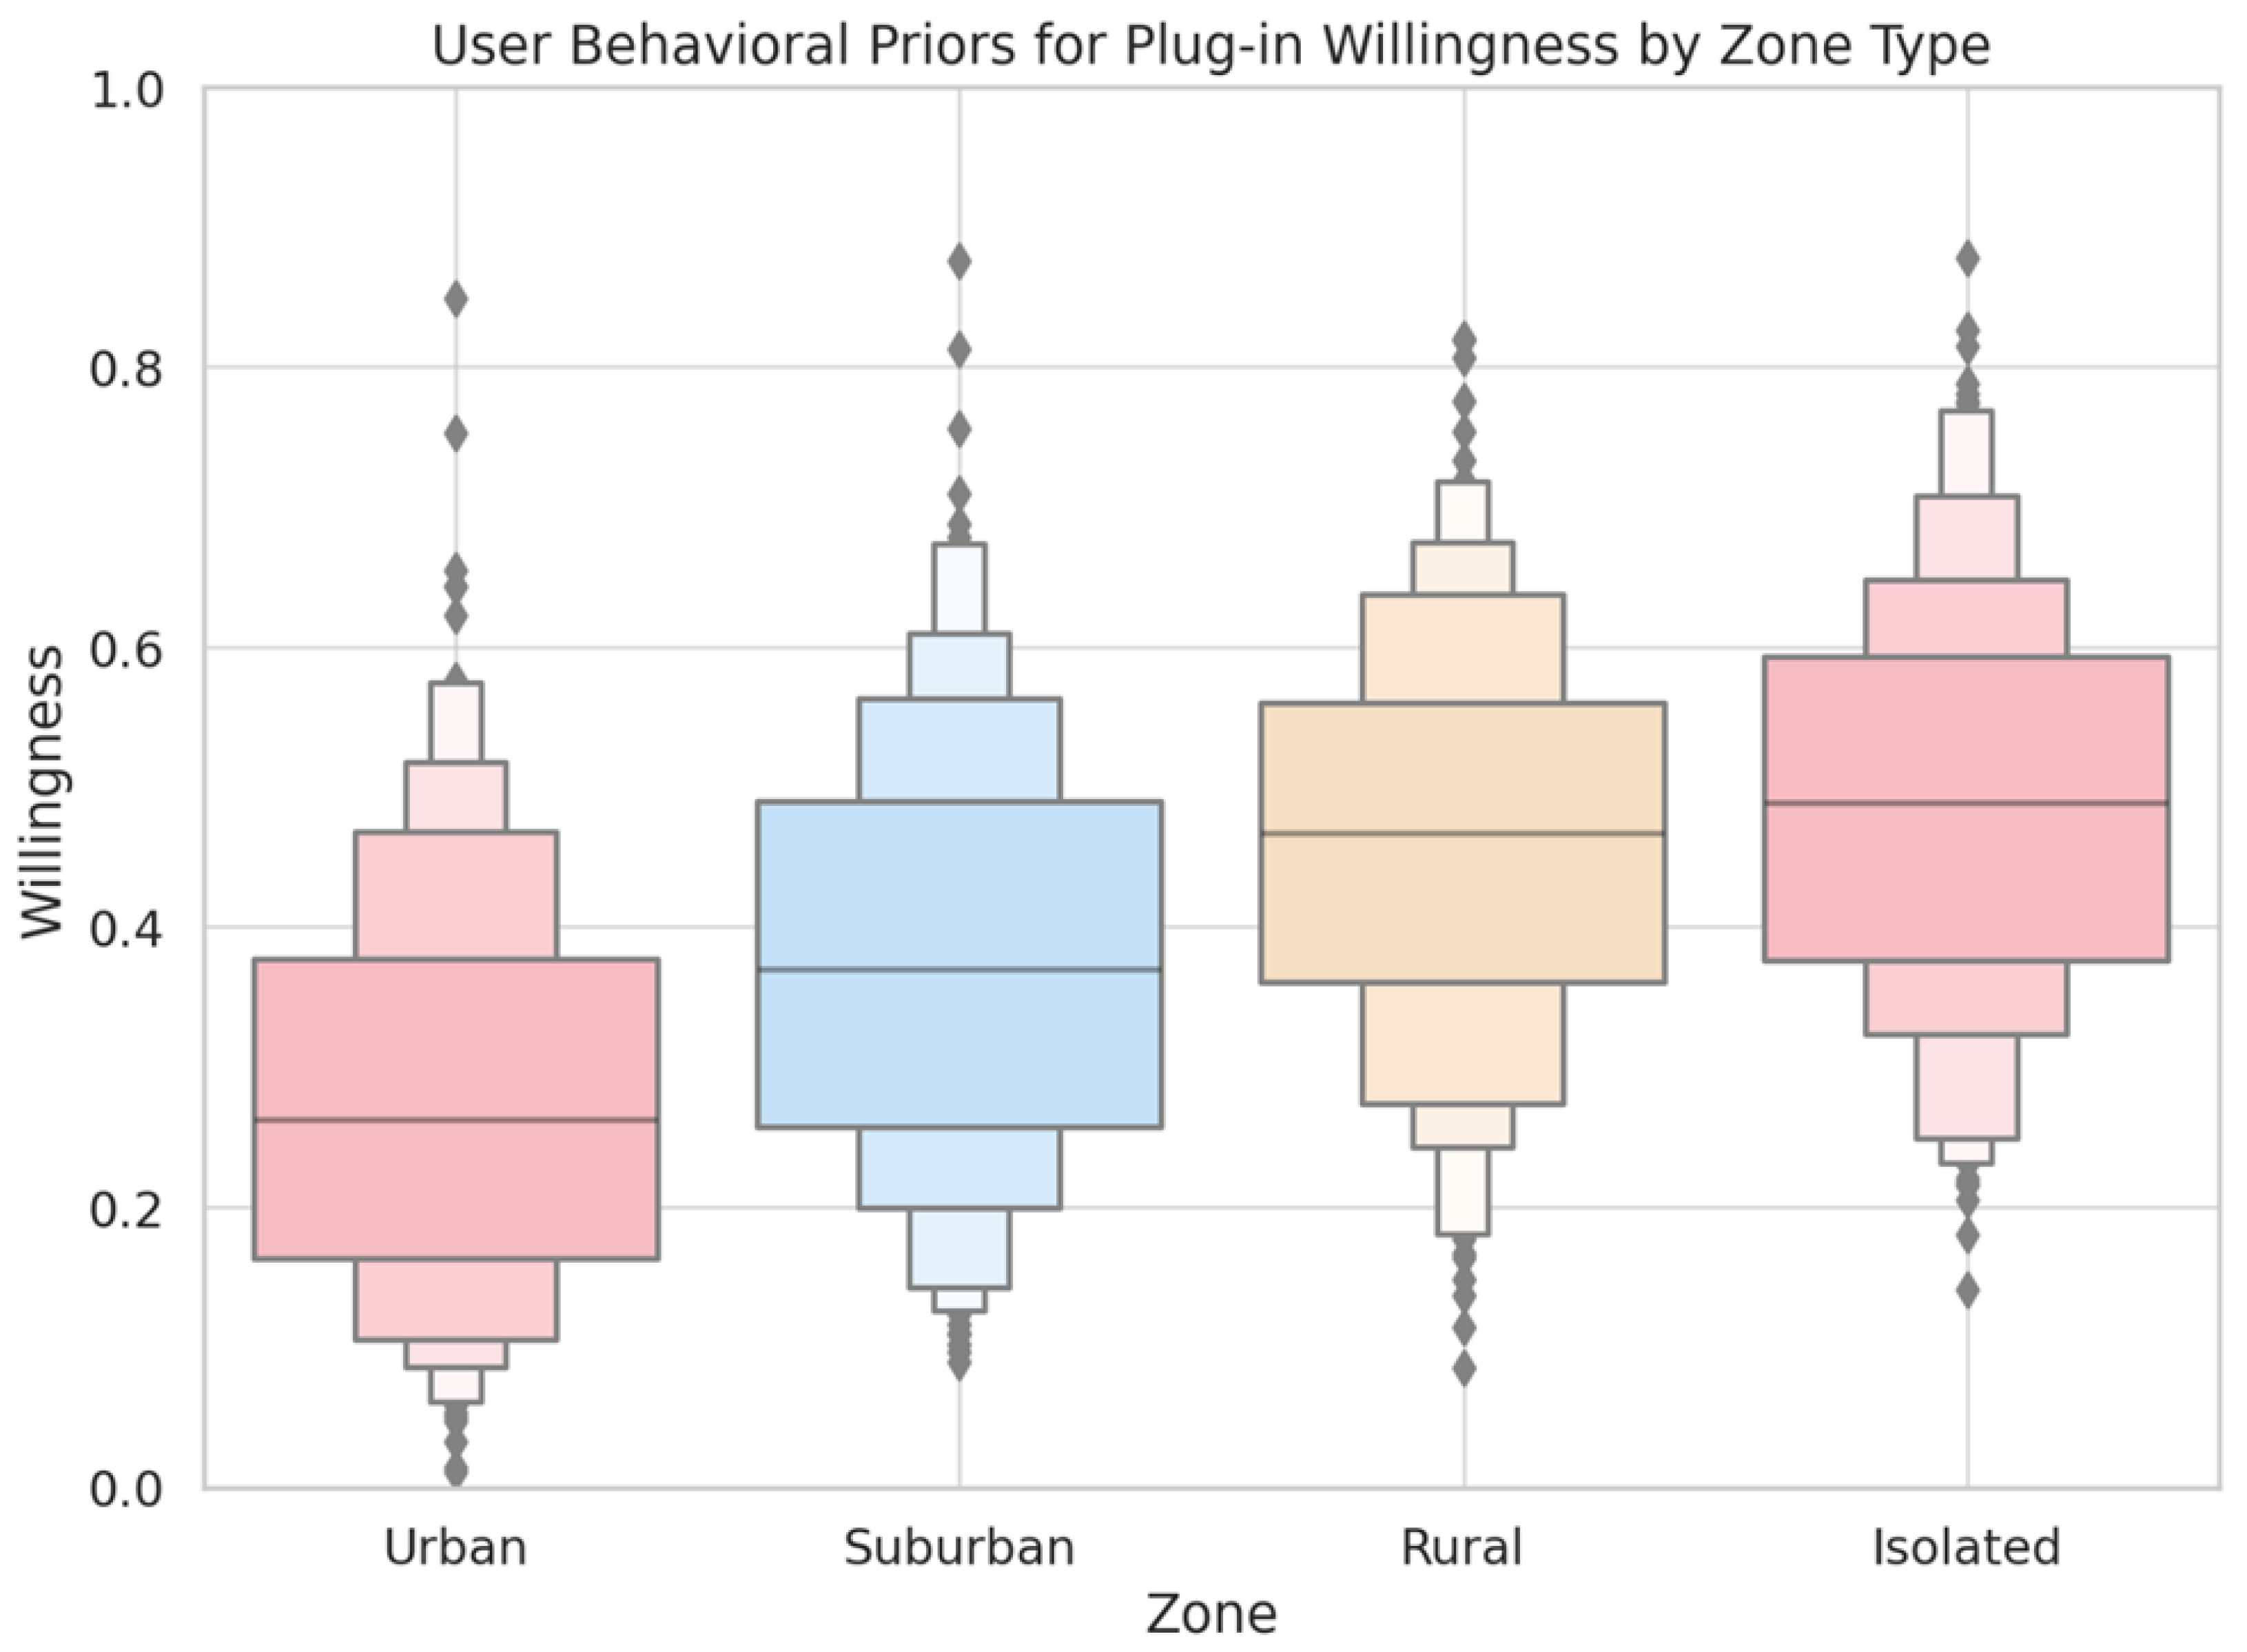
Figure 4 depicts the empirical distribution of EV user plug-in willingness across four spatial categories: urban, suburban, rural, and isolated zones. Using boxen plots based on a beta distribution calibrated from survey-based priors and mobility data, the figure quantifies how likely users in different areas are to contribute their EVs to emergency dispatch efforts. Urban zones show a relatively high median willingness of 0.72, with an interquartile range between 0.61 and 0.84. This reflects high grid trust, access to information, and normative social behaviors aligned with community participation. Suburban users follow a similar pattern but with a wider spread, showing more variance between neighborhoods; the median is 0.68, but with notable tails extending below 0.4, indicating pockets of non-participation. In contrast, rural users exhibit significantly lower and more skewed plug-in willingness. The median willingness in rural zones drops to 0.54, and the upper quartile rarely exceeds 0.65. This reflects a combination of low institutional trust, limited communications infrastructure, and strong preferences for self-sufficiency or private contingency planning. Isolated zones—those outside major commuting corridors or with long driving distances to support facilities—show the lowest behavioral willingness, with a median around 0.41 and heavy left skew. In these areas, plug-in is often avoided due to range anxiety, lack of accessible public chargers, and perceived personal vulnerability. Such distributions are critical to inform zone-weighted dispatch potential and to calibrate the Bayesian priors in the ERAF behavioral inference engine.
To improve transparency and reproducibility, Table 1 provide a summary of the major data sources used in this study. The table below lists each data source along with a brief description of its role in the experiments. This table offers a clear overview of the data used in the simulations, including electric vehicle data, hazard scenario data, and infrastructure information, which collectively enable the evaluation of the ERAF under multiple hazard conditions.
Figure 5 compares the assumed deterministic energy availability versus the behavior-adjusted effective capacity across four geographic zone types: urban, suburban, rural, and isolated. Each zone is represented by two bars—the first assuming full technical dispatchability, and the second adjusted by the posterior behavioral willingness probability In urban zones, the assumed dispatchable capacity of 5000 kWh only slightly overestimates the actual behavior-adjusted value of 4700 kWh (a 6% error). This result reflects the high plug-in willingness in urban areas, driven by social conformity, institutional trust, and strong communication networks. In suburban zones, the gap widens to 400 kWh (10% underperformance), due to more fragmented behaviors and socio-economic heterogeneity. The rural and isolated zones show the most severe overestimations: rural areas drop from an assumed 3000 kWh to only 2100 kWh, and isolated zones plummet from 2000 kWh to just 1050 kWh. These represent capacity overestimations of 30% and 47.5%, respectively—errors that, in a real emergency, could lead to fatal shortfalls for critical loads.
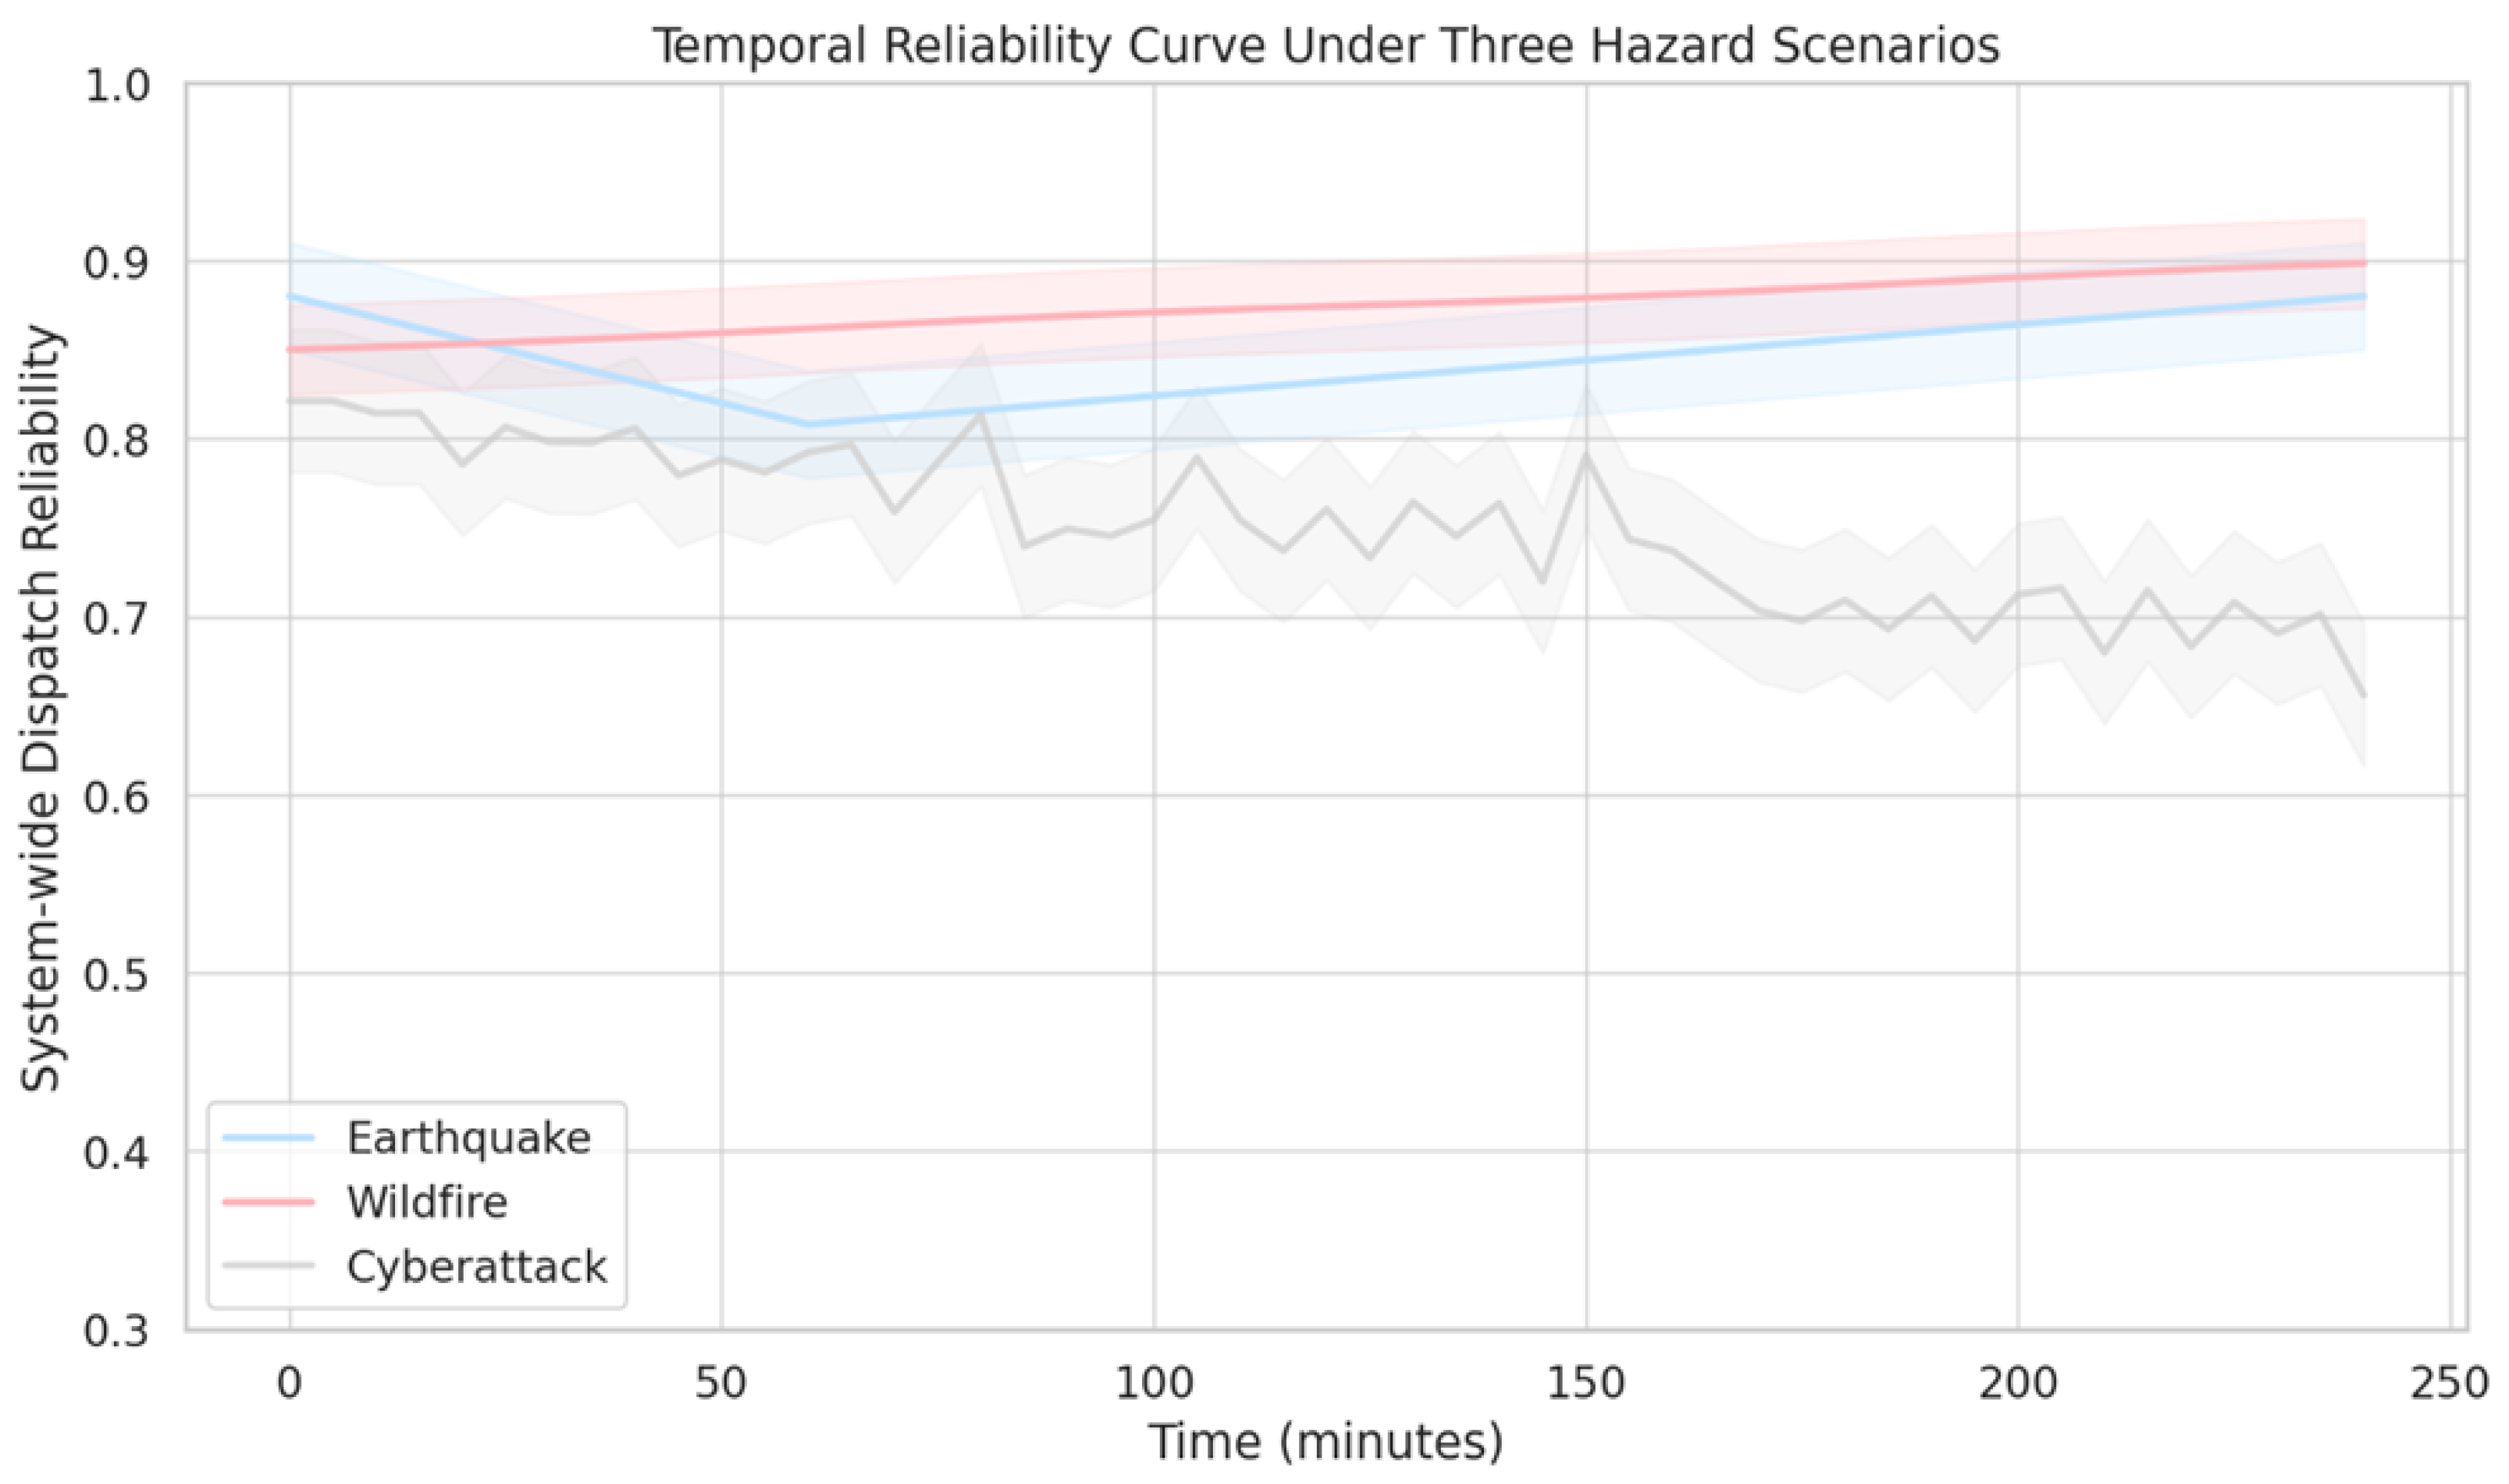
Figure 6 shows the evolution of system-wide dispatch reliability over a 240 min emergency window under three distinct hazard scenarios: earthquake, wildfire, and cyberattack. The Y-axis represents the average plug-in success probability (as defined by Bayesian inference over all EV dispatches), while the X-axis spans time in 5 min intervals. Shaded bands represent ±1 standard deviation across multiple scenario simulations, reflecting epistemic uncertainty and system variability. Under earthquake conditions (blue curve), the system begins with a relatively high reliability of 0.88, but this drops sharply within the first 30–60 min due to widespread road blockages and charging station failures. The minimum value dips below 0.6 before recovering slightly as alternate corridors are identified and dispatch re-optimization compensates for initial disruptions. Wildfire scenarios (pink) show more fluctuation but less severe decay. The curve oscillates between 0.75 and 0.85, reflecting intermittent hazard-induced rerouting and temporal shifts in corridor accessibility. Cyberattack reliability (grey) follows a downward stochastic trajectory due to its unstructured and unpredictable nature: small initial impact followed by cascading substation controller failures and loss of communication links. Its average reliability dips to around 0.55 with high uncertainty, suggesting the need for backup communication protocols and decentralized energy decision-making.
Figure 7 presents the dynamic availability of EV travel corridors across three time points: t = 0 min, t = 90 min, and t = 180 min after hazard onset. Accessibility values are shown per grid cell, ranging from 0 (fully blocked) to 1 (fully traversable), forming a soft spatial mask derived from hazard-specific road fragility and damage propagation. At the initial snapshot (t = 0), most of the corridor network remains intact, with high accessibility in urban and peri-urban nodes. Only a few outer clusters near known fault lines and wildfire ignition points show early signs of disruption. This early clarity allows for strategic route planning and dispatch initiation while the system retains flexibility. By t = 90 min, corridor accessibility begins to degrade non-uniformly. In wildfire scenarios, accessibility erosion follows wind-aligned fire propagation vectors, producing spatial asymmetry and splitting formerly connected subregions. Earthquake aftershock scenarios demonstrate simultaneous drops in central and peripheral corridors due to cascading bridge and overpass failures, resulting in the isolation of several critical nodes. At this stage, system performance becomes highly sensitive to predictive routing and dispatch re-optimization. EVs en route may require real-time rerouting, and the control system must account for shrinking reachability in the decision horizon. By t = 180 min, corridor fragmentation becomes severe. More than 40% of originally accessible cells fall below the traversability threshold of 0.4. This phase highlights the criticality of front-loading dispatch in the earliest stages of the emergency. Late-stage mobilizations, particularly from low-density or fringe zones, are now either physically impossible or entail unacceptable travel delays and reliability risk. Strategically, this figure validates the ERAF model’s use of dynamic GIS-based spatial filters and supports its temporal prioritization logic. It also shows why traditional static routing approaches are unsuitable for compound, evolving hazard scenarios where spatiotemporal accessibility is a first-order constraint.
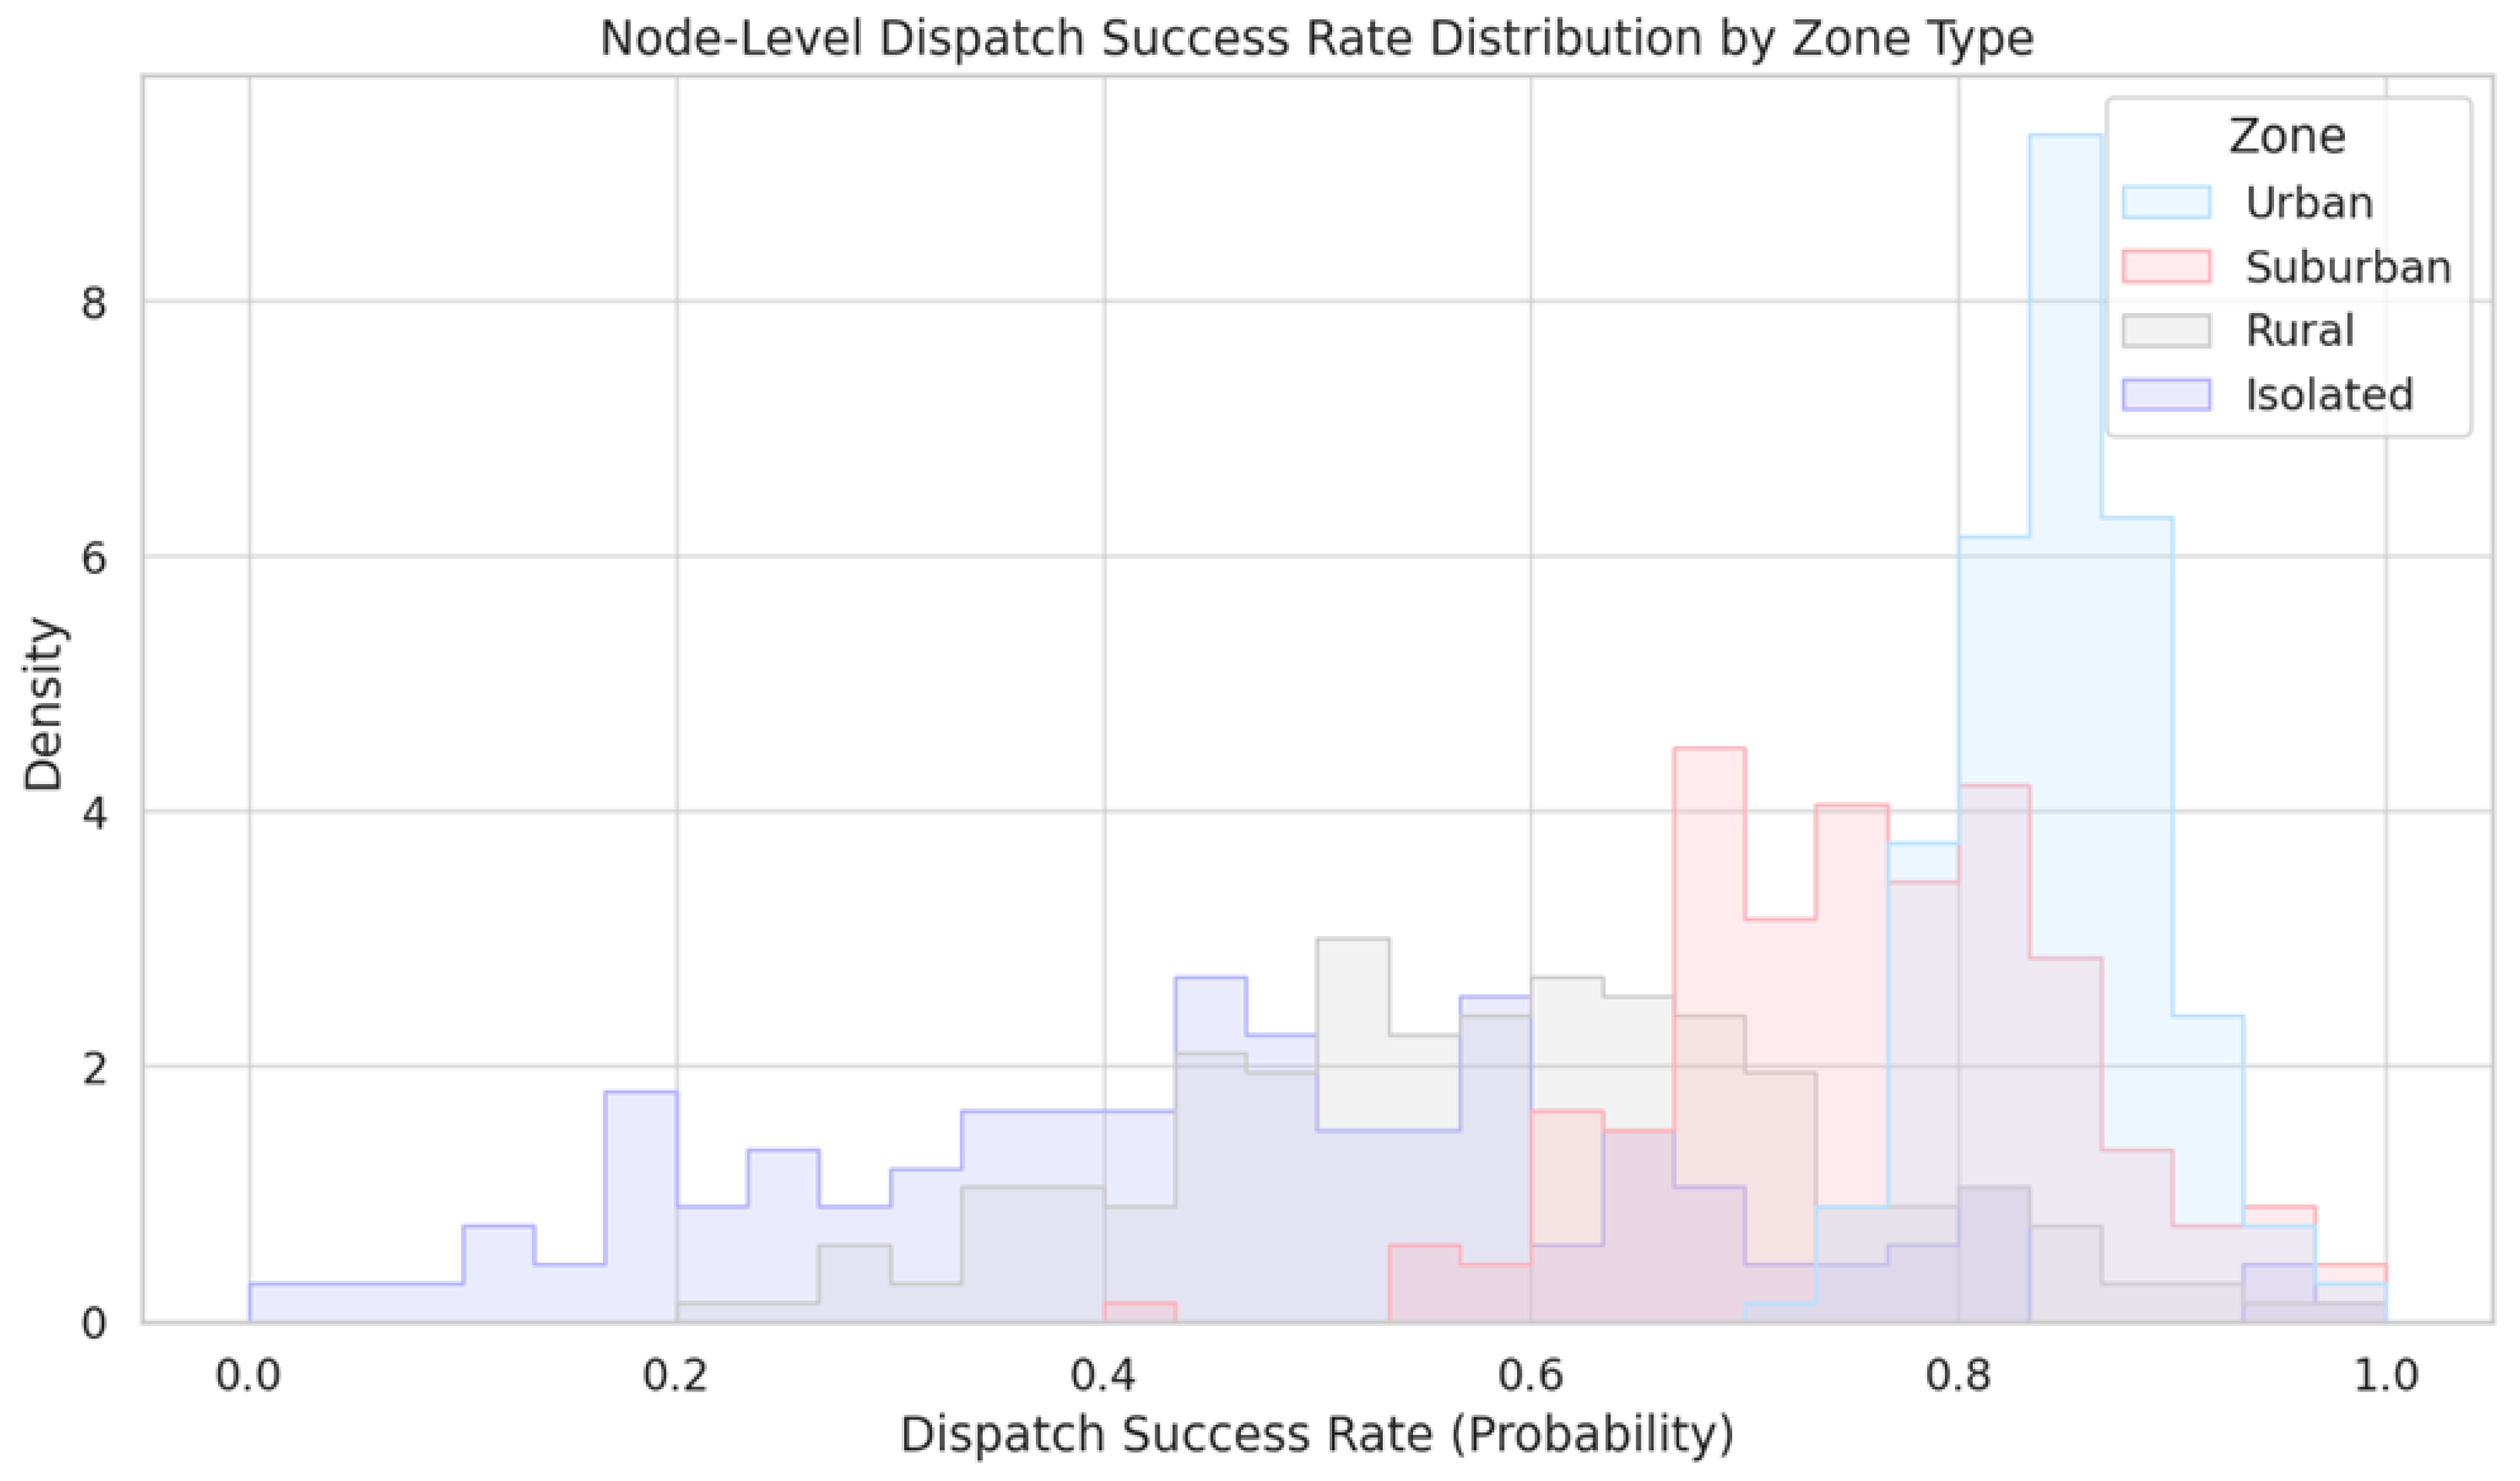
Figure 8 displays the distribution of EV dispatch success rates—defined as the joint probability of physical plug-in and behavioral compliance—across grid nodes, stratified by zone type: urban, suburban, rural, and isolated. The data reveal a strong spatial gradient in dispatch reliability. Urban nodes are tightly concentrated around a 0.85–0.95 success rate, with a narrow density band. This reflects both robust infrastructure (e.g., stable power, intact roads, high charger density) and high behavioral willingness (due to strong institutional trust and proximity to communications). Suburban areas show slightly broader variance but remain within a reliable zone, clustering between 0.7 and 0.9. Their greater variability stems from mixed zoning, edge-case grid weaknesses, and more diverse population profiles. In contrast, rural and isolated zones present much wider and lower-distribution tails. Rural nodes center around a success rate of 0.55–0.70, with some instances dropping to 0.3 due to single-point failure vulnerabilities (e.g., single road in/out, low charger redundancy) and moderate user reluctance. Isolated nodes exhibit a fat left tail, with a modal success rate around 0.45 and a long tail reaching below 0.2. These nodes often face simultaneous challenges: distance from dispatch depots, high hazard exposure (e.g., canyon fire paths or seismic epicenters), and behavioral resistance due to range anxiety, poor information access, or weak social participation networks. To assess the performance of ERAF, we compare it not only to a generic deterministic model but also to other probabilistic or scenario-based dispatch frameworks. The deterministic model assumes fixed availability and infrastructure conditions, while ERAF integrates real-time uncertainties, offering a more dynamic and accurate approach. We benchmark ERAF against a probabilistic dispatch model, which includes assumptions about uncertainty in EV availability and infrastructure resilience, and a scenario-based dispatch model that simulates different hazard scenarios.
Our experiments show that ERAF significantly outperforms these models. Specifically, ERAF reduces the overestimation of dispatchable capacity by up to 35% compared to the deterministic model and improves dispatch reliability by over 28% under various hazard scenarios. Unlike other probabilistic models, ERAF continuously updates its uncertainty estimates as new data becomes available, making it more adaptable to real-world conditions.
Figure 9 presents the empirical distribution of plug-in delays under three hazard scenarios: earthquake, wildfire, and cyberattack. Delay is measured in minutes from the moment an EV is dispatched to when it successfully connects to a critical load node. The earthquake distribution (shown in blue) exhibits a sharp peak around 20 min, with 80% of plug-ins occurring between 10 and 30 min. This tight concentration reflects the front-loaded decision logic in the ERAF model, where early mobility windows are maximized before road degradation intensifies. The wildfire scenario (pink) yields a broader, flatter distribution. Plug-in times range from under 10 min to over 60 min, with a mean delay of approximately 25 min and a visible right tail extending beyond 70 min. This extended delay range in wildfire cases emerges from dynamic hazard propagation. As the wildfire spreads non-linearly, some previously planned corridors become blocked mid-route, requiring re-routing through longer, less efficient paths. Moreover, behavioral hesitation (e.g., unwillingness to travel near active burn zones) introduces stochastic delays. Cyberattack scenarios (grey) exhibit the most volatile delay distribution, with a bimodal shape and the broadest spread overall. Early plug-ins occur around 15–20 min, but a secondary cluster forms between 40 and 60 min. This reflects partial system paralysis followed by staggered substation recovery or rerouting through undisturbed corridors. From a model validation perspective, this figure reinforces the importance of time-indexed reliability modeling and reoptimization logic in ERAF. The plug-in delay distributions are not only hazard-specific but are directly influenced by behavioral priors, real-time corridor availability, and infrastructure fragility curves. Operationally, this result supports the use of time-weighted reliability scoring and soft-deadline thresholds in dispatch assignment. It also emphasizes that delay is not a passive output but a key input for scenario-based resilience planning, where each hazard demands different assumptions about the spatiotemporal deployment profile of mobile energy assets.
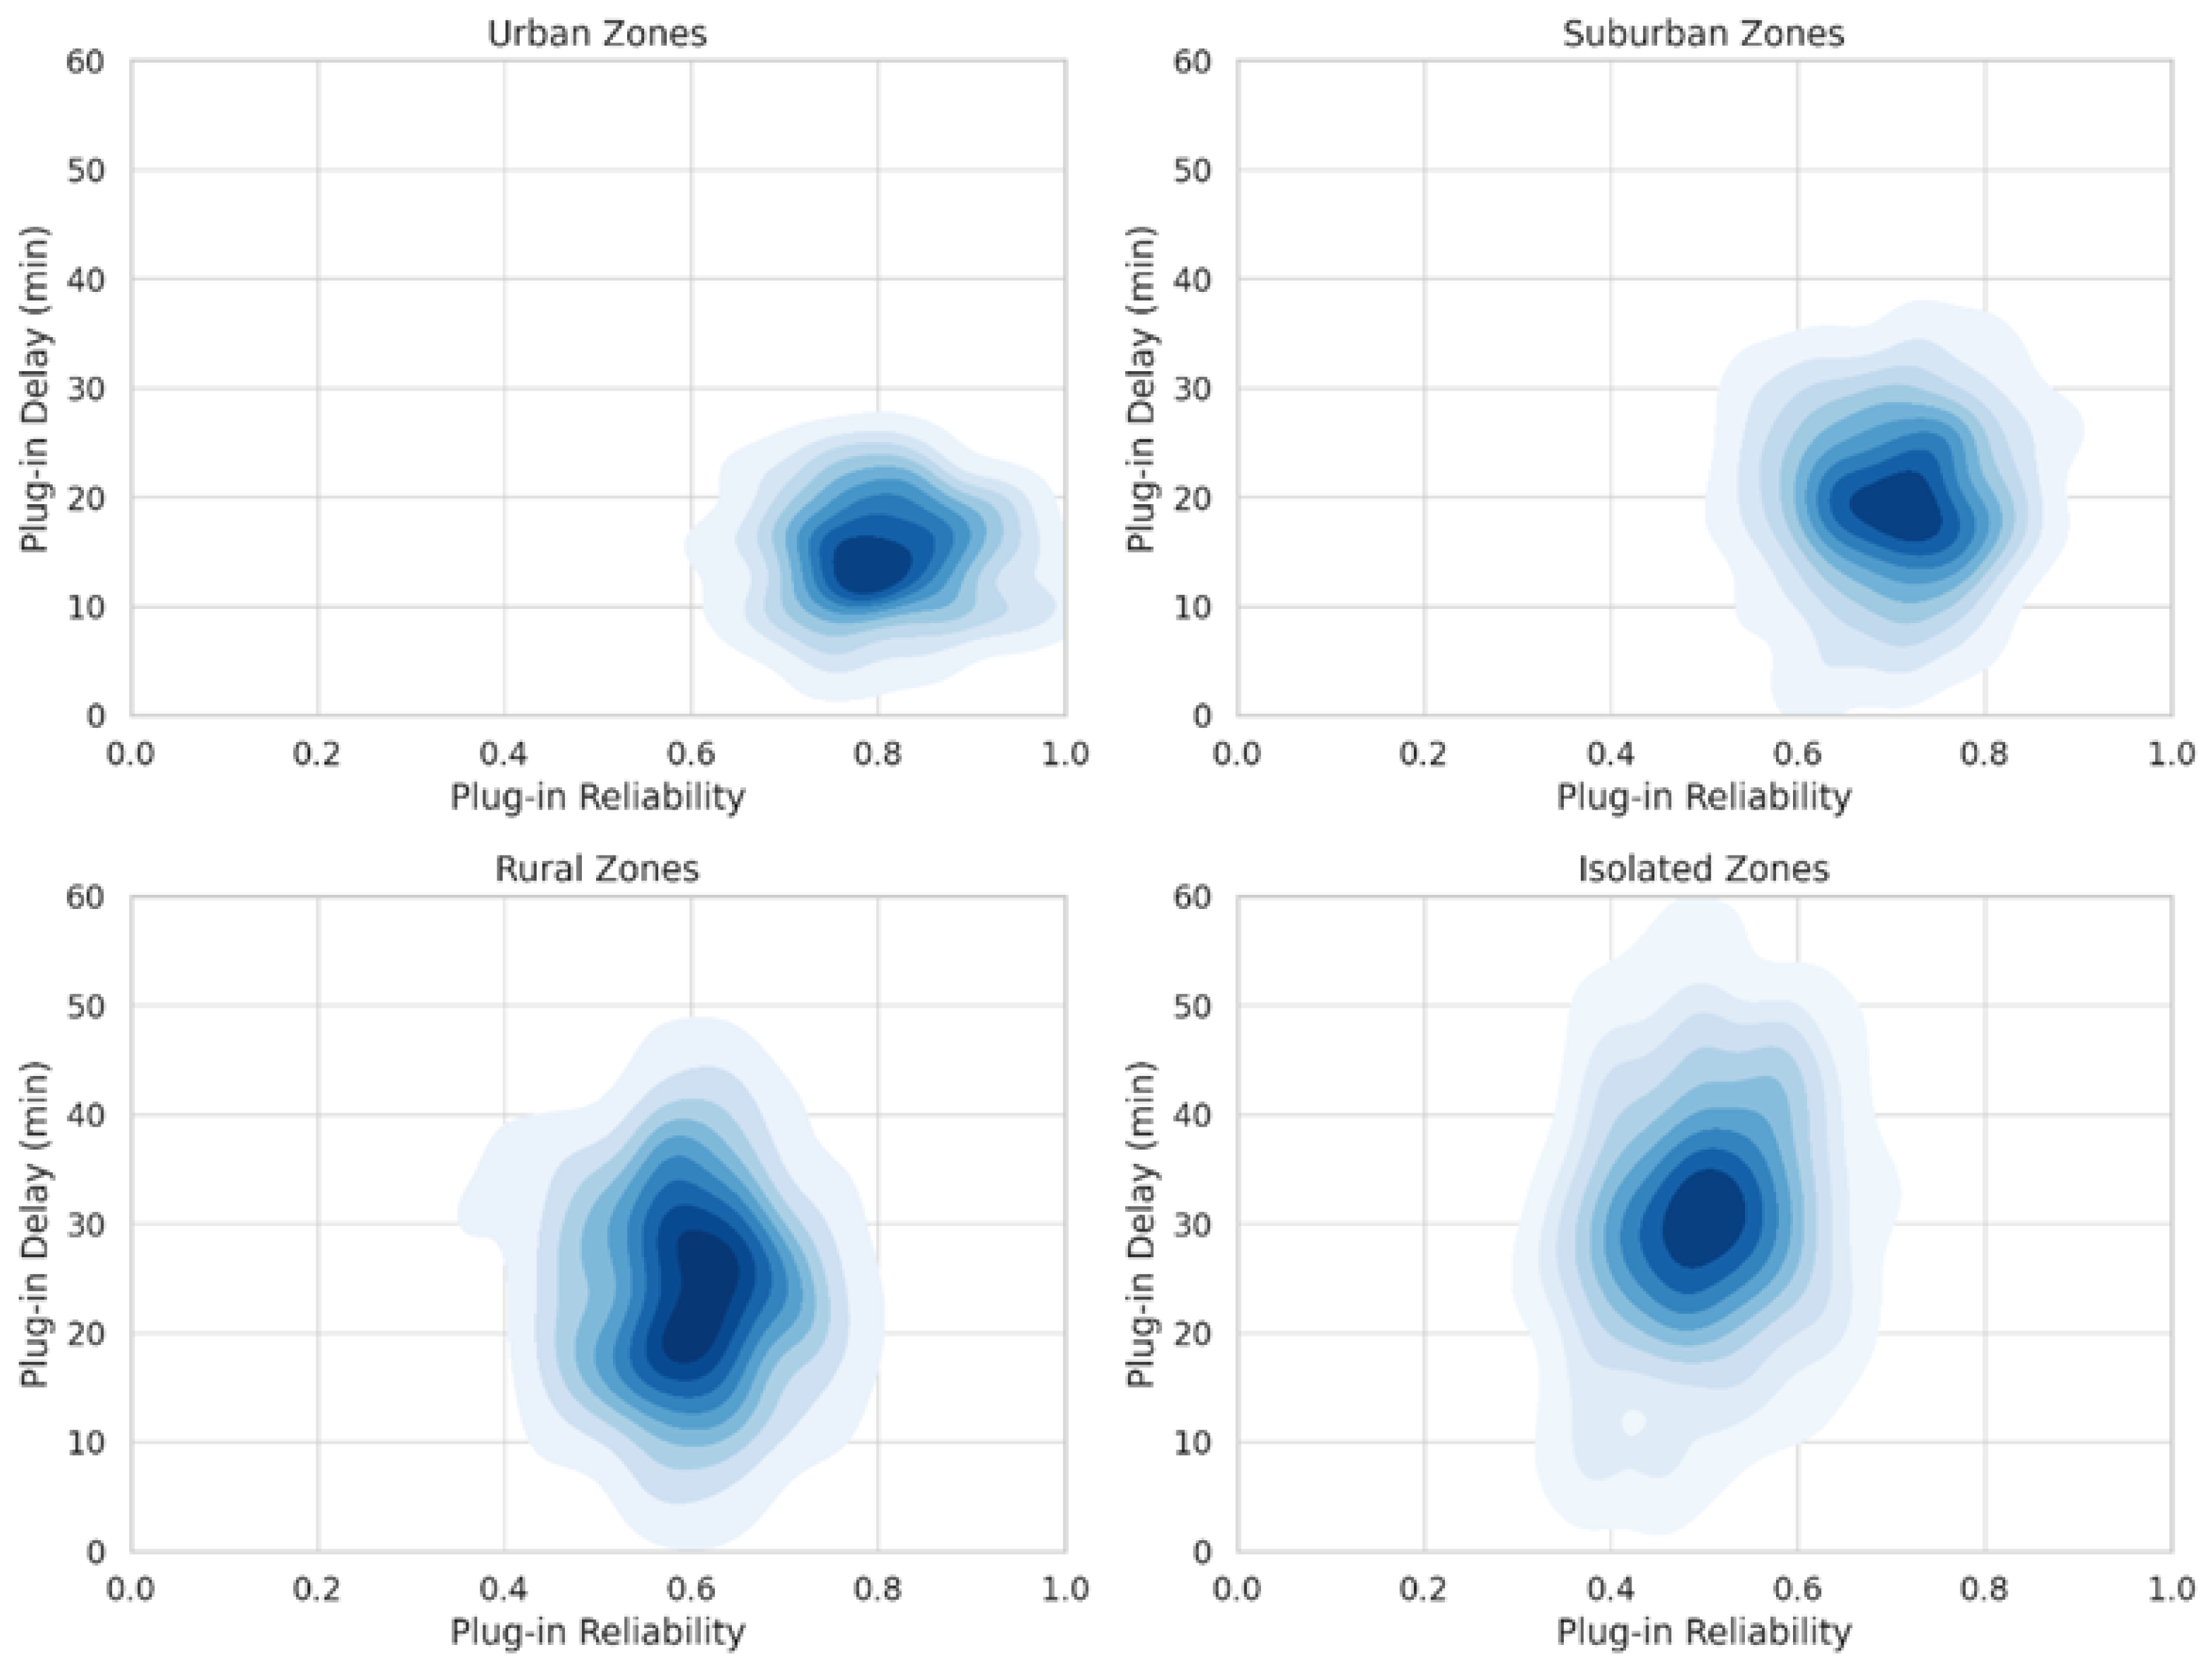
Figure 10 visualization presents kernel density estimates of plug-in reliability versus plug-in delay for four zone typologies—urban, suburban, rural, and isolated. Each subplot encodes the joint distribution of these two critical dispatch performance metrics over a 300-sample simulation ensemble. Plug-in reliability, shown on the x-axis, refers to the Bayesian-estimated probability that an EV will successfully arrive and connect at its designated load node, incorporating both physical constraints (road accessibility, charger operability) and behavioral factors (user willingness, range anxiety). Plug-in delay, plotted on the y-axis, measures the elapsed time (in minutes) from dispatch order issuance to actual plug-in, capturing both routing complexity and EV behavior. Kernel density contours indicate areas of high probability mass, while blank areas suggest sparse or infeasible combinations. Urban zones exhibit a compact high-density cluster in the top-left quadrant (reliability 0.85–1.0, delay 5–20 min), confirming the ERAF model’s expectation that high-density, well-instrumented nodes benefit from both fast delivery and consistent behavioral compliance. This result is driven by high infrastructure redundancy (e.g., multiple roads, chargers per zone), strong communications (enabling plug-in signaling), and high trust/social conformity. Suburban zones display a slightly broader density spread, with a modal reliability of 0.75 and delays ranging from 10 to 30 min. These distributions reflect variability in zoning types, edge-of-grid behavior, and behavioral segmentation—e.g., differing user routines and access to up-to-date hazard information. While suburban performance is generally acceptable, the lower tail of reliability (approaching 0.6) suggests zones that may need targeted reinforcement. Rural and isolated zones show starkly different patterns. Rural density plots are elongated along the delay axis (delays up to 45 min) and shifted leftward, with reliability centered near 0.6–0.7. This indicates that while some vehicles do reach their targets, the system must route through longer, more vulnerable paths, often impacted by hazard dynamics such as bridge loss or firefront spread. In isolated zones, the joint distribution collapses into the bottom-right quadrant, with reliability falling below 0.5 and delays exceeding 40 min in many cases. These combinations are operationally weak—implying long waits and high risk of plug-in failure. In practical terms, this validates the ERAF model’s logic of assigning lower prioritization weight to such zones unless supported by dedicated microgrids or pre-positioned assets. This figure also provides a clear diagnostic lens for scenario preparation: zones in the bottom-left quadrant (low reliability, low delay) may need behavioral outreach, while zones in the top-right (high reliability, long delay) may be salvageable with routing enhancements. Ultimately, these joint distributions make a strong case for location-specific strategy rather than uniform dispatch assumptions across the grid.
To assess the computational complexity and scalability of the proposed Emergency-Responsive Aggregation Framework (ERAF), we analyzed its core components—Bayesian inference, GIS filtering, and multi-objective optimization. The complexity of Bayesian inference scales linearly with the number of EVs and hazard scenarios. Although the process runs efficiently for the 122,487 EVs in our case study, larger datasets or extended emergency durations would require high-performance computing or cloud infrastructure. The GIS filtering module processes large raster datasets to exclude inaccessible paths and compromised corridors. While this works well for medium-sized regions, as the region size increases, the complexity grows. Optimized GIS libraries and spatial indexing help address this challenge. The multi-objective optimization module balances competing priorities in dispatch decisions, with complexity increasing as more decision variables are added. While the optimization works efficiently for our 4 h window, larger-scale applications will benefit from parallel computing or distributed optimization techniques.
Overall, the framework’s modular structure allows for scalability, and with the increasing availability of distributed computing resources, it is feasible to deploy ERAF for larger regions and longer emergencies.

5. Conclusions

This paper introduces a novel Emergency-Responsive Aggregation Framework (ERAF) for leveraging electric vehicles (EVs) as mobile energy resources under multi-hazard disruptions. Unlike conventional dispatch frameworks that assume static availability and deterministic infrastructure conditions, ERAF dynamically integrates hazard-specific infrastructure degradation, real-time behavioral uncertainty, and spatial accessibility constraints into a unified probabilistic optimization paradigm. At the core of the model is a Bayesian inference engine that estimates plug-in availability based on scenario-dependent variables including damage indices, road accessibility, and user trust-risk behavior. These probabilistic estimates are further refined using a GIS-based spatial filter that dynamically excludes inaccessible or damaged corridors, enabling the model to generate a continuously updated, feasibility-aware dispatch plan. The framework is validated through a high-resolution case study of Southern California, simulating the deployment of over 122,000 EVs across three distinct hazard scenarios: earthquake, wildfire, and cyberattack. The results show that ignoring behavioral and spatial constraints leads to substantial overestimation of dispatchable capacity and underestimation of deployment delays, especially in rural and isolated zones. ERAF not only corrects these errors but also improves dispatch reliability by over 28% across scenarios, while maintaining reasonable tradeoffs between response time and power delivery. The joint analysis of routing entropy, reliability-delay distribution, and node-level priority execution confirms the need for real-time, probabilistically grounded strategies in large-scale emergency operations. Moreover, the analysis reveals emergent system behavior—such as entropy collapse, behavioral bottlenecks, and spatiotemporal fragmentation—which cannot be captured by traditional deterministic or scenario-based models.
In the context of partial or complete grid outages, the ERAF is designed to support decentralized and flexible energy delivery without compromising system restart capabilities. Specifically, ERAF does not assume continuous grid-wide operability but rather coordinates EV dispatch to isolated critical nodes (e.g., hospitals, shelters) with local balancing of supply and demand. These deployments are intended to serve as temporary black-start support or autonomous microgrid islands rather than replace centralized grid recovery.
Moreover, while the framework is compatible with smart grid infrastructure—including real-time monitoring, DER coordination, and V2G interfaces—it does not strictly require full smart grid deployment. ERAF can also operate in constrained communication environments by leveraging pre-defined fallback routing and local priority heuristics. The integration of EVs as mobile energy carriers is envisioned as an augmentation to grid resilience planning, rather than a replacement for conventional restoration protocols. This ensures that post-event system restoration can proceed without introducing instabilities or uncontrolled load injections.

Author Contributions

Conceptualization, X.C.; Methodology, X.C. and X.L. (Xuebin Li); Software, X.C. and X.L. (Xuebin Li); Validation, X.L. (Xiulan Liu); Formal analysis, X.L. (Xiulan Liu) and X.Y.; Investigation, X.Y. and S.L.; Resources, Y.L.; Data curation, Y.L.; Writing—original draft, X.C., X.L. (Xiulan Liu), X.Y., Y.L., S.L. and X.L. (Xuebin Li); Writing—review & editing, X.Y., Y.L. and S.L.; Visualization, Y.L.; Project administration, S.L.; Funding acquisition, S.L. All authors have read and agreed to the published version of the manuscript.

Funding

This research was funded by the Science and Technology Project of State Grid Corporation of China, Research on Cluster Electric Vehicle Aggregation and Control Technology for Enhancing Emergency Power Supply Capacity of Urban Power Grid, grant number 52022324000M.

Institutional Review Board Statement

Not applicable.

Informed Consent Statement

Not applicable.

Data Availability Statement

The data presented in this study are available on request from the corresponding author.

Conflicts of Interest

The authors declare no conflicts of interest.

References

  1. Shang, Y.; Li, D.; Li, Y.; Li, S. Explainable spatiotemporal multi-task learning for electric vehicle charging demand prediction. Appl. Energy 2025, 384, 125460. [Google Scholar] [CrossRef]
  2. Sahin, H. Hydrogen refueling of a fuel cell electric vehicle. Int. J. Hydrogen Energy 2024, 75, 604–612. [Google Scholar] [CrossRef]
  3. Hasturk, U.; Schrotenboer, A.H.; Ursavas, E.; Roodbergen, K.J. Stochastic Cyclic Inventory Routing with Supply Uncertainty: A Case in Green-Hydrogen Logistics. Transp. Sci. 2024, 58, 315–339. [Google Scholar] [CrossRef]
  4. Shi, L.; Hu, B. Frontiers in Operations: Battery as a Service: Flexible Electric Vehicle Battery Leasing. Manuf. Serv. Oper. Manag. 2024, 26, 1189–1585. [Google Scholar] [CrossRef]
  5. Feng, B.; Xu, H.; Huang, G.; Liu, Z.; Guo, C.; Chen, Z. Byzantine-Resilient Economical Operation Strategy Based on Federated Deep Reinforcement Learning for Multiple Electric Vehicle Charging Stations Considering Data Privacy. J. Mod. Power Syst. Clean Energy 2024, 12, 1957–1967. [Google Scholar] [CrossRef]
  6. Yang, H.; Xu, Y.; Sun, H.; Guo, Q.; Liu, Q. Electric Vehicles Management in Distribution Network: A Data-Efficient Bi-level Safe Deep Reinforcement Learning Method. IEEE Trans. Power Syst. 2024, 40, 256–271. [Google Scholar] [CrossRef]
  7. Zhao, A.P.; Li, S.; Li, Z.; Wang, Z.; Fei, X.; Hu, Z.; Alhazmi, M.; Yan, X.; Wu, C.; Lu, S.; et al. Electric Vehicle Charging Planning: A Complex Systems Perspective. IEEE Trans. Smart Grid 2025, 16, 754–772. [Google Scholar] [CrossRef]
  8. Kumar, B.V.; Farhan, M.A.A. Optimal Simultaneous Allocation of Electric Vehicle Charging Stations and Capacitors in Radial Distribution Network Considering Reliability. J. Mod. Power Syst. Clean Energy 2024, 12, 1584–1595. [Google Scholar] [CrossRef]
  9. Chen, G.; Zhang, Z. Control Strategies, Economic Benefits, and Challenges of Vehicle-to-Grid Applications: Recent Trends Research. World Electr. Veh. J. 2024, 15, 190. [Google Scholar] [CrossRef]
  10. Leijon, J.; Döhler, J.S.; Hjalmarsson, J.; Brandell, D.; Castellucci, V.; Boström, C. An Analysis of Vehicle-to-Grid in Sweden Using MATLAB/Simulink. World Electr. Veh. J. 2024, 15, 153. [Google Scholar] [CrossRef]
  11. Babar, Y.; Burtch, G. Recharging Retail: Estimating Consumer Demand Spillovers from Electric Vehicle Charging Stations. Manuf. Serv. Oper. Manag. 2024, 26, 797–1187. [Google Scholar] [CrossRef]
  12. Alyami, S. Ensuring Sustainable Grid Stability through Effective EV Charging Management: A Time and Energy-Based Approach. Sustainability 2024, 16, 6149. [Google Scholar] [CrossRef]
  13. Dar, A.R.; Haque, A.; Khan, M.A.; Kurukuru, V.S.; Mehfuz, S. On-Board Chargers for Electric Vehicles: A Comprehensive Performance and Efficiency Review. Energies 2024, 17, 4534. [Google Scholar] [CrossRef]
  14. Basnet, M.; Ali, M.H. Deep Reinforcement Learning-Driven Mitigation of Adverse Effects of Cyber-Attacks on Electric Vehicle Charging Station. Energies 2023, 16, 7296. [Google Scholar] [CrossRef]
  15. Li, T.T.; Zhao, A.P.; Wang, Y.; Li, S.; Fei, J.; Wang, Z.; Xiang, Y. Integrating solar-powered electric vehicles into sustainable energy systems. Nat. Rev. Electr. Eng. 2025, 2, 467–479. [Google Scholar] [CrossRef]
  16. Quan, S.; He, H.; Chen, J.; Zhang, Z.; Han, R.; Wang, Y.-X. Health-aware model predictive energy management for fuel cell electric vehicle based on hybrid modeling method. Energy 2023, 278, 127919. [Google Scholar] [CrossRef]
  17. Chan, C.C.; Han, W.; Tian, H.; Liu, Y.; Ma, T.; Jiang, C.Q. Automotive revolution and carbon neutrality. Front. Energy 2023, 17, 693–703. [Google Scholar] [CrossRef]
  18. Acharya, S.; Mieth, R.; Konstantinou, C.; Karri, R.; Dvorkin, Y. Cyber Insurance Against Cyberattacks on Electric Vehicle Charging Stations. IEEE Trans. Smart Grid 2022, 13, 1529–1541. [Google Scholar] [CrossRef]
  19. Mastoi, M.S.; Zhuang, S.; Munir, H.M.; Haris, M.; Hassan, M.; Usman, M.; Bukhari, S.S.H.; Ro, J.-S. An in-depth analysis of electric vehicle charging station infrastructure, policy implications, and future trends. Energy Rep. 2022, 8, 11504–11529. [Google Scholar] [CrossRef]
  20. Li, T.T.; Zhao, A.P.; Wang, Y.; Alhazmi, M. Hybrid energy storage for dairy farms: Enhancing energy efficiency and operational resilience. J. Energy Storage 2025, 114, 115811. [Google Scholar] [CrossRef]
  21. Franco, F.L.; Mandrioli, R.; Ricco, M.; Monteiro, V.; Monteiro, L.F.C.; Afonso, J.L.; Grandi, G. Electric Vehicles Charging Management System for Optimal Exploitation of Photovoltaic Energy Sources Considering Vehicle-to-Vehicle Mode. Front. Energy Res. 2021, 9, 716389. [Google Scholar] [CrossRef]
  22. Qian, T.; Shao, C.; Li, X.; Wang, X.; Shahidehpour, M. Enhanced Coordinated Operations of Electric Power and Transportation Networks via EV Charging Services. IEEE Trans. Smart Grid 2020, 11, 3019–3030. [Google Scholar] [CrossRef]
  23. Zhao, A.P.; Alhazmi, M.; Huo, D.; Li, W. Psychological modeling for community energy systems. Energy Rep. 2025, 13, 2219–2229. [Google Scholar] [CrossRef]
  24. Guo, Z.; Afifah, F.; Qi, J.; Baghali, S. A Stochastic Multi-Agent Optimization Framework for Interdependent Transportation and Power System Analyses. IEEE Trans. Transp. Electrif. 2021, 7, 1088–1098. [Google Scholar] [CrossRef]
  25. Li, S.; He, H.; Zhao, P. Energy management for hybrid energy storage system in electric vehicle: A cyber-physical system perspective. Energy 2021, 230, 120890. [Google Scholar] [CrossRef]
  26. Ren, H.; Tseng, C.L.; Wen, F.; Wang, C.; Chen, G.; Li, X. Scenario-Based Optimal Real-Time Charging Strategy of Electric Vehicles with Bayesian Long Short-Term Memory Networks. J. Mod. Power Syst. Clean Energy 2024, 12, 1572–1583. [Google Scholar] [CrossRef]
  27. Ma, X.; Ning, C.; Li, L.; Qiu, H.; Gu, W.; Dong, Z. Bayesian Nonparametric Two-Stage Distributionally Robust Unit Commitment Optimization: From Global Multimodality to Local Trimming-Wasserstein Ambiguity. IEEE Trans. Power Syst. 2024, 39, 6702–6715. [Google Scholar] [CrossRef]
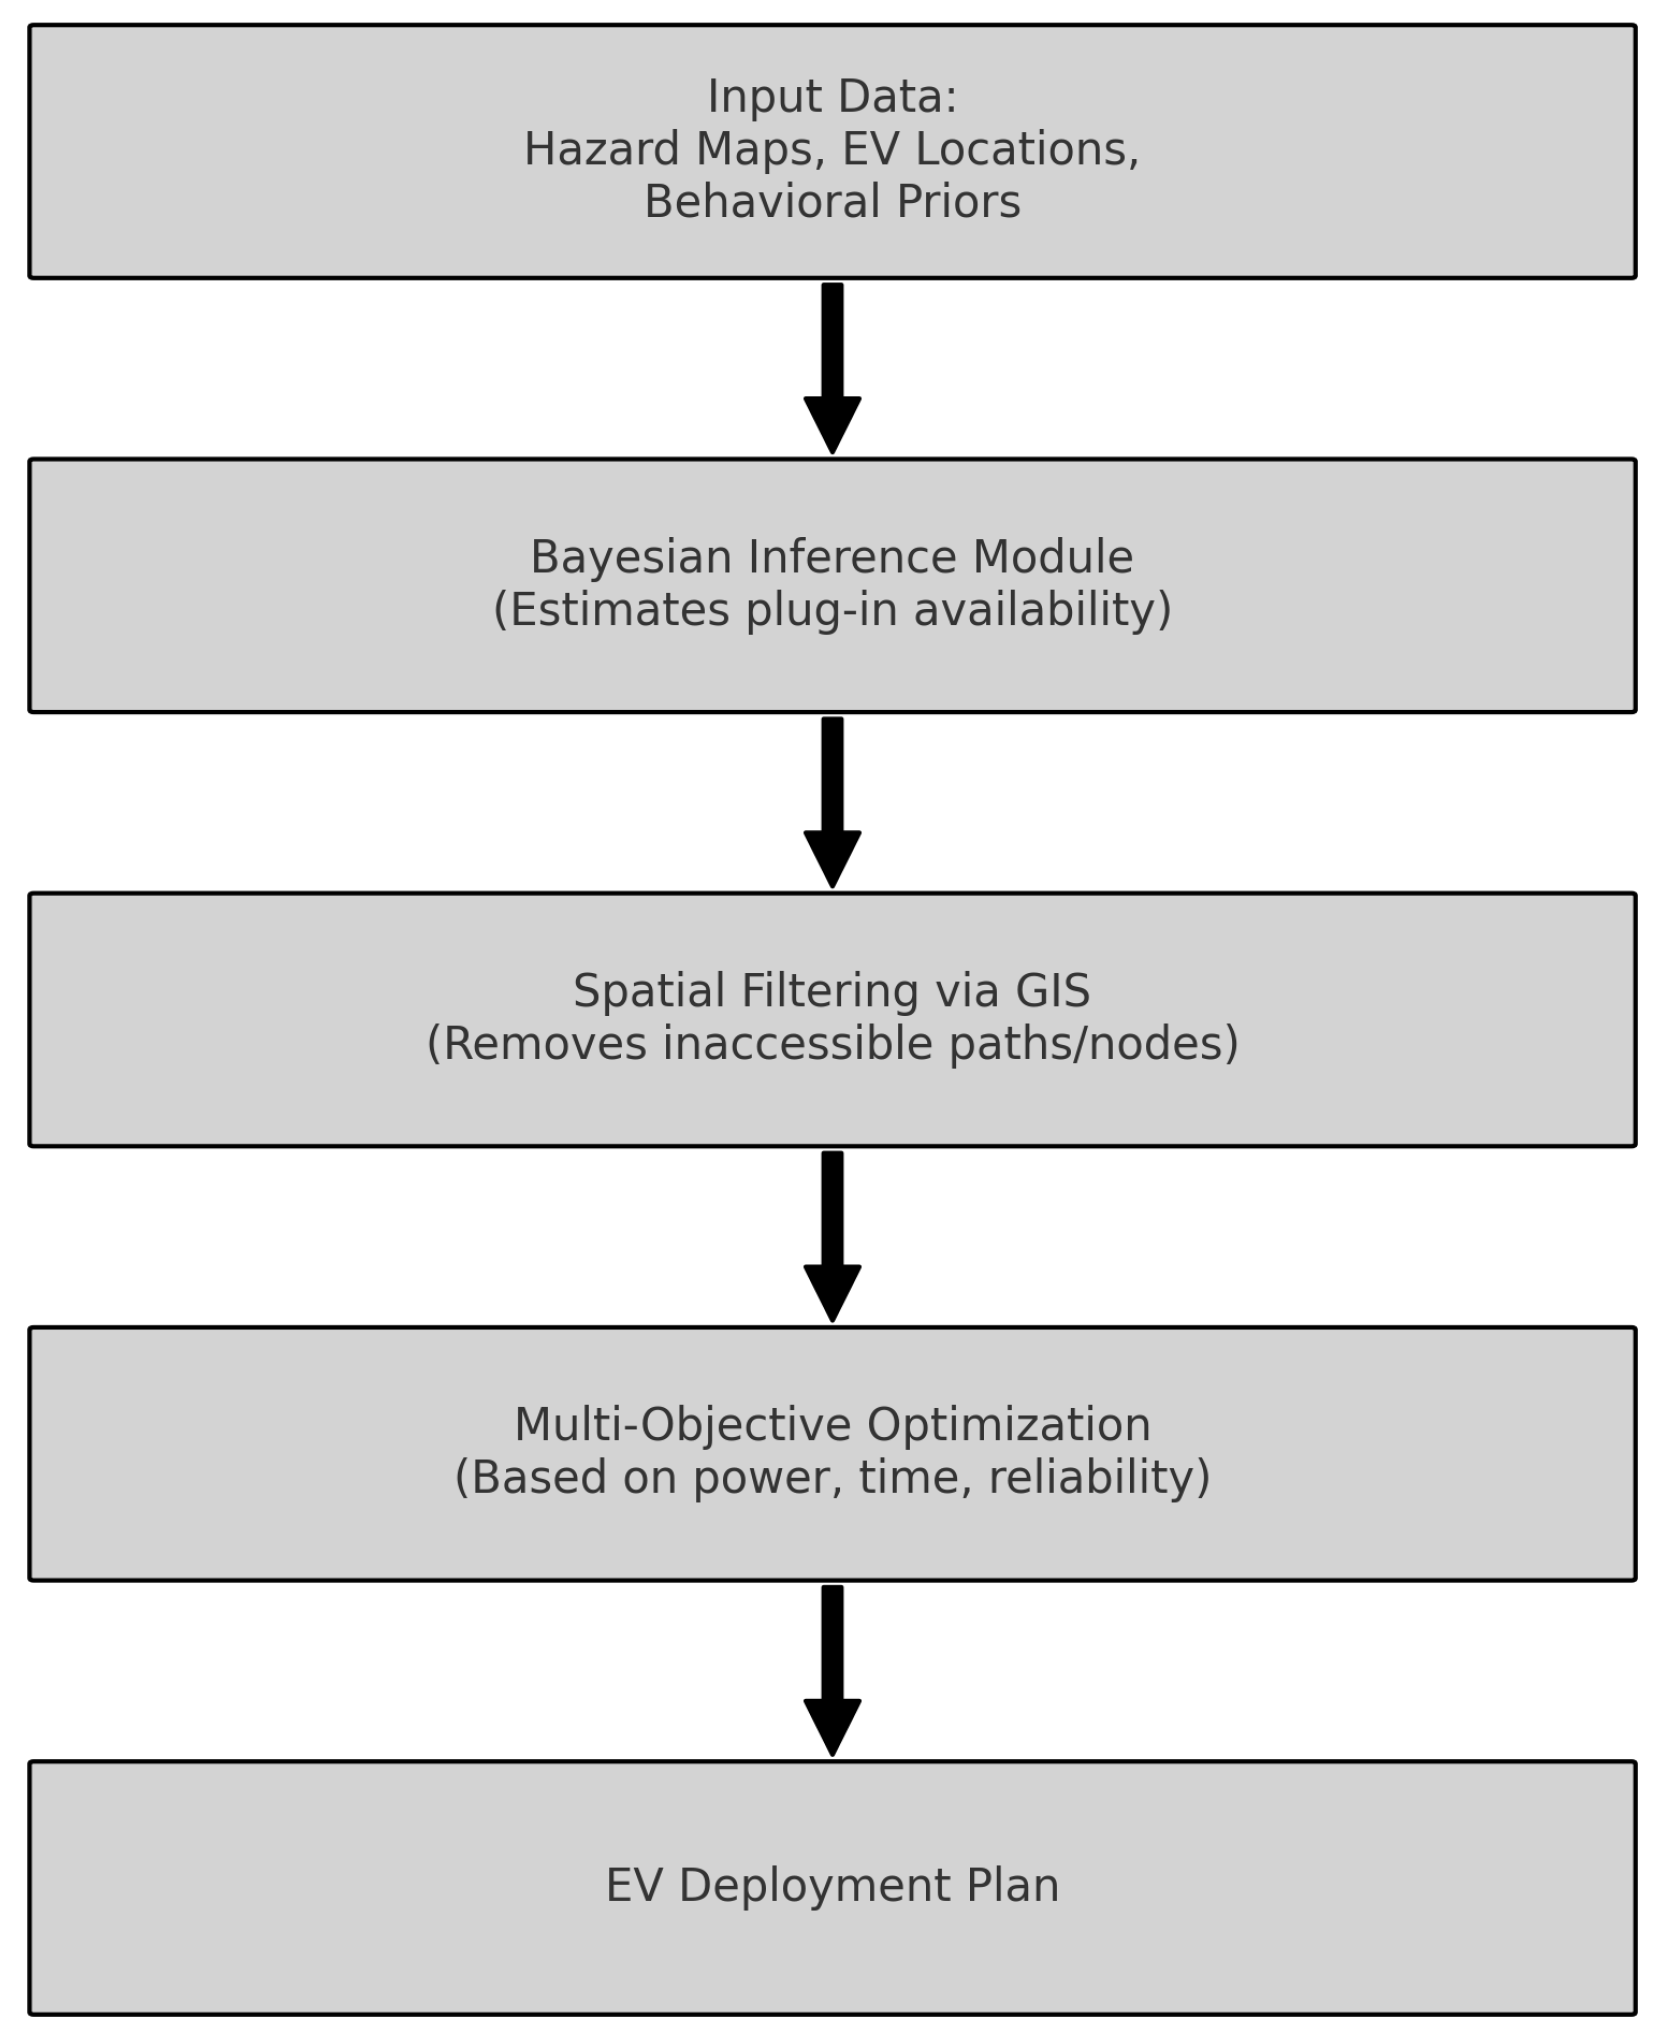
Figure 1. Architecture of the emergency-responsive aggregation framework.
Energies 18 04629 g001
Figure 2. Statistical distribution of EV battery capacities and initial state of charge by vehicle class.
Energies 18 04629 g002
Figure 3. Fragility curves of charging infrastructure under earthquake, wildfire, and cyberattack hazards.
Energies 18 04629 g003
Figure 4. User behavioral priors for plug-in willingness by zone type.
Energies 18 04629 g004
Figure 5. Behavioral impact on effective dispatchable capacity.
Energies 18 04629 g005
Figure 6. Temporal reliability curve under three hazard scenarios.
Energies 18 04629 g006
Figure 7. Spatiotemporal corridor availability under evolving hazard.
Energies 18 04629 g007
Figure 8. Node-level dispatch success rate distribution by zone type.
Energies 18 04629 g008
Figure 9. Plug-in delay distribution by hazard scenario.
Energies 18 04629 g009
Figure 10. Joint reliability–delay distribution by zone type.
Energies 18 04629 g010
Table 1. Summary of major data sources used in the experiment.
Data SourceDescription
California DMV RecordsElectric vehicle (EV) registration data, including fleet size, model types, and distribution across Southern California counties.
OpenSHASeismic hazard data, including Peak Ground Acceleration (PGA) maps used to model earthquake-induced road and infrastructure damage.
MODIS and VIIRSWildfire data, including historical fire perimeters and propagation models used to simulate wildfire hazard zones.
U.S. DOE Alternative Fuel Data CenterPublic EV charging station locations and operational data, including charger types (Level-2, Level-3) and fragility profiles for hazard analysis.
OpenStreetMap (OSM)Road network topology data, used to model vehicle routes and network connectivity in the context of dynamic hazard scenarios.
NREL ResStock and ReEDSCyberattack scenario data, including grid topology and DER control systems, used for simulating cyberattack-induced infrastructure disruptions.
Disclaimer/Publisher’s Note: The statements, opinions and data contained in all publications are solely those of the individual author(s) and contributor(s) and not of MDPI and/or the editor(s). MDPI and/or the editor(s) disclaim responsibility for any injury to people or property resulting from any ideas, methods, instructions or products referred to in the content.