Article

Multi-Faceted Collaborative Investment Models and Investment Benefit Assessment Under the New Type Power System

1
State Grid Shanghai Electric Power Company Economic and Technical Research Institute, Shanghai 200002, China
2
School of Economics and Management, Shanghai University of Electric Power, Shanghai 200090, China
*
Author to whom correspondence should be addressed.
Energies 2025, 18(15), 4031; https://doi.org/10.3390/en18154031
Submission received: 10 June 2025 / Revised: 10 July 2025 / Accepted: 21 July 2025 / Published: 29 July 2025

Abstract

Driven by the goal of “double carbon”, we propose an investment proportion optimization method based on cooperative game theory to optimize the investment of multiple entities and evaluate the effectiveness of the new power system. The asymmetric Nash negotiation model is introduced to balance the interests of each investment entity. At the same time, a comprehensive investment benefit evaluation index system covering economic, environmental, and social benefits is constructed, and the overall investment benefit evaluation is obtained by using the Delphi method, analytic hierarchy process, and fuzzy comprehensive evaluation method. Through the case analysis of the multi-energy complementary energy system project investment, the validity of the multi-subject investment proportion optimization model and the investment benefit analysis model are verified, and the feasibility of the project investment is demonstrated to provide theoretical guidance and practical reference for the research in related fields.

1. Introduction

With the accelerated progress of carbon peaking and carbon neutrality, energy production is accelerating towards clean energy, energy consumption is becoming highly electrified, energy allocation is increasingly platform-based, and energy utilization is becoming more efficient. Accelerating the construction of a new type of power system dominated by new energy is an inevitable choice to achieve the “3060” target. The construction of this new type of power system will reconstruct the production, consumption, storage, and transportation methods of electricity and will promote the energy and power industry to accelerate the shift towards a development model characterized by multi-party interaction and ecological coexistence. A large number of new production, consumption, and energy storage units, such as distributed photovoltaics, electrochemical energy storage, and collection stations, are emerging, with multi-party interaction among sources, grids, loads, and storage. Traditional power systems will gradually go through stages such as “large-scale access of renewable energy-mutual adaptation of sources, grids, and storage—synergy of sources, grids, storage, and loads” to transform into a new type of power system.
Under the “double carbon” drive, the load structure of the new power system will be more diversified, and the power alternative development strategies of “replacing oil with electricity” and “replacing coal with electricity” will be implemented one after another. In terms of power supply structure, the supply side has changed from thermal power stations with controllable continuous output to new energy power generation installations with strong uncertainty and weak controllable output [1]. In terms of load structure and characteristics, load characteristics are changing from the traditional rigid, pure consumption types to the flexible, production and consumption types [2]. In terms of power grid form, the traditional power grid, which is dominated by one-way, step-by-step transmission, is transformed into a two-way interactive energy Internet, including AC-DC hybrid power grids, micro-grids, local DC grids, and adjustable loads [3]. In terms of operation characteristics, the real-time balance mode of the source with load and the integrated control mode of the large power grid are changed to the non-complete real-time balance mode of the load and storage synergistic interaction of the source network, as well as the collaborative control mode of the large power grid and the micro-power grid [4].
The National Development and Reform Commission and the National Energy Administration issued the Notice on Accelerating the Construction of the Power Spot Market (No. 129 of the Development and Reform Office in 2022), referring to guiding new market players such as energy storage, distributed energy, new energy vehicles, virtual power plants, and energy complexes. The market players in the incremental distribution network and microgrid participate in the spot market and fully stimulate and release the flexible adjustment ability of the user side. Therefore, in the context of the new environment, how to formulate a new type of main investment model and investment benefit evaluation has become a new research direction.
We aim to clarify the investment models and investment benefit evaluation methods of new entities such as distributed photovoltaics, energy storage, and gathering stations to provide references for relevant investment entities when making project decisions, help them cope with the changes brought by the development of new power systems, and ensure the safe and reliable operation of power systems and a secure power supply. Firstly, the paper analyzes the potential investors and their key investment factors in the new energy main projects to clarify the key factors in the investment decisions of different potential investors. Secondly, it sorts out the more extensive multi-subject investment models and analyzes the advantages and disadvantages of each model. Thirdly, based on this, the calculation model of investment proportion is established to clarify the optimal investment proportion of different investment entities. Finally, considering the economic benefit, environmental benefit, and social benefits comprehensively, the investment benefit evaluation model is constructed, and the specific investment project is analyzed.
The research contributions of this paper are as follows: first, an investment ratio optimization method based on cooperative game theory is proposed. Through this method, the investment proportions of different investment entities can be optimized, which is conducive to improving the satisfaction of each investment entity, solving the problem of unfair distribution of investment costs in the alliance, and maintaining the stability of the alliance. Second, an index system and model for investment benefit analysis have been established. This indicator system and model can comprehensively and scientifically analyze and evaluate the investment benefits of multi-energy complementary energy collection station projects, providing strong support for the investment decisions of these projects. Third, it can provide empirical analysis and evaluation for the investment in multi-energy complementary energy collection station projects. It provides an empirical reference for the investment of similar multi-energy complementary energy collection station projects, verifies the validity and practicality of the proposed method and model, and is conducive to promoting the development of multi-energy complementary energy system projects.
The structure of this paper is outlined as follows: Section 2 is the literature review of multiple investment subjects and project investment benefit evaluation. Section 3 is the analysis of multiple investment subjects and investment models. Section 4 is the calculation of the optimal investment proportion of multiple investment entities. Section 5 is the project investment benefit analysis and evaluation model. Section 6 is a multi-energy complementary energy system project investment case analysis. Finally, Section 7 summarizes the paper.

2. Literature Review

2.1. Multiple Investment Entities

The research of multiple investment entities covers the classification and characteristics of investment entities, investment decisions and behavior, investment performance evaluation and risk management, policy and system impact, and supervision and governance mechanisms.
First, in the study on the classification and characteristics of diversified investment entities, Aziz et al. [5] pointed out that diversified investment entities include the government, state-owned enterprises, private enterprises, foreign-funded enterprises, financial institutions, and individual investors, etc., which can be further subdivided into investment entities of different industries, sizes, and regions. The characteristics of multiple investment subjects include investment motivation, risk preference, capital strength, decision-making mechanisms, and so on. For example, government investment is usually public and strategic, focusing on social benefits and long-term interests; private enterprises pay more attention to the return on investment and market opportunities, and their decision-making is relatively flexible. Individual investors are generally more focused on short-term gains and dividends, while institutional investors are more focused on long-term investments and asset allocation [6,7].
Second, in the research of multi-subject investment decision-making processes and behavior patterns, the main analysis focuses on the differences and characteristics in the selection, evaluation, and decision-making processes of multi-subject investments [8]. For example, large enterprises may have a sound internal decision-making process and a professional investment team, while small and medium-sized investors may rely more on external information and market trends. Zhang et al. [9] pointed out the investment behavior patterns of investors in different market environments, including investment timing selection, asset allocation strategies, and portfolio construction. For example, in times of economic prosperity, investors with a high-risk appetite may increase their investments in riskier assets such as stocks and emerging industries. In a recession, they tend to invest more conservatively, such as bonds and gold.
Third, in the study of multi-subject investment performance evaluation and risk management, most scholars have established a comprehensive and scientific performance evaluation index system, which not only includes traditional financial indicators such as return rate, volatility, and Sharpe ratio, as well as multi-dimensional factors such as portfolio risk diversification, industry concentration, and correlation between different asset classes [10,11,12]. Xu et al. [13] believe that different investment entities face different risks due to their different investment fields and approaches. The types of risks faced by diversified investment entities include market risk, credit risk, policy risk, and operational risk [14]. Diversified investment entities can take appropriate risk control measures to reduce investment risks according to their risk tolerance.
Fourth, the government policy and the institutional environment have an important impact on the behavior and performance of diversified investment entities. Government subsidies and policy guidance can effectively stimulate the investment enthusiasm of various entities and promote diversified investment in disruptive technologies. In addition, the government’s role in infrastructure construction and public service provision cannot be ignored, these factors can create a good investment environment for investors [15]. Sima et al. [16] pointed out that relevant laws, regulations, and institutional arrangements have a protective effect on multiple investment entities, such as property rights protection, contract fulfillment, and market competition order.
Fifth, the impact of the regulatory system and governance structure on the decision-making of multiple investment entities. Zhao et al. [17] built a regulatory system for multiple investment entities, clarifying the responsibilities and authorities of different regulatory entities such as government supervision, industry self-discipline, and social supervision. In the financial market, securities regulatory authorities, industry associations, and media together constitute a regulatory network for investment entities. In addition, some scholars have studied the governance structure of projects or enterprises with the participation of multiple investors, such as equity structure, composition of the board of directors, decision-making procedures, etc. A reasonable governance structure will help balance the interests of all parties and make decision-making more scientific and transparent [18].
In addition, some scholars have studied the development of financial markets, the influence of social and cultural factors, and the interaction between multiple investment entities.

2.2. Project Investment Benefit Evaluation

Project investment benefit evaluation is an important means to measure whether the investment project reaches the expected goal and whether it has economic feasibility and social value. The research on project investment benefit evaluation has made remarkable progress in many fields, including the construction of an evaluation index system, the innovation and application of evaluation methods, and the post-evaluation of government investment projects.
First, in the research on the construction of a project investment benefit evaluation index system, usually based on the principles of policy, quantifiable comparison, classification, dynamics, and timeliness, the basic indicators that can best reflect the objective needs are selected, and the comprehensive benefit evaluation index system of investment projects that can coordinate market conditions, technical analysis, economic benefits, social benefits, and management benefits is established [19]. Based on the model of “ESG+ comprehensive performance evaluation of investment projects”, He Chi et al. [20] made investment decisions on investment projects from three dimensions of environment, society, and governance, providing the experience for comprehensive performance evaluation and decision-making of investment projects.
Second, in the research of innovation and application of project evaluation methods, the evaluation of project economic benefits is an important basis for judging whether the project investment is reasonable. The common methods include the net present value method (NPV), internal rate of return method, cost-benefit analysis method, real options method (ROV), and analytic hierarchy process (AHP). Song Xiaomin et al. [21] established a project investment correlation optimization model and proved the scientific rationality of the model through empirical analysis, which provided a new method for the economic benefit evaluation of project investment. Some scholars have also introduced the internal rate of return (IRR) and investment payback period into long-term project feasibility studies, which greatly enriched the financial evaluation methods of investment decisions. Liao Hongbin et al. [22] established the evaluation index system of project investment decisions based on the grounded theory and evaluated the quantitative index and the qualitative index respectively by using the cross-efficiency evaluation method and the fuzzy comprehensive evaluation method.
Third, in the research on the post-evaluation of government investment projects, Zou [23] pointed out that there are mainly institutional problems in the post-evaluation of government investment projects, such as the unclear status of “tripartite subjects”, the vacancy of criteria for scope establishment, the absence of procedural regulation functions, and the existence of loopholes in the responsibility system. In addition, it is necessary to address further issues such as fuzzy evaluation objects, delayed evaluation time points, and insufficient application of results in the process of perfect evaluation. Most scholars believe that the post-evaluation of government investment projects is a comprehensive evaluation system, which should not be limited to the above economic effect evaluation but should be extended to multidimensional social benefit evaluation, such as people’s livelihood and welfare, ecological environment, technical level, and sustainability. They also suggest that the evaluation objects should be further clarified, thematic evaluation should be added, the evaluation time should be moved forward, and the application of results should be strengthened to achieve effective government investment.
In addition, some scholars have evaluated the investment benefits of projects from the perspectives of environmental impact, climate change impact, and digital transformation requirements. Some scholars analyze the cost, income, and related risk factors of the project in detail through actual benefit evaluation cases to evaluate its potential return and investment value.

2.3. Research Progress on Comprehensive Decision-Making and Modeling of Energy Systems

First, in the field of energy system investment modeling, significant progress has been made in this area. Researchers have developed various models to evaluate the investment benefits of energy projects, including dynamic optimization models (such as in reference [24]) and machine learning-based prediction models (such as in reference [25]). These models not only take into account technical parameters but also incorporate economic and policy factors to provide a more comprehensive assessment of investment decisions.
Secondly, in the aspect of multi-agent decision-making, researchers have paid particular attention to decision-making methods under uncertain conditions. Game theory and multi-objective optimization are commonly used methods, which are employed to analyze the conflicts of interest and cooperation opportunities among different agents. For instance, reference [26] utilized game theory to analyze the behaviors of different stakeholders in the energy market and proposed strategies for optimizing investment proportions. Additionally, reference [27] employed the multi-objective optimization method to investigate how to balance economic, environmental, and social benefits under uncertain conditions.
Thirdly, integrating technical, economic and policy models into energy system investment decisions is a current research hotspot. Researchers attempt to evaluate the comprehensive benefits of projects through comprehensive models. For instance, reference [28] developed a comprehensive model that combines the performance of renewable energy technologies with economic and policy factors to assess the investment benefits of the projects.
Lilliu et al. [29] propose a P2P energy trading optimization algorithm for any size of producer-consumer coalition to optimize the peaking objective through a novel sales function incentive mechanism. Simulations based on data from the Cardiff grid in the UK show that the mechanism maintains optimal performance in both cooperative and non-cooperative game frameworks, and significantly outperforms the traditional scheme in terms of increasing energy self-use rate and reducing energy costs. Lokeshgupta et al. [30] developed a multi-objective home energy management (HEM) model based on cooperative game theory to achieve dual optimization of electricity cost minimization and system peak reduction through a supercriteria negotiation framework. A mixed integer nonlinear programming approach is used to solve the problem, and simulations show that the scheme can reduce residential energy costs by 31% while reducing peak loads by 28% and is suitable for the cooperative scheduling of various types of controllable appliances. Malik et al. [31] propose a P2P energy trading framework based on cooperative game theory, which achieves stable operation of local energy communities through a dynamic prioritization algorithm (taking into account parameters such as geographic location, energy supply and demand), resulting in a 40% increase in the income of the producer and consumer and a 25% reduction in the consumer’s electricity bill. Han et al. [32] use cooperative game theory to construct a distributed energy storage system (ES) energy alliance, which reduces the overall energy cost of the alliance by 23% through collaborative optimization of operation and effectively smooths out the load fluctuation of the local grid (peak-to-valley difference is reduced by 35%).
At present, research on multiple investment entities shows the characteristics of multidimensionality and cross-field interaction. On the one hand, scholars focus on the characteristics and behavior patterns of different investment entities, revealing the investment motivation, risk preference, and decision-making mechanisms of these different entities through comparative analysis. On the other hand, the research is gradually delving deeper into the collaborative cooperation mechanisms among investment entities, discussing how to break the information barriers and realize resource sharing and complementary advantages to improve the overall investment efficiency. In addition, with the rise of the digital economy, the layout of multiple investment entities in the field of emerging technologies has also become a research hotspot, focusing on its impact on industrial upgrading and the construction of innovation ecology. However, there are still deficiencies in quantitative analysis, dynamic monitoring, and policy synergy evaluation.
Based on the above literature gaps, this study unfolds according to the logical chain of “main body analysis→model selection→proportion optimization→benefit assessment”. Chapter 3 first identifies the key investment subjects and their heterogeneous characteristics in the new type of power system, laying a classification foundation for subsequent model construction.

3. Analysis of Diversified Investment Subjects and Investment Modes

3.1. Analysis of Multiple Investment Entities

Investment stakeholders are individuals or organizational entities that can achieve investment objectives, including investment entities, consumers, contractors, social investment institutions, and relevant government departments. The relationship between the investment subject and investment target is a two-way interaction, where the possibility of gain and loss coexists. The main body that pays the cost of resources directly in the process of project investment and construction is the direct stakeholders, including investment enterprises, project contractors, etc. Without direct input, the main body that can indirectly generate income or loss due to the project is indirect stakeholders, such as users. Stakeholders are not absolute competitors but should be interrelated and cooperate to achieve the expected level of investment efficiency. The roles and industry backgrounds of each investment entity are shown in Table 1.
According to the industry background, the investment subjects can be divided into creditors, government departments, and professional companies. First, creditors mainly include commercial banks, securities companies, industrial funds, and so on. The main goal is to recover the investment through the interest on the loan and obtain a stable income. It must meet a certain Debt Service Coverage Ratio (DSCR), which is the ability of the mixed-ownership company to repay the principal and interest so that creditors are willing to provide loans to the company. Second, the government sector. Government departments mainly include local government investment platforms, urban investment, and state investment. The main objectives are to improve social benefits, supervise projects, and ensure the implementation of projects. The main considerations of government investment projects include (1) maximizing the social benefits of the project; (2) their financial budget restrictions, that is, the upper limit of equity participation funds; (3) supervision of projects, the government as a shareholder can obtain project information, and better monitor the behavior of enterprises and social capital; (4) the government shares in the project to bear a certain responsibility, sharing the project risk, is conducive to reducing the financial pressure of social capital, and attract social capital investment. Third, professional companies. The main investment subjects involved in professional companies are power grid enterprises, power generation enterprises, social capital, public service companies, etc. The main objective is to increase economic efficiency according to their respective industry backgrounds and technical advantages, in the form of capital and technology.

3.2. Analysis of Multi-Subject Investment Mode

Power grid companies, power generation enterprises, social capital, and public service companies have different interests and their investment models are not the same. They can choose to invest independently or jointly. For the construction of new main projects such as energy storage, gathering stations, and pumped storage, the current co-investment mode is mainly divided into direct operation, entrusted operation, and leasing operation. The investment models that each investment entity may adopt are shown in Table 2.
Independent operation mode means that investors invest in and operate a single project independently, earning income and recovering costs through the services provided by the project. The invested project can be used by investors alone or provide services for other social entities. In the co-investment mode, the direct operation mode (equity cooperation mode) is that social capital, power grid enterprises, government departments, and other investment subjects jointly investing and building new main projects and jointly participate in the operation and management of related businesses and share the corresponding income. The entrusted operation mode means that it does not participate in the investment and construction of the project but only participates in the operation and maintenance of the project to share the corresponding income. The leasing operation mode (participation dividend type) refers to only participating in the investment and construction of the project, without participating in the actual operation of the project, and participating in the income distribution according to a certain proportion.
With the construction of new power systems and the further promotion of the power market, the construction and access of a high proportion of new energy is an inevitable trend faced by power generation enterprises, grid enterprises, and other energy supply enterprises. To ensure the safe and reliable operation of the power system, maintain the power supply, and support the construction needs of the power market, power grid enterprises need to pay close attention to the relevant development trends, adhere to the principle of “one issue, one discussion, and local conditions”, make overall planning and layout in advance, and define the investment model of distributed photovoltaics, energy storage, and gathering stations.
The power grid company has capital, technology, talent, and rich management experience and implements the strategy of “can control, can participate, can release”, so the power grid company may invest in the direct operation, entrusted operation, and leasing operation. However, local governments and social capital have less experience in distribution network operation and management but have strong capital injection ability. These two types of investment entities are more inclined to lease operations. For cooling, heating, gas supply, and power generation enterprises with certain management experience, their interest demands are to be able to absorb their energy to the maximum extent, so such investors can only invest in the corresponding network construction and equipment or participate in the operation and management of the project simultaneously. For energy storage enterprises, there is a need for investment in energy storage equipment and insufficient experience in power grid management, making them more inclined to lease operations.
According to the above analysis of the investment entities, the investment entities are divided into three categories: the first type is represented by the power grid company, which can realize direct operation, entrusted operation, and leasing operation; the second category is represented by power generation enterprises, local governments, social capital, and energy storage enterprises, which can realize the leasing operation of investment entities; the third category is represented by cooling, heating and gas supply enterprises, which can realize direct operation and lease operation. It can be expressed as:
A = p o w e r   g r i d   e n t e r p r i s e s B = { P o w e r   g e n e r a t i o n   e n t e r p r i s e s ,   l o c a l   g o v e r n m e n t s ,   e t c } C = { C o o l i n g ,   h e a t i n g ,   g a s   s u p p l y   c o m p a n i e s }

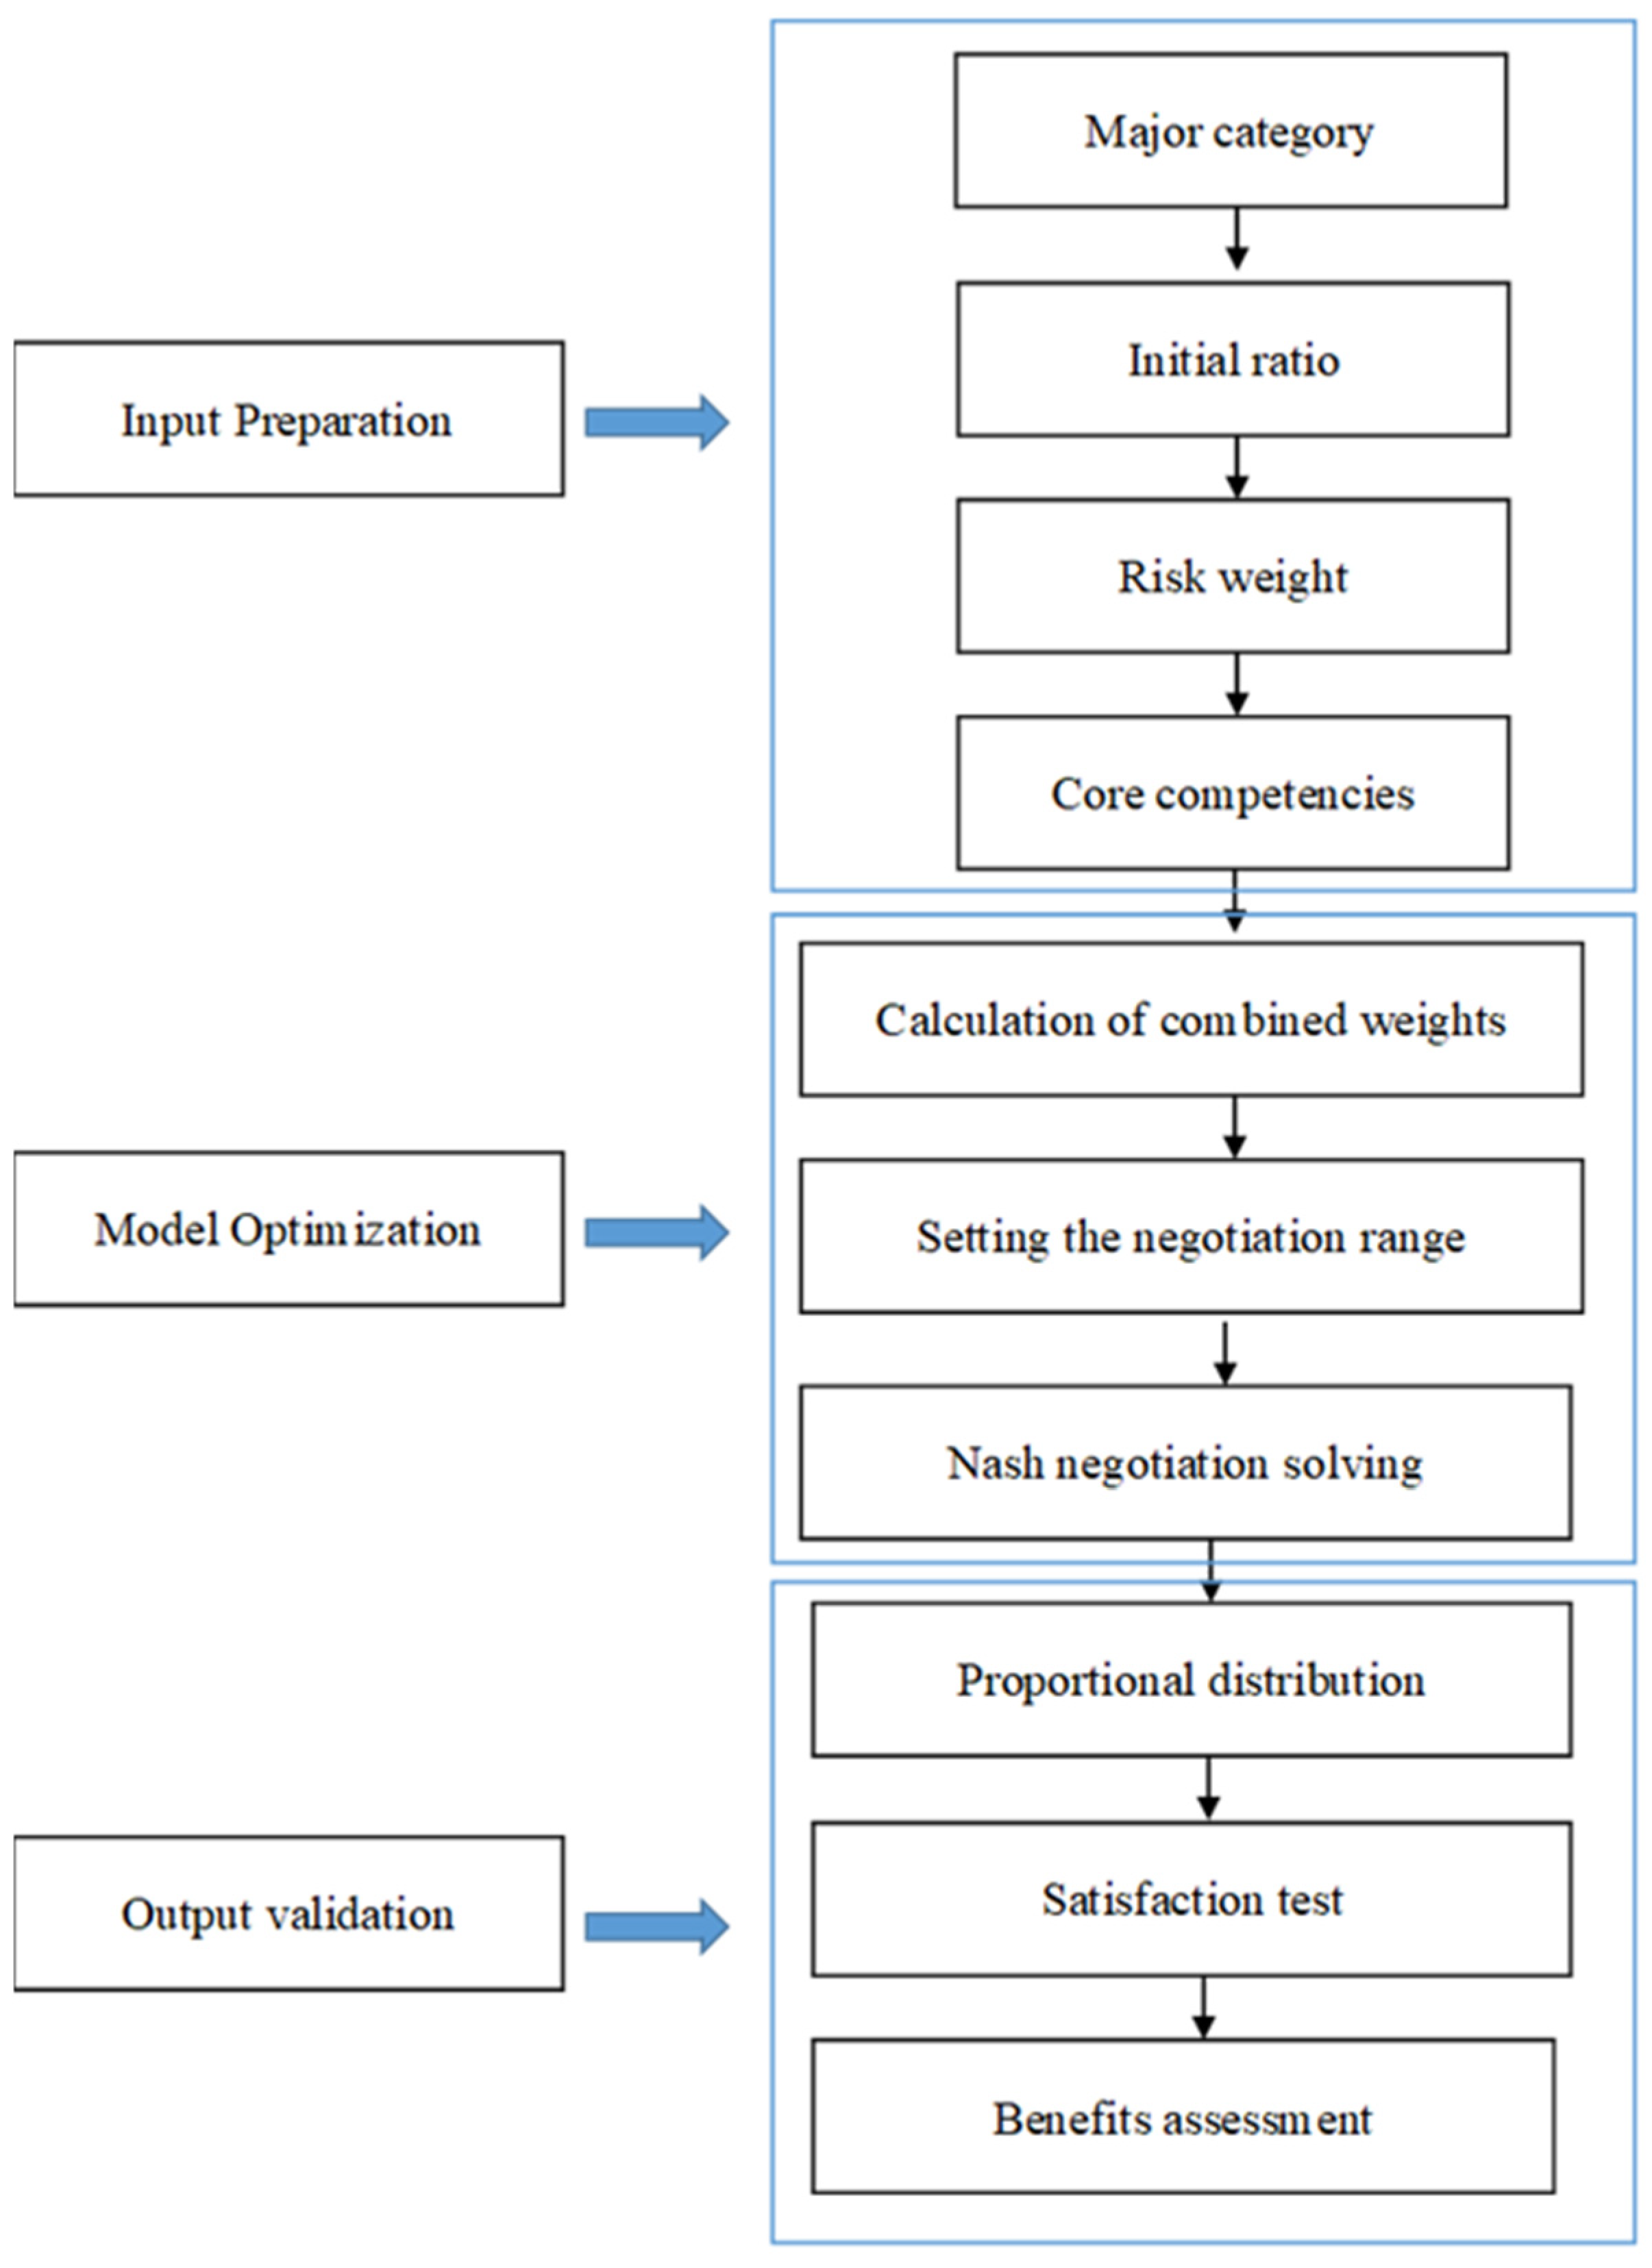
4. Calculation of Optimal Investment Proportion of Multiple Investment Entities

Power grid enterprises, power generation enterprises, government and social capital, and other subjects in the investment process of the investment proportion are mostly based on artificial agreements, with strong subjective factors. To solve this problem, first, the potential investment subjects and possible investment modes are analyzed, and the calculation method of investment cost is provided. Then, based on analyzing the factors affecting the redistribution of investment proportion, the asymmetric Nash negotiation model is proposed to optimize the initial investment proportion to maximize the gap between the final investment proportion coefficient and the least ideal investment proportion coefficient.
Traditional Nash bargaining models assume symmetric players and single-objective utility, failing to capture:
(i).
The dominance of grid companies (Type A) in risk-taking (Section 3.1),
(ii).
The environmental/social weights mandated by China’s ‘dual-carbon’ goals.
Our adaptations address these gaps through asymmetric weights (Equation (4)) and multi-criteria satisfaction functions (Equation (14)).

4.1. Theoretical Basis for Optimizing the Investment Ratio of Multiple Investment Entities

Based on the cooperative game theory, the optimal investment proportion of multiple investment entities is solved. The joint investment of multiple subjects is regarded as a cooperative alliance, after forming an alliance, the income distribution should be carried out within it. Nash proposed a two-person Nash negotiation model during his research on negotiation issues. Building on this, Harsanyi [33] further proposed a multi-person asymmetric Nash negotiation model to solve the problem of income distribution in enterprise alliances. Therefore, we introduce the asymmetric Nash negotiation model to solve the problem of redistribution (optimization) of the investment proportion of multi-agent co-investment.
When constructing the asymmetric Nash negotiation model, the following assumptions should be followed: (1) in the mixed-ownership company established by the investor, the agreement within the company has the same binding effect on all the investors. (2) all investment entities are risk neutral. (3) the degree of investment in the main body’s contribution to the project and the available investment subject was weighted x i . The weight is determined by the factors that affect cost allocation. (4) in the negotiation, the basis of each investment subject is satisfaction, and each investment subject has a negotiation base point (bottom line). If the negotiation result is higher than the negotiation base point, it means that the negotiation can reach an agreement.
The following Section 4.2 will specify how the initial investment proportions, risk coefficients, and core competencies are translated into weights that are ultimately embedded in the negotiation model.

4.2. Key Influencing Factors of Optimal Investment Ratio Measurement

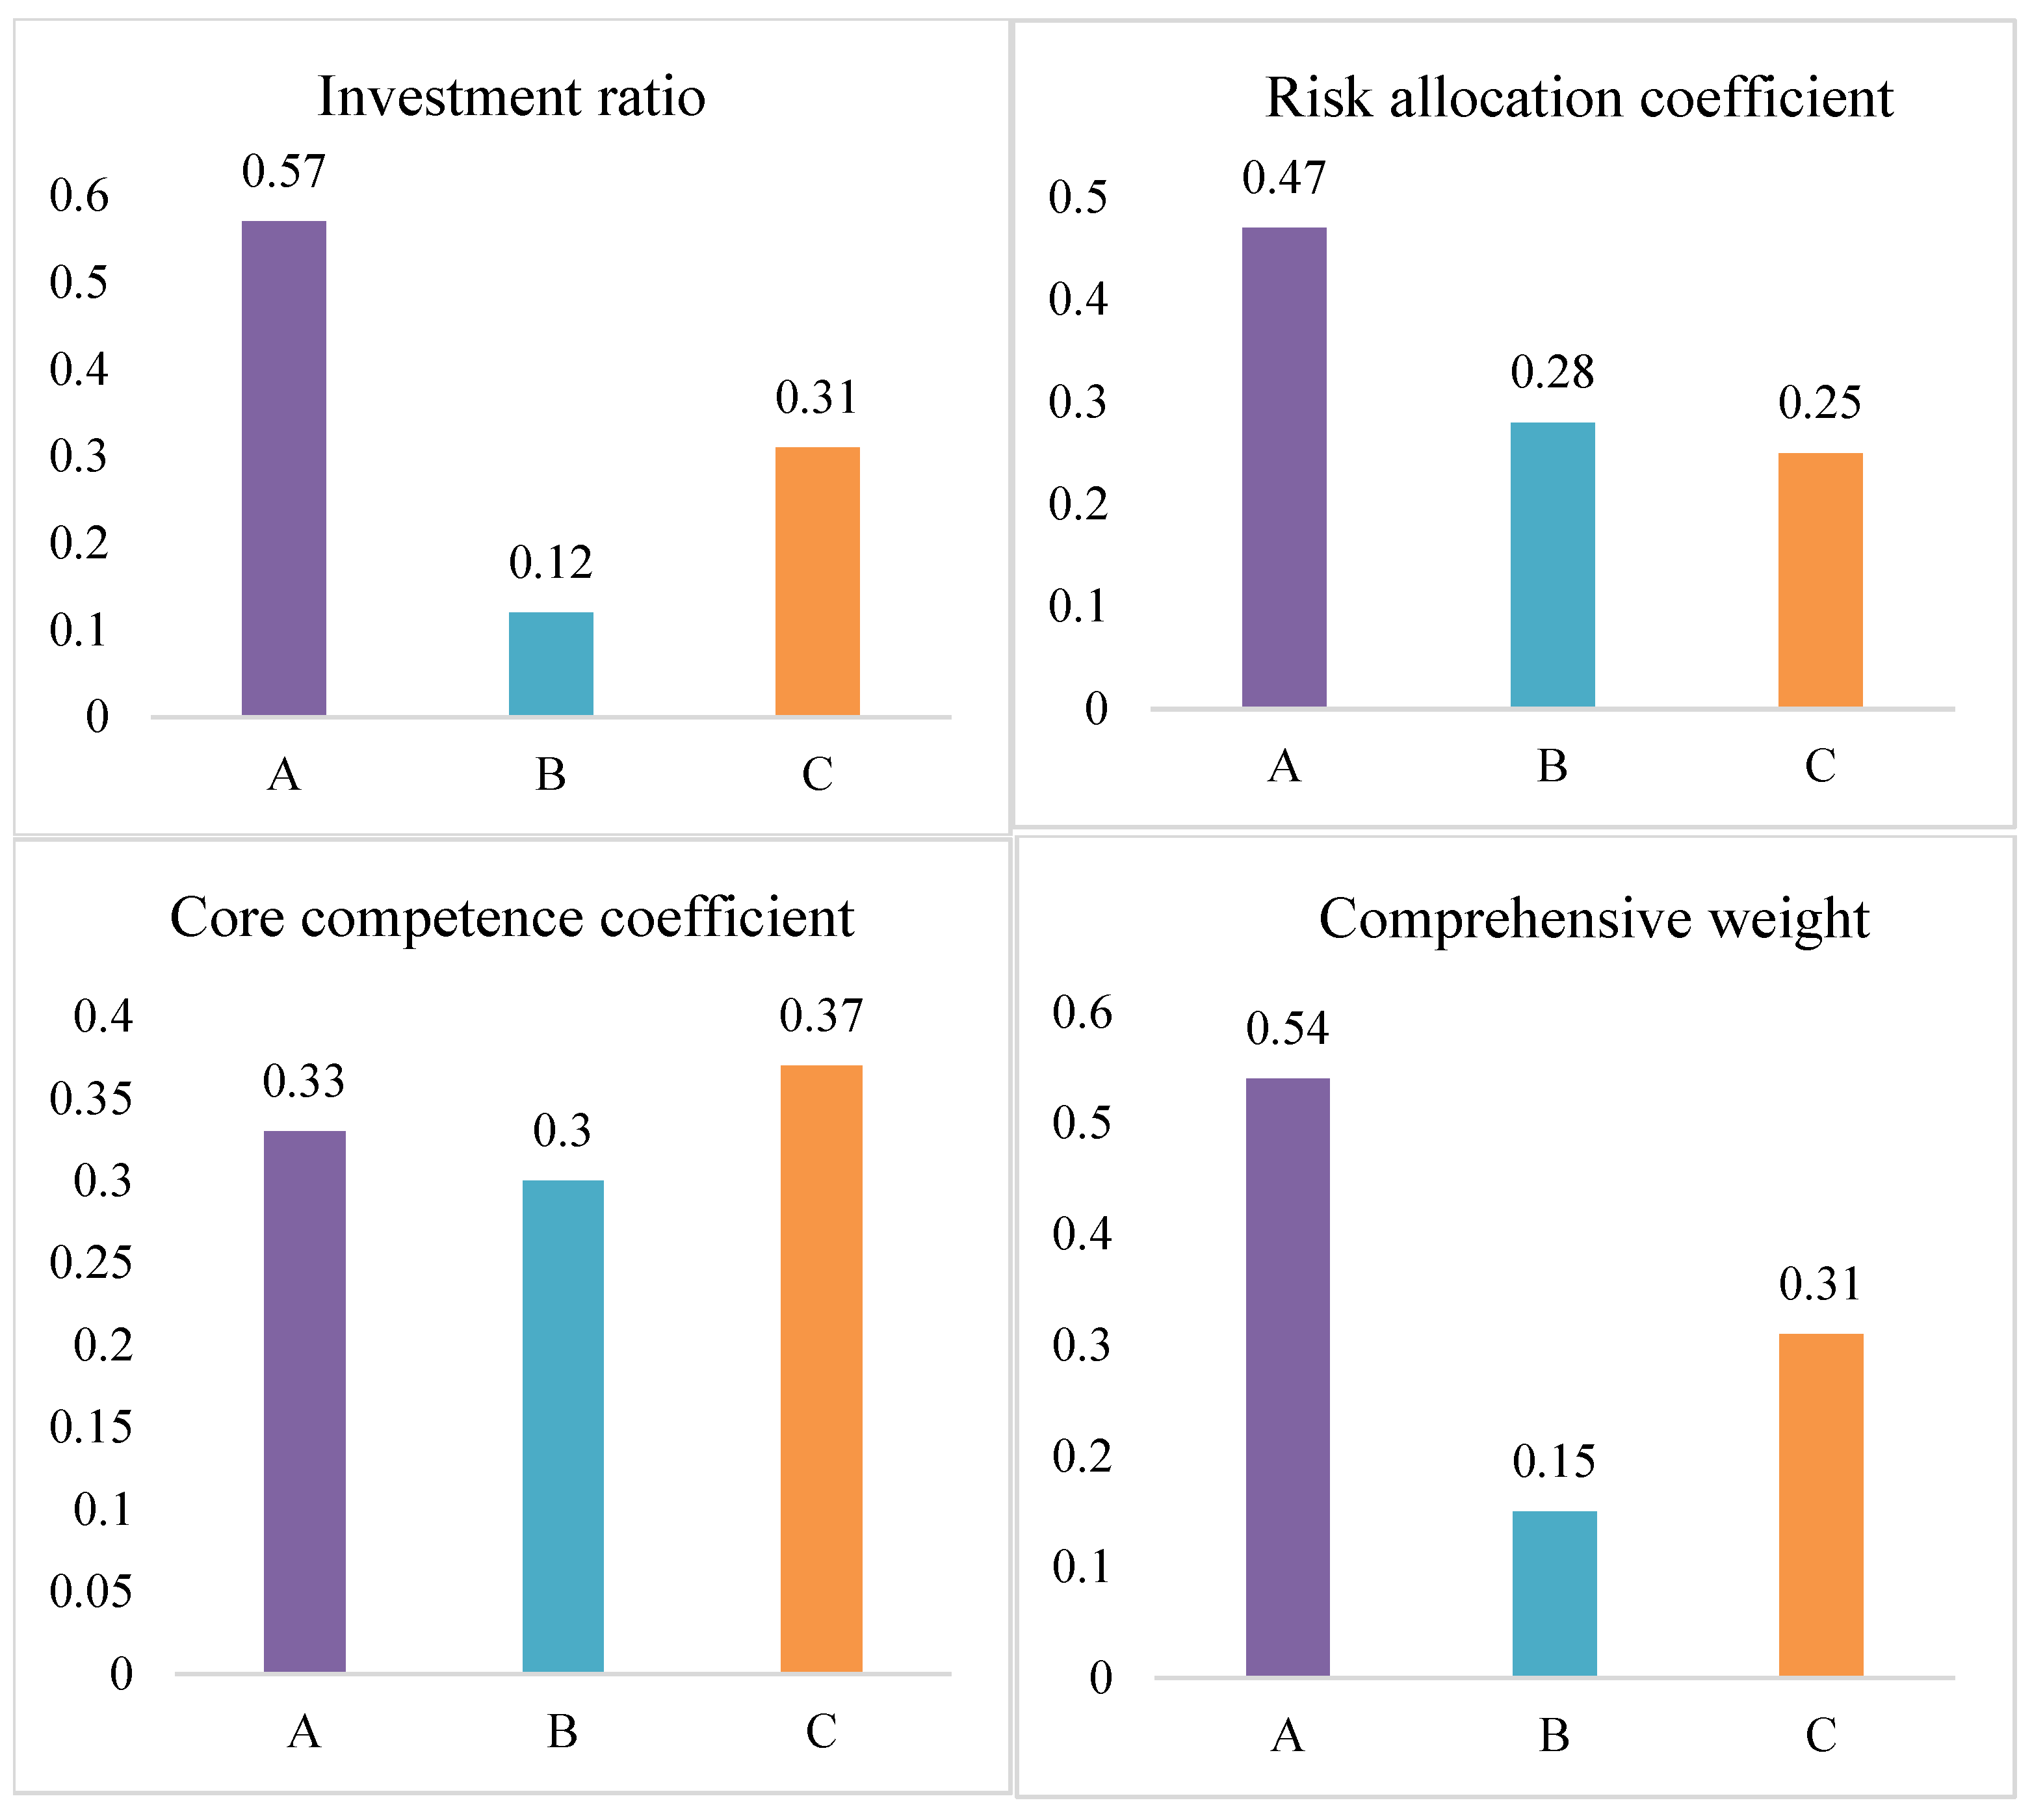
4.2.1. Initial Investment Ratio

The initial investment ratio is the main factor affecting the redistribution of the investment ratio. The degree of investment in the project is not the same. Sets the initial investment proportion of the investment subject to I i , and I i = 1 .

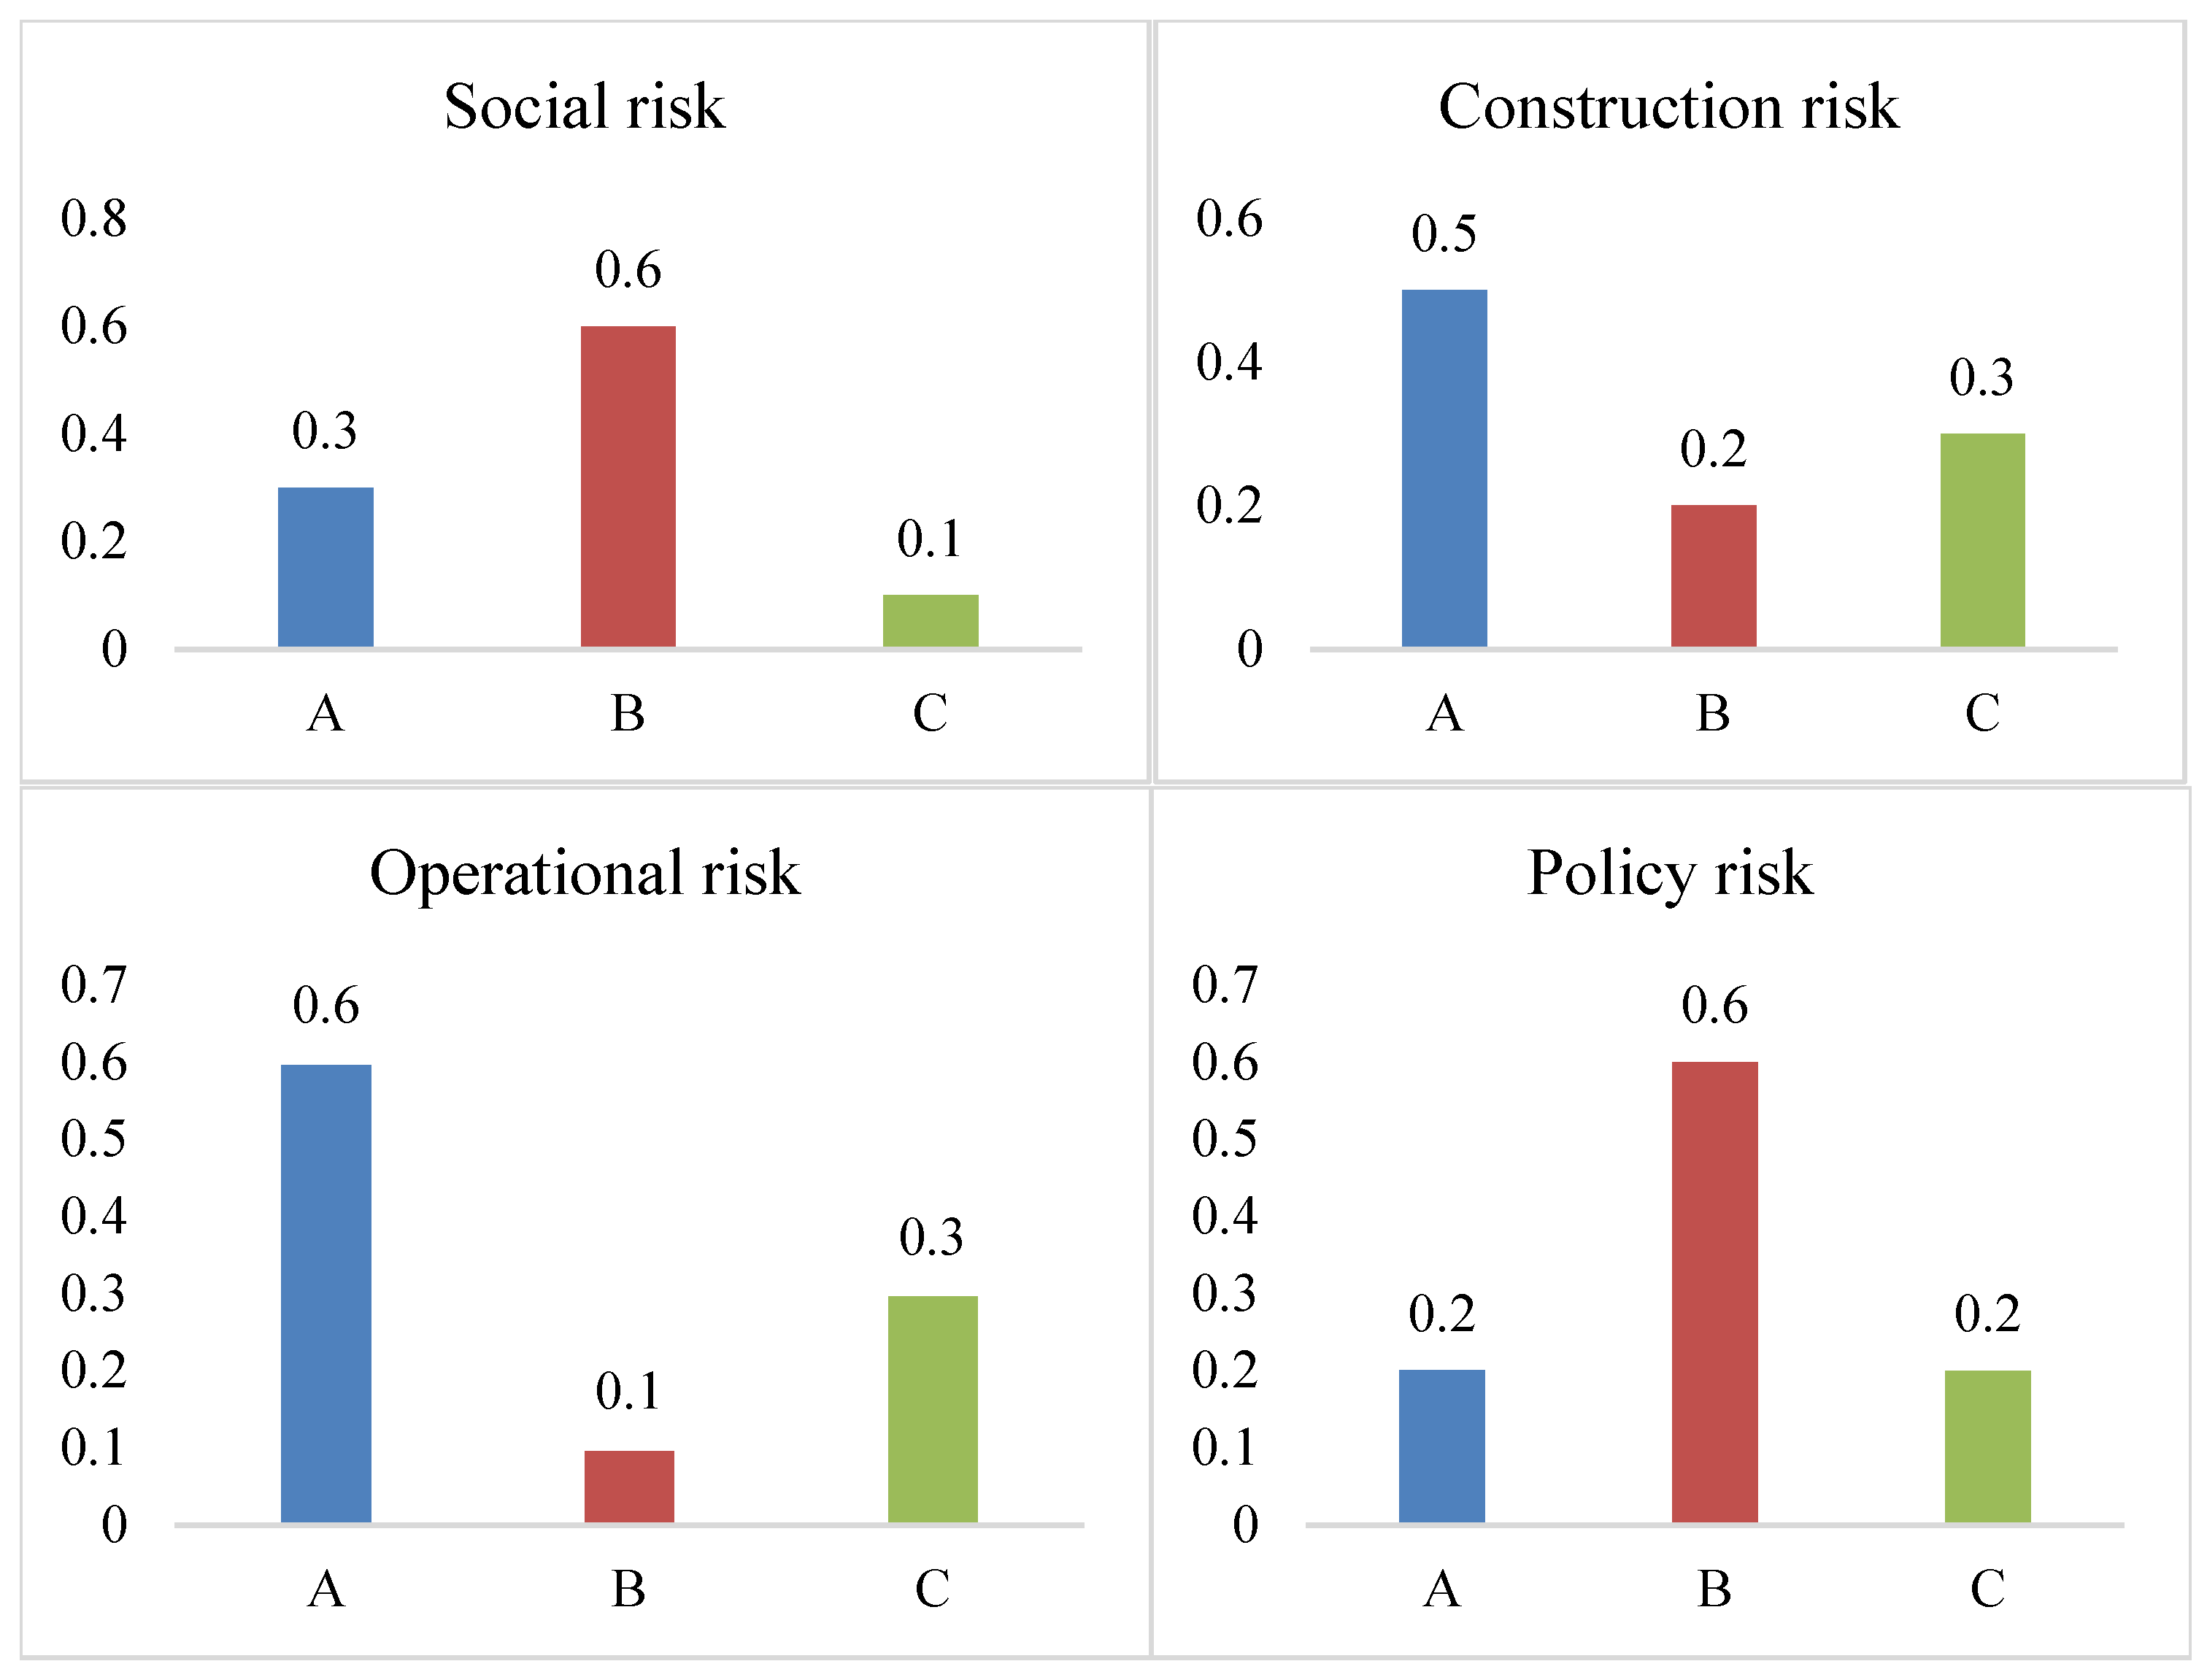
4.2.2. Risk Allocation Coefficient

During the process from construction to operation of a project, each investor needs to bear various risks, such as social risk, construction risk, operation risk, and policy risk. The proportion of various risks undertaken by each investment subject is also different. When optimizing the investment proportion, it is necessary to consider the situation of the risk borne by the investment subject. Suppose there are m kinds of different risks, such as social risk, construction risk, etc. The weight of the tape j risk is α j , and the coefficient that the i participant shares the tape j risk is R i j , then:
j = 1 m α j = 1 , j = 1,2 , m i = 1 n R i j = 1 , i = 1,2 , n
The risk coefficient of each investment subject R i as follows:
R i = j = 1 m α j R i j

4.2.3. Core Competence Coefficient

The innovation ability, core technology, and collaborative ability constitute the core competence of an enterprise. Among them, innovation ability is the embodiment of the value of each investment entity to the alliance according to its own talent reserves and information acquisition. The core technology is mainly the unique technology and management ability of each investment entity, such as the distribution network management and operational experience of power grid enterprises. The stronger the core technology of the investment subject, the greater its core competence coefficient. Synergy refers to the ability of each investor to ensure the smooth progress of the project during the processes of investment, construction, and operation. The stronger the synergy, the greater the core competitiveness coefficient. Set up the core competence of each investment subject coefficient for E i , to remain consistent with the initial investment ratio and the risk coefficient. The core ability coefficient, according to the normalized processing, has the E i = 1 .

4.2.4. The Weight of Investment Entities

The weight of the investment subject is determined by the initial investment proportion, risk allocation coefficient, and core competence coefficient. Considering the influence of different investment proportions, the redistribution of the importance factor is different; investment subjects were weighted x i as follows:
x i = ω I I i + ω R R i + ω E E i ω I I i + ω R R i + ω E E i
where, I i is the investment coefficient of each main investor. R i is the risk allocation coefficient. E i is the core competence coefficient. ω I , ω R and ω E are the weight coefficients of the initial investment ratio, risk allocation coefficient, and core competence coefficient, respectively.

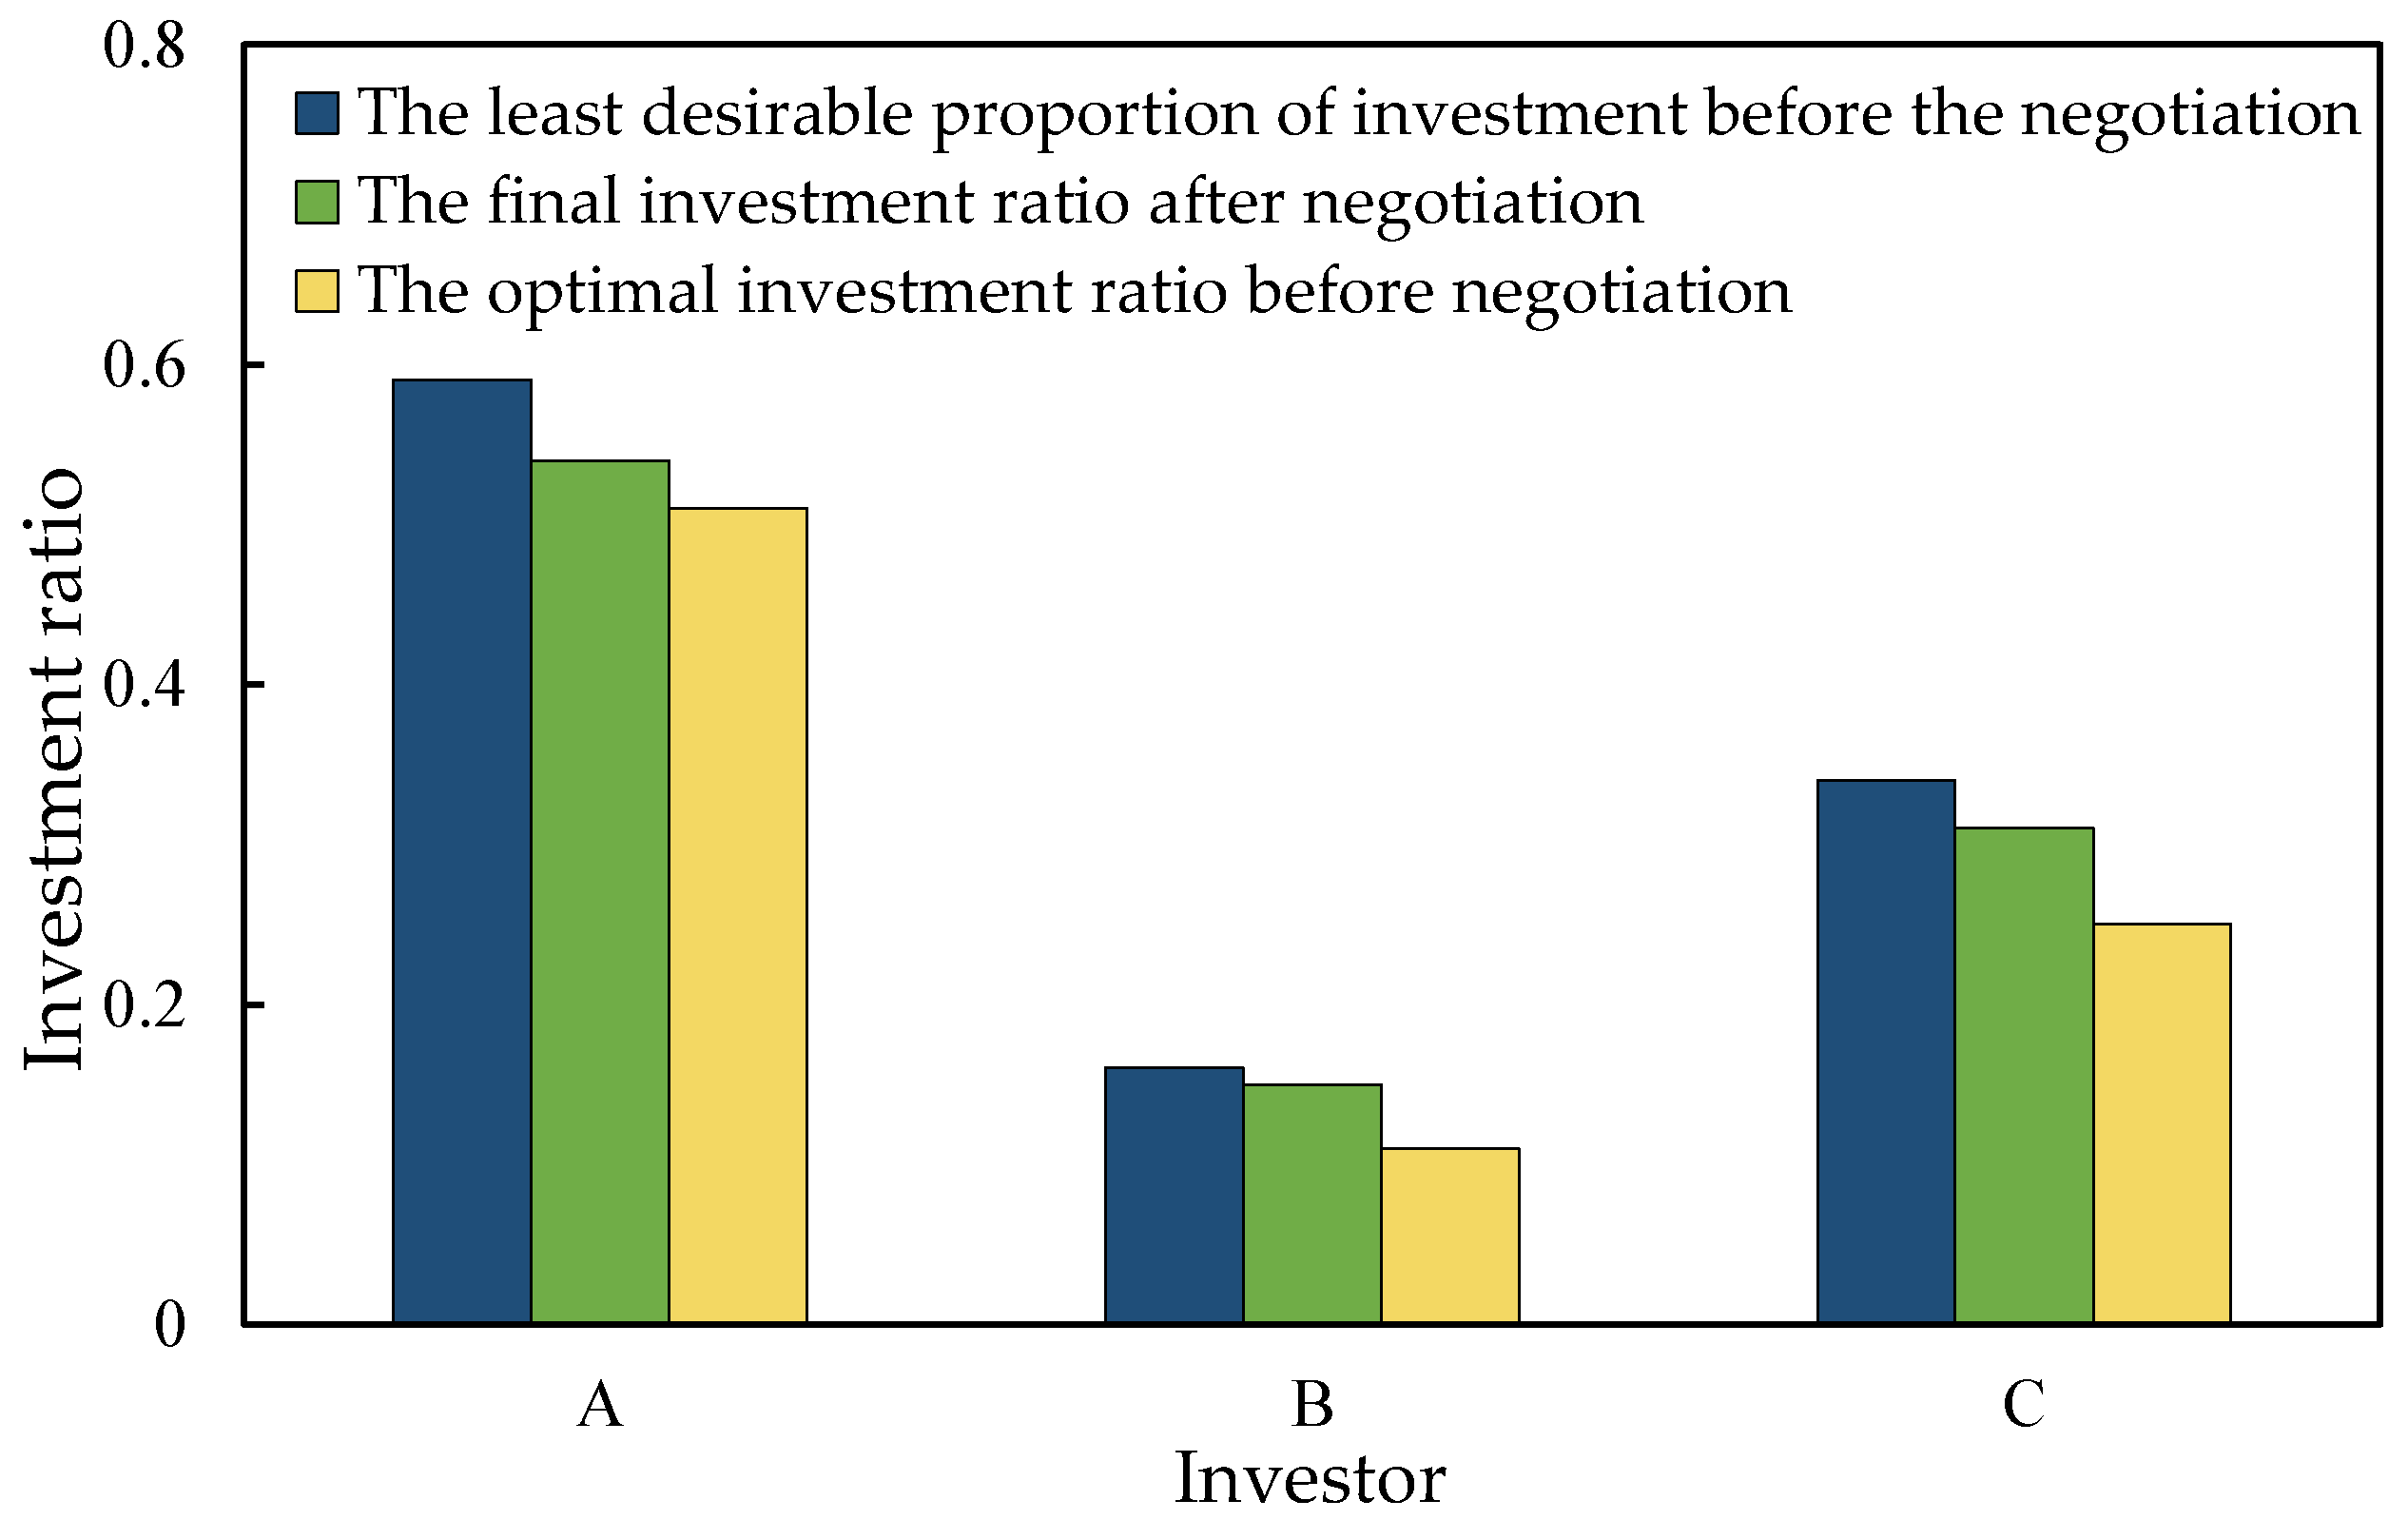
4.3. Multi-Subject Investment Proportion Optimization Model

All the participating investment entities are regarded as an alliance, and each investment entity puts forward its investment ratio optimization plan according to the index system formulated by the alliance. Suppose that there are the investment entities of n in the alliance, and each investment entity proposes an optimization plan based on the initial investment, d j i represents the investment proportion corresponding to the investment entity of j in the optimization plan proposed by the investment entity of i. Therefore, the optimization plan proposed by the investment entity of i is as follows:
D i = d 1 i , d 2 i , d n i
The formation coefficient matrix of the investment proportion optimization scheme proposed by all investment entities is as follows:
D = d 11 d 21 d n 1 d 12 d 22 d n 2 d 1 n d 2 n d n n
0 < d j i < 1 j = 1 n d j i = 1
In Formula (6), column i represents the set of investment proportions considered by all investors to be those of the investor of the i. Among them, the minimum value in the set represents the lowest value of the investment proportion of the investment subject of i, which is the most ideal situation. The maximum value in the set represents the highest value of the investment proportion of the investor of the i, which is the least ideal case. Therefore, the result of the optimal and least ideal investment ratios of each investment entity can be expressed as:
d i min = min d i 1 , d i 2 , d i n d i max = max d i 1 , d i 2 , d i n
The set of optimal and least ideal investment proportions of each investor in the alliance is:
d min = d 1 min , d 2 min , d n min d max = d 1 max , d 2 max , d n max
As can be seen from Formula (9), although the optimal scheme set can satisfy the will of each investment subject, it does not meet the distribution coefficient and the constraint condition of 1, so the alliance must negotiate. Each investment subject needs to accept an increased coefficient so that its final investment proportion can be appropriately increased on the original basis. The final investment proportion of the investment subject of i can be expressed as follows:
d i f i n a l = d i m i n i + y i
where y i represents the increase made by the investor of i, and the conditions are satisfied:
d i f i n a l d i m a x
In essence, the negotiation of the alliance is a process of seeking the best increase coefficient y 1 , y 2 , y n for the optimal investment ratio d m i n d 1 m i n , d 2 m i n , d n m i n .
Therefore, the satisfaction of the parties is defined as:
λ i = d i m i n d i f i n a l d i m i n
where λ i is satisfaction, and the greater the λ i , the higher the satisfaction. The basic points of the negotiations are:
  λ i s = d i m i n d i m a x d i m i n
The negotiation is carried out according to this basis point until A satisfactory result is reached. At the same time, there must be λ i λ i s , otherwise the negotiation fails. The asymmetric Nash negotiation model of alliance investment ratio redistribution is as follows [34]:
max V = i = 1 n d i min + y i d i max x i s . t . d i f i n a l = d i min + y i < d i max i = 1 n d i f i n a l = 1 i = 1 , 2 , , n
where in the objective function, d i m i n + y i represents the final investment proportion of the investment subject of i, while d i m i n + y i d i m a x represents the gap between the final investment proportion of the investment subject of i and the least ideal investment proportion, and the larger the gap between the two, the better; x i is the weight of the investment subject, which is determined by the initial investment proportion, risk allocation coefficient, and core competence coefficient. The final investment ratio coefficient can be obtained by solving the above formula.
As summarized in Figure 1, the optimized proportions derived from the asymmetric Nash model are further evaluated through the multi-criteria framework below.

5. Project Investment Benefit Analysis and Evaluation Model

5.1. Construction of Investment Benefit Evaluation Index System

The establishment of a project investment benefit evaluation index system is the basis and premise of input-output analysis. The constructed index system can objectively reflect the relationship between investment and income and can reflect the actual characteristics of project construction investment. The analysis results are helpful in guiding the subsequent optimization of construction investment in this field. Based on the analysis of project investment characteristics, development stages, and influencing factors of investment benefit, the construction of an investment benefit analysis system should follow the principles of completeness, practicability, uniqueness, and comparability. Therefore, the three investment benefit factors and general financial indicators are combined to evaluate the project benefit. The overall investment benefit evaluation index includes the investment economic benefit index, investment environment benefit index, and investment social benefit index. The evaluation index of project investment benefit is shown in Table 3. The social benefit indicators follow the criteria below: policy relevance: aligning with China’s “dual carbon” goals; technology enablers: reflecting the project’s drive for innovation in the industry; quantifiability: ensuring data accessibility.
(1) Index of economic benefits of investment
The index of economic benefits includes cost-benefit and financial benefit. It represents the total amount of capital needed to make a project run properly after construction. It includes the total investment cost of the project and the annual operation and maintenance costs of the power plant. The income corresponding to the cost mainly relies on the sale of electricity, the sale of heat, peak regulation, and other auxiliary services, including the sale of electricity, cooling income, heating income, etc.
① The total investment cost of the project. The total investment cost of the project is the capital input in the process of project construction, mainly including equipment purchase costs, basic construction costs, etc. The calculation is shown in Equation (15):
B 11 = C s + C j + C a + C t + C n + C q t
where B 11 is the total investment cost of the project, C s is the equipment purchase cost, C j is the foundation construction cost, C a is the equipment installation cost, C t is the land collection cost, C n is the energy grid connection construction cost, and C q t is other related investment costs.
② Annual operation and maintenance cost of the project. The operation and maintenance cost of a project refers to the cost of daily operations and maintenance, mainly including inspection costs, fuel costs, management costs, etc. The calculation is shown in Equation (16):
B 12 = C r + C x + C g + C q y
where B 12 is the annual operation and maintenance cost of the project, C r is the annual fuel cost, C x is the annual repair cost, C g is the annual management cost, and C q y is other relevant operation and maintenance costs.
③ Annual operating income of the project. The income of the project mainly includes electricity sales income, heating income, comprehensive energy service income, energy storage income, etc. The calculation is shown in Equation (17):
B 13 = I d + I l + I r + I f + I c + I q y
where B 13 is the annual operating income, I d is the annual electricity sales income, I l is the annual cooling income, I r is the annual heating income, I f is the annual comprehensive energy service income, I c is the annual energy storage income, and I q y is the income of other related businesses.
④ Net present value. Net present value is the difference between the present value of future capital inflows and the present value of future capital outflows. The net present value is determined after the future capital inflow and capital outflow are converted to the present value according to the estimated discount rate and the present value coefficient of each period. It is often used as an important economic index of project investment income to determine the benefits and feasibility of the project. The calculation is shown in Equation (18):
B 14 = N P V = C I C O / 1 + i t
where B 14 , that is, NPV is the net present value, CI is the present value of future net cash flow, CO is the present value of the original investment, i is the discount rate, and t is the duration number.
⑤ Payback period. The payback period refers to the period from the start of the operation of the project to the time when the net income of the project can offset the capital input during the construction of the project. The shorter the payback period, the better the investment benefit. The calculation is shown in Equation (19):
B 15 = T = ( T 1 1 ) + C k C m
where B 15 , that is, T is the investment payback period, T 1 is the number of years in which the present value of the cumulative net cash flow is positive, C k is the present value of the cumulative net cash flow of the previous year, and C m is the present value of the net cash flow in the positive year.
⑥ Internal rate of return. The internal rate of return is the discount rate when the total present value of capital inflows equals the total present value of capital outflows and the net present value equals zero. The larger the index, the better the investment benefit. The calculation is shown in Equation (20):
C I C O 1 + I R R t = 0
where IRR, that is, B 16 is the internal rate of return, CI is the present value of future net cash flows, CO is the present value of initial investment, and t is the duration.
(2) Index of environmental benefits of investment
Due to its high energy efficiency, low carbon, energy savings, environmental protection, and other advantages, the project will gradually replace the low efficiency and high carbon dioxide emissions of power generation, and the environmental benefits brought by the investment are considerable, though currently lacking quantification. We quantify environmental benefits into investment benefits, mainly including energy conservation and emission reduction, renewable energy consumption increase proportion, and other indicators.
① Energy saving and emission reduction. Distributed energy can adopt the consumption mode of “spontaneous self-use, surplus electricity online”, which can greatly reduce carbon dioxide emissions. Energy saving and emission reduction refer to the reduction in the amount of carbon dioxide discharged into the environment during the operation of distributed energy projects compared to traditional power generation projects. The calculation is shown in Equation (21):
B 21 = M c M d
where B 21 is energy saving and emission reduction, M c is carbon dioxide emissions of traditional energy power generation projects, and M d is carbon dioxide emissions of distributed energy power generation projects.
② Renewable energy consumption increased in proportion. Distributed energy application technology based on renewable energy can improve energy utilization efficiency and increase the proportion of renewable energy structures. The calculation is shown in Equation (21):
B 22 = N k N y N l N z
where B 22 is the increase in the proportion of renewable energy consumption, N k is the renewable energy consumption of traditional energy power generation projects, and N y is the primary energy consumption of traditional energy power generation projects. N l is the renewable energy consumption in distributed energy projects, and N z is the primary energy consumption in distributed energy.
(3) Index of social benefits of investment
① The rate of technology updates. The investment and construction of distributed energy projects can drive related technological innovation, and the technological progress in reliability technology, peak regulation technology, grid-connected technology, etc., can also be reflected in the improvement of investment efficiency, which can be estimated by the proportion of the introduction of new technologies. This index is used to measure the impact of investments in distributed energy projects on the research and updating of related technologies.
② Policy intensity. Government departments influence the improvement of distributed energy investment efficiency through the support of development policies, resource policies, utilization policies, and other policies, as well as the formulation of financial subsidies, industrial incentives, and other active measures. This index is assessed according to the number of relevant policies, the degree of correlation, and the impact of policies, combined with expert scores.
③ Multi-energy complementary operation mode. The multi-energy complementary operation mode includes terminal integrated energy supply systems, wind, water, and fire storage multi-energy complementary systems, and other operation modes, and distributed energy can be combined in a variety of ways; different modes have different impacts on investment benefits. The index value is determined by the Delphi method.

5.2. Construction of Investment Benefit Analysis Model

5.2.1. Determining the Weight of Investment Benefit Analysis Index

According to the preliminarily determined index system, the Delphi method and analytic hierarchy process were used to issue questionnaires to 15 experts in the fields of economics, finance, and technology, scoring indicators of each scheme layer; and carrying out top-down hierarchical analysis of multiple attributes contained in the evaluation object. Based on the target layer, standard layer, and solution layer, the investment benefit index is analyzed quantitatively.
The indexes of each level are compared with the importance of the indicators of the previous level to calculate the judgment matrix of each level. According to the scores of the above experts, the weighted geometric average method is used to determine the matrix scale. The judgment matrix is shown in Table 4, and the final index weight reweighting is shown in Table 5.
The expert group consists of 15 people, including 6 university professors (all presiding over the National Natural Science Foundation of China’s energy projects), 5 technical leaders of power grid companies (with an average of 12 years in the field), and 4 energy policy researchers (involved in the preparation of provincial-level and above planning), with a 100% coverage of disciplinary and industrial backgrounds. Validation of authority: Expert authority was validated in three ways: (1) the mean value of the Academic H-index was 28; (2) all self-assessed familiarity on the first round of the questionnaire was ≥4; and (3) the Kendall’s coordination coefficient was W = 0.63 (p = 0.008).

5.2.2. Investment Benefit Analysis Model

To obtain the overall investment benefit evaluation, it is necessary to carry out a fuzzy comprehensive evaluation on the scheme level index under each criterion level index. Therefore, a set of comments is constructed, as shown in Equation (23):
V = ( V 1 , V 2 , V 3 , V 4 , V 5 )
where V1 is very high, V2 is high, V3 is average, V4 is low, and V5 is very low.
According to budget criteria, evaluation parameters, normative criteria, etc., the membership degree subset is constructed and the evaluation matrix R is created, as shown in Equation (24):
R = R 1 R 2 R n = r 11 r 21 r 12 r 22 r 1 m r 2 m r n 1 r n 1 r n m
The R and weight W are combined into the fuzzy comprehensive evaluation matrix S of investment benefit, as shown in Formula (25):
S = W R = W 1 , W 2 , W n r 11 r 21 r 12 r 22 r 1 m r 2 m r n 1 r n 1 r n m = ( s 1 , s 2 , s n )

6. Multi-Energy Complementary Energy System Project Investment Case Analysis

6.1. Project Introduction

The H project is a multi-energy complementary energy system in the park, which includes a gathering station, energy storage, a distributed heating (cooling) system, etc. The input link is the electric energy collected by the gathering station and the purchased natural gas, the electric energy is transferred to the pure electric load by the gathering station and converted into heat energy by the hot boiler, while the natural gas is supplied to the micro-gas turbine and gas boiler. The output link is electrical energy and hot and cold energy. Among them, the collection station, energy storage device, and micro gas turbine supply and output electrical energy, while the gas boiler and electric boiler jointly produce cold and hot energy supply and output.
The total dynamic investment of this project is 84,443,500 yuan, and the basic data are shown in Table 6.

6.2. Composition of Multiple Investment Entities of the Project

On the supply side, the project involves the collection of distributed power supply and large power grids, and on the demand side, it needs to supply electric energy and cold and hot energy, which is a bilateral multi-energy complementary project. All industrial enterprises in the park need to ensure a safe and stable supply of energy. The investment subject of this project is a diversified investment subject composed of power grid enterprises, cooling and heating enterprises, and energy storage enterprises. Based on the guarantee of project construction, professionalism, and economy of project operation, the industry background, capital resources, and technical advantages of the investment subject, the equity cooperative (direct operation) co-investment model is adopted.

6.3. Comparative Analysis of Project Investment Costs Under Different Investment Modes

In the multi-energy complementary energy system, the conversion efficiencies η g . e M T and η g . h M T of natural gas converted into electrical energy and thermal energy by micro-gas turbines are 0.26 and 0.3, respectively. The transformer efficiency η e T is 0.95; the energy efficiency ratio η g . h G B of gas boiler refrigeration and heating is the national limit value of 0.92. The parameter values of construction costs are shown in Table 7. The load of an industrial park is selected as the load data source, and the peak-valley time-of-use tariff in this region is shown in Table 8.
The investment costs under the cooperation of the three types of investment entities are calculated and compared with the costs under the non-cooperation of all investment entities, as shown in Table 9.
As can be seen from Table 9, in the case of direct operation (joint-stock cooperation), the power purchase cost and distribution network construction cost account for 55.14% of the total cost. These two parts of costs involve the purchase and investment of power, which are mainly borne by Class A investment subjects (mainly power grid enterprises). The gas purchase cost accounts for 30.52% of the total cost; this part of the cost relates to the purchase of natural gas, mainly by the C type of investment subjects (mainly for cooling/heating enterprises and gas supply enterprises). The cost of energy conversion equipment and energy storage construction accounts for 14.34% of the total cost, and this part of the cost involves the investment of public assets, which is mainly borne by Class B investment subjects (mainly local governments, social capital, energy storage enterprises, etc.).
In the case of independent operation, the total cost is higher than in the case of cooperative investment. In the case of direct operation, the total investment cost is reduced by 22.71%, indicating that the participation of multiple entities in the incremental distribution network project and the adoption of cooperation are conducive to reducing the total investment cost. The reduction of total investment cost will also reduce the cost shared by each investment entity and increase the income of the investment entity. Therefore, in the environment of the opening of the incremental distribution network, multiple types of investment entities are encouraged to enter the incremental distribution project, optimize the project structure, and maximize the benefits. Next, we will further analyze the optimization of the investment ratio in the case of cooperation.

6.4. Optimization of the Investment Proportion of Multiple Investment Entities

From the above analysis, it can be seen that the initial investment proportions of A, B, and C types of investment subjects are 55.14%, 14.34%, and 30.52%, respectively. Various investment entities propose optimization plans according to their initial investment proportions as follows:
D = 0.50 0.60 0.60 0.15 0.10 0.15 0.35 0.30 0.25
There are mainly social risks, construction risks, operational risks, and policy risks in distribution network projects. Experts, based on the four types of risk assessment mentioned above, with the risk weights assigned as α 1 = 0.2, α 2 = 0.3, α 3 = 0.4, and α 4 = 0.1, respectively. The risk-sharing under the direct operation mode is investigated. The different risk-sharing among various investment entities is shown in Figure 2.
The core competencies of all types of investment entities include three aspects: innovation capability, core technology, and collaborative capability. The core competencies of A, B, and C types of investment entities are shown in Table 10.
The weight of various investment entities is determined according to the initial investment proportion, risk allocation coefficient, core competence coefficient, and the corresponding weight. This paper assumes that the initial investment proportion has the most important influence in the optimization process, accounting for 0.8. The influence of the risk allocation coefficient and core competence coefficient is approximately equal, accounting for 0.1 each. In actual projects, the weight value can be adjusted according to the actual situation. The power of various indexes of various investment entities is presented in Figure 3.
The three types of investment entities negotiate through Formula (14), and the final investment ratio coefficients are as follows:
d 1 f i n a l , d 2 f i n a l , d 3 f i n a l = 0.5257,0.1457,0.3285
According to the final investment proportion distribution result after negotiation, the final investment of type A investment subjects is the largest among the three types of investment subjects. From the perspective of various indicators, type A investment subjects have the largest initial investment proportion, and the risk allocation coefficient also accounts for a large proportion, indicating that type A investment subjects bear greater risks, and the final comprehensive weight is also the highest among the three types of investment subjects. Therefore, the final investment ratio is slightly lower than the initial investment ratio. For type B investors, the final investment proportion is higher than the initial investment proportion. Although B-type investment subjects also bear certain social risks, their initial investment ratio and core competence coefficient are the lowest, resulting in the lowest final comprehensive weight. Therefore, the type B investment subject will increase some costs based on the original investment to make up for the lack of core capabilities of such enterprises. The type C investment subject, similar to the type B investment subject, has a small increase in the final investment proportion to make up for the supplement of such enterprises in the risk-bearing capacity.

6.5. Analysis of Project Alliance Stability and Investor Satisfaction

After determining the final investment ratio, the stability of the alliance is analyzed. According to Formula (26) and Formula (27), the negotiation basis and final satisfaction of various investment entities can be obtained, as shown in Table 11.
The proportion of investment before and after negotiation under direct operation is shown in Figure 4.
As can be seen from Figure 4, the final investment proportion of all types of investors after the asymmetric Nash negotiation model is between the initial least ideal investment proportion and the optimal investment proportion. It is higher than the optimal investment ratio because each investment entity has found an appropriate increase coefficient according to Formula (27) to maintain the constraint that the sum of proportions is 1, and the result of negotiation considers the interests of each entity. If the investment ratio is lower than the least ideal, it means that the negotiation results are accepted by all investment entities. As shown in Table 11, the final satisfaction of all investment entities is greater than their negotiation basis points, which also indicates that the negotiation results are acceptable to all parties. In the case of maximizing the benefits of the alliance, the cost of each investor in the alliance optimizes the investment proportion through negotiation, and the alliance reaches a balance.

6.6. Analysis and Evaluation of Project Investment Benefit

According to the basic data and data processing analysis in Table 6, the specific values of each index are obtained in Table 12.
(1) The analysis of the economic benefits of investment
The subordinate subset of investment economic benefit B1 is the fuzzy evaluation matrix, as shown in Equation (28):
R 1 = 0.467 0.218 0.156 0.133 0.026 0.245 0.397 0.183 0.143 0.032 0.412 0.237 0.154 0.135 0.062 0.325 0.211 0.187 0.189 0.088 0.356 0.277 0.125 0.186 0.056 0.293 0.378 0.135 0.152 0.042
At the same time, the compound operation is performed according to W1:
s 1 = W 1 R 1 = ( 0.351 ,   0.291 ,   0.152 ,   0.155 ,   0.052 )
The economic benefit of investment is an important index that affects the total investment benefit. In the s1 set, the proportion of the evaluation result of investment economic benefit is “very high”, which is 0.351, followed by “high”, which is 0.291, indicating that the project investment economic benefit is high, the internal rate of return is higher than the bank loan interest rate, indicating that the project is feasible. However, due to the high project investment cost and operation and maintenance expenses, there is still room for improvement in the annual operating income. The investment payback period is long.
(2) The analysis of environmental benefits of investment
The subordinate subset of investment environmental benefit B2 is the fuzzy evaluation matrix, as shown in Equation (30):
R 2 = 0.352 0.246 0.161 0.075 0.166   0.388 0.264 0.156 0.128 0.064  
At the same time, the compound operation is performed according to W2:
s 2 = W 2 R 2 = ( 0.362 ,   0.251 ,   0.160 ,   0.090 ,   0.138 )
In the s2 set, the proportion of the evaluation result of investment environmental benefit is “very high”, which is 0.362, followed by “high”, which is 0.251, indicating that the investment environmental benefit of the project has reached a high level, energy saving and emission reduction are considerable, and the proportion of renewable energy consumption has increased greatly. This indicates that the investment H project has a large positive impact on the environment and good investment environmental benefit.
(3) The analysis of the social benefits of investment
The subordinate subset of investment social benefit B3 is the fuzzy evaluation matrix, as shown in Equation (32):
R 3 = 0.368 0.286 0.125 0.132 0.089 0.312 0.219 0.196 0.152 0.121 0.352 0.242 0.256 0.104 0.046
At the same time, compound operation is performed according to W3:
s 3 = W 3 R 3 = ( 0.334 ,   0.239 ,   0.194 ,   0.137 ,   0.097 )
In the s3 set, the proportion of the evaluation result of the social benefit of investment as “high” is the largest at 0.334, followed by “very high” at 0.239, indicating that the social benefit of project investment reached the optimal stage. Among them, policy intensity is the main factor. Due to the strong support of the government for Project H, the investment environment has been improved and the investment efficiency has been enhanced, and the feedback is that the government will further strengthen the policy support for the H project. The investment in the H project promotes technological innovation and has a positive impact on users’ energy usage habits.
(4) The analysis of the investment benefit of the project
According to W1, W2, and W3, complex operations are carried out to obtain the first-level fuzzy evaluation of investment benefit:
S = W R = ( 0.351 ,   0.273 ,   0.160 ,   0.136 ,   0.080 )
According to the above analysis, the overall investment benefit of investing in the H project is good, among which the “very high” score accounts for the largest proportion at 0.351, indicating that the overall investment benefit has reached its optimum. Specifically, the economic benefit of the investment represented by the s1 set is “very high”, but with the expansion of technological innovation and scale, there is room for further cost reduction, and the investment payback period will be shortened accordingly. The investment environmental benefit represented by the s2 set is “very high”, indicating that this project has a greater positive impact on the environment, is cleaner and more environmentally friendly than traditional energy projects, and is conducive to achieving the goal of “double carbon”. The social benefit of investment represented by the s3 set is “very high” and the government supports it greatly, which is conducive to promoting technological innovation. In the future, the social benefit of investment will be further improved with positive changes in the social environment, user energy consumption habits, and other factors.

7. Conclusions

Aiming at the problem of multi-subject participation in the investment proportion optimization of distribution network projects, we put forward an investment proportion optimization method based on cooperative game theory. By analyzing the interests of investors, the asymmetric Nash negotiation model in finance is introduced, and the initial investment ratio, risk-bearing coefficient, and core competence coefficient are comprehensively considered to optimize the investment ratio. The use of the asymmetric Nash negotiation model to optimize the investment proportion of different investors is conducive to improving the satisfaction of each investor, solving the problem of unfair allocation of investment costs, and maintaining the stability of the alliance.
By combining the main influencing factors and the investment benefit characteristics of the multi-energy complementary energy system project, the investment benefit analysis index system is constructed by using the Delphi method and fuzzy comprehensive evaluation method, and the investment benefit analysis model is established. The multi-energy complementary energy gathering station H demonstration project is taken as an example to analyze and evaluate the investment benefit of the multi-energy complementary energy gathering station project. Through the analysis of investment economic benefits, environmental benefits, and social benefits, it is concluded that the overall investment benefit of the project is good and the investment is more successful.
Based on the research in this paper, the following recommendations are made: policy leverage: establishing a dynamic subsidy mechanism linked to policy intensity targets and mandatory clauses for risk-sharing; industry specifications: developing standardized contract templates that include indicators for multi-energy complementary models; emerging market adaptation scenarios: covering applications in scenarios such as distributed photovoltaic and cross-border power interconnections.
The limitations of the study in this paper are as follows: data recency and regional biases; practical constraints of model assumptions; a summary table of critical assumptions.
Although this paper has achieved certain results in optimizing the proportion of multiple stakeholders’ investments and analyzing investment benefits, there is still room for further expansion and deepening. Future research can be conducted in the following directions. First, the development of dynamic optimization models: current research mainly focuses on the optimization of static investment proportions. In the future, dynamic optimization models can be developed to adapt to the changing investment demands of multi-energy complementary energy systems at different stages (such as the construction period, operation period, and maintenance period). Dynamic models can better reflect the dynamic interests of investment entities over time and further enhance the scientific and flexibility of investment decisions. Second, research on complex scenarios involving multiple participants: the research in this paper is mainly based on a limited number of investment entities. In practical applications, distribution network projects may involve more types of entities (such as government subsidy agencies, financial institutions, community organizations, etc.). In the future, research can be conducted on complex scenarios involving multiple participants, analyzing the interest competition relationships among different entities, and further improving the investment proportion optimization methods. Third, integration with other technologies or methods: with the development of emerging technologies such as artificial intelligence, big data, and blockchain, it is possible to explore the combination of these technologies with investment ratio optimization and benefit analysis. For instance, by using big data to analyze the historical data of investment entities, more accurate input parameters can be provided for the optimization model, or by leveraging blockchain technology to achieve transparency and traceability in the investment process, trust among investment entities can be enhanced. Third, integration with other technologies or methods: with the development of emerging technologies such as artificial intelligence, big data, and blockchain, it is possible to explore the combination of these technologies with investment ratio optimization and benefit analysis. For instance, by using big data to analyze the historical data of investment entities, more accurate input parameters can be provided for the optimization model; or by leveraging blockchain technology to achieve transparency and traceability in the investment process, trust among investment entities can be enhanced.

Author Contributions

Conceptualization, P.C. and W.Z.; methodology, P.C.; software, L.L.; validation, Y.Q. and M.G.; formal analysis, M.G.; investigation, L.L.; resources, P.C.; data curation, Y.Q.; writing—original draft preparation, P.C.; writing—review and editing, P.C.; visualization, Y.Q.; supervision, W.Z. All authors have read and agreed to the published version of the manuscript.

Funding

This research received no external funding.

Data Availability Statement

All data generated or analyzed during this study are included in this published article. They are available on request from the corresponding author.

Conflicts of Interest

The authors declare no conflicts of interest.

References

  1. Jiang, T.; Yang, J.; Huang, S. Evolution and driving factors of CO2 emissions structure in China’s heating and power industries: The supply-side and demand-side dual perspectives. J. Clean. Prod. 2020, 264, 121507. [Google Scholar] [CrossRef]
  2. Cao, Y.; Zhang, S. Facilitating the provision of load flexibility to the power system by data centers: A hybrid research method applied to China. Util. Policy 2023, 84, 101636. [Google Scholar] [CrossRef]
  3. Liu, X. Research on collaborative scheduling of internet data center and regional integrated energy system based on electricity-heat-water coupling. Energy 2024, 292, 130462. [Google Scholar] [CrossRef]
  4. Zhu, Z.; Wang, D.; Tang, B.; Zhao, X.; Gu, G.; Yang, P.; Lai, X. Co-optimization of distributed generation, flexible load, and energy storage for promoting renewable energy consumption and power balancing in distribution networks. Electr. Power Syst. Res. 2025, 238, 111124. [Google Scholar] [CrossRef]
  5. Aziz, S.; Chowdhury, S.A.; Alauddin, M. Investment risks and policy solutions for renewable electricity in Bangladesh. Energy Sustain. Dev. 2025, 85, 101605. [Google Scholar] [CrossRef]
  6. Liao, K.; Li, X.; Xie, H. Regional Difference decomposition and dynamic effect evaluation of Chinese local government investment efficiency-based on the perspective of economic and social efficiency. J. Quant. Technol. Econ. 2019, 36, 42–63. [Google Scholar] [CrossRef]
  7. Jin, S.; Xiong, R.; Peng, H.; Tang, S. ESG performance and private enterprise resilience: Evidence from Chinese financial markets. Int. Rev. Financ. Anal. 2025, 98, 103884. [Google Scholar] [CrossRef]
  8. Bridget, O.M.; Theophilus, A. Crowdfunding renewable energy investments: Investor perceptions and decision-making factors in an emerging market. Energy Res. Soc. Sci. 2024, 114, 103602. [Google Scholar] [CrossRef]
  9. Zhang, M.; Nie, J.; Su, B.; Liu, L. An option game model applicable to multi-agent cooperation investment in energy storage projects. Energy Econ. 2024, 131, 107397. [Google Scholar] [CrossRef]
  10. Yue, H.; Zhang, Y.; Guo, J.; Hu, Y.; Wei, C.; Jia, H.; Liu, D.; Xie, D. Analysis and construction of evaluation index system of inter-provincial electricity spot markets. Glob. Energy Interconnect. 2024, 7, 697–706. [Google Scholar] [CrossRef]
  11. Liu, Z.; Wu, J. Evaluation index system for carbon information disclosure quality in China’s electric power sector based on a mutual information and back propagation neural network model. Util. Policy 2024, 89, 101781. [Google Scholar] [CrossRef]
  12. Lyu, Y.; Luo, Y.; Jia, Z.; Fu, S.; Tang, Y.; Wang, Q.; Zeng, Y. Benefit evaluation of HVAC and HVDC for offshore wind power transmission system under the multidimensional index. Electr. Power Syst. Res. 2024, 237, 111018. [Google Scholar] [CrossRef]
  13. Xu, Y.; Du, R.; Pei, J. The investment risk evaluation for onshore and offshore wind power based on system dynamics method. Sustain. Energy Technol. Assess. 2023, 58, 103328. [Google Scholar] [CrossRef]
  14. Ji, Z.; Yu, X.; Li, W.; Niu, D. A multi-criteria decision-making framework for distributed generation projects investment considering the risk of electricity market trading. J. Clean. Prod. 2023, 416, 137837. [Google Scholar] [CrossRef]
  15. Choorikkat, S.; Lee, Y.; Hsu, H. Model for subsidizing industry and power company through gray-electricity taxation. Renew. Sustain. Energy Rev. 2025, 211, 115291. [Google Scholar] [CrossRef]
  16. Amiri-Pebdani, S.; Alinaghian, M.; Khosroshahi, H. A game theoretic approach for time-of-use pricing with considering renewable portfolio standard effects and investment in energy storage technologies under government interventions. Energy 2023, 282, 128721. [Google Scholar] [CrossRef]
  17. Zhao, J.; Zhang, C.; Wu, Y.; Zhu, J. Dual driving forces for corporate environmental responsibility performance: The synergistic effects of government environmental regulation and market multi-agent green supervision. Sci. Total Environ. 2024, 949, 174790. [Google Scholar] [CrossRef]
  18. Cui, Y.; Wang, W.; Wang, Q.; Li, Q. Characteristics and optimization strategies of multi-subject governance network structure for land consolidation. J. Rural. Stud. 2024, 112, 103470. [Google Scholar] [CrossRef]
  19. Zhang, C.; Jin, X.; Xie, G. Method to extract critical characteristics of power grid projects adapting to new situations and construction of index system. Energy Rep. 2022, 8, 533–539. [Google Scholar] [CrossRef]
  20. He, C.; Zhou, S.; Zhang, M.; Hou, J. Research and application of project post-evaluation based on company ESG investment concept. Reform Openning 2022, 37, 64–72. [Google Scholar] [CrossRef]
  21. Song, X.; Yang, Q.; Wan, J. The Principle and Method of Economic Efficiency Evaluation of Project Capital Rationing. Chin. J. Manag. Sci. 2002, 19, 46–49. [Google Scholar] [CrossRef]
  22. Liao, H.; Yuan, N. Evaluation index and evaluation method of project investment decision. Stat. Decis. 2021, 37, 181–185. [Google Scholar] [CrossRef]
  23. Zou, H. Post-evaluation of government investment projects: Logical orientation, system inspection and legal regulation. Adm. Trib. 2022, 29, 147–154. [Google Scholar] [CrossRef]
  24. Xue, J.; Dai, X.; Xiao, L.; Wang, Q.; Li, M.C. Multi-objective carbon-energy portfolio optimization under investment horizon heterogeneity. Res. Int. Bus. Financ. 2025, 79, 103036. [Google Scholar] [CrossRef]
  25. Koutsandreas, D.; Keppo, I. Harnessing machine learning algorithms to unveil energy efficiency investment archetypes. Energy Rep. 2024, 12, 3180–3195. [Google Scholar] [CrossRef]
  26. Cheng, F.; Huang, P.; Zou, T.; Zhang, M.; Peng, P.; Lu, W. Evolutionary game-theoretical approaches for long-term strategic bidding among diverse stakeholders in large-scale and local power markets: Basic concept, modelling review, and future vision. Int. J. Electr. Power Energy Syst. 2025, 166, 110589. [Google Scholar] [CrossRef]
  27. Zheng, H.; Wu, Z. Enhancing economic and environmental performance of energy communities: A multi-objective optimization approach with mountain gazelle optimizer. Sustain. Comput. Inform. Syst. 2025, 46, 101098. [Google Scholar] [CrossRef]
  28. Ruan, Y.; Wang, W.; Abubakar, M.; Ahmad, N. Global economic resilience: Developing green growth strategies, renewable energy integration, and environmental economics for sustainability. Renew. Energy 2025, 251, 123341. [Google Scholar] [CrossRef]
  29. Lilliu, F.; Recupero, D.R. A cooperative game-theory approach for incentive systems in local energy communities. Sustain. Energy Grids Netw. 2024, 38, 101391. [Google Scholar] [CrossRef]
  30. Lokeshgupta, B.; Sivasubramani, S. Cooperative game theory approach for multi-objective home energy management with renewable energy integration. IET Smart Grid 2019, 2, 34–41. [Google Scholar] [CrossRef]
  31. Malik, S.; Duffy, M.; Thakur, S.; Hayes, B.; Breslin, J. A priority-based approach for peer-to-peer energy trading using cooperative game theory in local energy community. Int. J. Electr. Power Energy Syst. 2022, 137, 107865. [Google Scholar] [CrossRef]
  32. Han, L.; Morstyn, T.; McCulloch, M. Incentivizing prosumer coalitions with energy management using cooperative game theory. IEEE Trans. Power Syst. 2018, 34, 303–313. [Google Scholar] [CrossRef]
  33. Harsanyi, J.C. Chapter 19 Game and decision theoretic models in ethics. Handb. Game Theory Econ. Appl. 1992, 1, 669–707. [Google Scholar] [CrossRef]
  34. Yu, H.; Xu, F.; Chen, C.; Chen, Y.; Zhang, W.; Yang, L.; Lin, Z. Asymmetric Nash bargaining-based community-centric energy sharing strategy for numerous prosumers. Energy 2025, 316, 134468. [Google Scholar] [CrossRef]
Figure 1. Flow chart.
Energies 18 04031 g001
Figure 2. Risk-sharing ratio of various investment entities under the direct operation mode.
Energies 18 04031 g002
Figure 3. Weight of various indicators under the direct operation mode of various investment entities.
Energies 18 04031 g003
Figure 4. Investment ratio before and after negotiation in the direct operation model.
Energies 18 04031 g004
Table 1. Classification of diversified investment entities.
The Investment SubjectInvestment RoleIndustry Background
Individual creditorsCommercial banks, securities companies, industrial funds, etc.The return on investment through borrowing benefits can alleviate the capital pressure of investment planning and share certain risks of financial and market operations.
Government sectorLocal government investment platform, city investment, state investment, etc.It has the advantage of approving projects, franchising rights, providing funds and policy support, and buying shares with funds.
Specialized corporationPower grid enterprisesWith talent, technology, management, and other advantages in the power industry, with capital, technology shares in the distribution company.
Power generation groupWith distributed power investment, operation, and other technical advantages, with capital and technology investment, improve the project’s distributed power investment and operation efficiency.
Social capitalActivating capital can improve the vitality of project investment and operation.
Energy public service corporationIt has technical advantages in the construction, operation, and maintenance of energy supply equipment and other aspects of the industry and invests in capital and technology. While coordinating the coordinated operation of cold, hot, and electricity sources in the distribution network, value-added services such as integrated energy services, energy conservation and efficiency, and intelligent electricity consumption can be developed.
Table 2. Interpretation of each investment model.
Investment PatternOperation ModeParaphrase
Independent investmentIndependent operationIndependently undertake project investment, construction, and operation.
Co-investmentDirect operationParticipate in the investment, construction, and operation of the project.
Entrusted operationOnly participate in the operation of the project, not participate in the investment and construction of the project.
Lease operationOnly participate in the investment and construction of the project, not participate in the operation of the project.
Table 3. Index system of investment benefit evaluation.
Destination LayerCriterion LayerScheme Layer
Investment benefits (B)Economic benefits of investment (B1)Total project investment cost (B11)
Annual operation and maintenance cost of the project (B12)
Annual operating income of the project (B13)
Net present value (B14)
Payback period (B15)
Internal rate of return (B16)
Environmental benefits of investment (B2)Energy saving and emission reduction (B21)
Renewable energy consumption increased proportionally (B22)
Social benefits of investment (B3)The rate of technology update (B31)
Policy intensity (B32)
Multi-energy complementary operation mode (B33)
Table 4. Judgment matrix.
Investment BenefitsEconomic Benefits of InvestmentEnvironmental Benefits of InvestmentSocial Benefits of InvestmentWeight
Economic benefits of investment1.003.003.000.5936
Environmental benefits of investment0.331.002.000.2493
Social benefits of investment0.330.501.000.1571
CR = 0.0516 < 0.1, which has consistency.
Table 5. Weight of investment benefit analysis index of multi-energy complementary energy projects.
Criterion LayerWeightScheme LayerWeight
Economic benefits of investment (B1)W1 = 0.5936Total project investment cost (B11)
Annual operation and maintenance cost of the project (B12)
Annual operating income of the project (B13)
Net present value (B14)
Payback period (B15)
Internal rate of return (B16)
W11 = 0.1390
W12 = 0.0675
W13 = 0.2021
W14 = 0.1494
W15 = 0.1236
W16 = 0.3183
Environmental benefits of investment (B2)W2 = 0.2493Energy saving and emission reduction (B21)
Renewable energy consumption increased proportionally (B22)
W21 = 0.7249
W22 = 0.2751
Social benefits of investment (B3)W3 = 0.1571The rate of technology update (B31)
Policy intensity (B32)
Multi-energy complementary operation mode (B33)
W31 = 0.2217
W32 = 0.5489
W33 = 0.2294
Table 6. The basic data of the H project.
Parameter IndexDataUnit
35 kV gathering station2 × 10MVA
Storage capacity5/10MW/MWh
Micro gas turbine300kW
Electric boiler2160kW
Gas boiler4t/h
Annual electricity supply35,000MW
Annual heat supply21 × 104GJ
Total project investment8444.35ten thousand yuan
Equipment lifetime20year
Annual operation and maintenance costs2592.3ten thousand yuan
Average tariff0.72yuan/kWh
Heat selling price34.6yuan/GJ
Table 7. Related parameters of construction cost.
ParameterMeaningValue and Unit
a t r a n The part of the investment that is not related to substation capacity.150,000 yuan
b t r a n Coefficient of linear relationship between investment and substation capacity.50 yuan
a l i n e The coefficient of the investment is independent of the cross-sectional area of the conductor.20,000 yuan
b l i n e Coefficient of the linear relationship between investment and cross-sectional area of wire.100
δ 0 t δ e s Annualized coefficient.5%
δ 1 t Coefficient of operation and maintenance cost.8%
β t The overall loss rate of the incremental distribution network.4%
R o v e n Power generation ratio1.5
Table 8. The peak-valley time-of-use tariff.
Time FramePrice/(Yuan/(kW·h))
Sell ElectricityPurchasing Electricity
During peak demand8:00—12:00
17:00—21:00
1.09020.8722
At ordinary times12:00—17:00
21:00—24:00
0.65410.5232
During low demand0:00—8:000.31800.2544
Table 9. Investment costs by category.
Types of InvestmentDirect Operation (Cooperative)Independent Operation
Cost/104 YuanProportion/%Cost/104 YuanProportion/%
Power purchase cost1648.8953.882317.5058.54
Gas purchase cost933.8230.52702.6217.75
Distribution network construction costs38.571.2675.021.89
Energy conversion equipment costs52.951.7300
Energy storage construction cost385.9112.61864.0021.82
Total3060.141003959.14100
Table 10. Core competence coefficients of various investment entities.
InvestorInnovation AbilityCore TechnologyCollaborative Ability
A0.20.60.2
B0.20.10.6
C0.60.30.2
Table 11. Negotiation basis and satisfaction after negotiation under the direct operation mode.
InvestorNegotiation BasisDegree of SatisfactionDeviation Value
A5.00019.42114.421
B2.0002.18660.1866
C2.50003.18370.6837
Table 12. The index data of investment benefit analysis in the H Project.
Primary IndexSecondary IndexThree-Level IndexDataUnit
Investment benefits (B)Economic benefits of investment (B1)Total project investment cost (B11)
Annual operation and maintenance cost of the project (B12)
Annual operating income of the project (B13)
Net present value (B14)
Payback period (B15)
Internal rate of return (B16)
8444.353
2592.302
3403.6
1666.041
10.409
6.91
104 yuan
104 yuan
104 yuan
104 yuan
year
%
Environmental benefits of investment (B2)Energy saving and emission reduction (B21)
Renewable energy consumption increased in proportion (B22)
20,916
23
t
%
Social benefits of investment (B3)The rate of technology update (B31)
Policy intensity (B32)
Multi-energy complementary operation mode (B33)
4
8
8
%
minute
minute
Disclaimer/Publisher’s Note: The statements, opinions and data contained in all publications are solely those of the individual author(s) and contributor(s) and not of MDPI and/or the editor(s). MDPI and/or the editor(s) disclaim responsibility for any injury to people or property resulting from any ideas, methods, instructions or products referred to in the content.

