
QES Model Aggregating Quality, Environmental Impact, and Social Responsibility: Designing Product Dedicated to Renewable Energy Source


Abstract
1. Introduction
2. Model: Quality–Environmental Impact–Social Responsibility (QES)
2.1. Concept and Main Idea
2.2. Assumptions of the Model
- The product for testing is arbitrary, but it is recommended that it be a commonly used final product.
- Qualitative criteria are criteria directly related to the usability of the product, often interpreted as criteria influencing customer satisfaction.
- Environmental criteria are criteria concerning the impact of the product on the natural environment.
- Social criteria are criteria of the so-called corporate social responsibility (CSR), which concern the fulfilment of social responsibility of the product.
- It is proposed to strive for such a proportion of criteria that will reflect the importance of a particular aspect in the conducted analysis.
- The total number of all criteria from the qualitative, environmental, and social groups is arbitrary, but should be reduced to about 10–15 key criteria, but not less than 7 ± 2 criteria.
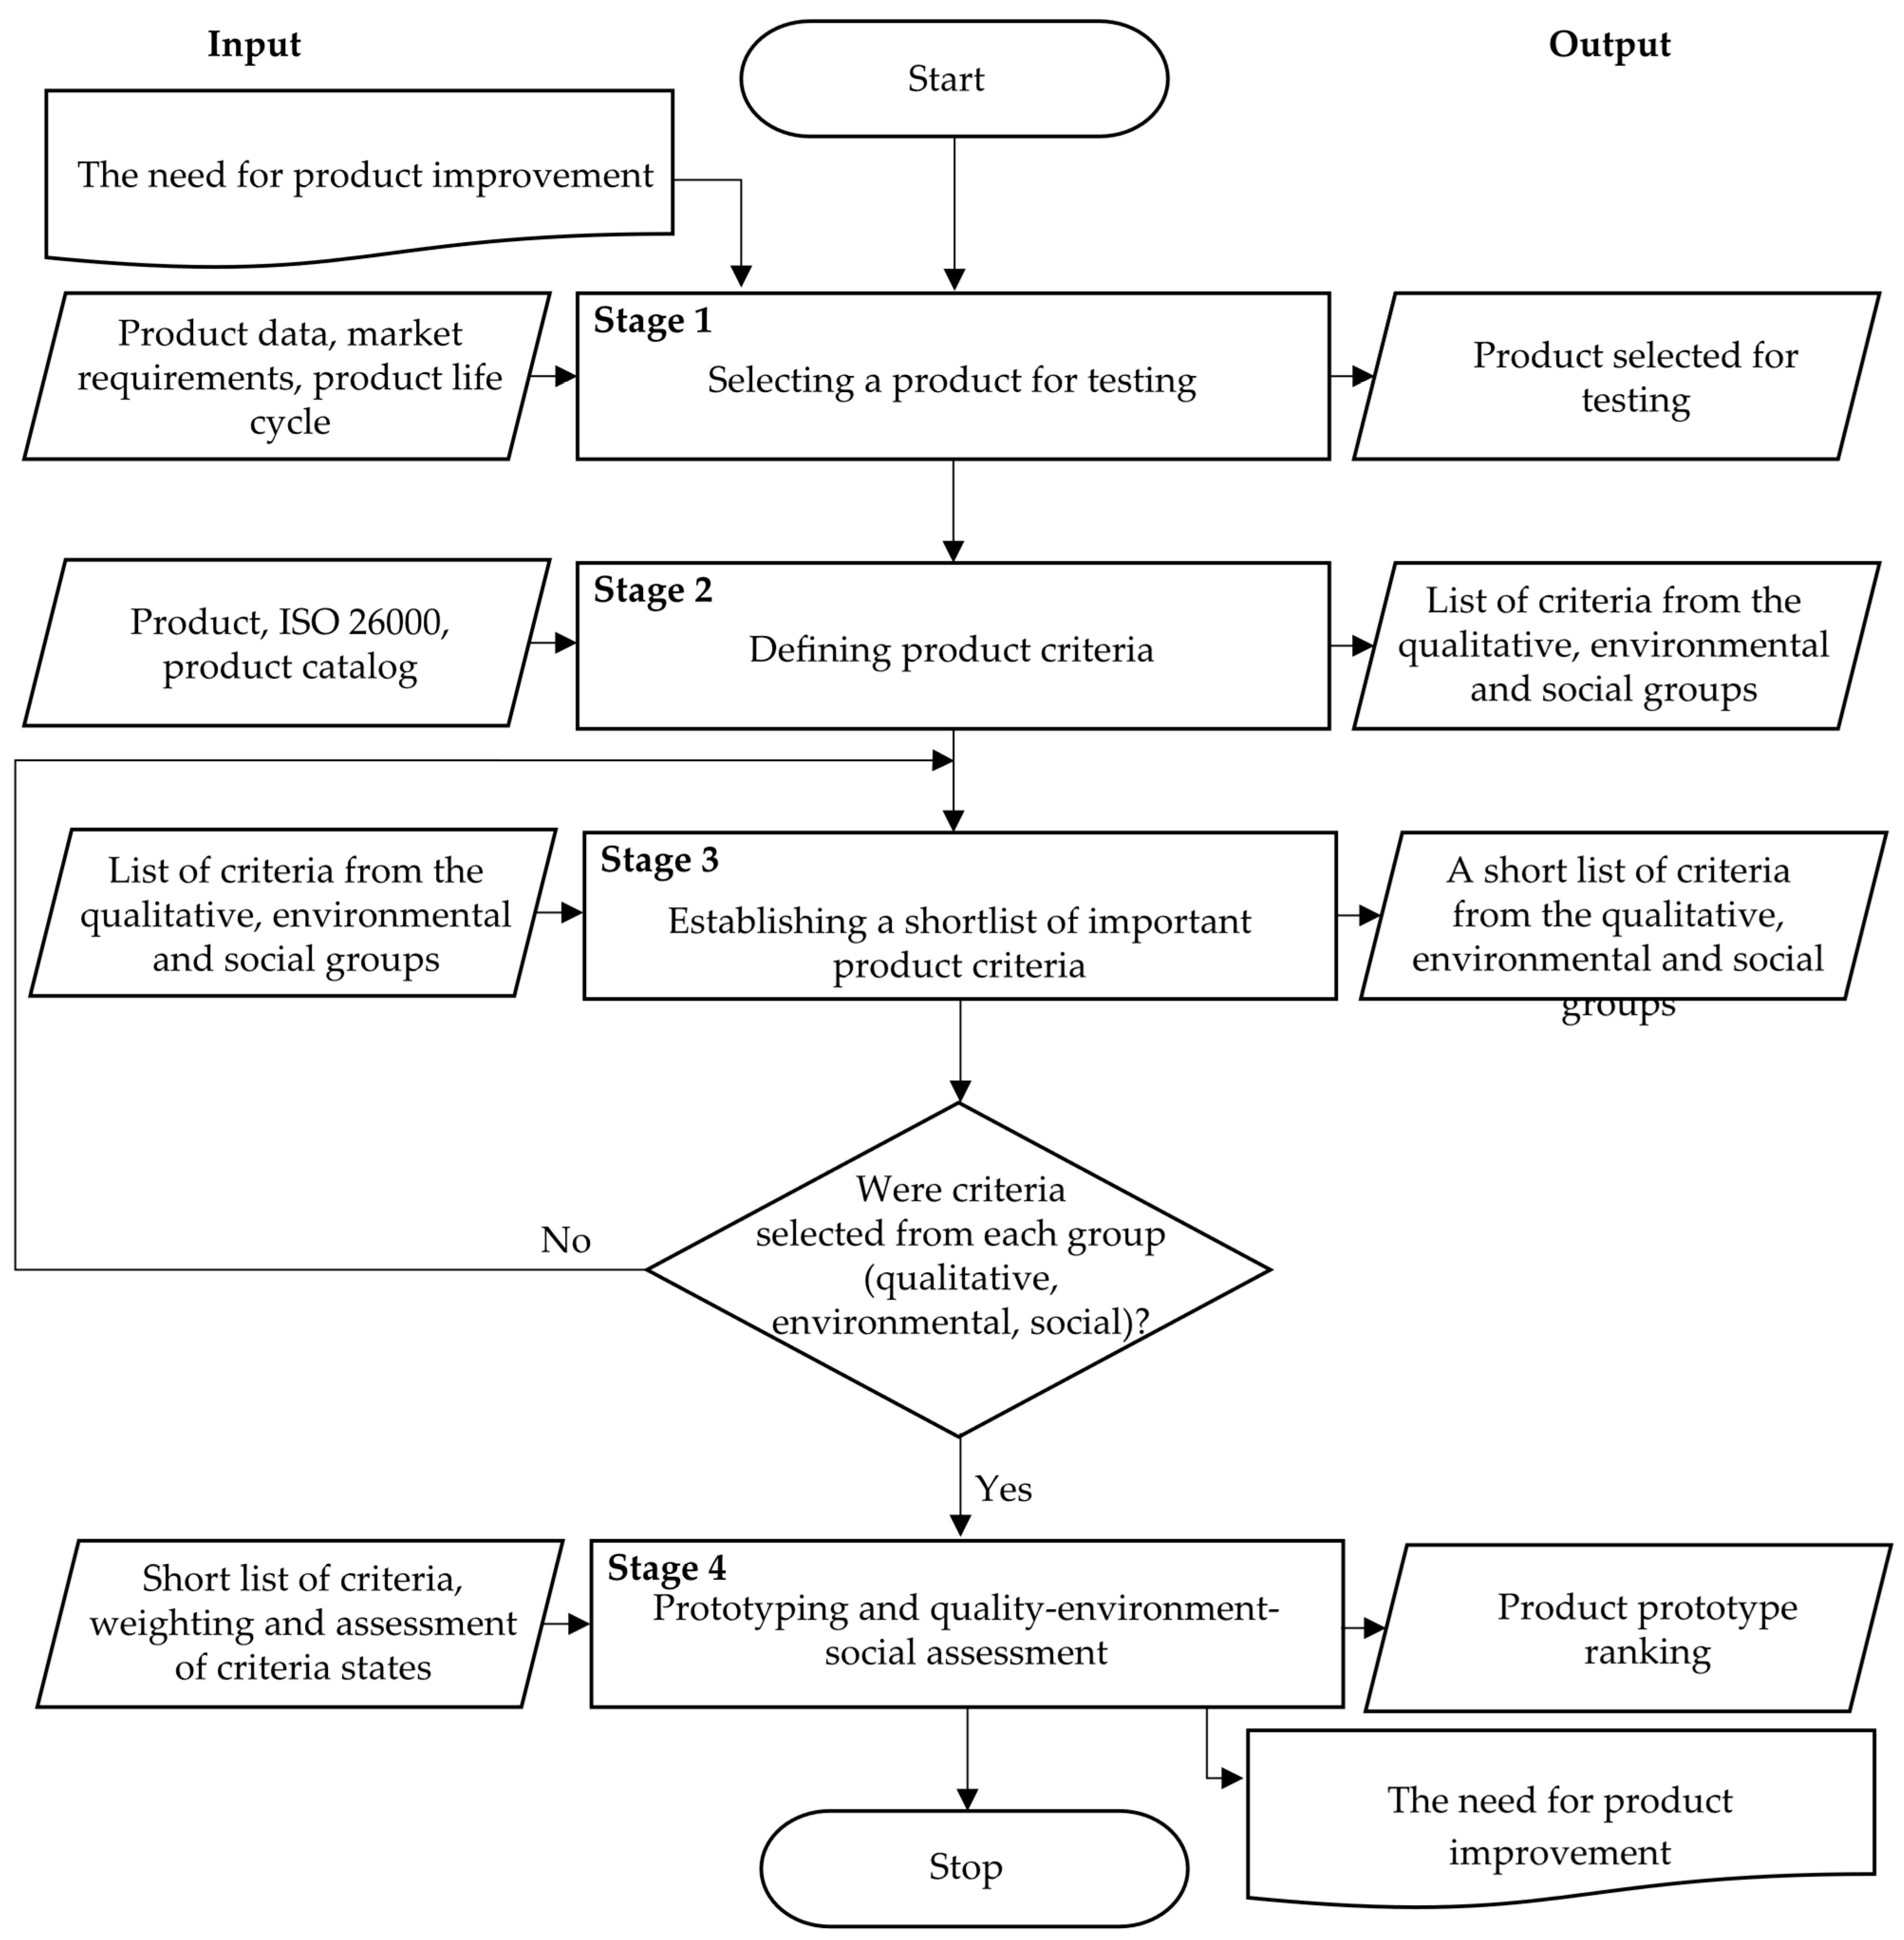
2.3. Model Description
- Stage 1. Selecting a product for testing.
- Stage 2. Defining product criteria.
- Stage 3. Establishing a shortlist of important product criteria.
- Stage 4. Prototyping and quality–environment–social assessment.
- Stage 1. Selecting a product for testing
- Stage 2. Defining product criteria
- Organisational governance;
- Human rights:
- ○
- Due diligence;
- ○
- Human rights situations;
- ○
- Avoidance of complicity;
- ○
- Grievance resolution;
- ○
- Discrimination and vulnerable groups;
- ○
- Civil and political rights;
- ○
- Economic, social, and cultural rights;
- ○
- Fundamental principles and rights at work.
- Labour practices:
- ○
- Employment and labour relations;
- ○
- Working conditions and social protection;
- ○
- Social dialogue;
- ○
- Occupational health and safety;
- ○
- Workplace development and training.
- Environment:
- ○
- Pollution prevention;
- ○
- Sustainable use of resources;
- ○
- Climate change, mitigation, and adaptation;
- ○
- Environmental protection, biodiversity, and restoration of natural habitats.
- Fair operating practices:
- ○
- Anti-corruption;
- ○
- Responsible political engagement;
- ○
- Fair competition;
- ○
- Promoting social responsibility in the value chain;
- ○
- Respect for property rights;
- Consumer Affairs:
- ○
- Fair marketing, factual and unbiased information, and fair contractual practices;
- ○
- Protection of consumer health and safety;
- ○
- Sustainable consumption;
- ○
- Customer service, support, and resolution of complaints and disputes;
- ○
- Protection of consumer data and privacy;
- ○
- Access to essential services;
- ○
- Education and awareness.
- Community engagement and development:
- ○
- Community engagement;
- ○
- Education and culture;
- ○
- Job creation and skills development;
- ○
- Technology development and access;
- ○
- Wealth and income creation;
- ○
- Health;
- ○
- Social investment.
- Stage 3. Establishing a shortlist of criteria that significantly affect the quality–environmental–social level of the product
- Stage 4. Creating prototypes and qualitative–environmental–social assessment
3. Results: Case Study Based on Photovoltaic Panels
- Nominal (installed) power (Wp)—means the maximum possible electrical power that a photovoltaic module can generate in ideal conditions.
- Short circuit current (A)—the current that flows through the PV cell in a short circuit situation, i.e., with no load and maximum solar radiation.
- Maximum output current (A)—the current that the photovoltaic panel actually supplies to the connected receiver.
- Open circuit voltage (V)—the voltage generated by the PV module when it is not connected to any load (the circuit is open).
- Maximum voltage (V)—the voltage value achieved by the panel at the point of maximum power, usually measured under standard test conditions (STC).
- Efficiency (%)—an indicator of how effectively the panel converts solar radiation energy into electrical energy—the higher the value, the better the performance.
- Maximum system voltage (VDC)—the highest voltage allowed for a PV system, limiting the number of modules that can be connected in series in a single installation.
- Maximum power (MPP)—the highest power value that a PV cell can achieve under optimal conditions—a key parameter when selecting a panel.
- Panel efficiency (%)—the degree to which the entire PV module converts sunlight into electrical energy; typically lower than the efficiency of a single cell due to losses when connecting them.
- Weight (kg)—the total weight of the photovoltaic panel.
- Warranty—the period during which the manufacturer provides free repair or replacement of the PV module in the event of a failure.
- Kinematics—the ability to adjust the angle of the photovoltaic panel to optimise its position in relation to the sun.
- Dimensions (mm)—the physical dimensions of the panel: length, width, and thickness.
- Single cell efficiency (%)—the efficiency of converting solar energy into electrical energy by a single cell in the PV module.
- Visibility—refers to the degree to which a photovoltaic (PV) installation is visible to customers and other interested parties. The more visible the installation, the greater its negative impact on the perceived quality of the surroundings may be. Visibility can be assessed using GIS tools or as the ratio of the area occupied by photovoltaics to the total area of the landscape. The analysis should take into account places that are important from the point of view of the recipient, e.g., within 5–10 km of natural, historical, monumental, or recreational areas that the user wants to protect from visual interference. It may be difficult to take into account the subjective perspective of the recipient.
- Degree of integration—determines how well the PV installation fits into the surrounding landscape, which is directly related to its visibility. It is important to distinguish here between BIPV (building-integrated) and BAPV (building-mounted) technologies. Experts recommend the highest possible degree of integration because it limits negative visual impressions. One can distinguish non-integrated, partially integrated, and fully integrated systems.
- Colour—refers to the colour, saturation, and brightness of the PV system elements, such as panel frames, and how well they match the surrounding landscape of the colour scheme.
- Light reflection—refers to the amount of light (natural or artificial) reflected by the PVs. Unwanted reflections can reduce the visual comfort of users—causing glare, the need to look away, eye fatigue, and even headaches.
- Pattern (texture)—describes the appearance of the PV surface in terms of its complexity and degree of similarity to the surrounding elements. This includes, among others, transparency, porosity, and surface density.
- Environmental criteria:
- ○
- Pollution prevention;
- ○
- Sustainable use of resources;
- ○
- Climate change, mitigation, and adaptation;
- ○
- Environmental protection, biodiversity, and restoration of natural habitats.
- Social criteria:
- ○
- For fair operating practices:
- ▪
- Fair competition;
- ▪
- Promoting social responsibility in the value chain.
- ○
- Consumer affairs:
- ▪
- Fair marketing, factual and impartial information, and fair contractual practices;
- ▪
- Protection of consumer health and safety;
- ▪
- Access to basic services.
- ○
- Community engagement and development:
- ▪
- Community engagement;
- ▪
- Technology development and access;
- ▪
- Social investment.
4. Discussion
- Ensuring simultaneous analysis of customer expectations regarding product quality, its impact on the environment, and ensuring social responsibility;
- Striving to increase customer satisfaction by analysing criteria regarding product usability;
- Limiting the negative impact of the product on the natural environment by analysing criteria regarding selected environmental burdens;
- Meeting expectations regarding social responsibility by analysing criteria regarding corporate social responsibility;
- Ensuring qualitative and quantitative analysis of the product and its prototypes, supporting the creation of hypothetical product solutions and making decisions about the direction of improving the current product;
- Creating a ranking of product prototypes based on which it is possible to focus on key solutions from the quality–environmental–social point of view, including the rejection of solutions with poor prospects;
- A low-budget model, the use of which does not require extensive databases, including access to software for assessing quality, environmental impact, or social responsibility aspects;
- Reducing the waste of resources by focusing on key solutions.
- The need for a qualified team of interdisciplinary experts;
- The possibility of inconsistency in clearly defining a shortlist of product criteria, resulting from the inability to completely limit subjectivity in expert assessments;
- The lack of complete certainty from the analysis conducted, resulting from a prospective assessment of hypothetical product modifications without physically testing them in practice.
5. Conclusions
Author Contributions
Funding
Data Availability Statement
Conflicts of Interest
Appendix A
Appendix A.1

| C1 | C2 | C3 | C4 | C5 | C6 | C7 | C8 | C9 | C10 | C11 | C12 | C13 | C14 | C15 | C16 | C17 | C18 | C19 | C20 | C21 | C22 | C23 | C24 | C25 | C26 | C27 | C28 | C29 | C30 | |
|---|---|---|---|---|---|---|---|---|---|---|---|---|---|---|---|---|---|---|---|---|---|---|---|---|---|---|---|---|---|---|
| C1 | 0 | 3 | 4 | 2 | 2 | 4 | 4 | 4 | 4 | 0 | 0 | 0 | 4 | 0 | 0 | 0 | 0 | 0 | 0 | 3 | 3 | 0 | 4 | 4 | 4 | 2 | 2 | 2 | 4 | 4 |
| C2 | 2 | 0 | 2 | 2 | 2 | 3 | 2 | 2 | 3 | 0 | 0 | 0 | 3 | 0 | 0 | 0 | 0 | 0 | 0 | 1 | 1 | 0 | 1 | 1 | 1 | 1 | 1 | 1 | 1 | 1 |
| C3 | 2 | 2 | 0 | 2 | 2 | 3 | 3 | 3 | 3 | 0 | 0 | 0 | 2 | 0 | 0 | 0 | 0 | 0 | 0 | 2 | 1 | 0 | 2 | 1 | 2 | 2 | 2 | 1 | 1 | 1 |
| C4 | 2 | 0 | 2 | 0 | 2 | 3 | 2 | 2 | 3 | 0 | 0 | 0 | 3 | 0 | 0 | 0 | 0 | 0 | 0 | 1 | 1 | 0 | 1 | 1 | 1 | 1 | 1 | 1 | 1 | 1 |
| C5 | 3 | 3 | 3 | 3 | 0 | 3 | 3 | 3 | 3 | 0 | 0 | 0 | 2 | 0 | 0 | 0 | 0 | 0 | 0 | 2 | 1 | 0 | 2 | 1 | 2 | 2 | 2 | 1 | 1 | 2 |
| C6 | 1 | 1 | 2 | 1 | 1 | 0 | 1 | 1 | 3 | 0 | 0 | 0 | 3 | 0 | 0 | 0 | 0 | 0 | 1 | 4 | 4 | 4 | 4 | 4 | 4 | 4 | 4 | 4 | 4 | 4 |
| C7 | 2 | 2 | 0 | 2 | 2 | 3 | 0 | 3 | 3 | 0 | 0 | 0 | 2 | 0 | 0 | 0 | 0 | 0 | 0 | 2 | 1 | 0 | 2 | 1 | 2 | 2 | 2 | 1 | 1 | 1 |
| C8 | 2 | 1 | 2 | 1 | 1 | 2 | 2 | 0 | 2 | 0 | 0 | 0 | 2 | 0 | 0 | 0 | 0 | 0 | 1 | 1 | 1 | 1 | 2 | 1 | 1 | 1 | 1 | 1 | 1 | 1 |
| C9 | 1 | 1 | 2 | 1 | 1 | 1 | 1 | 1 | 0 | 0 | 0 | 0 | 3 | 0 | 0 | 0 | 0 | 0 | 1 | 4 | 4 | 4 | 4 | 4 | 4 | 4 | 4 | 4 | 4 | 4 |
| C10 | 0 | 0 | 0 | 0 | 0 | 0 | 0 | 0 | 0 | 0 | 0 | 4 | 0 | 2 | 1 | 0 | 0 | 1 | 2 | 2 | 2 | 2 | 1 | 1 | 1 | 1 | 1 | 1 | 1 | 1 |
| C11 | 0 | 0 | 0 | 0 | 0 | 0 | 0 | 0 | 0 | 0 | 0 | 0 | 0 | 0 | 0 | 0 | 0 | 0 | 4 | 4 | 4 | 4 | 4 | 2 | 2 | 4 | 2 | 2 | 4 | 4 |
| C12 | 0 | 0 | 0 | 0 | 0 | 1 | 0 | 0 | 1 | 1 | 0 | 0 | 1 | 1 | 1 | 0 | 1 | 1 | 1 | 1 | 1 | 1 | 1 | 1 | 1 | 1 | 1 | 1 | 1 | 1 |
| C13 | 1 | 1 | 2 | 1 | 1 | 1 | 1 | 1 | 0 | 0 | 0 | 0 | 0 | 0 | 0 | 0 | 0 | 0 | 1 | 2 | 2 | 2 | 2 | 2 | 2 | 2 | 2 | 2 | 2 | 2 |
| C14 | 0 | 0 | 0 | 0 | 0 | 0 | 0 | 0 | 0 | 0 | 0 | 0 | 0 | 0 | 4 | 4 | 3 | 2 | 1 | 0 | 0 | 0 | 1 | 1 | 1 | 0 | 0 | 1 | 1 | 1 |
| C15 | 0 | 0 | 0 | 0 | 0 | 0 | 0 | 0 | 0 | 0 | 0 | 0 | 0 | 2 | 0 | 1 | 1 | 2 | 0 | 1 | 0 | 0 | 1 | 1 | 1 | 0 | 0 | 1 | 1 | 1 |
| C16 | 0 | 0 | 0 | 0 | 0 | 0 | 0 | 0 | 0 | 0 | 0 | 0 | 0 | 4 | 4 | 0 | 4 | 1 | 4 | 0 | 0 | 0 | 4 | 0 | 0 | 0 | 0 | 2 | 0 | 3 |
| C17 | 0 | 0 | 0 | 0 | 0 | 0 | 0 | 0 | 0 | 0 | 0 | 0 | 0 | 3 | 3 | 1 | 0 | 1 | 1 | 1 | 0 | 0 | 4 | 0 | 0 | 0 | 0 | 2 | 0 | 3 |
| C18 | 0 | 0 | 0 | 0 | 0 | 0 | 0 | 0 | 0 | 0 | 0 | 0 | 0 | 4 | 4 | 1 | 4 | 0 | 3 | 0 | 0 | 0 | 4 | 0 | 0 | 0 | 0 | 2 | 0 | 3 |
| C19 | 0 | 0 | 0 | 0 | 0 | 4 | 0 | 0 | 4 | 0 | 0 | 0 | 4 | 1 | 1 | 1 | 0 | 0 | 0 | 1 | 2 | 2 | 1 | 2 | 2 | 2 | 2 | 2 | 2 | 2 |
| C20 | 1 | 1 | 1 | 1 | 1 | 3 | 1 | 1 | 3 | 1 | 1 | 1 | 3 | 2 | 2 | 1 | 0 | 0 | 1 | 0 | 1 | 1 | 1 | 1 | 1 | 1 | 1 | 1 | 1 | 1 |
| C21 | 0 | 0 | 0 | 0 | 0 | 1 | 0 | 0 | 1 | 0 | 0 | 0 | 1 | 0 | 0 | 0 | 0 | 0 | 1 | 1 | 0 | 2 | 2 | 2 | 2 | 1 | 1 | 2 | 2 | 2 |
| C22 | 0 | 0 | 0 | 0 | 0 | 0 | 0 | 0 | 0 | 0 | 0 | 0 | 0 | 0 | 0 | 0 | 0 | 0 | 1 | 1 | 1 | 0 | 1 | 1 | 1 | 1 | 1 | 1 | 1 | 1 |
| C23 | 1 | 1 | 1 | 1 | 1 | 2 | 2 | 2 | 2 | 1 | 1 | 1 | 2 | 3 | 3 | 3 | 3 | 3 | 4 | 4 | 4 | 4 | 0 | 4 | 4 | 4 | 4 | 4 | 4 | 4 |
| C24 | 1 | 1 | 1 | 1 | 1 | 1 | 1 | 1 | 1 | 1 | 3 | 1 | 1 | 1 | 1 | 1 | 1 | 1 | 3 | 3 | 3 | 3 | 3 | 0 | 3 | 3 | 3 | 3 | 3 | 3 |
| C25 | 3 | 3 | 3 | 3 | 3 | 3 | 3 | 3 | 3 | 3 | 3 | 3 | 3 | 3 | 3 | 3 | 3 | 3 | 2 | 2 | 2 | 2 | 2 | 2 | 0 | 2 | 2 | 2 | 2 | 2 |
| C26 | 0 | 0 | 0 | 0 | 0 | 4 | 0 | 0 | 4 | 0 | 4 | 0 | 4 | 0 | 0 | 0 | 0 | 0 | 2 | 2 | 2 | 2 | 2 | 2 | 2 | 0 | 2 | 2 | 2 | 2 |
| C27 | 1 | 1 | 1 | 1 | 1 | 1 | 1 | 1 | 1 | 0 | 0 | 1 | 1 | 0 | 0 | 0 | 0 | 0 | 1 | 1 | 1 | 1 | 1 | 1 | 1 | 1 | 0 | 1 | 1 | 1 |
| C28 | 0 | 0 | 0 | 0 | 0 | 0 | 0 | 0 | 0 | 0 | 0 | 0 | 0 | 0 | 0 | 0 | 0 | 0 | 2 | 2 | 2 | 2 | 2 | 2 | 2 | 2 | 2 | 0 | 2 | 2 |
| C29 | 3 | 3 | 3 | 3 | 3 | 3 | 3 | 3 | 4 | 3 | 3 | 3 | 4 | 4 | 4 | 1 | 3 | 3 | 4 | 4 | 4 | 4 | 4 | 4 | 4 | 4 | 4 | 4 | 0 | 4 |
| C30 | 2 | 2 | 2 | 2 | 2 | 4 | 2 | 2 | 4 | 2 | 4 | 2 | 4 | 4 | 4 | 4 | 4 | 4 | 4 | 4 | 4 | 4 | 4 | 4 | 4 | 4 | 4 | 4 | 4 | 0 |
| C1 | C2 | C3 | C4 | C5 | C6 | C7 | C8 | C9 | C10 | C11 | C12 | C13 | C14 | C15 | C16 | C17 | C18 | C19 | C20 | C21 | C22 | C23 | C24 | C25 | C26 | C27 | C28 | C29 | C30 | |
|---|---|---|---|---|---|---|---|---|---|---|---|---|---|---|---|---|---|---|---|---|---|---|---|---|---|---|---|---|---|---|
| C1 | 0.00 | 0.03 | 0.04 | 0.02 | 0.02 | 0.04 | 0.04 | 0.04 | 0.04 | 0.00 | 0.00 | 0.00 | 0.04 | 0.00 | 0.00 | 0.00 | 0.00 | 0.00 | 0.00 | 0.03 | 0.03 | 0.00 | 0.04 | 0.04 | 0.04 | 0.02 | 0.02 | 0.02 | 0.04 | 0.04 |
| C2 | 0.02 | 0.00 | 0.02 | 0.02 | 0.02 | 0.03 | 0.02 | 0.02 | 0.03 | 0.00 | 0.00 | 0.00 | 0.03 | 0.00 | 0.00 | 0.00 | 0.00 | 0.00 | 0.00 | 0.01 | 0.01 | 0.00 | 0.01 | 0.01 | 0.01 | 0.01 | 0.01 | 0.01 | 0.01 | 0.01 |
| C3 | 0.02 | 0.02 | 0.00 | 0.02 | 0.02 | 0.03 | 0.03 | 0.03 | 0.03 | 0.00 | 0.00 | 0.00 | 0.02 | 0.00 | 0.00 | 0.00 | 0.00 | 0.00 | 0.00 | 0.02 | 0.01 | 0.00 | 0.02 | 0.01 | 0.02 | 0.02 | 0.02 | 0.01 | 0.01 | 0.01 |
| C4 | 0.02 | 0.00 | 0.02 | 0.00 | 0.02 | 0.03 | 0.02 | 0.02 | 0.03 | 0.00 | 0.00 | 0.00 | 0.03 | 0.00 | 0.00 | 0.00 | 0.00 | 0.00 | 0.00 | 0.01 | 0.01 | 0.00 | 0.01 | 0.01 | 0.01 | 0.01 | 0.01 | 0.01 | 0.01 | 0.01 |
| C5 | 0.03 | 0.03 | 0.03 | 0.03 | 0.00 | 0.03 | 0.03 | 0.03 | 0.03 | 0.00 | 0.00 | 0.00 | 0.02 | 0.00 | 0.00 | 0.00 | 0.00 | 0.00 | 0.00 | 0.02 | 0.01 | 0.00 | 0.02 | 0.01 | 0.02 | 0.02 | 0.02 | 0.01 | 0.01 | 0.02 |
| C6 | 0.01 | 0.01 | 0.02 | 0.01 | 0.01 | 0.00 | 0.01 | 0.01 | 0.03 | 0.00 | 0.00 | 0.00 | 0.03 | 0.00 | 0.00 | 0.00 | 0.00 | 0.00 | 0.01 | 0.04 | 0.04 | 0.04 | 0.04 | 0.04 | 0.04 | 0.04 | 0.04 | 0.04 | 0.04 | 0.04 |
| C7 | 0.02 | 0.02 | 0.00 | 0.02 | 0.02 | 0.03 | 0.00 | 0.03 | 0.03 | 0.00 | 0.00 | 0.00 | 0.02 | 0.00 | 0.00 | 0.00 | 0.00 | 0.00 | 0.00 | 0.02 | 0.01 | 0.00 | 0.02 | 0.01 | 0.02 | 0.02 | 0.02 | 0.01 | 0.01 | 0.01 |
| C8 | 0.02 | 0.01 | 0.02 | 0.01 | 0.01 | 0.02 | 0.02 | 0.00 | 0.02 | 0.00 | 0.00 | 0.00 | 0.02 | 0.00 | 0.00 | 0.00 | 0.00 | 0.00 | 0.01 | 0.01 | 0.01 | 0.01 | 0.02 | 0.01 | 0.01 | 0.01 | 0.01 | 0.01 | 0.01 | 0.01 |
| C9 | 0.01 | 0.01 | 0.02 | 0.01 | 0.01 | 0.01 | 0.01 | 0.01 | 0.00 | 0.00 | 0.00 | 0.00 | 0.03 | 0.00 | 0.00 | 0.00 | 0.00 | 0.00 | 0.01 | 0.04 | 0.04 | 0.04 | 0.04 | 0.04 | 0.04 | 0.04 | 0.04 | 0.04 | 0.04 | 0.04 |
| C10 | 0.00 | 0.00 | 0.00 | 0.00 | 0.00 | 0.00 | 0.00 | 0.00 | 0.00 | 0.00 | 0.00 | 0.04 | 0.00 | 0.02 | 0.01 | 0.00 | 0.00 | 0.01 | 0.02 | 0.02 | 0.02 | 0.02 | 0.01 | 0.01 | 0.01 | 0.01 | 0.01 | 0.01 | 0.01 | 0.01 |
| C11 | 0.00 | 0.00 | 0.00 | 0.00 | 0.00 | 0.00 | 0.00 | 0.00 | 0.00 | 0.00 | 0.00 | 0.00 | 0.00 | 0.00 | 0.00 | 0.00 | 0.00 | 0.00 | 0.04 | 0.04 | 0.04 | 0.04 | 0.04 | 0.02 | 0.02 | 0.04 | 0.02 | 0.02 | 0.04 | 0.04 |
| C12 | 0.00 | 0.00 | 0.00 | 0.00 | 0.00 | 0.01 | 0.00 | 0.00 | 0.01 | 0.01 | 0.00 | 0.00 | 0.01 | 0.01 | 0.01 | 0.00 | 0.01 | 0.01 | 0.01 | 0.01 | 0.01 | 0.01 | 0.01 | 0.01 | 0.01 | 0.01 | 0.01 | 0.01 | 0.01 | 0.01 |
| C13 | 0.01 | 0.01 | 0.02 | 0.01 | 0.01 | 0.01 | 0.01 | 0.01 | 0.00 | 0.00 | 0.00 | 0.00 | 0.00 | 0.00 | 0.00 | 0.00 | 0.00 | 0.00 | 0.01 | 0.02 | 0.02 | 0.02 | 0.02 | 0.02 | 0.02 | 0.02 | 0.02 | 0.02 | 0.02 | 0.02 |
| C14 | 0.00 | 0.00 | 0.00 | 0.00 | 0.00 | 0.00 | 0.00 | 0.00 | 0.00 | 0.00 | 0.00 | 0.00 | 0.00 | 0.00 | 0.04 | 0.04 | 0.03 | 0.02 | 0.01 | 0.00 | 0.00 | 0.00 | 0.01 | 0.01 | 0.01 | 0.00 | 0.00 | 0.01 | 0.01 | 0.01 |
| C15 | 0.00 | 0.00 | 0.00 | 0.00 | 0.00 | 0.00 | 0.00 | 0.00 | 0.00 | 0.00 | 0.00 | 0.00 | 0.00 | 0.02 | 0.00 | 0.01 | 0.01 | 0.02 | 0.00 | 0.01 | 0.00 | 0.00 | 0.01 | 0.01 | 0.01 | 0.00 | 0.00 | 0.01 | 0.01 | 0.01 |
| C16 | 0.00 | 0.00 | 0.00 | 0.00 | 0.00 | 0.00 | 0.00 | 0.00 | 0.00 | 0.00 | 0.00 | 0.00 | 0.00 | 0.04 | 0.04 | 0.00 | 0.04 | 0.01 | 0.04 | 0.00 | 0.00 | 0.00 | 0.04 | 0.00 | 0.00 | 0.00 | 0.00 | 0.02 | 0.00 | 0.03 |
| C17 | 0.00 | 0.00 | 0.00 | 0.00 | 0.00 | 0.00 | 0.00 | 0.00 | 0.00 | 0.00 | 0.00 | 0.00 | 0.00 | 0.03 | 0.03 | 0.01 | 0.00 | 0.01 | 0.01 | 0.01 | 0.00 | 0.00 | 0.04 | 0.00 | 0.00 | 0.00 | 0.00 | 0.02 | 0.00 | 0.03 |
| C18 | 0.00 | 0.00 | 0.00 | 0.00 | 0.00 | 0.00 | 0.00 | 0.00 | 0.00 | 0.00 | 0.00 | 0.00 | 0.00 | 0.04 | 0.04 | 0.01 | 0.04 | 0.00 | 0.03 | 0.00 | 0.00 | 0.00 | 0.04 | 0.00 | 0.00 | 0.00 | 0.00 | 0.02 | 0.00 | 0.03 |
| C19 | 0.00 | 0.00 | 0.00 | 0.00 | 0.00 | 0.04 | 0.00 | 0.00 | 0.04 | 0.00 | 0.00 | 0.00 | 0.04 | 0.01 | 0.01 | 0.01 | 0.00 | 0.00 | 0.00 | 0.01 | 0.02 | 0.02 | 0.01 | 0.02 | 0.02 | 0.02 | 0.02 | 0.02 | 0.02 | 0.02 |
| C20 | 0.01 | 0.01 | 0.01 | 0.01 | 0.01 | 0.03 | 0.01 | 0.01 | 0.03 | 0.01 | 0.01 | 0.01 | 0.03 | 0.02 | 0.02 | 0.01 | 0.00 | 0.00 | 0.01 | 0.00 | 0.01 | 0.01 | 0.01 | 0.01 | 0.01 | 0.01 | 0.01 | 0.01 | 0.01 | 0.01 |
| C21 | 0.00 | 0.00 | 0.00 | 0.00 | 0.00 | 0.01 | 0.00 | 0.00 | 0.01 | 0.00 | 0.00 | 0.00 | 0.01 | 0.00 | 0.00 | 0.00 | 0.00 | 0.00 | 0.01 | 0.01 | 0.00 | 0.02 | 0.02 | 0.02 | 0.02 | 0.01 | 0.01 | 0.02 | 0.02 | 0.02 |
| C22 | 0.00 | 0.00 | 0.00 | 0.00 | 0.00 | 0.00 | 0.00 | 0.00 | 0.00 | 0.00 | 0.00 | 0.00 | 0.00 | 0.00 | 0.00 | 0.00 | 0.00 | 0.00 | 0.01 | 0.01 | 0.01 | 0.00 | 0.01 | 0.01 | 0.01 | 0.01 | 0.01 | 0.01 | 0.01 | 0.01 |
| C23 | 0.01 | 0.01 | 0.01 | 0.01 | 0.01 | 0.02 | 0.02 | 0.02 | 0.02 | 0.01 | 0.01 | 0.01 | 0.02 | 0.03 | 0.03 | 0.03 | 0.03 | 0.03 | 0.04 | 0.04 | 0.04 | 0.04 | 0.00 | 0.04 | 0.04 | 0.04 | 0.04 | 0.04 | 0.04 | 0.04 |
| C24 | 0.01 | 0.01 | 0.01 | 0.01 | 0.01 | 0.01 | 0.01 | 0.01 | 0.01 | 0.01 | 0.03 | 0.01 | 0.01 | 0.01 | 0.01 | 0.01 | 0.01 | 0.01 | 0.03 | 0.03 | 0.03 | 0.03 | 0.03 | 0.00 | 0.03 | 0.03 | 0.03 | 0.03 | 0.03 | 0.03 |
| C25 | 0.03 | 0.03 | 0.03 | 0.03 | 0.03 | 0.03 | 0.03 | 0.03 | 0.03 | 0.03 | 0.03 | 0.03 | 0.03 | 0.03 | 0.03 | 0.03 | 0.03 | 0.03 | 0.02 | 0.02 | 0.02 | 0.02 | 0.02 | 0.02 | 0.00 | 0.02 | 0.02 | 0.02 | 0.02 | 0.02 |
| C26 | 0.00 | 0.00 | 0.00 | 0.00 | 0.00 | 0.04 | 0.00 | 0.00 | 0.04 | 0.00 | 0.04 | 0.00 | 0.04 | 0.00 | 0.00 | 0.00 | 0.00 | 0.00 | 0.02 | 0.02 | 0.02 | 0.02 | 0.02 | 0.02 | 0.02 | 0.00 | 0.02 | 0.02 | 0.02 | 0.02 |
| C27 | 0.01 | 0.01 | 0.01 | 0.01 | 0.01 | 0.01 | 0.01 | 0.01 | 0.01 | 0.00 | 0.00 | 0.01 | 0.01 | 0.00 | 0.00 | 0.00 | 0.00 | 0.00 | 0.01 | 0.01 | 0.01 | 0.01 | 0.01 | 0.01 | 0.01 | 0.01 | 0.00 | 0.01 | 0.01 | 0.01 |
| C28 | 0.00 | 0.00 | 0.00 | 0.00 | 0.00 | 0.00 | 0.00 | 0.00 | 0.00 | 0.00 | 0.00 | 0.00 | 0.00 | 0.00 | 0.00 | 0.00 | 0.00 | 0.00 | 0.02 | 0.02 | 0.02 | 0.02 | 0.02 | 0.02 | 0.02 | 0.02 | 0.02 | 0.00 | 0.02 | 0.02 |
| C29 | 0.03 | 0.03 | 0.03 | 0.03 | 0.03 | 0.03 | 0.03 | 0.03 | 0.04 | 0.03 | 0.03 | 0.03 | 0.04 | 0.04 | 0.04 | 0.01 | 0.03 | 0.03 | 0.04 | 0.04 | 0.04 | 0.04 | 0.04 | 0.04 | 0.04 | 0.04 | 0.04 | 0.04 | 0.00 | 0.04 |
| C30 | 0.02 | 0.02 | 0.02 | 0.02 | 0.02 | 0.04 | 0.02 | 0.02 | 0.04 | 0.02 | 0.04 | 0.02 | 0.04 | 0.04 | 0.04 | 0.04 | 0.04 | 0.04 | 0.04 | 0.04 | 0.04 | 0.04 | 0.04 | 0.04 | 0.04 | 0.04 | 0.04 | 0.04 | 0.04 | 0.00 |
| C1 | C2 | C3 | C4 | C5 | C6 | C7 | C8 | C9 | C10 | C11 | C12 | C13 | C14 | C15 | C16 | C17 | C18 | C19 | C20 | C21 | C22 | C23 | C24 | C25 | C26 | C27 | C28 | C29 | C30 | |
|---|---|---|---|---|---|---|---|---|---|---|---|---|---|---|---|---|---|---|---|---|---|---|---|---|---|---|---|---|---|---|
| C1 | 37 | 19 | −16 | −29 | −19 | −15 | 21 | 32 | −5 | 14 | 39 | −50 | −20 | −3 | −14 | −1 | −12 | −1 | 2 | −5 | 36 | −15 | 9 | 0 | −7 | −15 | −108 | −51 | 20 | 4 |
| C2 | −9 | 45 | 6 | 7 | 5 | 0 | −22 | −33 | −4 | 7 | 12 | 3 | 10 | 8 | 12 | −8 | −7 | 7 | −6 | 9 | 10 | 7 | −12 | −1 | −6 | 1 | −23 | 1 | 6 | 1 |
| C3 | −14 | −7 | 46 | −6 | −4 | 6 | −11 | −16 | 10 | 7 | 26 | 3 | 10 | 19 | 35 | 10 | −25 | −8 | −17 | 49 | −10 | 4 | −11 | −13 | −3 | 14 | −23 | −28 | 4 | −15 |
| C4 | 0 | −50 | 0 | 50 | 0 | 0 | 0 | 0 | 0 | 0 | 0 | 0 | 0 | 0 | 0 | 0 | 0 | 0 | 0 | 0 | 0 | 0 | 0 | 0 | 0 | 0 | 0 | 0 | 0 | 0 |
| C5 | −5 | −2 | 17 | 4 | 36 | 2 | −12 | −18 | 14 | 29 | 84 | −23 | 14 | 36 | 58 | 9 | −59 | −9 | −45 | 97 | 13 | −2 | −21 | −27 | −21 | 15 | −138 | −95 | 21 | −14 |
| C6 | 0 | 0 | 1 | −1 | −1 | 25 | 1 | 2 | 0 | 2 | 11 | −17 | −22 | 6 | 11 | 6 | −10 | −5 | −26 | 28 | −1 | −2 | 2 | −3 | −4 | −1 | −24 | −14 | 3 | −4 |
| C7 | 0 | 0 | −33 | 0 | 0 | 0 | 33 | 0 | 0 | 0 | 0 | 0 | 0 | 0 | 0 | 0 | 0 | 0 | 0 | 0 | 0 | 0 | 0 | 0 | 0 | 0 | 0 | 0 | 0 | 0 |
| C8 | −10 | −5 | −32 | −18 | −12 | −4 | −23 | 16 | −22 | −57 | −180 | 96 | −42 | −71 | −113 | −28 | 123 | 27 | 111 | −206 | −37 | 47 | 28 | 49 | 41 | −18 | 324 | 206 | −53 | 35 |
| C9 | 0 | 0 | 0 | 0 | 0 | −25 | 0 | 1 | 33 | 1 | 4 | −6 | −7 | 2 | 4 | 2 | −3 | −2 | −9 | 9 | 0 | −1 | 1 | −1 | −1 | 0 | −8 | −5 | 1 | −1 |
| C10 | −9 | −5 | −14 | 3 | 2 | 4 | −16 | −24 | −9 | −32 | −111 | −23 | −17 | −43 | −69 | 39 | 77 | −24 | 88 | −138 | −30 | −3 | 19 | 24 | 22 | −8 | 205 | 137 | −37 | 32 |
| C11 | 21 | 10 | 16 | −12 | −8 | −3 | 44 | 66 | 17 | 65 | 162 | −58 | 22 | 63 | 94 | 1 | −110 | −4 | −97 | 172 | 38 | −36 | −11 | −44 | −41 | 2 | −319 | −200 | 48 | −39 |
| C12 | 1 | 0 | 3 | −4 | −3 | 3 | 7 | 10 | 2 | −15 | 25 | 1 | 10 | 4 | 15 | 2 | −5 | −4 | −22 | 30 | −8 | −23 | 7 | −11 | −13 | 6 | −38 | −24 | 5 | −2 |
| C13 | −12 | −6 | 12 | 4 | 2 | 11 | −21 | −31 | −36 | −12 | −40 | 35 | 54 | −10 | −14 | −6 | 25 | 7 | 30 | −41 | −15 | 15 | −5 | 9 | 10 | 1 | 83 | 50 | −13 | 6 |
| C14 | 2 | 1 | 4 | 1 | 0 | −1 | 2 | 3 | 2 | 7 | 18 | −2 | 2 | 23 | −8 | 11 | −14 | −17 | −5 | 1 | 11 | 6 | −9 | −2 | 1 | 4 | −28 | −25 | 8 | −7 |
| C15 | 19 | 9 | 22 | −7 | −4 | −7 | 34 | 51 | 17 | 61 | 196 | −128 | 28 | 64 | 147 | 8 | −147 | −7 | −95 | 196 | 49 | −12 | −30 | −42 | −37 | 11 | −371 | −227 | 67 | −44 |
| C16 | −21 | −10 | −12 | 9 | 6 | 10 | −40 | −59 | −15 | −56 | −181 | 123 | −15 | −71 | −113 | 23 | 116 | −13 | 95 | −184 | −46 | 16 | 16 | 41 | 38 | −7 | 349 | 207 | −60 | 35 |
| C17 | 3 | 2 | 4 | −3 | −2 | 0 | 8 | 12 | 3 | 12 | 43 | −32 | 8 | 14 | 22 | 9 | −7 | −28 | −33 | 68 | 11 | 3 | −1 | −13 | −14 | 2 | −80 | −48 | 12 | −8 |
| C18 | −1 | 0 | −12 | −1 | 0 | −1 | 0 | 0 | −4 | −13 | −43 | 34 | −16 | −27 | −47 | −60 | 28 | 69 | 7 | −41 | −1 | 14 | 15 | 7 | 4 | 0 | 84 | 47 | −16 | 11 |
| C19 | −20 | −10 | 1 | 10 | 6 | 12 | −39 | −59 | −11 | −44 | −139 | 89 | 2 | −44 | −66 | −17 | 88 | 18 | 88 | −143 | −45 | 3 | 1 | 34 | 34 | −7 | 264 | 160 | −44 | 25 |
| C20 | −6 | −3 | 55 | 3 | 2 | 15 | −12 | −18 | 15 | 41 | 150 | −111 | 79 | 80 | 140 | 81 | −138 | −70 | −63 | 223 | 14 | 0 | −55 | −33 | −28 | 11 | −277 | −172 | 50 | −45 |
| C21 | 4 | 2 | −51 | 1 | 1 | −17 | 4 | 5 | −15 | −46 | −145 | 42 | −79 | −75 | −128 | −27 | 116 | 24 | 78 | −194 | 42 | 14 | 41 | 40 | 37 | −31 | 227 | 170 | −42 | 43 |
| C22 | −2 | −1 | −17 | 4 | 3 | −4 | −8 | −13 | −7 | −26 | −78 | 37 | −30 | −29 | −45 | −7 | 51 | 8 | 43 | −82 | −23 | 80 | 9 | 20 | 19 | −9 | 140 | 84 | −24 | 16 |
| C23 | −6 | −3 | −24 | −1 | −1 | −2 | −7 | −10 | −10 | −32 | −97 | 52 | −25 | −42 | −69 | −15 | 65 | 13 | 48 | −103 | −20 | 13 | 34 | 23 | 19 | −7 | 181 | 104 | −31 | 16 |
| C24 | 12 | 6 | −2 | −5 | −3 | −5 | 23 | 35 | 6 | 24 | 51 | −16 | −9 | 18 | 24 | −1 | −32 | 0 | −29 | 47 | 9 | −38 | 0 | 15 | −18 | −5 | −112 | −72 | 12 | −13 |
| C25 | 0 | 0 | 0 | −1 | −1 | 2 | 2 | 3 | 0 | 2 | 19 | −26 | 0 | −8 | −17 | 16 | 6 | −12 | 11 | −17 | 4 | 8 | 3 | −18 | 23 | 2 | −34 | −19 | −5 | 2 |
| C26 | 16 | 8 | 40 | −15 | −10 | 12 | 41 | 62 | 24 | 86 | 194 | −55 | 64 | 94 | 144 | −2 | −145 | −1 | −161 | 254 | 22 | −68 | −21 | −59 | −53 | 46 | −397 | −252 | 53 | −60 |
| C27 | −15 | −7 | −14 | 10 | 7 | −1 | −34 | −51 | −14 | −51 | −98 | 80 | −21 | −39 | −52 | −22 | 78 | 20 | 61 | −112 | −36 | 10 | 6 | 23 | 15 | −5 | 285 | 125 | −31 | 27 |
| C28 | −2 | −1 | −17 | 4 | 3 | −4 | −8 | −13 | −7 | −26 | −78 | 37 | −30 | −29 | −45 | −7 | 51 | 8 | 43 | −82 | −23 | −20 | 9 | 20 | 19 | −9 | 140 | 134 | −24 | 16 |
| C29 | 12 | 6 | 7 | −4 | −2 | −12 | 20 | 31 | 8 | 30 | 105 | −81 | 12 | 36 | 58 | −4 | −64 | 0 | −41 | 84 | 25 | −12 | −13 | −28 | −30 | 4 | −202 | −122 | 56 | −20 |
| C30 | 4 | 2 | 6 | −3 | −2 | 2 | 9 | 14 | 5 | 17 | 39 | −9 | 7 | 10 | 12 | −3 | −25 | 1 | −34 | 44 | 9 | −9 | −5 | −17 | −18 | 1 | −76 | −57 | 7 | 11 |
References
- Ishaq, H.; Dincer, I.; Crawford, C. A Review on Hydrogen Production and Utilization: Challenges and Opportunities. Int. J. Hydrogen Energy 2022, 47, 26238–26264. [Google Scholar] [CrossRef]
- Buchmayr, A.; Verhofstadt, E.; Van Ootegem, L.; Thomassen, G.; Taelman, S.E.; Dewulf, J. Exploring the Global and Local Social Sustainability of Wind Energy Technologies: An Application of a Social Impact Assessment Framework. Appl. Energy 2022, 312, 118808. [Google Scholar] [CrossRef]
- Cesprini, E.; Greco, R.; Causin, V.; Urso, T.; Cavalli, R.; Zanetti, M. Quality Assessment of Pellets and Briquettes Made from Glued Wood Waste. Eur. J. Wood Wood Prod. 2021, 79, 1153–1162. [Google Scholar] [CrossRef]
- Panagopoulos, A. Water-Energy Nexus: Desalination Technologies and Renewable Energy Sources. Environ. Sci. Pollut. Res. 2021, 28, 21009–21022. [Google Scholar] [CrossRef]
- Dodić, S.N.; Vasiljević, T.Z.; Marić, R.M.; Kosanović, A.J.R.; Dodić, J.M.; Popov, S.D. Possibilities of Application of Waste Wood Biomass as an Energy Source in Vojvodina. Renew. Sustain. Energy Rev. 2012, 16, 2355–2360. [Google Scholar] [CrossRef]
- Berry, T.; Jaccard, M. The Renewable Portfolio Standard. Energy Policy 2001, 29, 263–277. [Google Scholar] [CrossRef]
- Prata, J.C.; Silva, A.L.P.; da Costa, J.P.; Mouneyrac, C.; Walker, T.R.; Duarte, A.C.; Rocha-Santos, T. Solutions and Integrated Strategies for the Control and Mitigation of Plastic and Microplastic Pollution. Int. J. Environ. Res. Public Health 2019, 16, 2411. [Google Scholar] [CrossRef]
- Marchetti, B.; Vitali, M.; Biancini, G. Renewable Energy Proliferation and the New Local Energy Community Paradigm: Analysis of a Case Study in Italy. Energies 2024, 17, 1599. [Google Scholar] [CrossRef]
- Moussa, R.R.; Mahmoud, A.H.A. Energy-Scape Elements: An Approach on Integrating Landscape Elements with Renewable Energy Devices. J. Clean. Prod. 2017, 153, 114–130. [Google Scholar] [CrossRef]
- Stanula, Z.; Wieruszewski, M.; Zydroń, A.; Adamowicz, K. Optimizing Forest-Biomass-Distribution Logistics from a Multi-Level Perspective—Review. Energies 2023, 16, 7997. [Google Scholar] [CrossRef]
- Evans, A.; Strezov, V.; Evans, T.J. Assessment of Sustainability Indicators for Renewable Energy Technologies. Renew. Sustain. Energy Rev. 2009, 13, 1082–1088. [Google Scholar] [CrossRef]
- Liew, W.H.; Hassim, M.H.; Ng, D.K.S. Review of Evolution, Technology and Sustainability Assessments of Biofuel Production. J. Clean. Prod. 2014, 71, 11–29. [Google Scholar] [CrossRef]
- Chicco, G.; Mancarella, P. Distributed Multi-Generation: A Comprehensive View. Renew. Sustain. Energy Rev. 2009, 13, 535–551. [Google Scholar] [CrossRef]
- Cambero, C.; Sowlati, T. Assessment and Optimization of Forest Biomass Supply Chains from Economic, Social and Environmental Perspectives—A Review of Literature. Renew. Sustain. Energy Rev. 2014, 36, 62–73. [Google Scholar] [CrossRef]
- Kiskira, K.; Kalkanis, K.; Coelho, F.; Plakantonaki, S.; D’onofrio, C.; Psomopoulos, C.S.; Priniotakis, G.; Ioannidis, G.C. Life Cycle Assessment of Organic Solar Cells: Structure, Analytical Framework, and Future Product Concepts. Electronics 2025, 14, 2426. [Google Scholar] [CrossRef]
- Strantzali, E.; Aravossis, K. Decision Making in Renewable Energy Investments: A Review. Renew. Sustain. Energy Rev. 2016, 55, 885–898. [Google Scholar] [CrossRef]
- Baumann, M.; Weil, M.; Peters, J.F.; Chibeles-Martins, N.; Moniz, A.B. A Review of Multi-Criteria Decision Making Approaches for Evaluating Energy Storage Systems for Grid Applications. Renew. Sustain. Energy Rev. 2019, 107, 516–534. [Google Scholar] [CrossRef]
- Siwiec, D.; Gajdzik, B.; Gawlik, R.; Wolniak, R.; Pacana, A. Open Eco-Innovations in Sustainable Product Development: Model Framework of Design Thinking in Quality Life Cycle Assessment (DT-QLCA). J. Open Innov. Technol. Mark. Complex. 2025, 11, 100480. [Google Scholar] [CrossRef]
- Siwiec, D.; Pacana, A. Prospective Assessment of Life Cycle, Quality, and Cost for Electric Product Improvement: Supporting Prototyping and Conceptualization by Employing CQ-LCA. Energies 2025, 18, 3038. [Google Scholar] [CrossRef]
- Siwiec, D.; Pacana, A. Eco-Innovation Method for Sustainable Development of Energy-Producing Products Considering Quality and Life Cycle Assessment (QLCA). Energies 2024, 17, 3841. [Google Scholar] [CrossRef]
- Siwiec, D.; Pacana, A. Materials and Products Development Based on a Novelty Approach to Quality and Life Cycle Assessment (QLCA). Materials 2024, 17, 3859. [Google Scholar] [CrossRef] [PubMed]
- Gajdzik, B.; Siwiec, D.; Wolniak, R.; Pacana, A. Approaching Open Innovation in Customization Frameworks for Product Prototypes with Emphasis on Quality and Life Cycle Assessment (QLCA). J. Open Innov. Technol. Mark. Complex. 2024, 10, 100268. [Google Scholar] [CrossRef]
- Siwiec, D.; Gajdzik, B.; Pacana, A.; Wolniak, R. Sustainable Development of Products According to Indicator of Cost, Quality and Life Cycle Assessment CQ-LCA. Environ. Dev. 2025, 55, 101224. [Google Scholar] [CrossRef]
- Wu, W.-W.; Lee, Y.-T. Developing Global Managers’ Competencies Using the Fuzzy DEMATEL Method. Expert. Syst. Appl. 2007, 32, 499–507. [Google Scholar] [CrossRef]
- Bertolini, M.; Esposito, G.; Romagnoli, G. A TOPSIS-Based Approach for the Best Match between Manufacturing Technologies and Product Specifications. Expert. Syst. Appl. 2020, 159, 113610. [Google Scholar] [CrossRef]
- PN-ISO 26000:2012; Wytyczne Dotyczące Społecznej Odpowiedzialności. PKN: Warszawa, Poland, 2012.
- Garvin, D.A. What Does “product Quality” Really Mean? Sloan Manag. Rev. 1984, 25, 25–43. [Google Scholar]
- Hansen, E.; Bush, R.J. Understanding Customer Quality Requirements. Ind. Mark. Manag. 1999, 28, 119–130. [Google Scholar] [CrossRef]
- Güdemann, L.; Münnich, R. Quality and Sensitivity of Composite Indicators for Sustainable Development. Austrian J. Stat. 2023, 52, 82–100. [Google Scholar] [CrossRef]
- Siva, V.; Gremyr, I.; Halldórsson, Á. Organising Sustainability Competencies through Quality Management: Integration or Specialisation. Sustainability 2018, 10, 1326. [Google Scholar] [CrossRef]
- Mu, E.; Pereyra-Rojas, M. Practical Decision Making, 1st ed.; Springer International Publishing: Cham, Switzerland, 2017; Volume 1, ISBN 978-3-319-33860-6. [Google Scholar]
- Alamerew, Y.A.; Kambanou, M.L.; Sakao, T.; Brissaud, D. A Multi-Criteria Evaluation Method of Product-Level Circularity Strategies. Sustainability 2020, 12, 5129. [Google Scholar] [CrossRef]
- Acharya, A.; Glandon, D.; Hammaker, J.; Masset, E. Cost-Effectiveness Analysis and Joint Public Production of Outputs for Development: A Preliminary Framework. J. Dev. Eff. 2023, 15, 17–30. [Google Scholar] [CrossRef]
- Picatoste, A.; Justel, D.; Mendoza, J.M.F. Circularity and Life Cycle Environmental Impact Assessment of Batteries for Electric Vehicles: Industrial Challenges, Best Practices and Research Guidelines. Renew. Sustain. Energy Rev. 2022, 169, 112941. [Google Scholar] [CrossRef]
- Melles, G.; de Vere, I.; Misic, V. Socially Responsible Design: Thinking beyond the Triple Bottom Line to Socially Responsive and Sustainable Product Design. CoDesign 2011, 7, 143–154. [Google Scholar] [CrossRef]
- Kupraszewicz, W.; Zółtowski, B. The Selection of the Experts Team to Diagnose the Condition of the Machines. Diagnostyka 2002, 26, 94–100. [Google Scholar]
- Nemeshaev, S.; Barykin, L.; Dadteev, K. Selection of Experts for Scientific and Technical Expertise Based on Semantic Search. Procedia Comput. Sci. 2021, 190, 643–646. [Google Scholar] [CrossRef]
- Vecchi, M. Groups and Socially Responsible Production: An Experiment with Farmers. J. Econ. Behav. Organ. 2022, 196, 372–392. [Google Scholar] [CrossRef]
- Krueger, R.A. Focus Groups: A Practical Guide for Applied Research; Sage publications: Thousand Oaks, CA, USA, 2014. [Google Scholar]
- Fern, E. The Use of Focus Groups for Idea Generation: The Effects of Group Size, Acquaintanceship, and Moderator on Response Quantity and Quality. J. Mark. Res. 1982, 19, 1–13. [Google Scholar] [CrossRef]
- Nyumba, T.; Wilson, K.; Derrick, C.J.; Mukherjee, N. The Use of Focus Group Discussion Methodology: Insights from Two Decades of Application in Conservation. Methods Ecol. Evol. 2018, 9, 20–32. [Google Scholar] [CrossRef]
- Koo, Y. The Role of Designers in Integrating Societal Value in the Product and Service Development Processes. Int. J. Des. 2016, 10, 49–65. [Google Scholar]
- PUTMAN, V.L.; PAULUS, P.B. Brainstorming, Brainstorming Rules and Decision Making. J. Creat. Behav. 2009, 43, 29–40. [Google Scholar] [CrossRef]
- Gawlik, R. Preliminary Criteria Reduction for the Application of Analytic Hierarchy Process Method. In Evolution and Revolution in the Global Economy: Enhancing Innovation and Competitiveness Worldwide; Fuxman, L., Delener, N., Lu, V., Rivera-Solis, L., Eds.; Global Business and Technology Association: New York, NY, USA, 2008. [Google Scholar]
- Si, S.-L.; You, X.-Y.; Liu, H.-C.; Zhang, P. DEMATEL Technique: A Systematic Review of the State-of-the-Art Literature on Methodologies and Applications. Math. Probl. Eng. 2018, 2018, 1–33. [Google Scholar] [CrossRef]
- Shooshtarian, S.; Gurmu, A.T.; Mahmood, M.N. Application of the DEMATEL Approach to Analyse the Root Causes of Building Defects. Qual. Quant. 2024, 58, 4641–4660. [Google Scholar] [CrossRef]
- Koo, M.; Yang, S.-W. Likert-Type Scale. Encyclopedia 2025, 5, 18. [Google Scholar] [CrossRef]
- Kent, L.; Snider, C.; Gopsill, J.; Hicks, B. Mixed Reality in Design Prototyping: A Systematic Review. Des. Stud. 2021, 77, 101046. [Google Scholar] [CrossRef]
- Joshi, A.; Kale, S.; Chandel, S.; Pal, D. Likert Scale: Explored and Explained. Br. J. Appl. Sci. Technol. 2015, 7, 396–403. [Google Scholar] [CrossRef]
- Kaur, S.; Sehra, S.K.; Sehra, S.S. A Framework for Software Quality Model Selection Using TOPSIS. In Proceedings of the 2016 IEEE International Conference on Recent Trends in Electronics, Information & Communication Technology (RTEICT), Bangalore, India, 20–21 May 2016; pp. 736–739. [Google Scholar]
- Kacprzak, D. Fuzzy Topsis Method for Group Decision Making. Mult. Criteria Decis. Mak. 2018, 13, 116–132. [Google Scholar] [CrossRef]
- Chen, C.-T. Extensions of the TOPSIS for Group Decision-Making under Fuzzy Environment. Fuzzy Sets Syst. 2000, 114, 1–9. [Google Scholar] [CrossRef]
- Wolniak, R. Problems of Use of FMEA Method in Industrial Enterprise. Prod. Eng. Arch. 2019, 23, 12–17. [Google Scholar] [CrossRef]
- Čička, M.; Turisová, R.; Čičková, D. Risk Assessmentuppl Using the PFDA-FMEA Integrated Method. Qual. Innov. Prosper. 2022, 26, 112–134. [Google Scholar] [CrossRef]
- Hameed, A.Z.; Kandasamy, J.; Aravind Raj, S.; Baghdadi, M.A.; Shahzad, M.A. Sustainable Product Development Using FMEA ECQFD TRIZ and Fuzzy TOPSIS. Sustainability 2022, 14, 14345. [Google Scholar] [CrossRef]
- Hassan, A.; Siadat, A.; Dantan, J.-Y.; Martin, P. Conceptual Process Planning—An Improvement Approach Using QFD, FMEA, and ABC Methods. Robot. Comput. Integr. Manuf. 2010, 26, 392–401. [Google Scholar] [CrossRef]
- Shayeghi, H.; Alilou, M. Distributed Generation and Microgrids. In Hybrid Renewable Energy Systems and Microgrids; Elsevier: Amsterdam, The Netherlands, 2021; pp. 73–102. [Google Scholar]
- Muteri, V.; Cellura, M.; Curto, D.; Franzitta, V.; Longo, S.; Mistretta, M.; Parisi, M.L. Review on Life Cycle Assessment of Solar Photovoltaic Panels. Energies 2020, 13, 252. [Google Scholar] [CrossRef]
- Ahmad, N.I.; Ab-Kadir, M.Z.A.; Izadi, M.; Azis, N.; Radzi, M.A.M.; Zaini, N.H.; Nasir, M.S.M. Lightning Protection on Photovoltaic Systems: A Review on Current and Recommended Practices. Renew. Sustain. Energy Rev. 2018, 82, 1611–1619. [Google Scholar] [CrossRef]
- Kakoulaki, G.; Szabo, S.; Fahl, F.F.; Taylor, N.; Gracia-Amillo, A.; Kenny, R.; Ulpiani, G.; Chatzipanagi, A.; Gkoumas, K.; Jäger-Waldau, A. European Transport Infrastructure as a Solar Photovoltaic Energy Hub. Renew. Sustain. Energy Rev. 2024, 196, 114344. [Google Scholar] [CrossRef]
- Ivanova, A.; Chassin, D.; Aguado, J.; Crawford, C.; Djilali, N. Techno-Economic Feasibility of a Photovoltaic-Equipped Plug-in Electric Vehicle Public Parking Lot with Coordinated Charging. IET Energy Syst. Integr. 2020, 2, 261–272. [Google Scholar] [CrossRef]
- Vu, H.; Vu, N.H.; Shin, S. Static Concentrator Photovoltaics Module for Electric Vehicle Applications Based on Compound Parabolic Concentrator. Energies 2022, 15, 6951. [Google Scholar] [CrossRef]
- Arnaoutakis, G.E.; Kocher-Oberlehner, G.; Katsaprakakis, D.A. Criteria-Based Model of Hybrid Photovoltaic–Wind Energy System with Micro-Compressed Air Energy Storage. Mathematics 2023, 11, 391. [Google Scholar] [CrossRef]
- Grant, C.; Garcia, J.; Hicks, A. Environmental Payback Periods of Multi-Crystalline Silicon Photovoltaics in the United States—How Prioritizing Based on Environmental Impact Compares to Solar Intensity. Sustain. Energy Technol. Assess. 2020, 39, 100723. [Google Scholar] [CrossRef]
- Grębosz-Krawczyk, M.; Zakrzewska-Bielawska, A.; Glinka, B.; Glińska-Neweś, A. Why Do Consumers Choose Photovoltaic Panels? Identification of the Factors Influencing Consumers’ Choice Behavior Regarding Photovoltaic Panel Installations. Energies 2021, 14, 2674. [Google Scholar] [CrossRef]
- Zalamea León, E.; Cuevas Barraza, C. Adaptability of Photovoltaic Mono-Polycrystalline Solar Panels and Photovoltaic Roof Tiles on Dwelling Roofs of Real Estate Developments. Rev. Construcción 2019, 18, 42–53. [Google Scholar] [CrossRef]
- Klemeš, J.J.; Varbanov, P.S.; Ocłoń, P.; Chin, H.H. Towards Efficient and Clean Process Integration: Utilisation of Renewable Resources and Energy-Saving Technologies. Energies 2019, 12, 4092. [Google Scholar] [CrossRef]
- Saadé, M.; Erradhouani, B.; Pawlak, S.; Appendino, F.; Peuportier, B.; Roux, C. Combining Circular and LCA Indicators for the Early Design of Urban Projects. Int. J. Life Cycle Assess. 2022, 27, 1–19. [Google Scholar] [CrossRef]

| Study | Aim | Techniques | Originality |
|---|---|---|---|
| [18] | Development of a DT-QLCA model framework supporting eco-innovation in sustainable product design. | Design Thinking (DT), QLCA (Quality Life Cycle Assessment). | An interdisciplinary DT-QLCA framework that integrates quality and sustainability metrics at the early stages of product development to support resource optimisation, reduce environmental impact, and increase customer satisfaction. |
| [19] | Development of a CQ-LCA (Cost–Quality–Life Cycle Assessment) model supporting the creation of alternative product solutions and their assessment in terms of the following: (i) environmental impact in the life cycle (LCA), (ii) quality, and (iii) production and/or purchase costs. | EDAS method (Evaluation Based on Distance from Average Solution), Life Cycle Assessment, the parametric model based on the static method and the cost value function, including the nominal least squares method, morphology analysis. | The novelty is the developed methodology, which provides qualitative and quantitative interpretation of the results, including verbally on a relative state scale and indicatively (CQ-LCA); the originality is the provision of a multi-faceted morphological analysis, after which different scenarios of product solutions are determined depending on quality, LCA, and costs. |
| [20] | Development of an eco-innovative QLCA method that enables the creation of new product solutions that integrate quality (customer satisfaction) and environmental impact assessment throughout the product life cycle. | Entropy method, Life Cycle Assessment, Importance-Performance Analysis (IPA) | A coherent approach and method supporting the development decision-making process from a qualitative and environmental perspective in relation to the life cycle. |
| [21,22] | Weighted Sum Model (WMS), Life Cycle Assessment, Importance-Performance Analysis (IPA). | ||
| [23] | Development of a method for calculating the CQ-LCA (Cost–Quality–Life Cycle Assessment) indicator, which supports the sustainable development of products. | TOPSIS method (Technique for Order Preference by Similarity to an Ideal Solution), Life Cycle Assessment, cost analysis (modified quality-cost analysis), Importance-Performance Analysis (IPA). | The method supports more precise alignment of product development with market requirements by ensuring that the gap between customer preferences and product assessments is reduced, thereby increasing the accuracy of life cycle assessments in real product development scenarios. |
| Criteria | R | C | C − R | C + R | Ranking | Decision |
|---|---|---|---|---|---|---|
| C1 | −0.25 | −151.41 | −151.16 | −151.66 | 27 | effect |
| C2 | 0.00 | 25.48 | 25.48 | 25.47 | 13 | cause |
| C3 | −5.39 | 33.40 | 38.79 | 28.01 | 12 | cause |
| C4 | 0.86 | 0.29 | −0.57 | 1.15 | 14 | effect |
| C5 | 0.65 | −43.20 | −43.85 | −42.55 | 20 | effect |
| C6 | 0.21 | −35.43 | −35.64 | −35.22 | 19 | effect |
| C7 | −1.17 | 0.34 | 1.51 | −0.83 | 15 | effect |
| C8 | −1.91 | 170.22 | 172.13 | 168.31 | 2 | cause |
| C9 | −1.75 | −11.44 | −9.69 | −13.18 | 17 | effect |
| C10 | −7.20 | 38.93 | 46.13 | 31.73 | 10 | cause |
| C11 | −13.64 | −140.81 | −127.17 | −154.44 | 29 | effect |
| C12 | −5.19 | −39.86 | −34.67 | −45.05 | 21 | effect |
| C13 | −9.19 | 91.77 | 100.96 | 82.58 | 6 | cause |
| C14 | −14.77 | −11.94 | 2.82 | −26.71 | 18 | effect |
| C15 | −26.20 | −178.19 | −151.99 | −204.40 | 30 | effect |
| C16 | 8.51 | 180.15 | 171.64 | 188.67 | 1 | cause |
| C17 | 21.17 | −34.17 | −55.35 | −13.00 | 16 | effect |
| C18 | −5.47 | 35.26 | 40.74 | 29.79 | 11 | cause |
| C19 | 21.75 | 145.23 | 123.49 | 166.98 | 4 | cause |
| C20 | −37.95 | −72.82 | −34.86 | −110.77 | 25 | effect |
| C21 | −4.25 | 40.93 | 45.18 | 36.68 | 9 | cause |
| C22 | −1.04 | 107.81 | 108.85 | 106.77 | 5 | cause |
| C23 | 5.50 | 62.70 | 57.20 | 68.20 | 8 | cause |
| C24 | −5.08 | −78.11 | −73.03 | −83.18 | 24 | effect |
| C25 | −11.23 | −56.44 | −45.21 | −67.67 | 23 | effect |
| C26 | −1.34 | −137.49 | −136.15 | −138.83 | 26 | effect |
| C27 | 24.44 | 143.76 | 119.31 | 168.20 | 3 | cause |
| C28 | 16.22 | 57.92 | 41.70 | 74.14 | 7 | cause |
| C29 | −10.58 | −141.45 | −130.87 | −152.03 | 28 | effect |
| C30 | 7.25 | −58.47 | −65.72 | −51.22 | 22 | effect |
| Marked | Criterion 1 | Weight | State 1 | State 2 | State 3 | State 4 | State 5 |
|---|---|---|---|---|---|---|---|
| Quality criteria (technical and aesthetic criteria) | |||||||
| C2 | short circuit current (A) | 4 | 5.44 | 3.11 | 7.70 | 5.55 | 11.95 |
| C3 | maximum output current (A) | 4 | 5.13 | 7.07 | 6.04 | 2.85 | 11.05 |
| C8 | maximum power (W) | 5 | 100 | 140 | 60 | 100 | 200 |
| C10 | weight (kg) | 3 | 6 | 3.3 | 8.5 | 23.5 | 11 |
| C13 | single cell efficiency (%) | 5 | 18 | 23 | 15 | 20 | 25 |
| C16 | colour | 3 | black | grey | graphite | white | black |
| C18 | pattern (texture) | 2 | matte | shiny, mirror-like | ribbed | smooth | semi-matt |
| Environmental criteria | |||||||
| C19 | pollution prevention | 4 | small | small | medium | large | medium |
| C21 | climate change, mitigation, and adaptation | 4 | medium | medium | large | medium | large |
| C22 | environmental protection, biodiversity, and habitat restoration | 3 | small | large | small | średnie | large |
| Social criteria | |||||||
| C23 | fair competition | 4 | large | very large | medium | large | very large |
| C27 | access to basic services | 3 | very large | large | very large | large | medium |
| C28 | community involvement | 5 | medium | large | very large | large | very large |
| Prototype | C2 | C3 | C8 | C10 | C13 | C16 | C18 | C19 | C21 | C22 | C23 | C27 |
|---|---|---|---|---|---|---|---|---|---|---|---|---|
| Normalised decision matrix | ||||||||||||
| P1 | 0.33 | 0.33 | 0.35 | 0.21 | 0.39 | 0.54 | 0.45 | 0.31 | 0.39 | 0.29 | 0.42 | 0.52 |
| P2 | 0.19 | 0.45 | 0.49 | 0.12 | 0.50 | 0.33 | 0.56 | 0.31 | 0.39 | 0.57 | 0.52 | 0.42 |
| P3 | 0.47 | 0.39 | 0.21 | 0.30 | 0.33 | 0.54 | 0.23 | 0.46 | 0.52 | 0.29 | 0.31 | 0.52 |
| P4 | 0.34 | 0.18 | 0.35 | 0.83 | 0.44 | 0.11 | 0.56 | 0.62 | 0.39 | 0.43 | 0.42 | 0.42 |
| P5 | 0.72 | 0.71 | 0.69 | 0.39 | 0.55 | 0.54 | 0.34 | 0.46 | 0.52 | 0.57 | 0.52 | 0.31 |
| Weighted normalised decision matrix | ||||||||||||
| Weight | 0.40 | 0.40 | 0.50 | 0.30 | 0.50 | 0.30 | 0.20 | 0.40 | 0.40 | 0.30 | 0.40 | 0.30 |
| P1 | 0.13 | 0.13 | 0.17 | 0.06 | 0.20 | 0.16 | 0.09 | 0.12 | 0.16 | 0.09 | 0.17 | 0.16 |
| P2 | 0.08 | 0.18 | 0.24 | 0.04 | 0.25 | 0.10 | 0.11 | 0.12 | 0.16 | 0.17 | 0.21 | 0.13 |
| P3 | 0.19 | 0.15 | 0.10 | 0.09 | 0.16 | 0.16 | 0.05 | 0.19 | 0.21 | 0.09 | 0.13 | 0.16 |
| P4 | 0.13 | 0.07 | 0.17 | 0.25 | 0.22 | 0.03 | 0.11 | 0.25 | 0.16 | 0.13 | 0.17 | 0.13 |
| P5 | 0.29 | 0.28 | 0.35 | 0.12 | 0.27 | 0.16 | 0.07 | 0.19 | 0.21 | 0.17 | 0.21 | 0.09 |
| Criteria | C2 | C3 | C8 | C10 | C13 | C16 | C18 | C19 | C21 | C22 | C23 | C27 |
|---|---|---|---|---|---|---|---|---|---|---|---|---|
| a+ | 0.29 | 0.28 | 0.35 | 0.04 | 0.27 | 0.16 | 0.11 | 0.25 | 0.21 | 0.17 | 0.21 | 0.16 |
| a− | 0.08 | 0.07 | 0.10 | 0.25 | 0.16 | 0.03 | 0.05 | 0.12 | 0.16 | 0.09 | 0.13 | 0.09 |
| Perfect positive solutions | ||||||||||||
| P1 | 0.02 | 0.02 | 0.03 | 0.00 | 0.01 | 0.00 | 0.00 | 0.02 | 0.00 | 0.01 | 0.00 | 0.00 |
| P2 | 0.05 | 0.01 | 0.01 | 0.00 | 0.00 | 0.00 | 0.00 | 0.02 | 0.00 | 0.00 | 0.00 | 0.00 |
| P3 | 0.01 | 0.02 | 0.06 | 0.00 | 0.01 | 0.00 | 0.00 | 0.00 | 0.00 | 0.01 | 0.01 | 0.00 |
| P4 | 0.02 | 0.04 | 0.03 | 0.05 | 0.00 | 0.02 | 0.00 | 0.00 | 0.00 | 0.00 | 0.00 | 0.00 |
| P5 | 0.00 | 0.00 | 0.00 | 0.01 | 0.00 | 0.00 | 0.00 | 0.00 | 0.00 | 0.00 | 0.00 | 0.00 |
| Perfect negative solutions | ||||||||||||
| P1 | 0.00 | 0.00 | 0.00 | 0.03 | 0.00 | 0.02 | 0.00 | 0.00 | 0.00 | 0.00 | 0.00 | 0.00 |
| P2 | 0.00 | 0.01 | 0.02 | 0.05 | 0.01 | 0.00 | 0.00 | 0.00 | 0.00 | 0.01 | 0.01 | 0.00 |
| P3 | 0.01 | 0.01 | 0.00 | 0.03 | 0.00 | 0.02 | 0.00 | 0.00 | 0.00 | 0.00 | 0.00 | 0.00 |
| P4 | 0.00 | 0.00 | 0.00 | 0.00 | 0.00 | 0.00 | 0.00 | 0.02 | 0.00 | 0.00 | 0.00 | 0.00 |
| P5 | 0.05 | 0.04 | 0.06 | 0.02 | 0.01 | 0.02 | 0.00 | 0.00 | 0.00 | 0.01 | 0.01 | 0.00 |
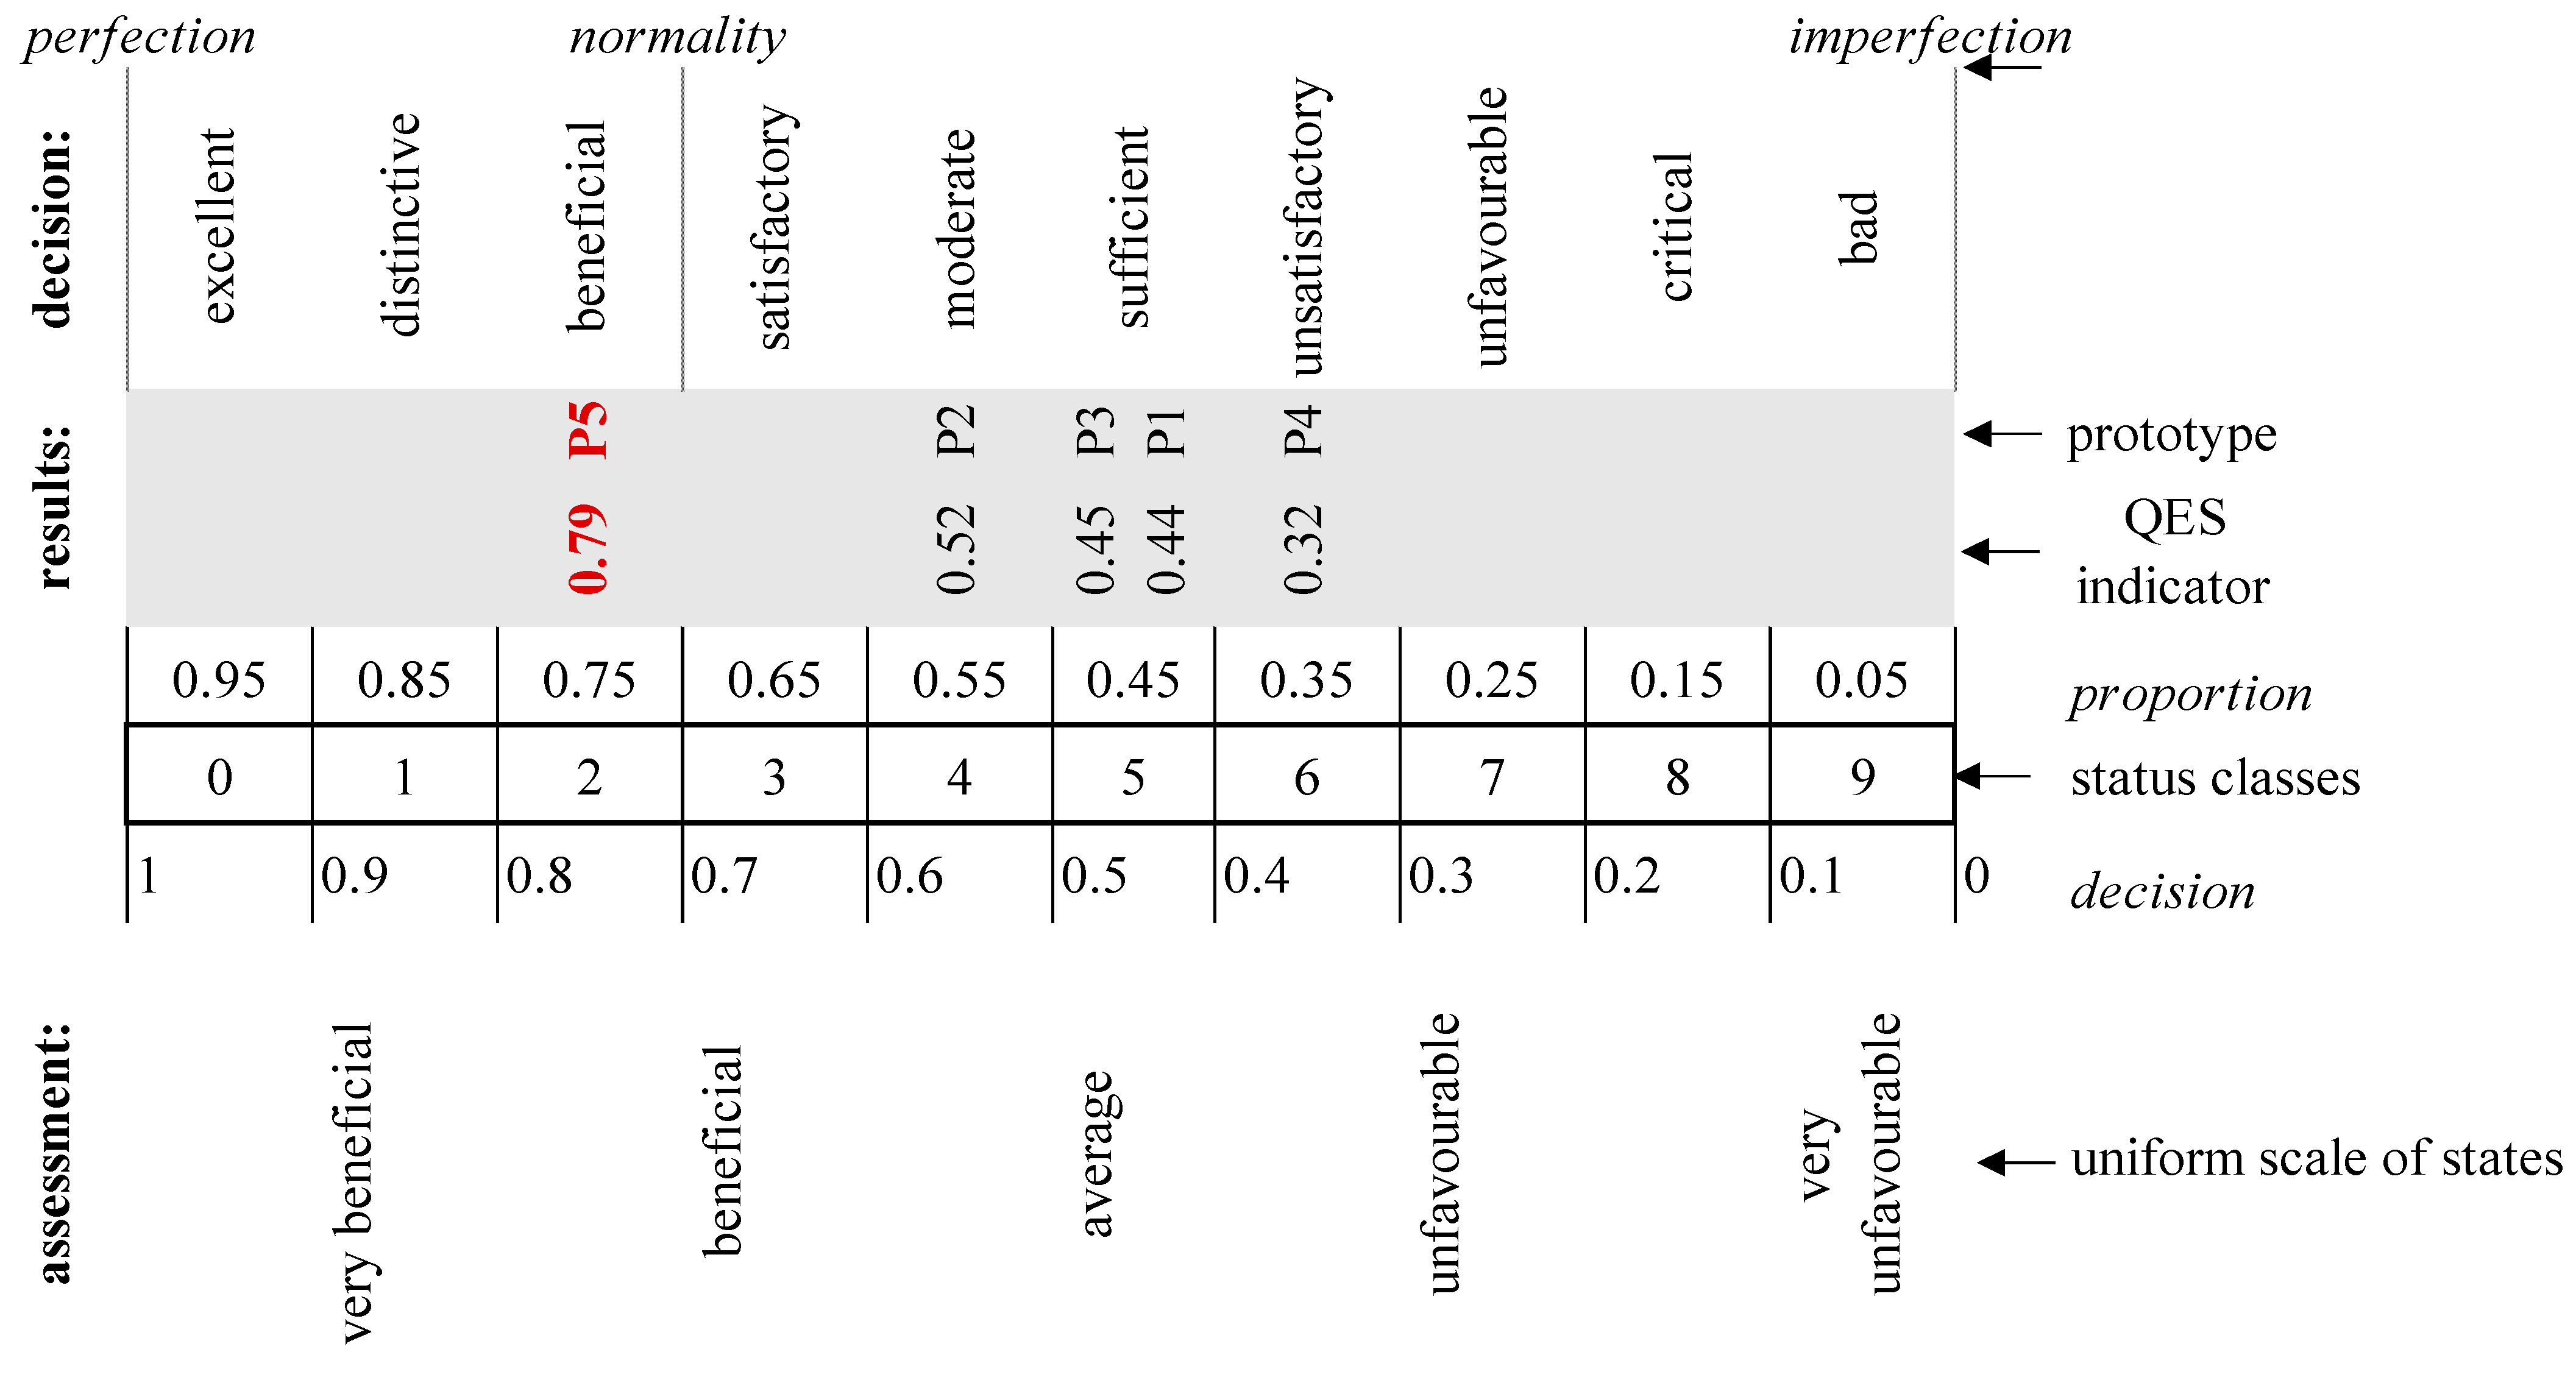
| Indicator | d+ | d− | QES | Ranking | Decision |
|---|---|---|---|---|---|
| P1 | 0.35 | 0.27 | 0.43 | 4 | sufficient |
| P2 | 0.31 | 0.33 | 0.52 | 2 | moderate |
| P3 | 0.35 | 0.29 | 0.45 | 3 | sufficient |
| P4 | 0.42 | 0.20 | 0.32 | 5 | unsatisfactory |
| P5 | 0.13 | 0.48 | 0.79 | 1 | beneficial |
Disclaimer/Publisher’s Note: The statements, opinions and data contained in all publications are solely those of the individual author(s) and contributor(s) and not of MDPI and/or the editor(s). MDPI and/or the editor(s) disclaim responsibility for any injury to people or property resulting from any ideas, methods, instructions or products referred to in the content. |
© 2025 by the authors. Licensee MDPI, Basel, Switzerland. This article is an open access article distributed under the terms and conditions of the Creative Commons Attribution (CC BY) license (https://creativecommons.org/licenses/by/4.0/).
Share and Cite
Siwiec, D.; Pacana, A. QES Model Aggregating Quality, Environmental Impact, and Social Responsibility: Designing Product Dedicated to Renewable Energy Source. Energies 2025, 18, 4029. https://doi.org/10.3390/en18154029
Siwiec D, Pacana A. QES Model Aggregating Quality, Environmental Impact, and Social Responsibility: Designing Product Dedicated to Renewable Energy Source. Energies. 2025; 18(15):4029. https://doi.org/10.3390/en18154029
Chicago/Turabian StyleSiwiec, Dominika, and Andrzej Pacana. 2025. "QES Model Aggregating Quality, Environmental Impact, and Social Responsibility: Designing Product Dedicated to Renewable Energy Source" Energies 18, no. 15: 4029. https://doi.org/10.3390/en18154029
APA StyleSiwiec, D., & Pacana, A. (2025). QES Model Aggregating Quality, Environmental Impact, and Social Responsibility: Designing Product Dedicated to Renewable Energy Source. Energies, 18(15), 4029. https://doi.org/10.3390/en18154029