

A Feasibility Study of a Virtual Power Line Device to Improve Hosting Capacity in Renewable Energy Sources


Abstract
1. Introduction
2. Introduction Models for VPL Device to Improve Hosting Capacity of Renewable Energy Sources
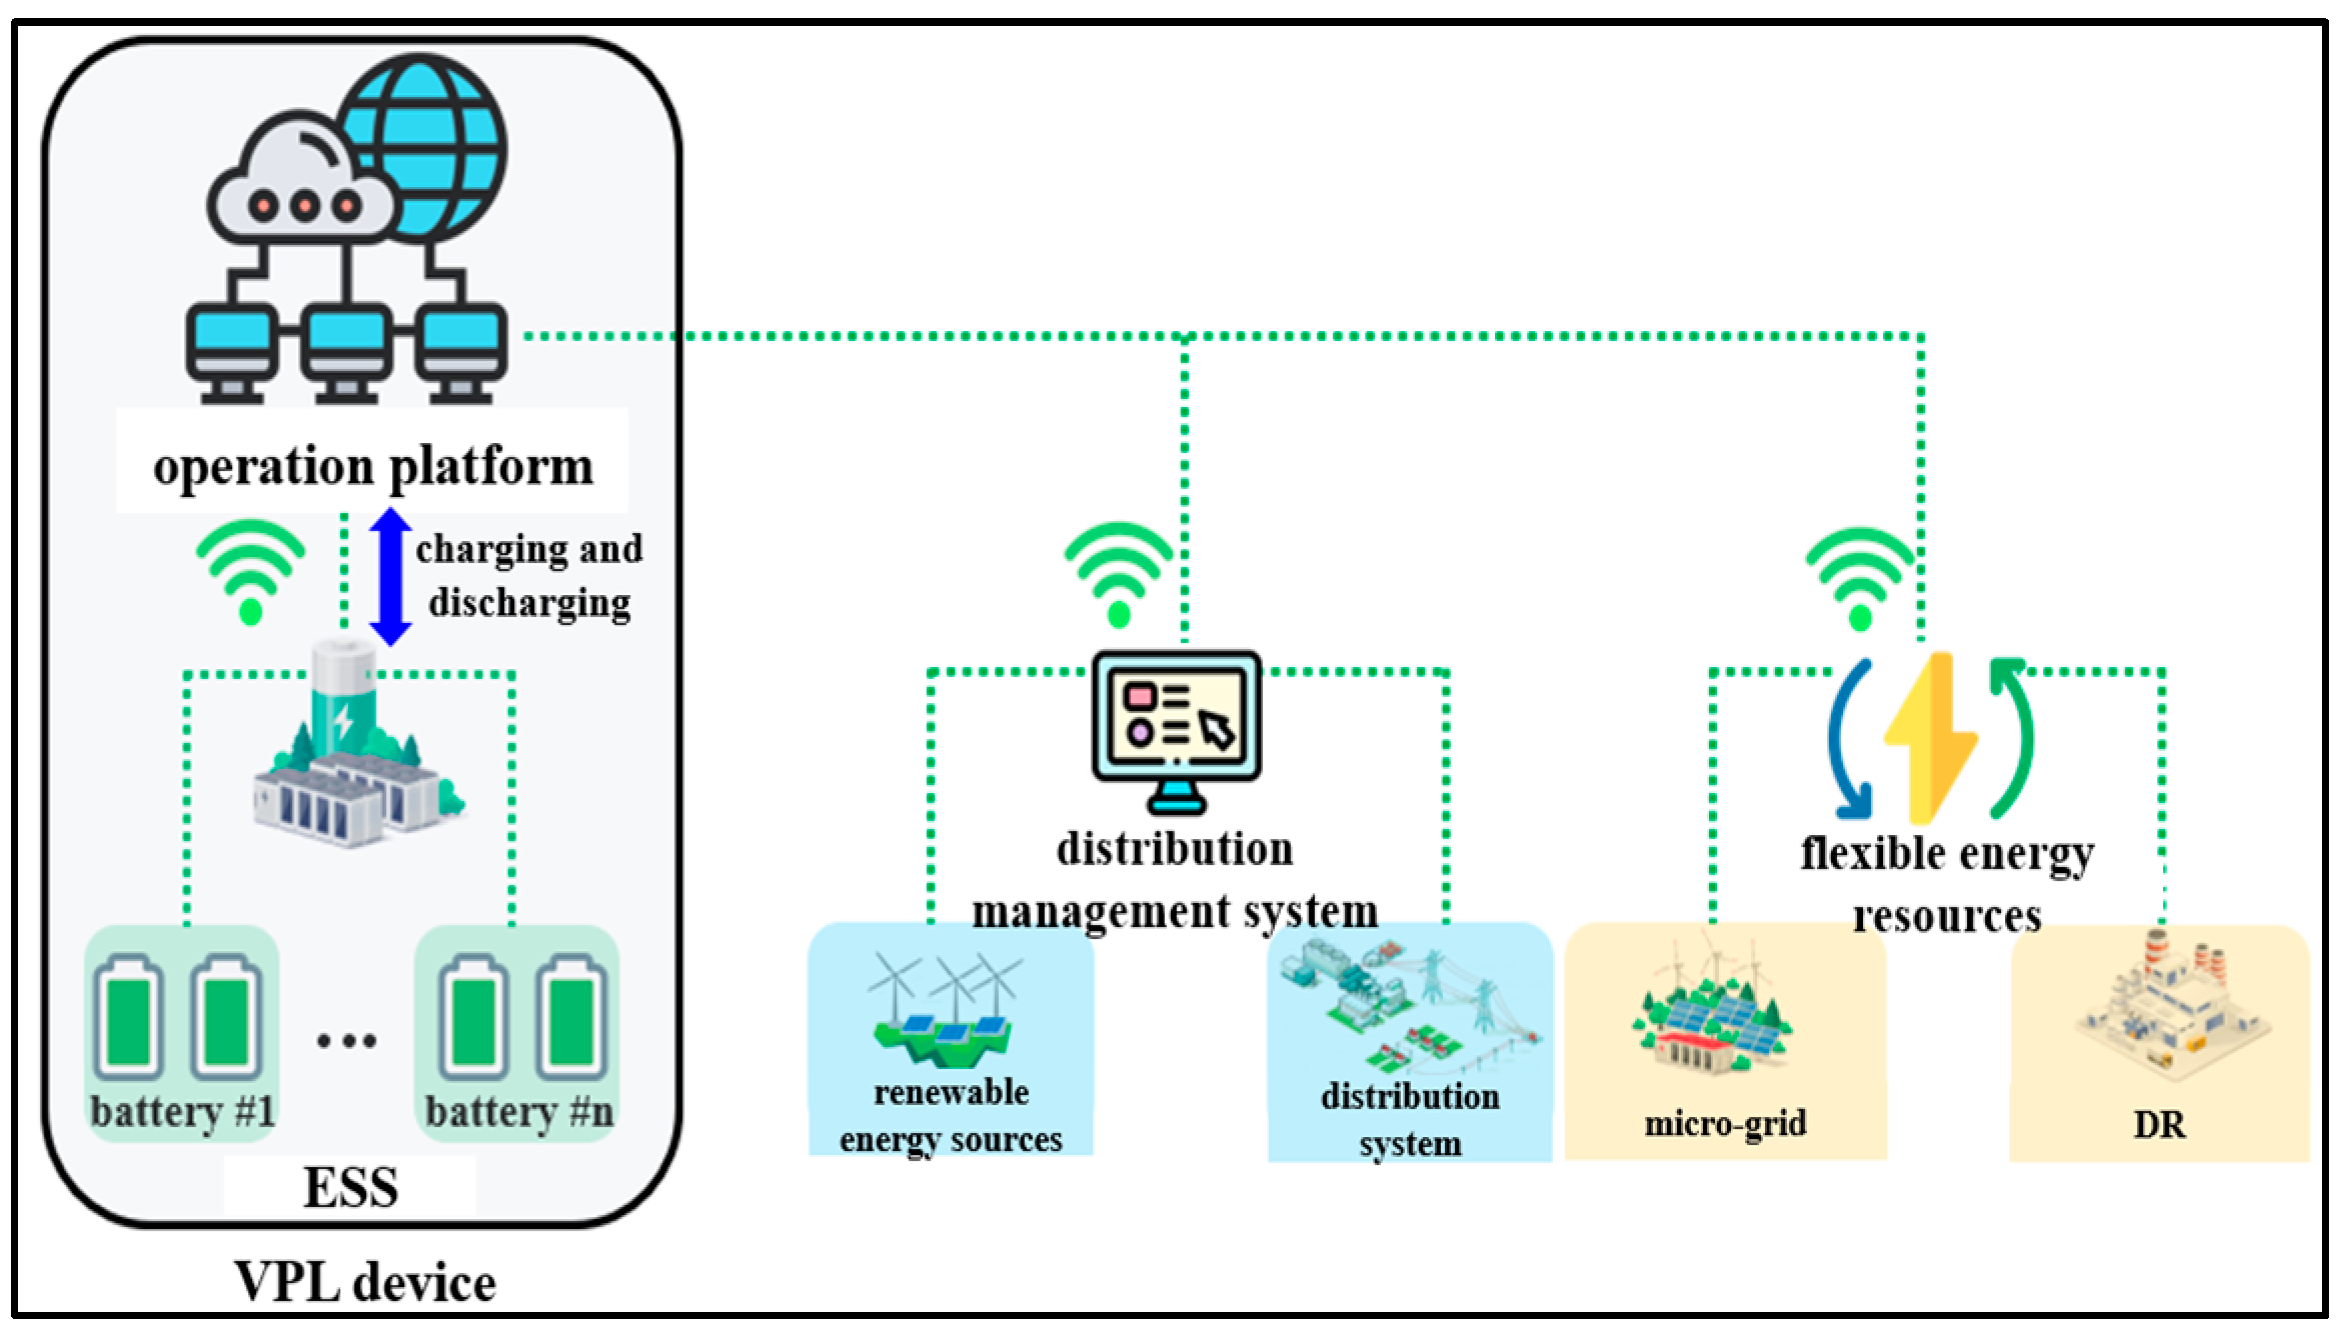
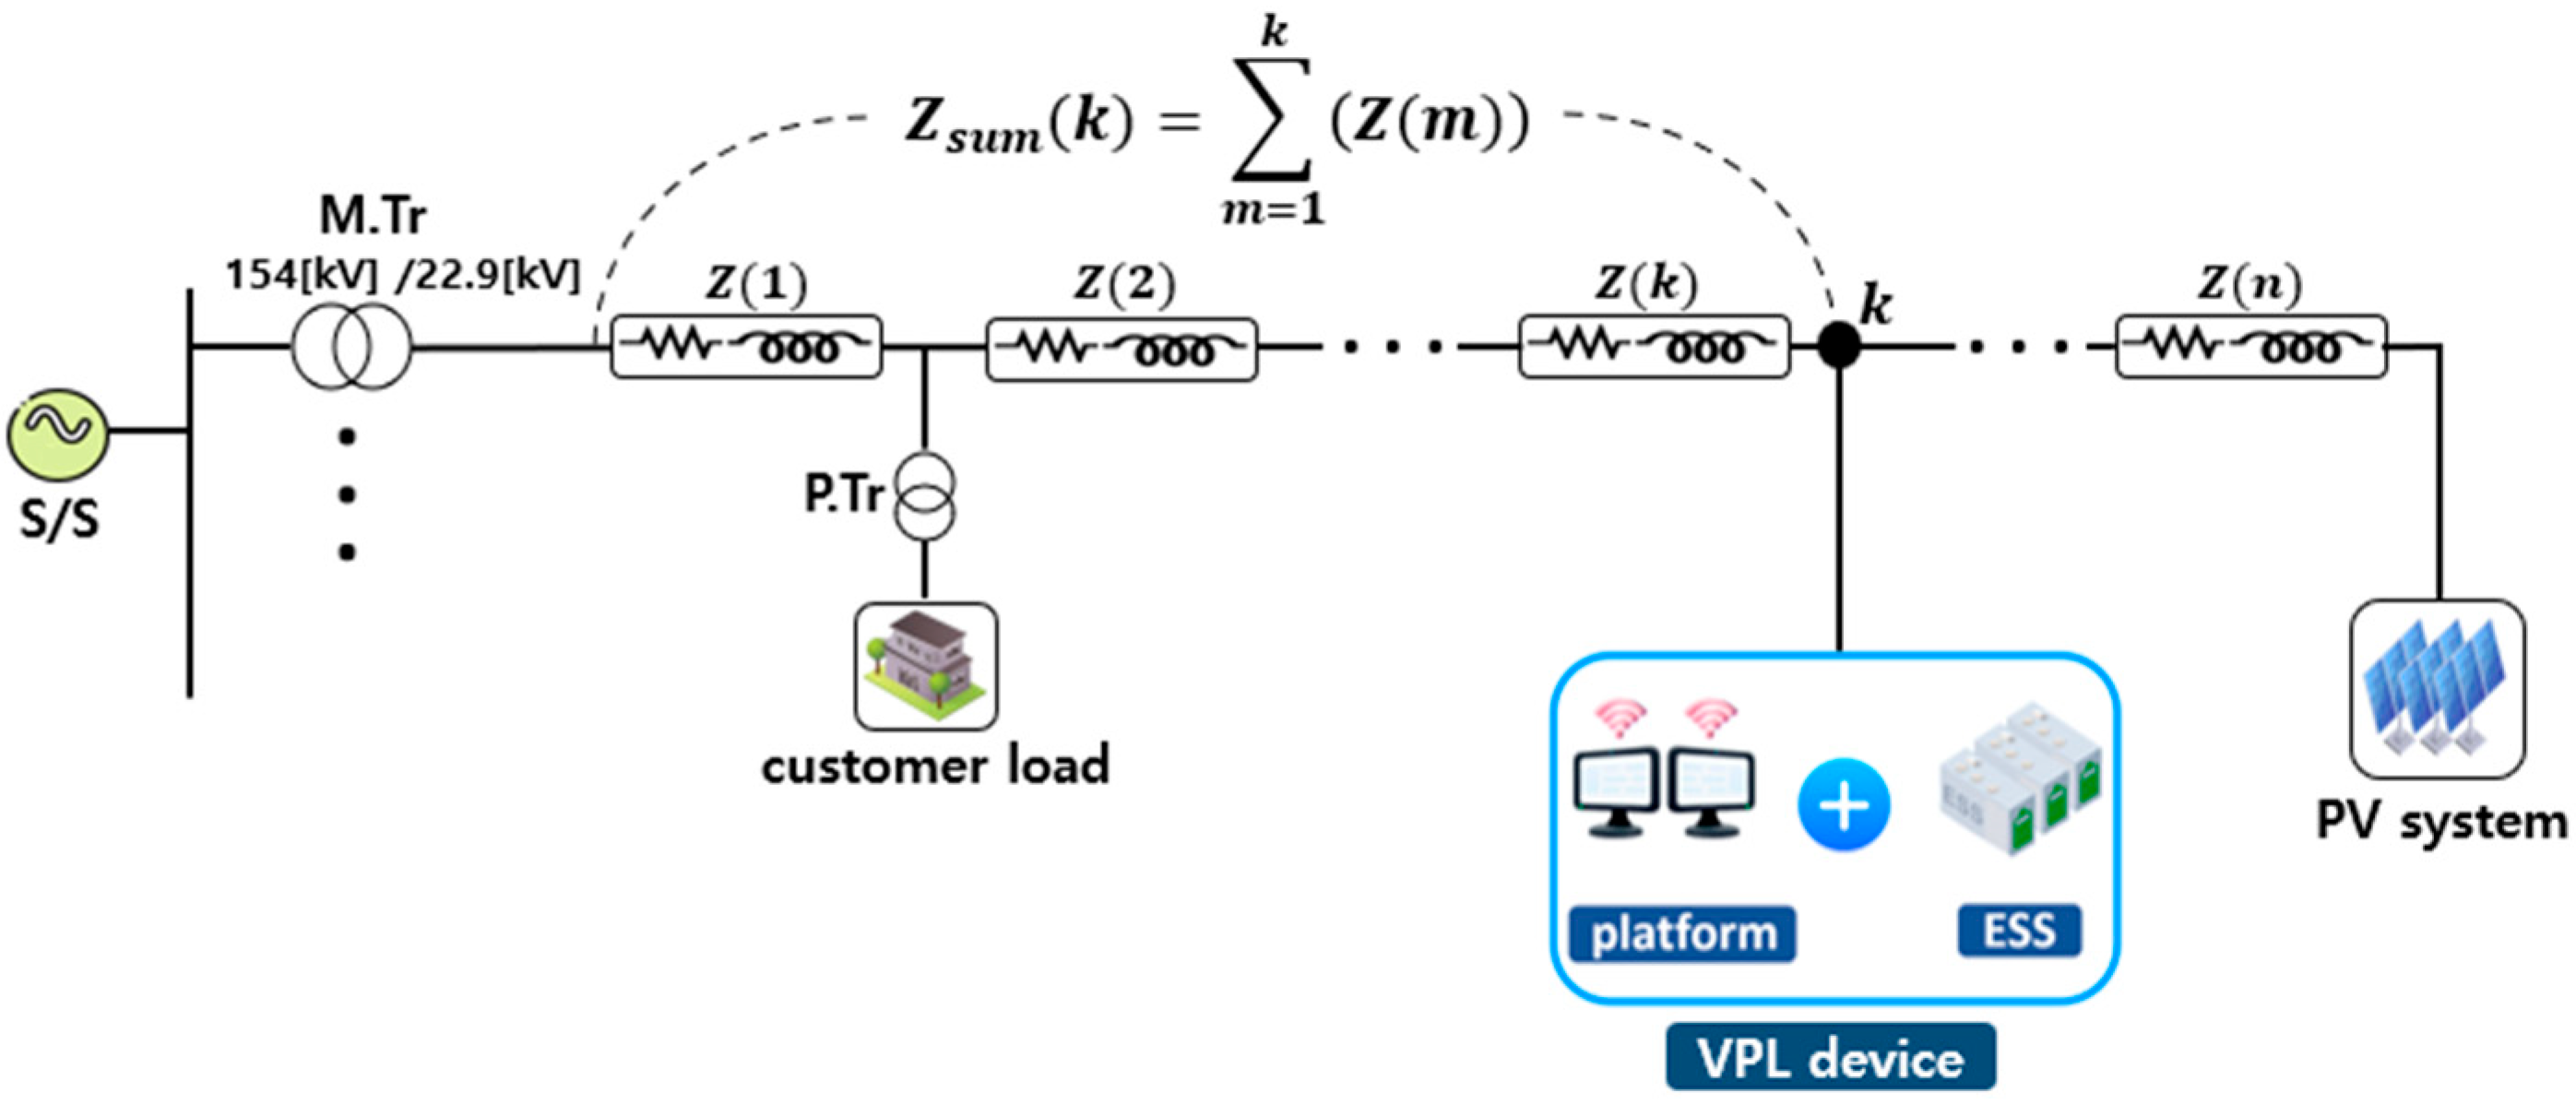
2.1. Configuration of VPL Device
2.2. Introduction Models of VPL Device
2.2.1. Classification of Introduction Model
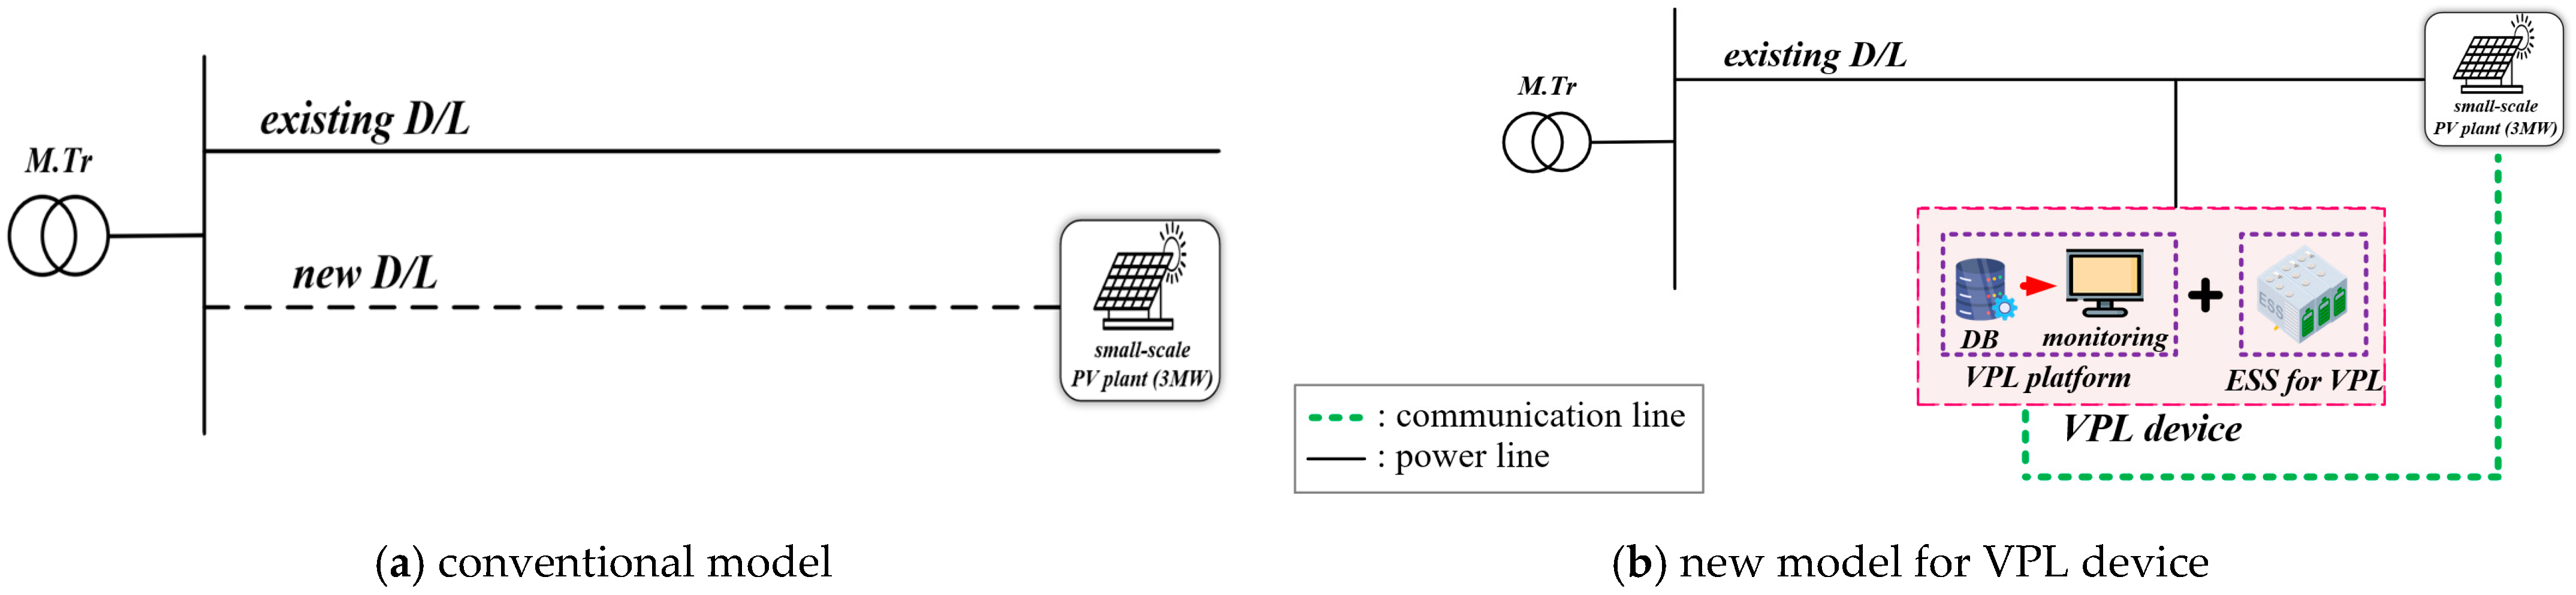
2.2.2. Small-Scale Model in VPL Device
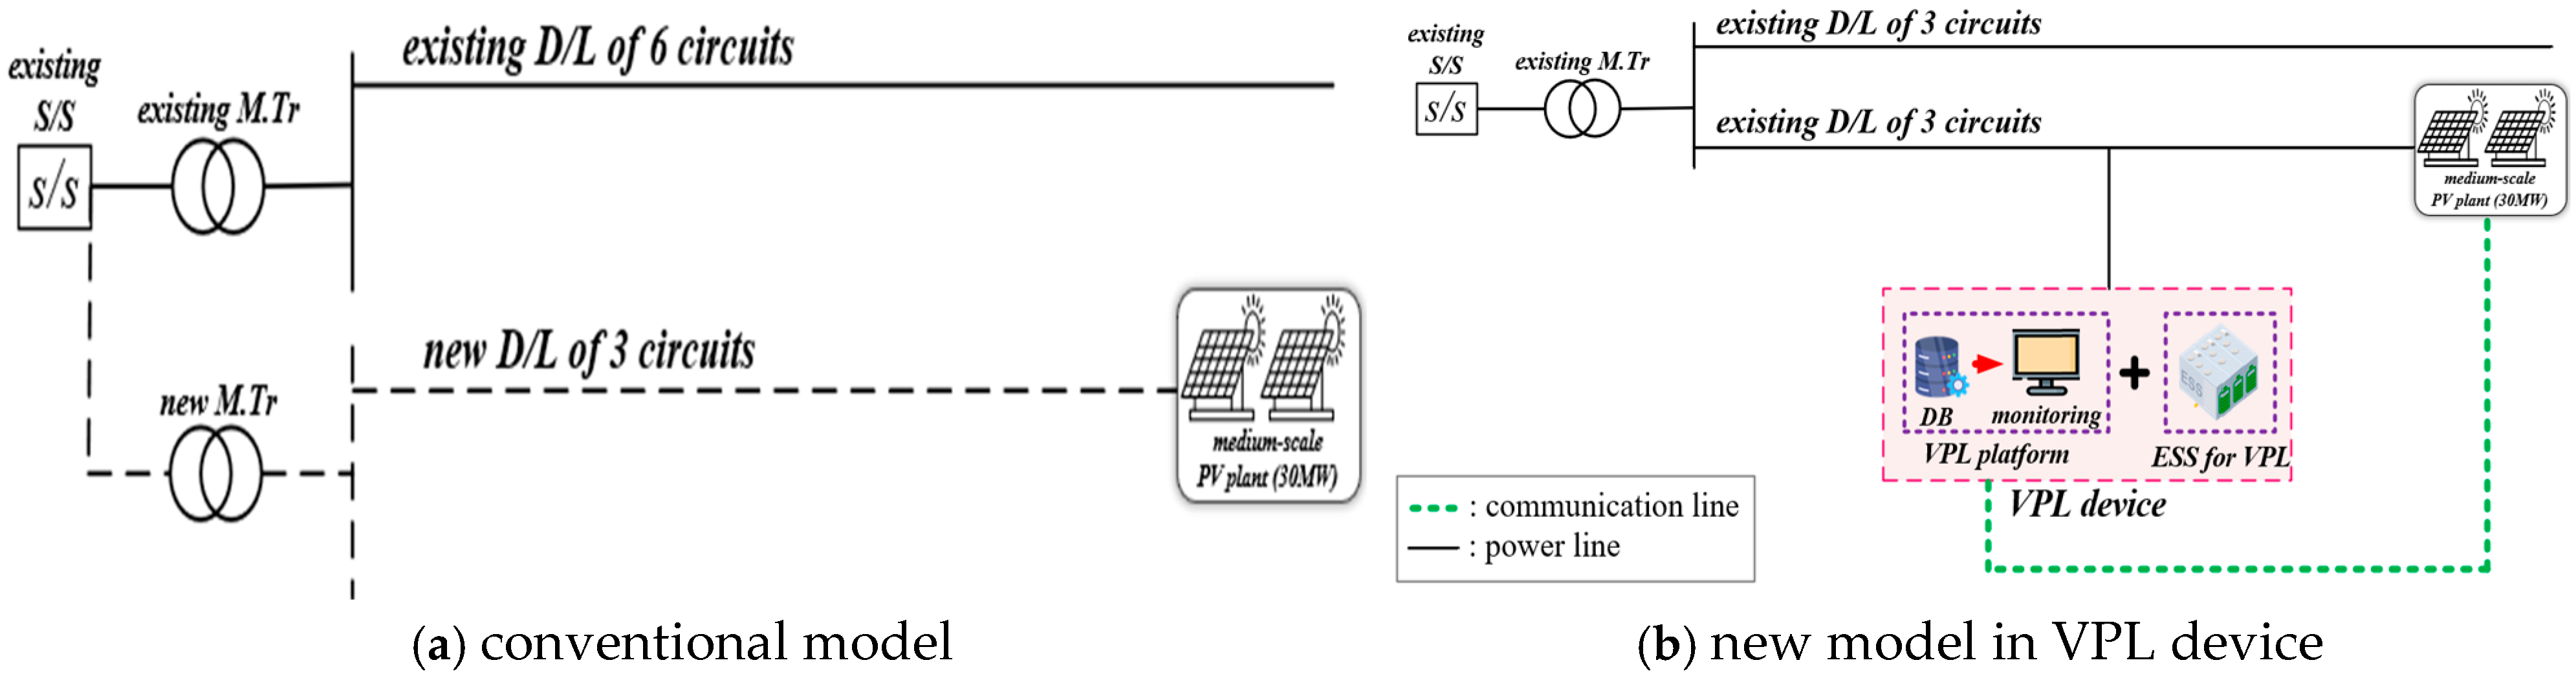
2.2.3. Medium-Scale Model in VPL Device
2.2.4. Large-Scale Model in VPL Device
3. Evaluation Algorithm of Optimal Capacity in VPL Device
4. Economic Evaluation Method of VPL Device
4.1. Cost Elecments
4.2. Benefit Elements
4.2.1. Improvement Benefit of Hosting Capacity for Renewable Energy Sources
4.2.2. Deferred Investment Benefit in Power System Infrastructure
4.3. Present Worth Method
5. Simulation Results and Analysis
5.1. Estimation of Optimal Capacity in VPL Device
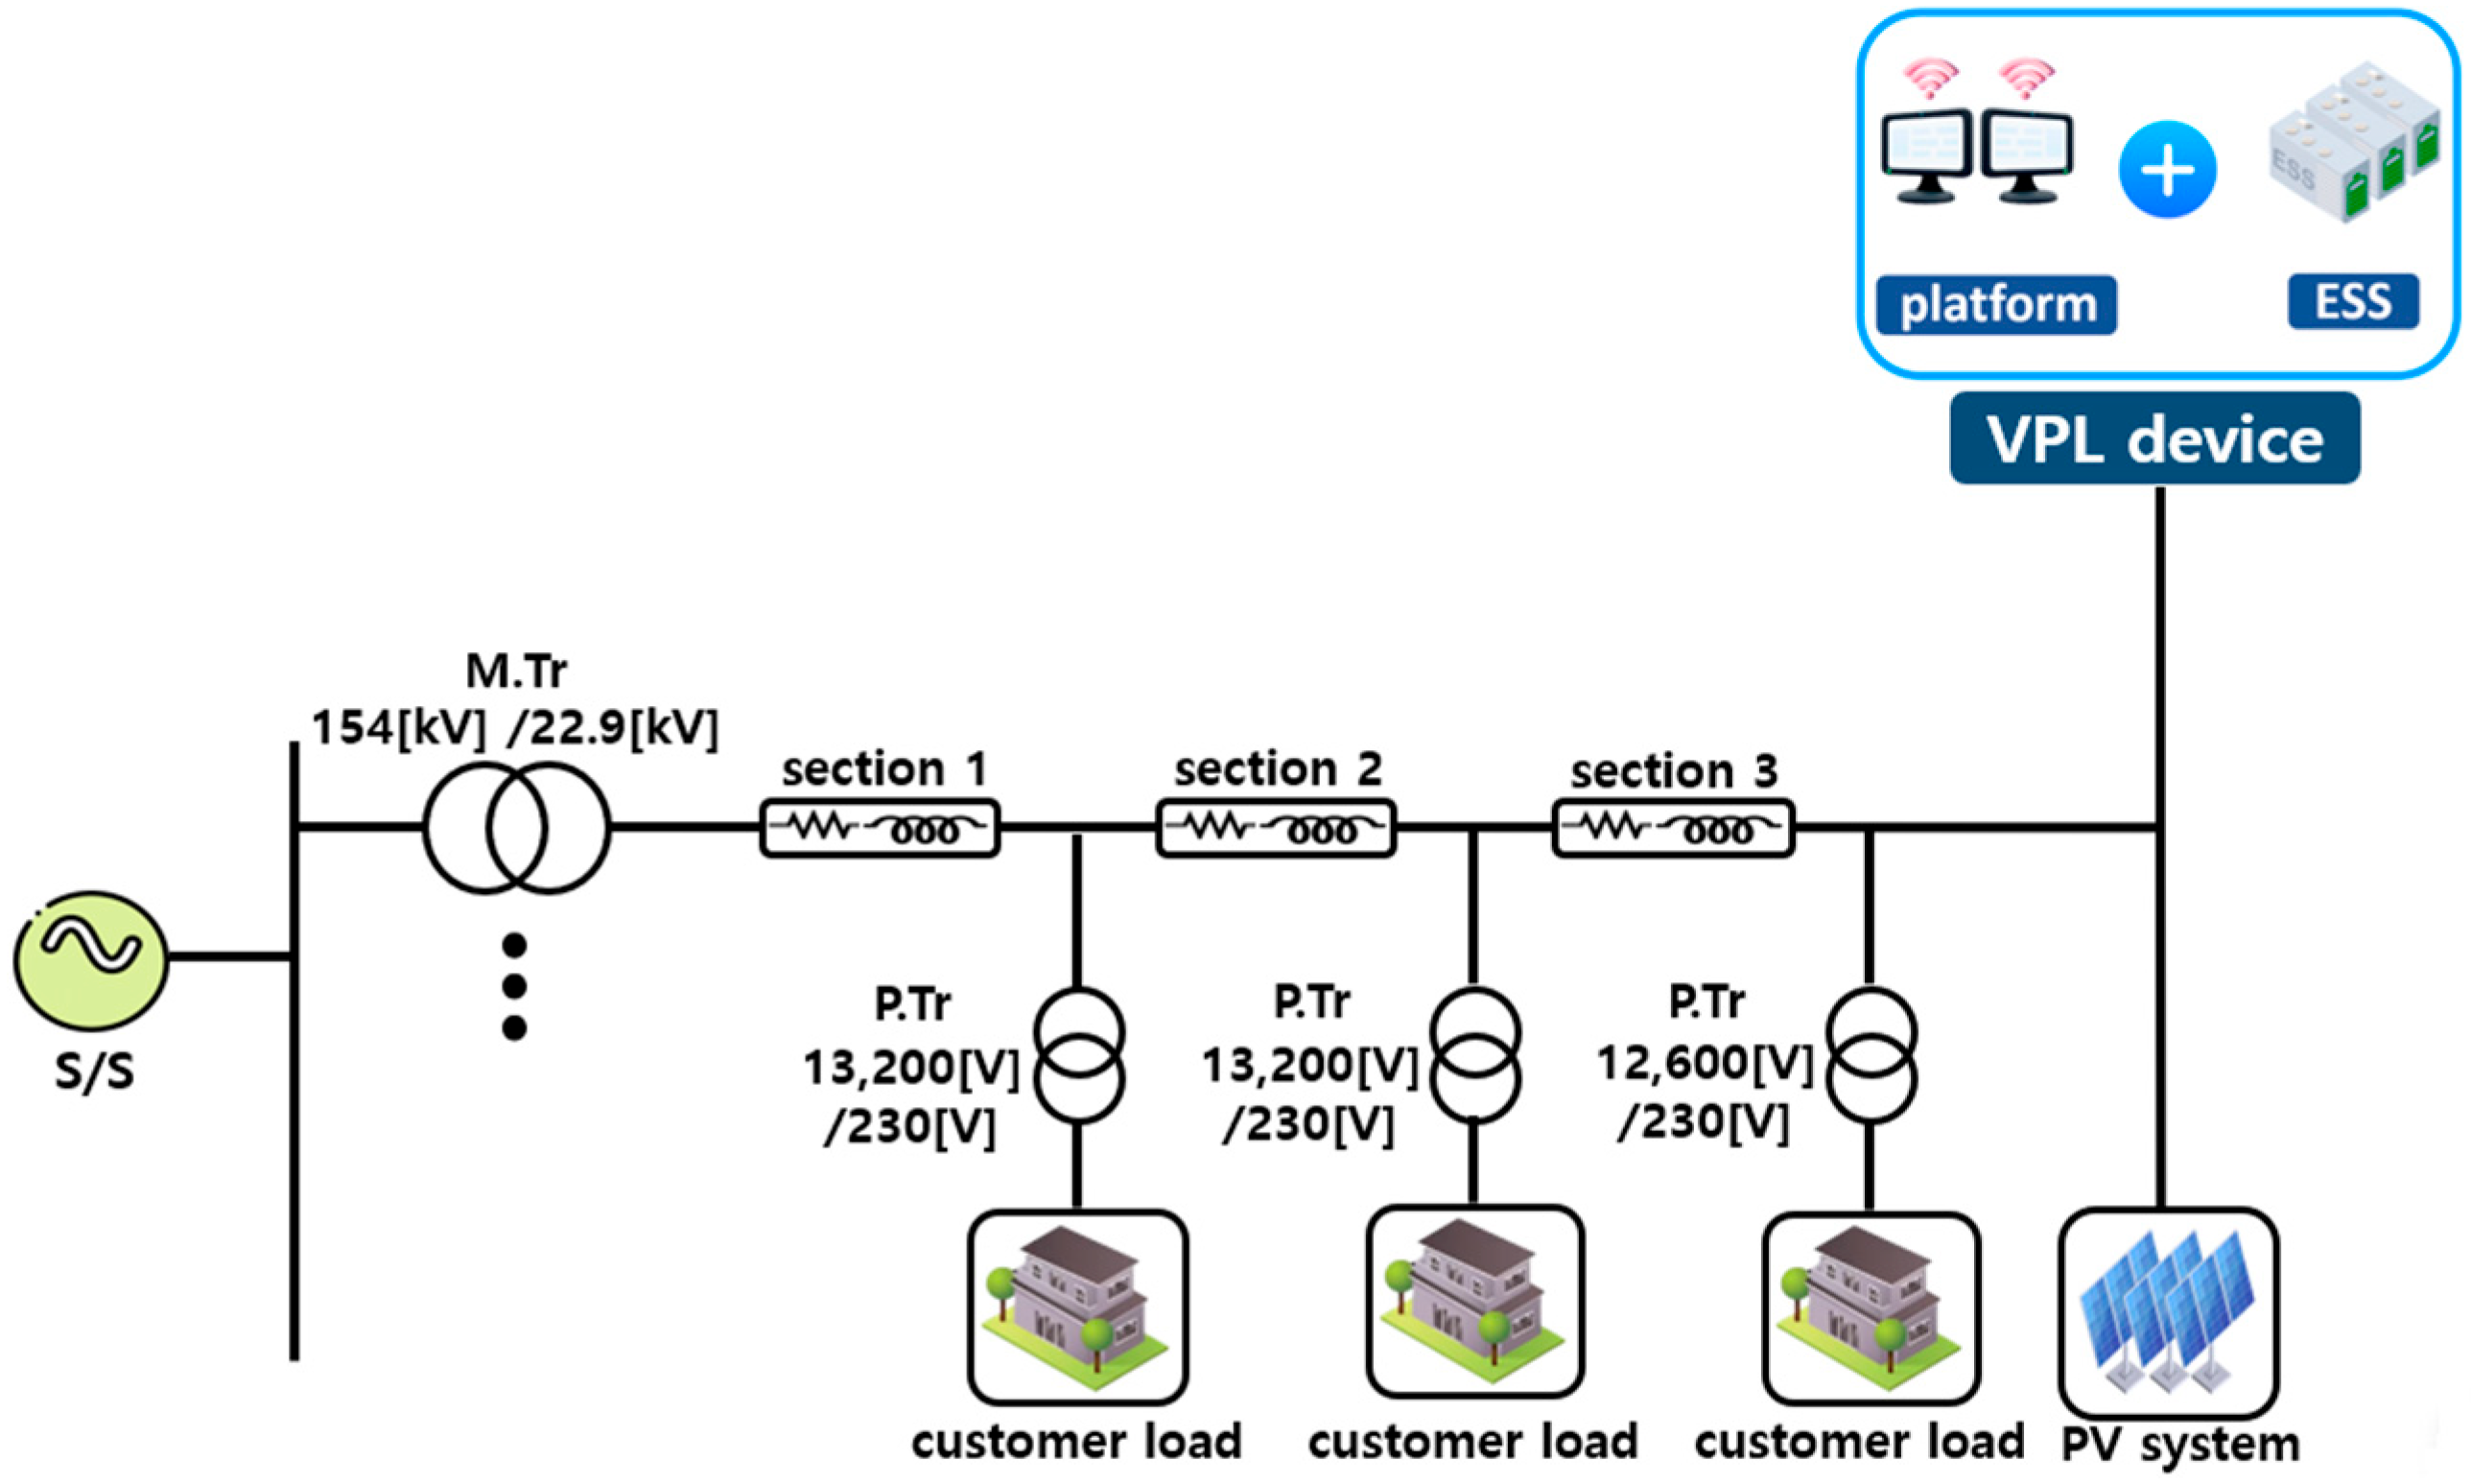
5.1.1. Simulation Conditions of Estimation
5.1.2. Calculation of Optimal Capacity in VPL Device
5.2. Economic Evaluation in VPL Device
5.2.1. Simulation Conditions
5.2.2. ROI Characteristics of Small-Scale Model
5.2.3. ROI Characteristics of Medium-Scale Model
5.2.4. ROI Characteristics of Large-Scale Model
5.2.5. Comprehensive Analysis
6. Conclusions
- (1)
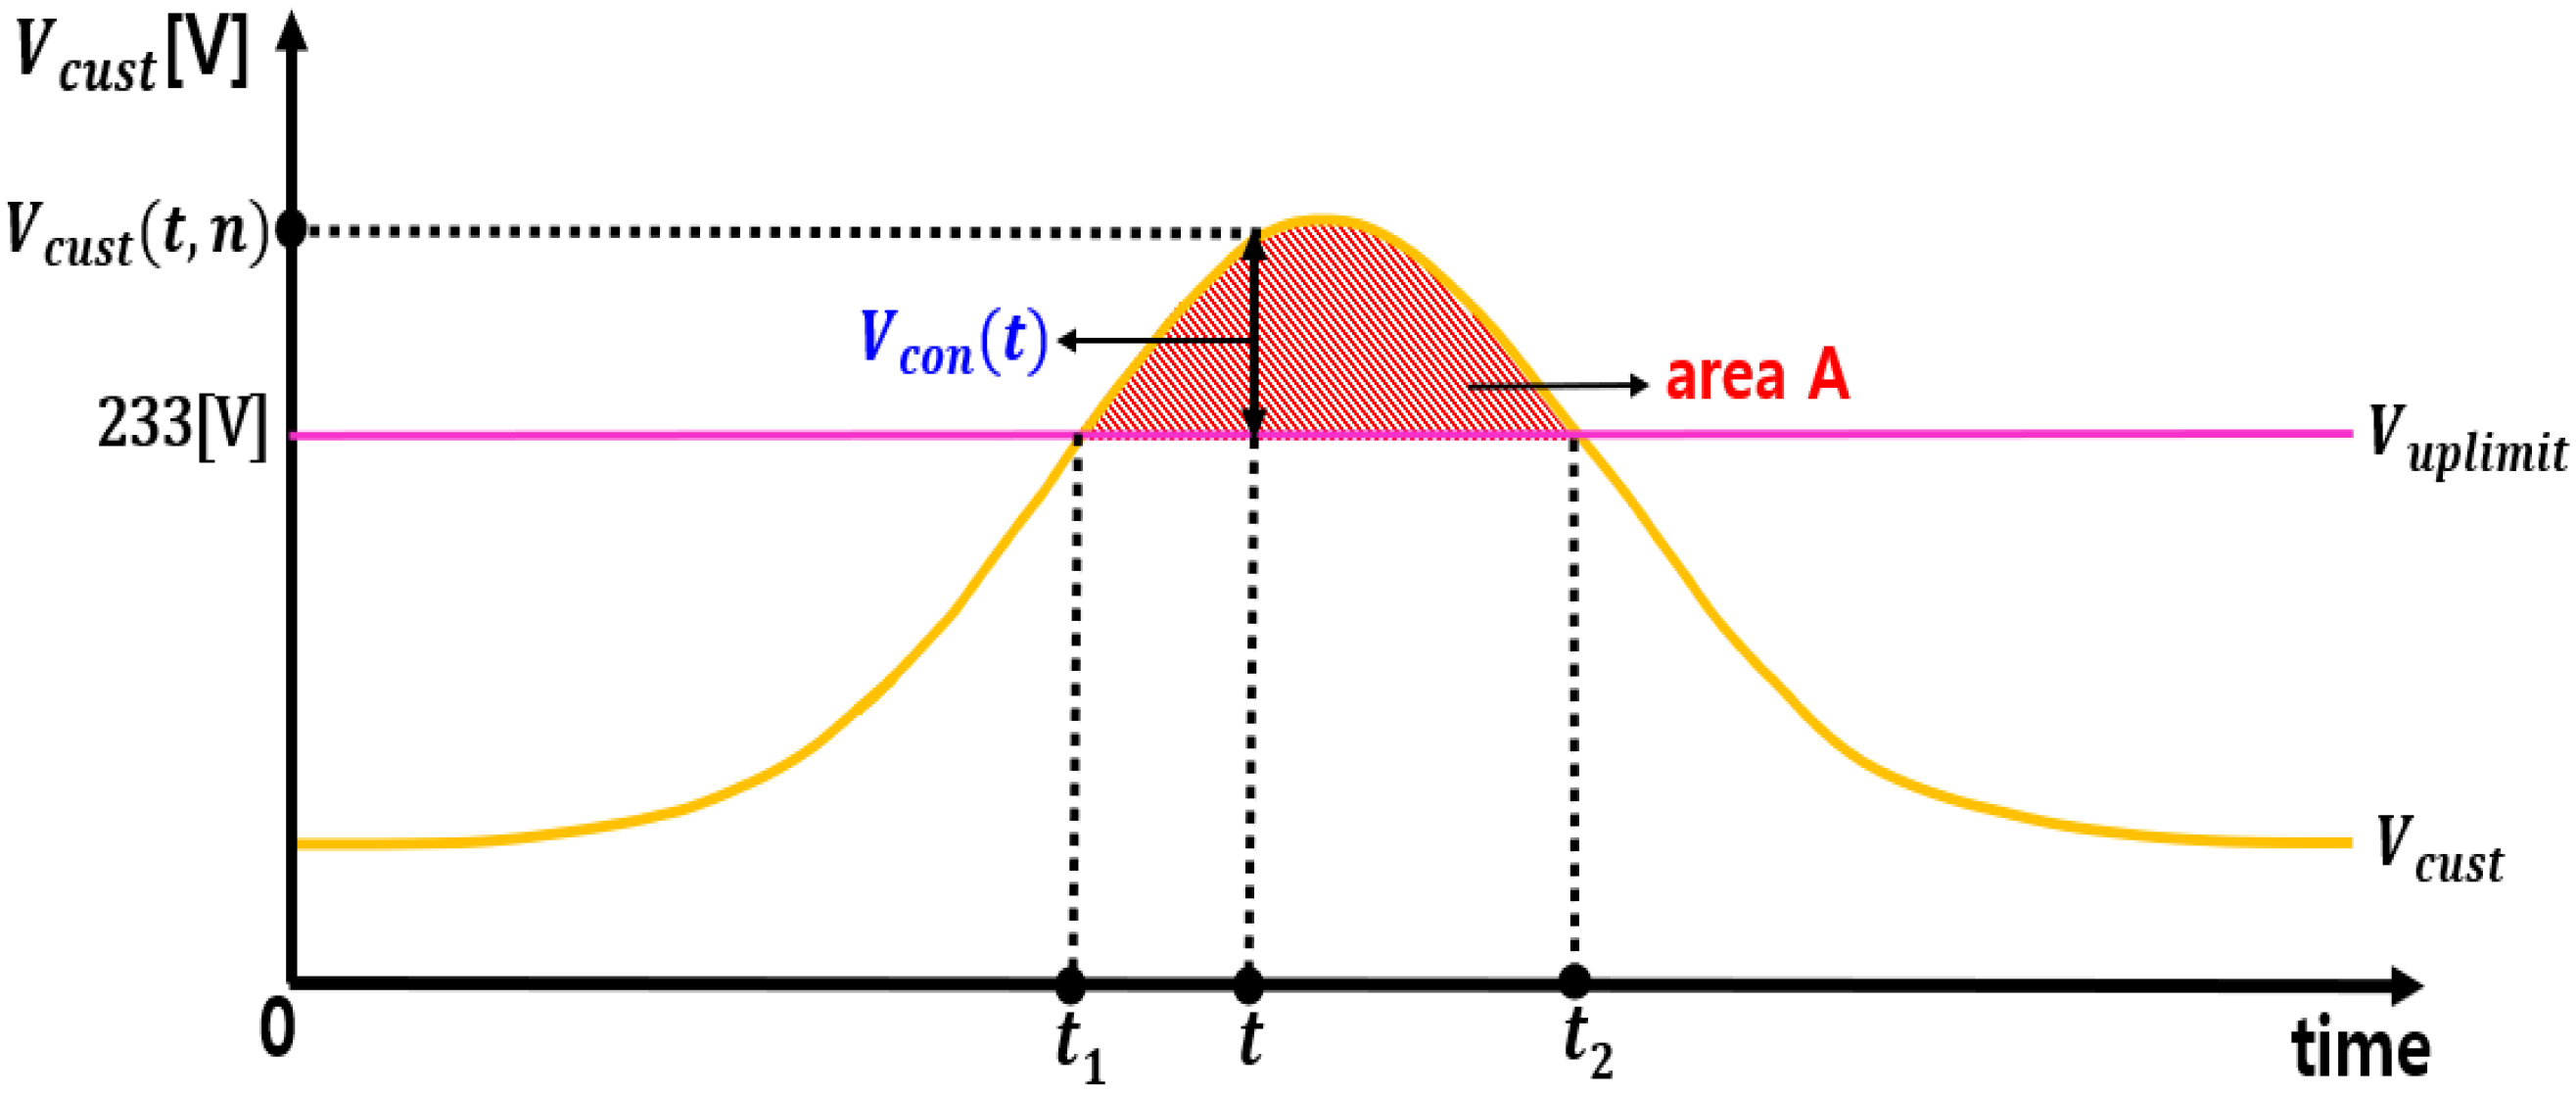
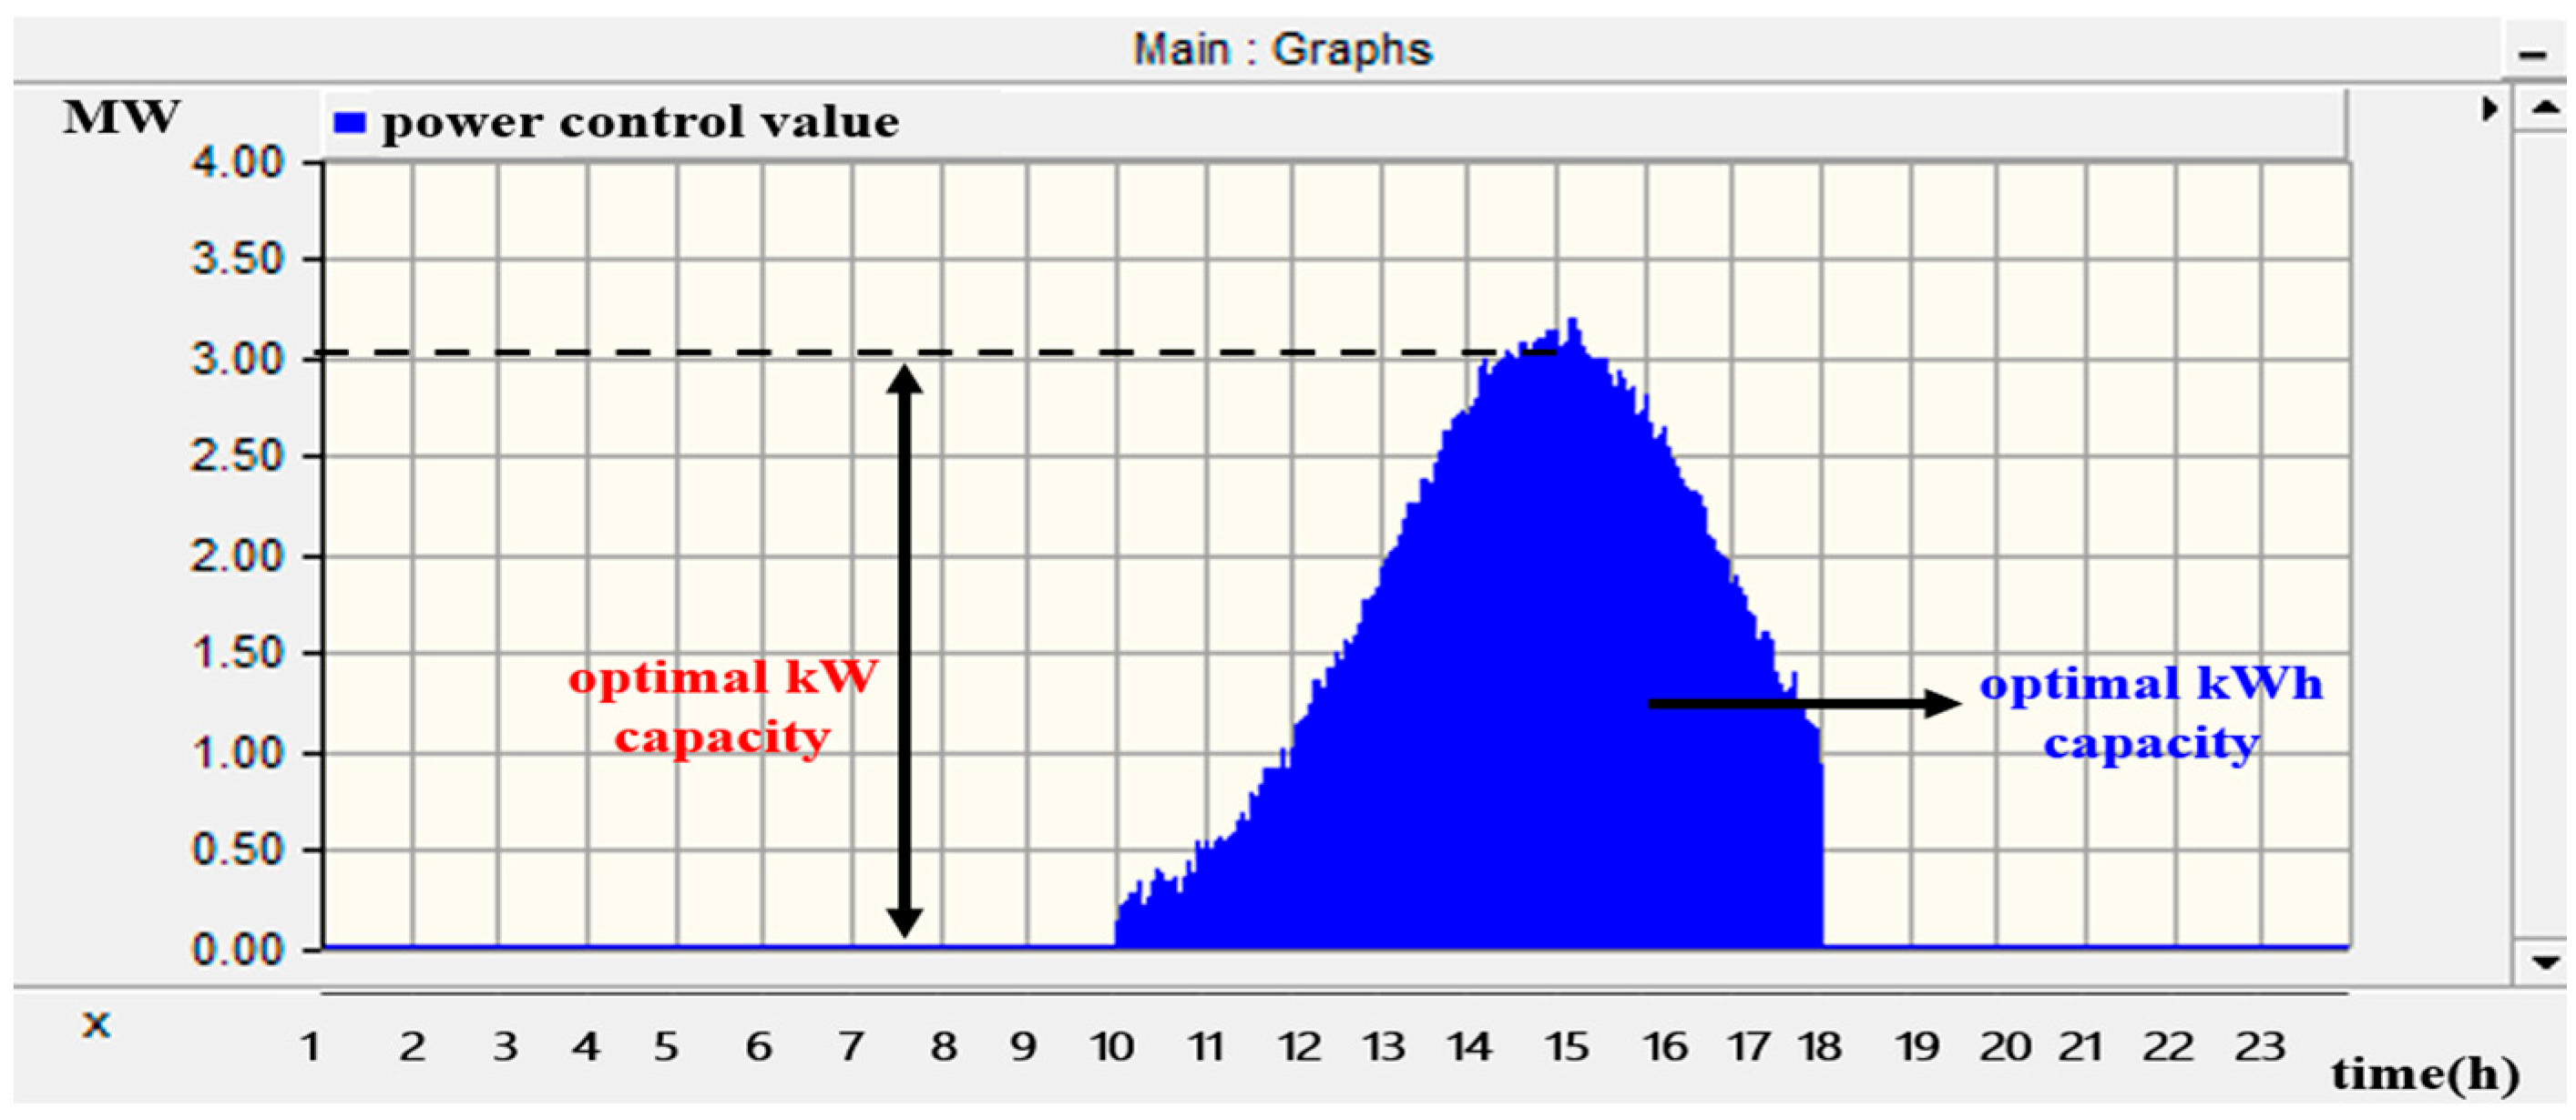
- The optimal capacity of the VPL device was formulated by the voltage control, current control, and power control values of the VPL device to keep the customer voltage within the allowable upper limit. Based on the power control value, the optimal kW capacity of the VPL device was estimated as the maximum value in the power control values, and then the optimal kWh capacity was determined by accumulating the power control values during the over-voltage time interval.
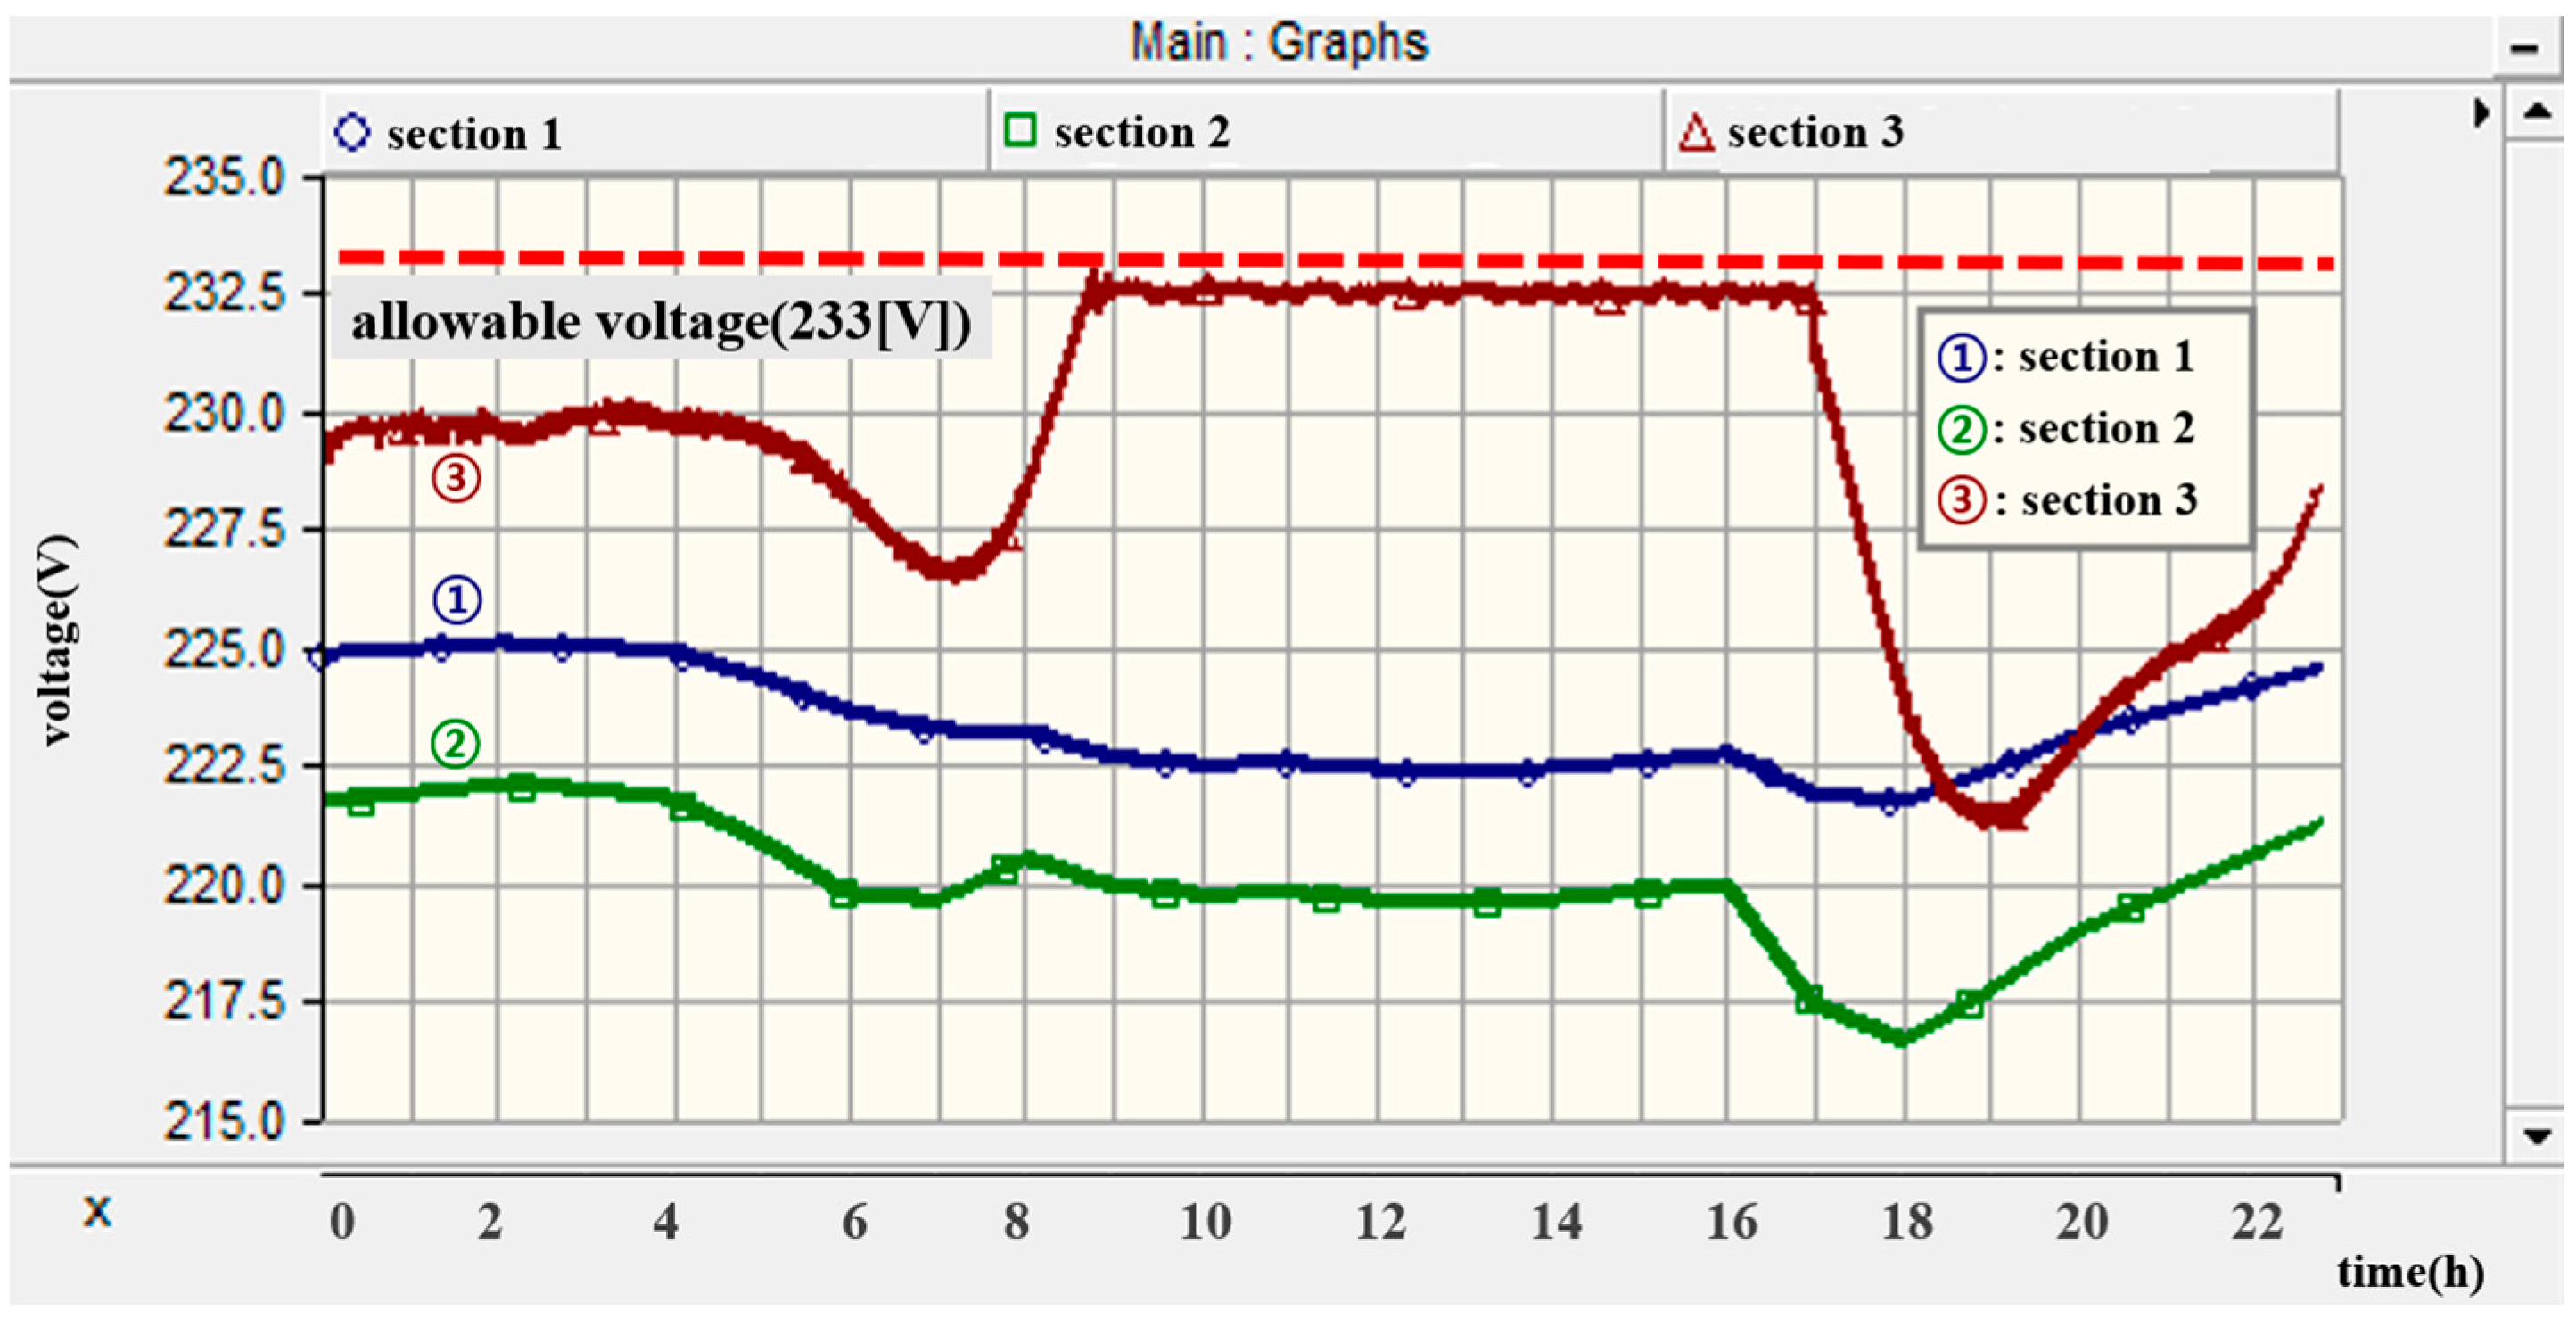
- (2)
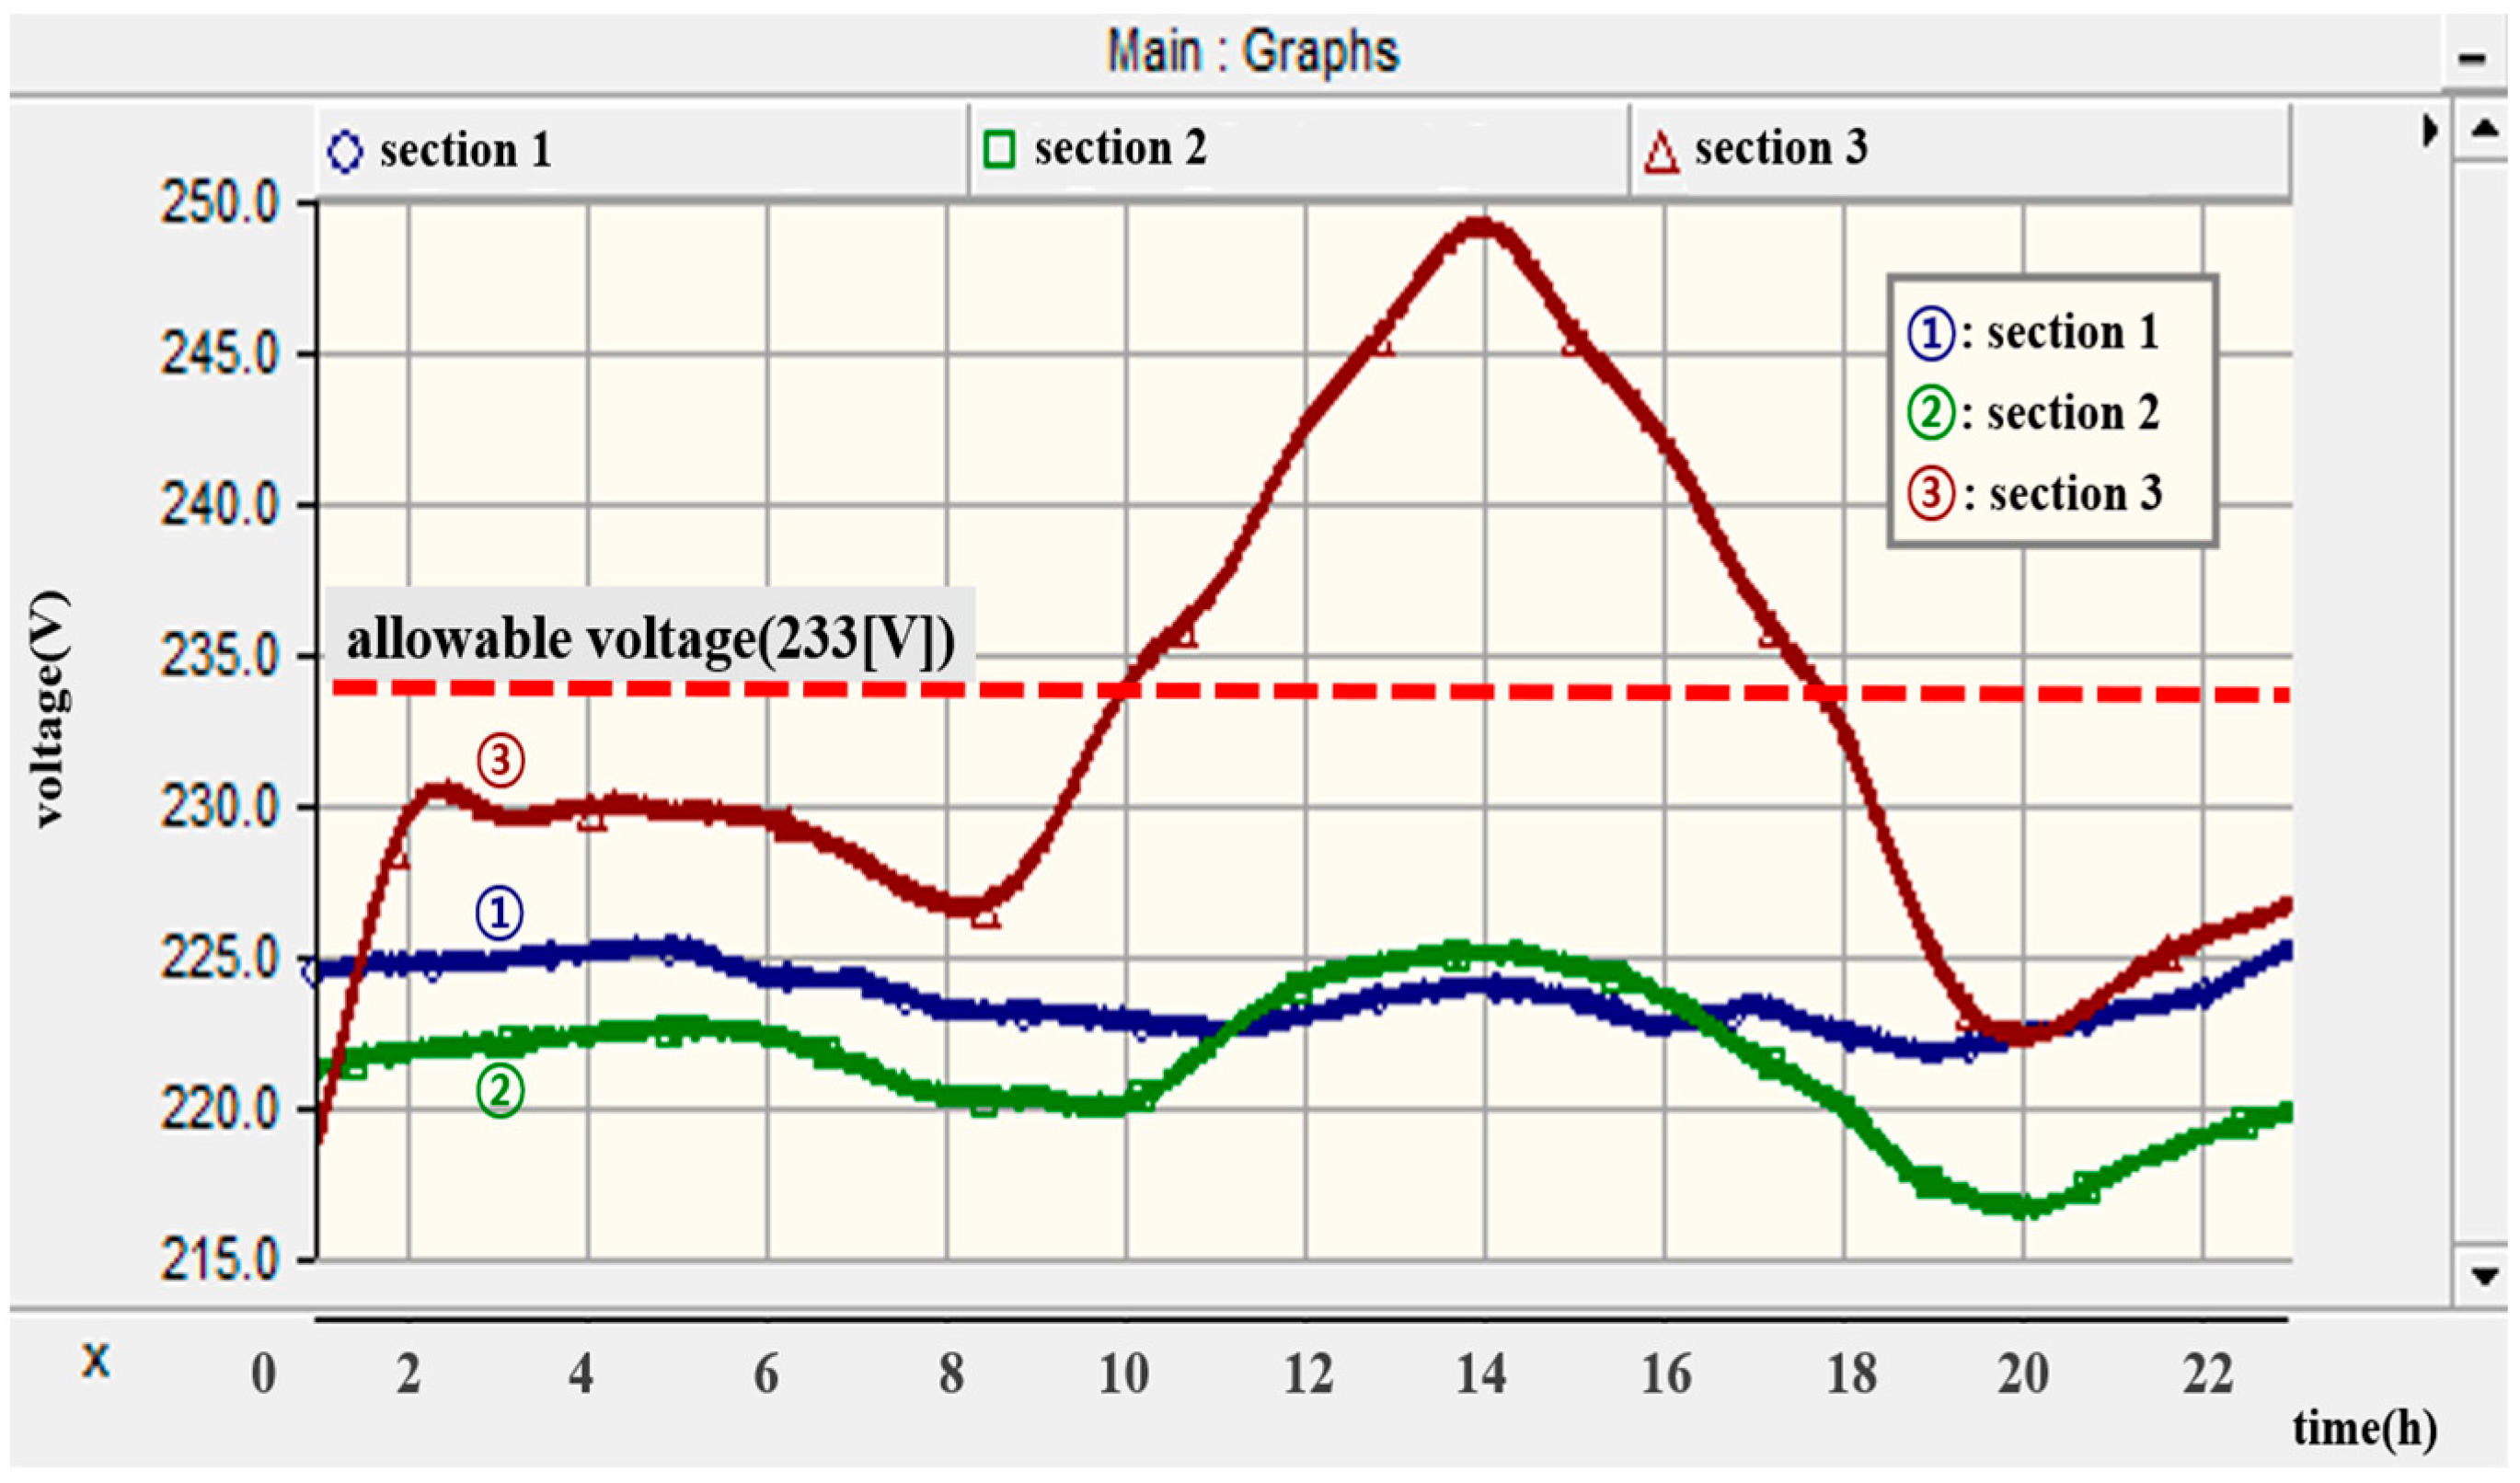
- From the characteristics of customer voltages performed by the optimal capacity algorithm in the VPL device, it was confirmed that the customer voltages were maintained within the allowable upper limit of 233 (V), thereby overcoming the over-voltage phenomenon in the secondary feeder.
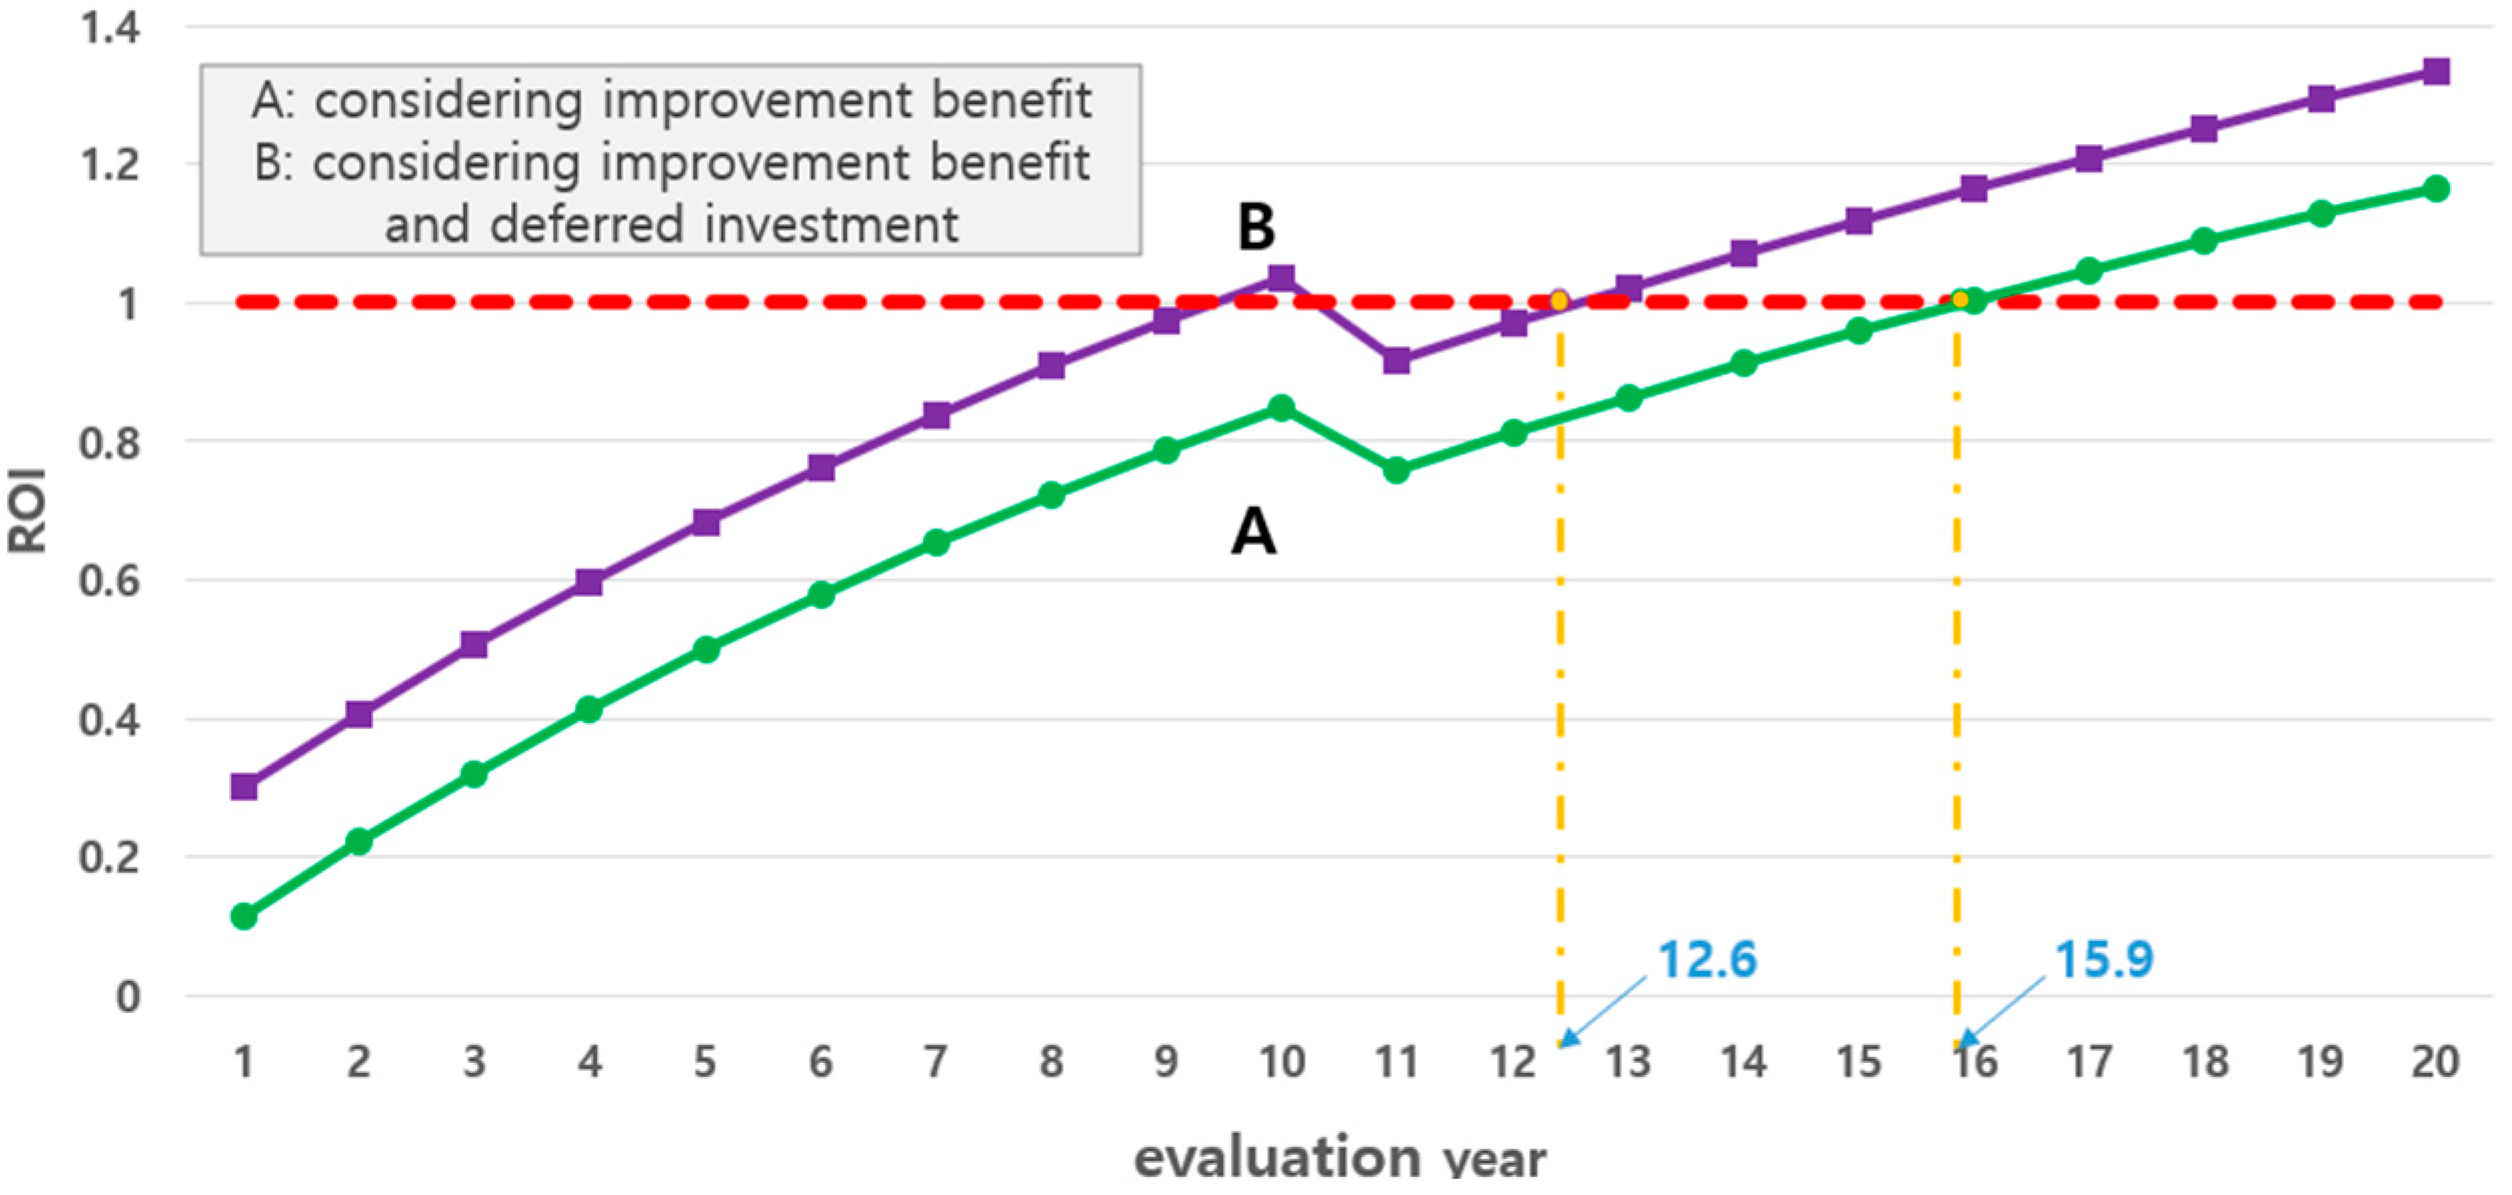
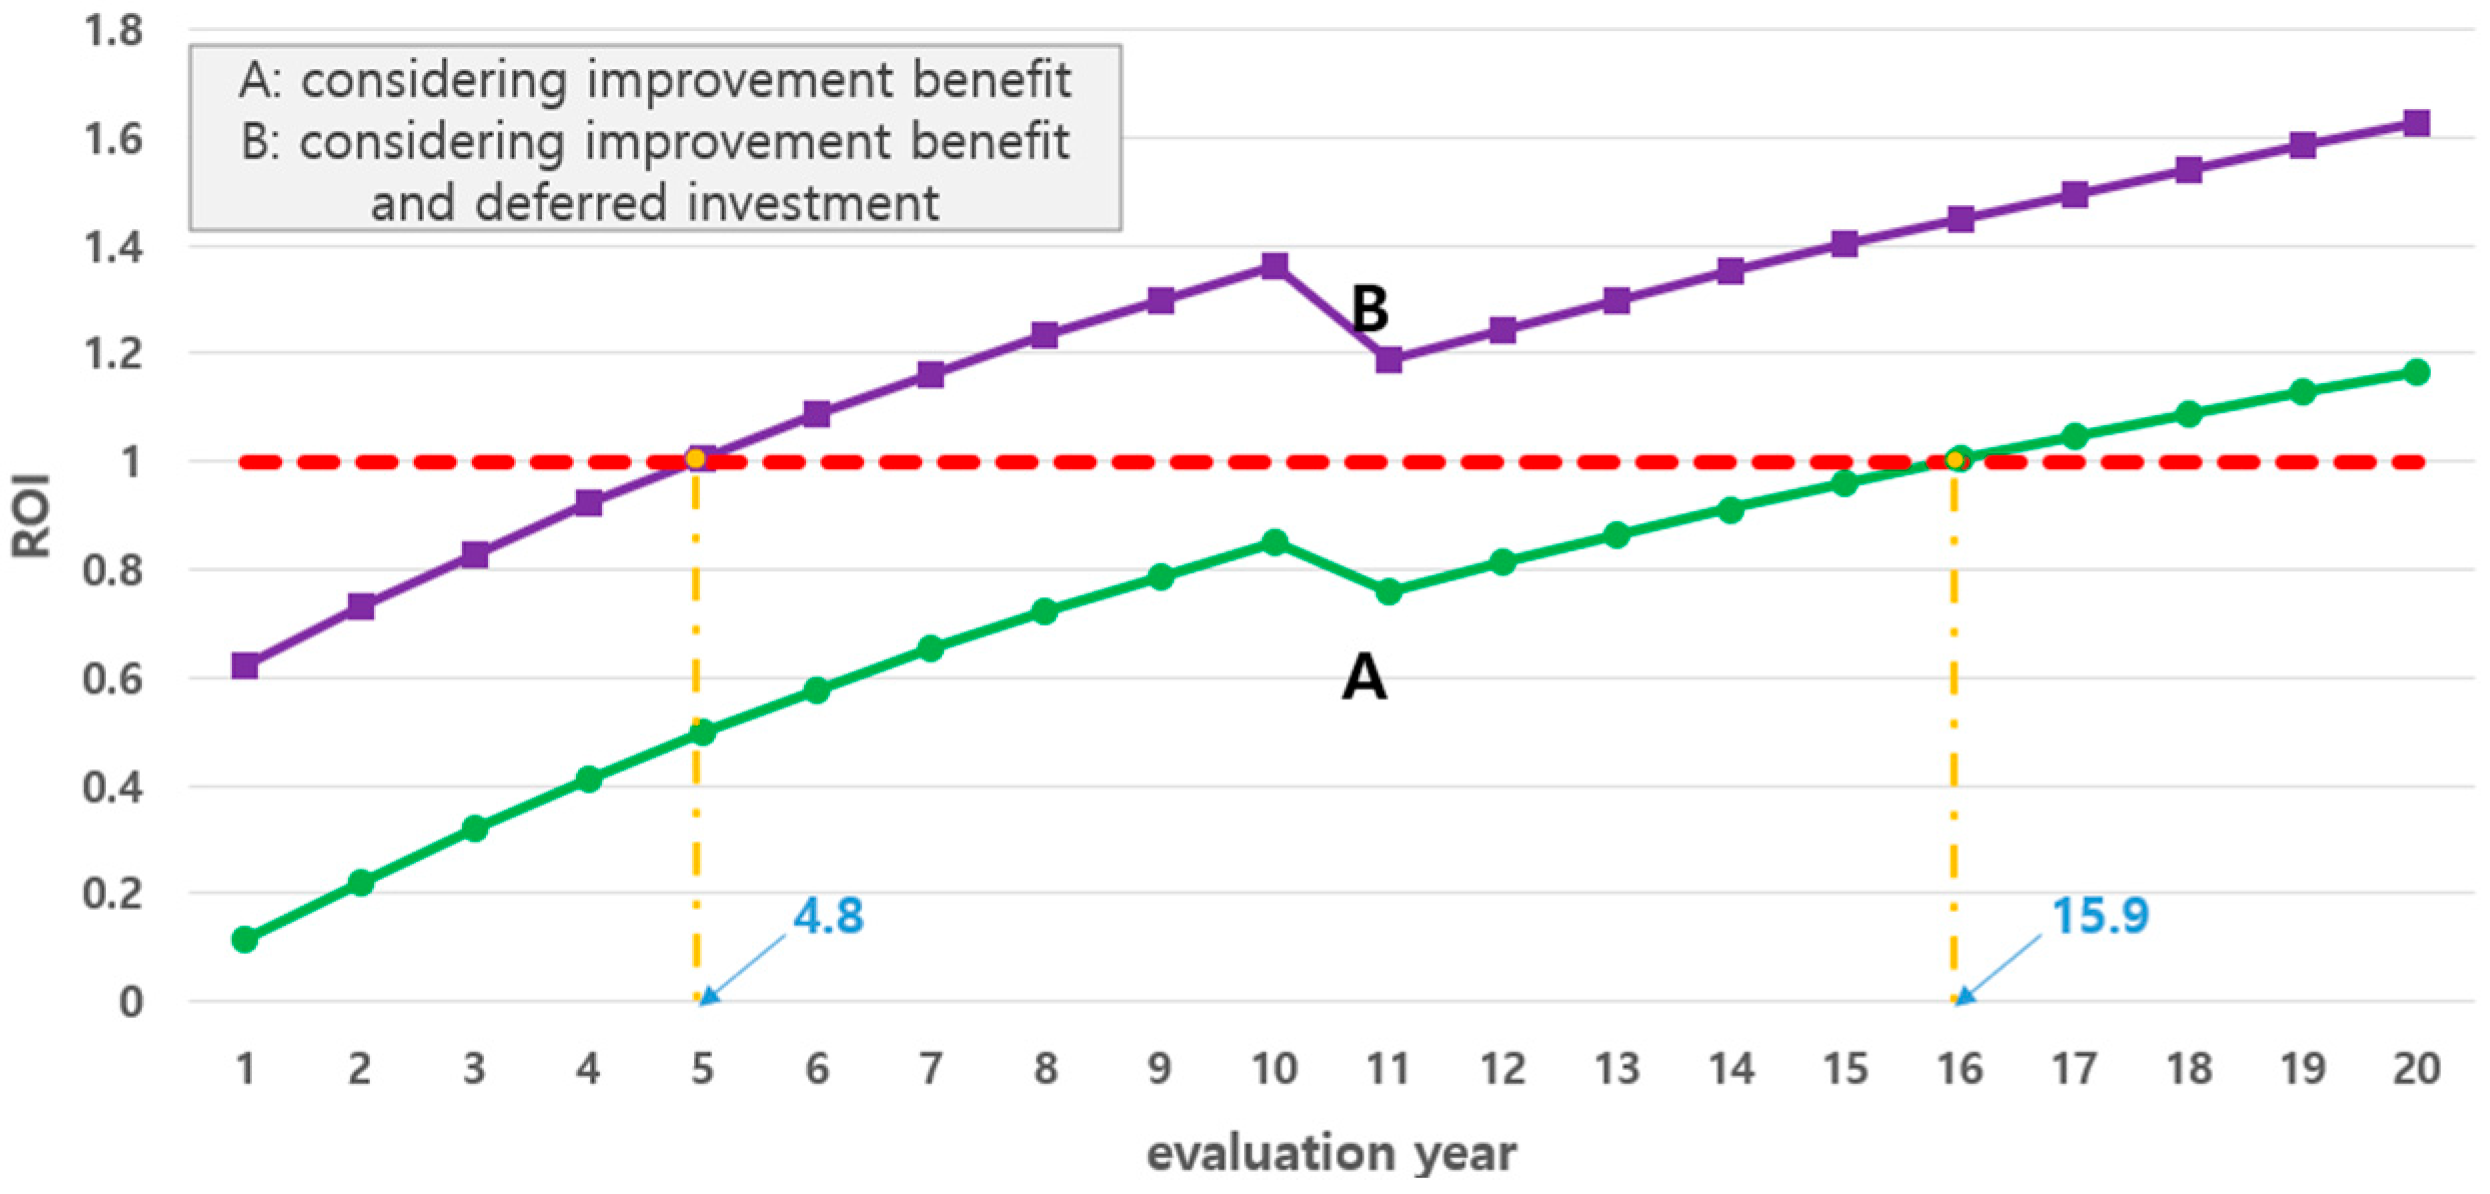
- (3)
- From the simulation results of economic evaluation based on the small-scale model of the VPL device, it was confirmed that the annual benefit and were are estimated at approximately 17,300,000 (thousand KRW) and 14,800,000 (thousand KRW), and then the ROI was obtained to be about 15.9 year, only considering the improvement benefit for hosting capacity of renewable energy sources, which consists of the SMP merit, the REC merit, and the merit of reduction amount of carbon emission; the ROI was calculated to be about 6.1 year when additionally considering the benefits of deferred investment in power system infrastructure, such as the expansion of new overhead distribution line, indicating that economic feasibility can be definitely guaranteed.
- (4)
- From the simulation results of economic evaluation based on the all-scale models of the VPL device, it was found that the 200 MW large-scale model was expected to be most economical regardless of the platform cost, because it was possible for the large-scale model to secure the deferred investment benefit of power system infrastructure such as the underground T/L, distribution substation, main transformer, and overhead D/L, which requires substantial construction costs compared to the small and medium introduction models
- (5)
- When the VPL device was applied at the distribution network, enormous construction cost and technical issues were required. Therefore, a financial support system and related technical standards in the power system should be established to mitigate the economic and technical burdens.
Author Contributions
Funding
Data Availability Statement
Conflicts of Interest
References
- Chohan, U.W. A Green New Deal: Discursive Review and Appraisal (March 3, 2019); Notes on the 21st Century (CBRI); CBRI: Uttarakhand, India, 2019. [Google Scholar]
- Korea Power Exchanges. The 11th Basic Plan of Long-Term Electricity Supply and Demand, Technical Report; Ministry of Trade, Industry and Energy: Sejong-si, Republic of Korea, 2025; pp. 9–13. [Google Scholar]
- KoSIF and CoREi and Plan 1.5, 2030 Renewable Energy Demand Outlook Report in Korea, Technical Report; Korea Sustainability Investing Forum: Seoul, Republic of Korea, 2022; pp. 1–10.
- International Energy Agency. Korea’s Renewable Energy 3020 Plan; Ministry of Trade, Industry and Energy: Sejong-si, Republic of Korea, 2020; pp. 1–10. [Google Scholar]
- Gong, J.Y.; Jo, I.H. Changes in International Renewable Energy Policies and Market Analysis; Korea Energy Economics Institute: Ulsan, Republic of Korea, 2022; pp. 3–8. [Google Scholar]
- Ministry of Trade, Industry and Energy. Major Trends in Renewable Energy, Technical Report; Korea Institute for Advancement of Technology: Seoul, Republic of Korea, 2021; pp. 14–17. [Google Scholar]
- Lee, C.W.; Kim, Y.H.; Kim, S.H. Minimization of Renewable Energy Output Limits and Reduction Methods. J. Korean Inst. Illum. Electr. Install. Eng. 2019, 33, 41–48. [Google Scholar] [CrossRef]
- Jeon, W.Y.; Kim, J.Y.; Lee, S.W. Establishing an Efficient Low-Carbon Power System by Reducing Curtailment of Renewable Energy using ESS—The Case of Jeju-Island in 2025. J. Clim. Change Res. 2022, 13, 1–9. [Google Scholar] [CrossRef]
- Petinrin, J.O.; Shaabanb, M. Impact of renewable generation on voltage control in distribution systems. J. Renew. Sustain. Energy Rev. 2016, 65, 770–774. [Google Scholar] [CrossRef]
- Khatri, N.; Kumar, V.; Bansal, R.C.; Joshi, R.R. Stochastic evaluation of voltage sag in power system network considering effect of photovoltaic generation. J. Int. Trans. Electr. Energy Syst. 2018, 29, e2773. [Google Scholar] [CrossRef]
- Kim, K.H.; Song, K.B. Analysis of Factors Affecting the Economic Feasibility of a Virtual Power Plant Business Using ESS. J. Korean Inst. Illum. Electr. Install. Eng. 2023, 37, 18–25. [Google Scholar]
- Innovation Landscape for a Renewable-Powered Future: Solutions to Integrate Variable Renewables, Technical Report; IRENA: Abu Dhabi, United Arab Emirates, 2019; pp. 87–89.
- Ferreira, F.A.L.; Unsihuay-Vila, C.; Núñez-Rodríguez, R.A. Transmission and Generation Expansion Planning Considering Virtual Power Lines/Plants, Distributed Energy Injection and Demand Response Flexibility from TSO-DSO Interface. Energies 2025, 18, 1602. [Google Scholar] [CrossRef]
- Kwon, K.B.; Park, J.Y.; Jung, H.S.; Hong, S.M.; Heo, J.H. Reinforcement Learning-based Energy Storage System Control for Optimal Virtual Power Plant Operation. J. Trans. Korean Inst. Electr. Eng. 2023, 72, 1586–1592. [Google Scholar]
- Choi, S.M.; Kim, J.M.; Kim, Y.H.; You, H.S.; Ryu, K.S.; Rho, D.S. Estimation method of Optimal Capacity for VPL to improve Power curtailment of Renewable energy sources. J. Korea Acad.-Ind. Coop. Soc. 2023, 24, 441–451. [Google Scholar]
- Lee, H.D.; Kim, K.Y.; Kim, M.S.; Rho, D.S. A Study on Economic Evaluation Modeling of MVDC Distribution System for Hosting Capacity of PV System. J. Korea Acad.-Ind. Coop. Soc. 2021, 22, 1–12. [Google Scholar]
- Kim, J.I.; Jo, S.M. Assessing the Efficiency of the Renewable Portfolio Standard: A Focus on SMP and REC Price Dynamics in South Korea. Korean Energy Econ. Rev. 2025, 24, 1–7. [Google Scholar]
- Jang, J.H.; Shin, H.S.; Kwag, K.H.; Oh, H.B.; Yun, H.S.; Kim, W. A Study on the Analysis of System Marginal Price and Market Participant Benefits Reflecting Actual System Operational Constraints. Trans. Korean Inst. Electr. Eng. 2023, 73, 26–28. [Google Scholar] [CrossRef]
- Moon, C.H.; Kwon, B.S.; Woo, S.H.; Bae, D.J.; Song, K.B. Economic Evaluation and Sensitivity Analysis of Solar PV Generation Business from the Perspective of Solar PV Generation Owners according to Fluctuation Scenarios of SMP and the Price of REC. J. Korean Inst. Illum. Electr. Install. Eng. 2020, 34, 36–44. [Google Scholar]
- Sonu, S. Effect of the REC Price Volatility on the PV System Installation by Private Participants: Empirical Test on a Korea Case under the RPS System. New Renew. Energy 2016, 12, 156–164, ISSN 1738-3935. [Google Scholar] [CrossRef]
- Lee, K.-H. Analysis on Competitive Electricity Market with Emissions Trading Market. Trans. Korean Inst. Electr. Eng. 2020, 69, 542–548. [Google Scholar] [CrossRef]
- Nam, Y.H.; Lee, H.D.; Kim, Y.R.; Marito, F.; Kim, M.Y.; Rho, D.S. Economic Evaluation Algorithm of Island Micro-grid for Utility and Independent Power Producer. Trans. Korean Inst. Electr. Eng. 2017, 66, 1032–1038. [Google Scholar]
- Kim, K.H.; Han, B.G.; Shen, J.; Kim, J.M.; Rho, D.S. A Study on Operation Strategy and Economical Evaluation of Energy Prosumer Considering Power Trading Methods. J. Korea Acad.-Ind. Coop. Soc. 2022, 23, 618–626. [Google Scholar]
- Won, J.H.; You, H.S.; Choi, S.M.; Kim, J.M.; Rho, D.S. A Study on the Operational Algorithm of ESS Considering DR and Peak Shaving. J. Korea Acad.-Ind. Coop. Soc. 2023, 24, 116–124. [Google Scholar]
- Oh, J.S.; Kim, T.H.; An, B.H.; Lee, S.Y.; Lim, S.W.; Park, T.S. A Study on Comparison of Investment Value Assessment Methods for Prioritizing Investment in Power Equipment. J. Trans. Korean Inst. Electr. Eng. 2024, 73, 1404–1411. [Google Scholar] [CrossRef]
- Lee, M.H.; Kim, J.M.; Kim, K.H.; Lee, Y.B.; Kim, Y.H.; Rho, D.S. Economic Evaluation Modeling of ±35kV MVDC Distribution System According to the Capacity of PV system. J. Korea Acad.-Ind. Coop. Soc. 2024, 25, 504–513. [Google Scholar]


| Section | Line Types | Load Ratio (%) | Line Length (km) | Line Impedance (Ω/km) | P.Tr Tap Ratio (V) | |
|---|---|---|---|---|---|---|
| R | X | |||||
| 1 | ACSR160 (mm2) | 10 | 5 | 0.18 | 0.39 | 13,200/230 |
| 2 | ACSR160 (mm2) | 50 | 8 | 0.18 | 0.39 | 13,200/230 |
| 3 | ACSR95 (mm2) | 40 | 12 | 0.3 | 0.44 | 12,600/230 |
| Items | Contents |
|---|---|
| economic target year (year) | 20 |
| discount rate (%) | 5.5 |
| inflation rate (%) | 3 |
| price of SMP (KRW/kWh) | 250.74 |
| price of REC (KRW/kWh) | 56.48 |
| Items | Contents | |
|---|---|---|
| ESS | PCS (thousand KRW/kW) | 90 |
| battery (thousand KRW/kWh) | 500 | |
| construction cost of VPL platform (%) | 10% of construction cost in ESS | |
| O&M cost of VPL (%) | 2.5% of construction cost in ESS | |
| Items | Unit Cost (Thousand KRW) |
|---|---|
| one circuit T/L (XLPE 240 mm2, underground) (thousand KRW/km) | 4,520,000 |
| distribution substation (4 bank) (thousand KRW) | 23,000,000 |
| main transformer (45/60 MVA) (thousand KRW) | 6,000,000 |
| one circuit distribution line (ACSR 160 mm2) (thousand KRW/km) | 98,000 |
| electric pole (thousand KRW/km) | 97,500 |
| Introduction Model | Capacity of Renewable Energy Source (MW) | ESS of VPL Capacity (MW/MWh) |
|---|---|---|
| small-scale | 3 | 3/13 |
| medium-scale | 30 | 30/120 |
| large-scale | 200 | 200/800 |
| Rate for Construction Cost in VPL Device (%) | Introduction Model | ROI (year) | |
|---|---|---|---|
| Only Benefit of Hosting Capacity | with Deferred Investment Benefit | ||
| 5 | small-scale | 15.1 | 5.5 |
| medium-scale | 15.1 | 11.9 | |
| large-scale | 15.1 | 4.5 | |
| 10 | small-scale | 15.9 | 6.1 |
| medium-scale | 15.9 | 12.6 | |
| large-scale | 15.9 | 4.8 | |
| 15 | small-scale | 16.9 | 6.8 |
| medium-scale | 16.9 | 13.5 | |
| large-scale | 16.9 | 5.4 | |
| 20 | small-scale | 17.7 | 7.4 |
| medium-scale | 17.7 | 14.1 | |
| large-scale | 17.7 | 6.1 | |
Disclaimer/Publisher’s Note: The statements, opinions and data contained in all publications are solely those of the individual author(s) and contributor(s) and not of MDPI and/or the editor(s). MDPI and/or the editor(s) disclaim responsibility for any injury to people or property resulting from any ideas, methods, instructions or products referred to in the content. |
© 2025 by the authors. Licensee MDPI, Basel, Switzerland. This article is an open access article distributed under the terms and conditions of the Creative Commons Attribution (CC BY) license (https://creativecommons.org/licenses/by/4.0/).
Share and Cite
Rho, S.-E.; Choi, S.-M.; Lee, J.-S.; You, H.-S.; Lee, S.-H.; Rho, D.-S. A Feasibility Study of a Virtual Power Line Device to Improve Hosting Capacity in Renewable Energy Sources. Energies 2025, 18, 3714. https://doi.org/10.3390/en18143714
Rho S-E, Choi S-M, Lee J-S, You H-S, Lee S-H, Rho D-S. A Feasibility Study of a Virtual Power Line Device to Improve Hosting Capacity in Renewable Energy Sources. Energies. 2025; 18(14):3714. https://doi.org/10.3390/en18143714
Chicago/Turabian StyleRho, Seong-Eun, Sung-Moon Choi, Joong-Seon Lee, Hyun-Sang You, Seung-Ho Lee, and Dae-Seok Rho. 2025. "A Feasibility Study of a Virtual Power Line Device to Improve Hosting Capacity in Renewable Energy Sources" Energies 18, no. 14: 3714. https://doi.org/10.3390/en18143714
APA StyleRho, S.-E., Choi, S.-M., Lee, J.-S., You, H.-S., Lee, S.-H., & Rho, D.-S. (2025). A Feasibility Study of a Virtual Power Line Device to Improve Hosting Capacity in Renewable Energy Sources. Energies, 18(14), 3714. https://doi.org/10.3390/en18143714