Abstract
In the context of global climate governance and the low-carbon energy transition, virtual power plant (VPP), a key technology for integrating distributed energy resources, is urgently needed to solve the problem of decentralization and lack of synergy in electricity, carbon, and green certificate trading. Existing studies mostly focus on single energy or carbon trading scenarios and lack a multi-market coupling mechanism supported by blockchain technology, resulting in low transaction transparency and a high risk of information tampering. For this reason, this paper proposes a synergistic optimization strategy for electricity/carbon/green certificate virtual power plants based on blockchain cross-chain transactions. First, Latin Hypercubic Sampling (LHS) is used to generate new energy output and load scenarios, and the K-means clustering method with improved particle swarm optimization are combined to cut down the scenarios and improve the prediction accuracy; second, a relay chain cross-chain trading framework integrating quota system is constructed to realize organic synergy and credible data interaction among electricity, carbon, and green certificate markets; lastly, the multi-energy optimization model of the virtual power plant is designed to integrate carbon capture, Finally, a virtual power plant multi-energy optimization model is designed, integrating carbon capture, power-to-gas (P2G) and other technologies to balance the economy and low-carbon goals. The simulation results show that compared with the traditional model, the proposed strategy reduces the carbon emission intensity by 13.3% (1.43 tons/million CNY), increases the rate of new energy consumption to 98.75%, and partially offsets the cost through the carbon trading revenue, which verifies the Pareto improvement of environmental and economic benefits. This study provides theoretical support for the synergistic optimization of multi-energy markets and helps to build a low-carbon power system with a high proportion of renewable energy.
1. Introduction
Due to rising global concern about climate change, carbon emission reduction has a broad consensus in the international community [1,2,3]. In the energy field, the traditional power system faces many challenges, such as high carbon emissions, low energy utilization efficiency, and difficulties in the use of new energy sources. Virtual power plant has emerged as an innovative energy management model, which integrates distributed energy resources, energy storage systems, and controllable loads, etc., and is able to achieve flexible regulation and optimal operation of the power system. At the same time, green certificates play an important role in promoting the development and trading of renewable energy as a tool for protecting emerging renewable energy’s environmental rights and interests. The gradual improvement of the carbon emissions trading market also gives the carbon emission reduction index a clear economic value [4]. However, in the current virtual power plant model, the operation process, electricity, carbon, and green certificate-related transactions are often in a decentralized state, and lack an effective synergistic mechanism and a credible trading platform [5,6]. Blockchain technology, with its decentralization, non-tampering, traceability, and other characteristics, provides new ideas and ways to solve the above problems [7]. Constructing a virtual power plant electricity/carbon/green certificate blockchain cross-chain trading platform can achieve the organic integration and efficient interoperability of different types of transactions, improve the transparency and credibility of transactions, and reduce transaction costs and risks. This not only helps to promote the sustainable development of the virtual power plant, but also further promotes the transformation and upgrading of the energy and power industry in the direction of low-carbon and green, which is of great research significance and application value in the process of realizing the global carbon emission reduction target and building a clean and low-carbon energy system.
In recent years, scholars have conducted extensive research on cross-chain trading of power energy. Reference [8] proposes a cross-chain trading model for traditional electricity/carbon trading, leveraging blockchain technology to achieve cost reduction, efficiency improvement, and energy conservation. Experimental results validate its effectiveness. Aiming at the low consumption rate of renewable energy and high financial subsidy pressure, reference [9] develops an optimal model for integrated energy systems with green certificate cross-chain trading, which reduces costs, promotes consumption, and enhances efficiency. To address the inefficiency of single-blockchain processing in energy transactions, reference [10] presents a peer-to-peer energy trading model based on cross-chain technology, significantly improving security, efficiency, and scalability.
Although blockchain technology has been effectively applied to privacy protection in single energy market transactions, its application in joint markets remains insufficient, failing to fully exploit its privacy protection advantages. To tackle the inefficiency of single-blockchain processing, reference [11] constructs an optimal model for integrated energy systems with green certificate cross-chain trading, effectively reducing system costs and enhancing renewable energy consumption efficiency. Reference [12] proposes a peer-to-peer energy trading model based on cross-chain technology, remarkably improving transaction security, efficiency, and system scalability. In the context of electricity/carbon/green certificate joint market trading, current studies mainly rely on penalty mechanisms [13,14], accounting methods [15,16], and robust optimization [17]. Compared with single trading markets, these approaches reduce carbon emissions by 5% and increase new energy consumption by approximately 6%. However, existing research still has notable limitations.
On one hand, the application of blockchain cross-chain technology in energy trading is mostly confined to single scenarios of electricity, carbon, or green certificates. For example, reference [18] only focuses on the blockchain application in carbon trading, lacking multi-market integration. On the other hand, traditional joint trading frameworks for electricity/carbon/green certificates lack blockchain technology support, making it difficult to ensure information transparency and immutability. For instance, centralized storage of transaction data in traditional models [19] poses a risk of tampering, failing to meet the security and transparency requirements of modern energy trading [20,21,22]. At the same time [23], research and analysis are currently being conducted at home and abroad on credit certificates, green certificate trading, and trading contracts [24,25,26]. Additionally, existing studies have not formed a complete solution for electricity/carbon/green certificate cross-chain trading, hindering efficient interconnection and collaborative optimization among multi-markets.
To this end, this paper proposes to consider the blockchain cross-chain trading strategy of the electricity/carbon/green certificate virtual power plant. The following contributions were made to this end.
- (1)
- This study applies blockchain cross-chain technology to the multi-market joint trading of electricity, carbon, and green certificates in virtual power plants (VPPs), constructing a relay chain-centric multi-chain collaborative trading platform. The proposed framework ensures the immutability and privacy protection of transaction data through cross-chain gateways and smart contracts, addressing issues such as information silos and trust deficits inherent in traditional decentralized trading mechanisms. This innovation significantly enhances transaction transparency and security, offering a robust solution for integrated energy market operations.
- (2)
- To address the uncertainty of renewable energy generation and load demand, this paper proposes a scenario generation and reduction method integrating Latin Hypercube Sampling (LHS) and K-means clustering. By generating diverse scenarios through stratified sampling and extracting representative scenarios via clustering, this method reduces computational complexity while improving prediction accuracy, providing robust data support for multi-energy complementary optimization in VPPs.
- (3)
- This study innovatively introduces a quota system to establish a VPP optimization model coupling electricity, carbon, and green certificate markets. Experimental results demonstrate that the model achieves an 8.5% reduction in carbon emissions and an 8.59% increase in renewable energy utilization through the synergy of carbon trading revenue and green certificate incentives. It also realizes a Pareto improvement between environmental and economic benefits, providing theoretical and practical guidance for VPP participation in low-carbon power systems.
2. Blockchain Cross-Chain Transaction Model
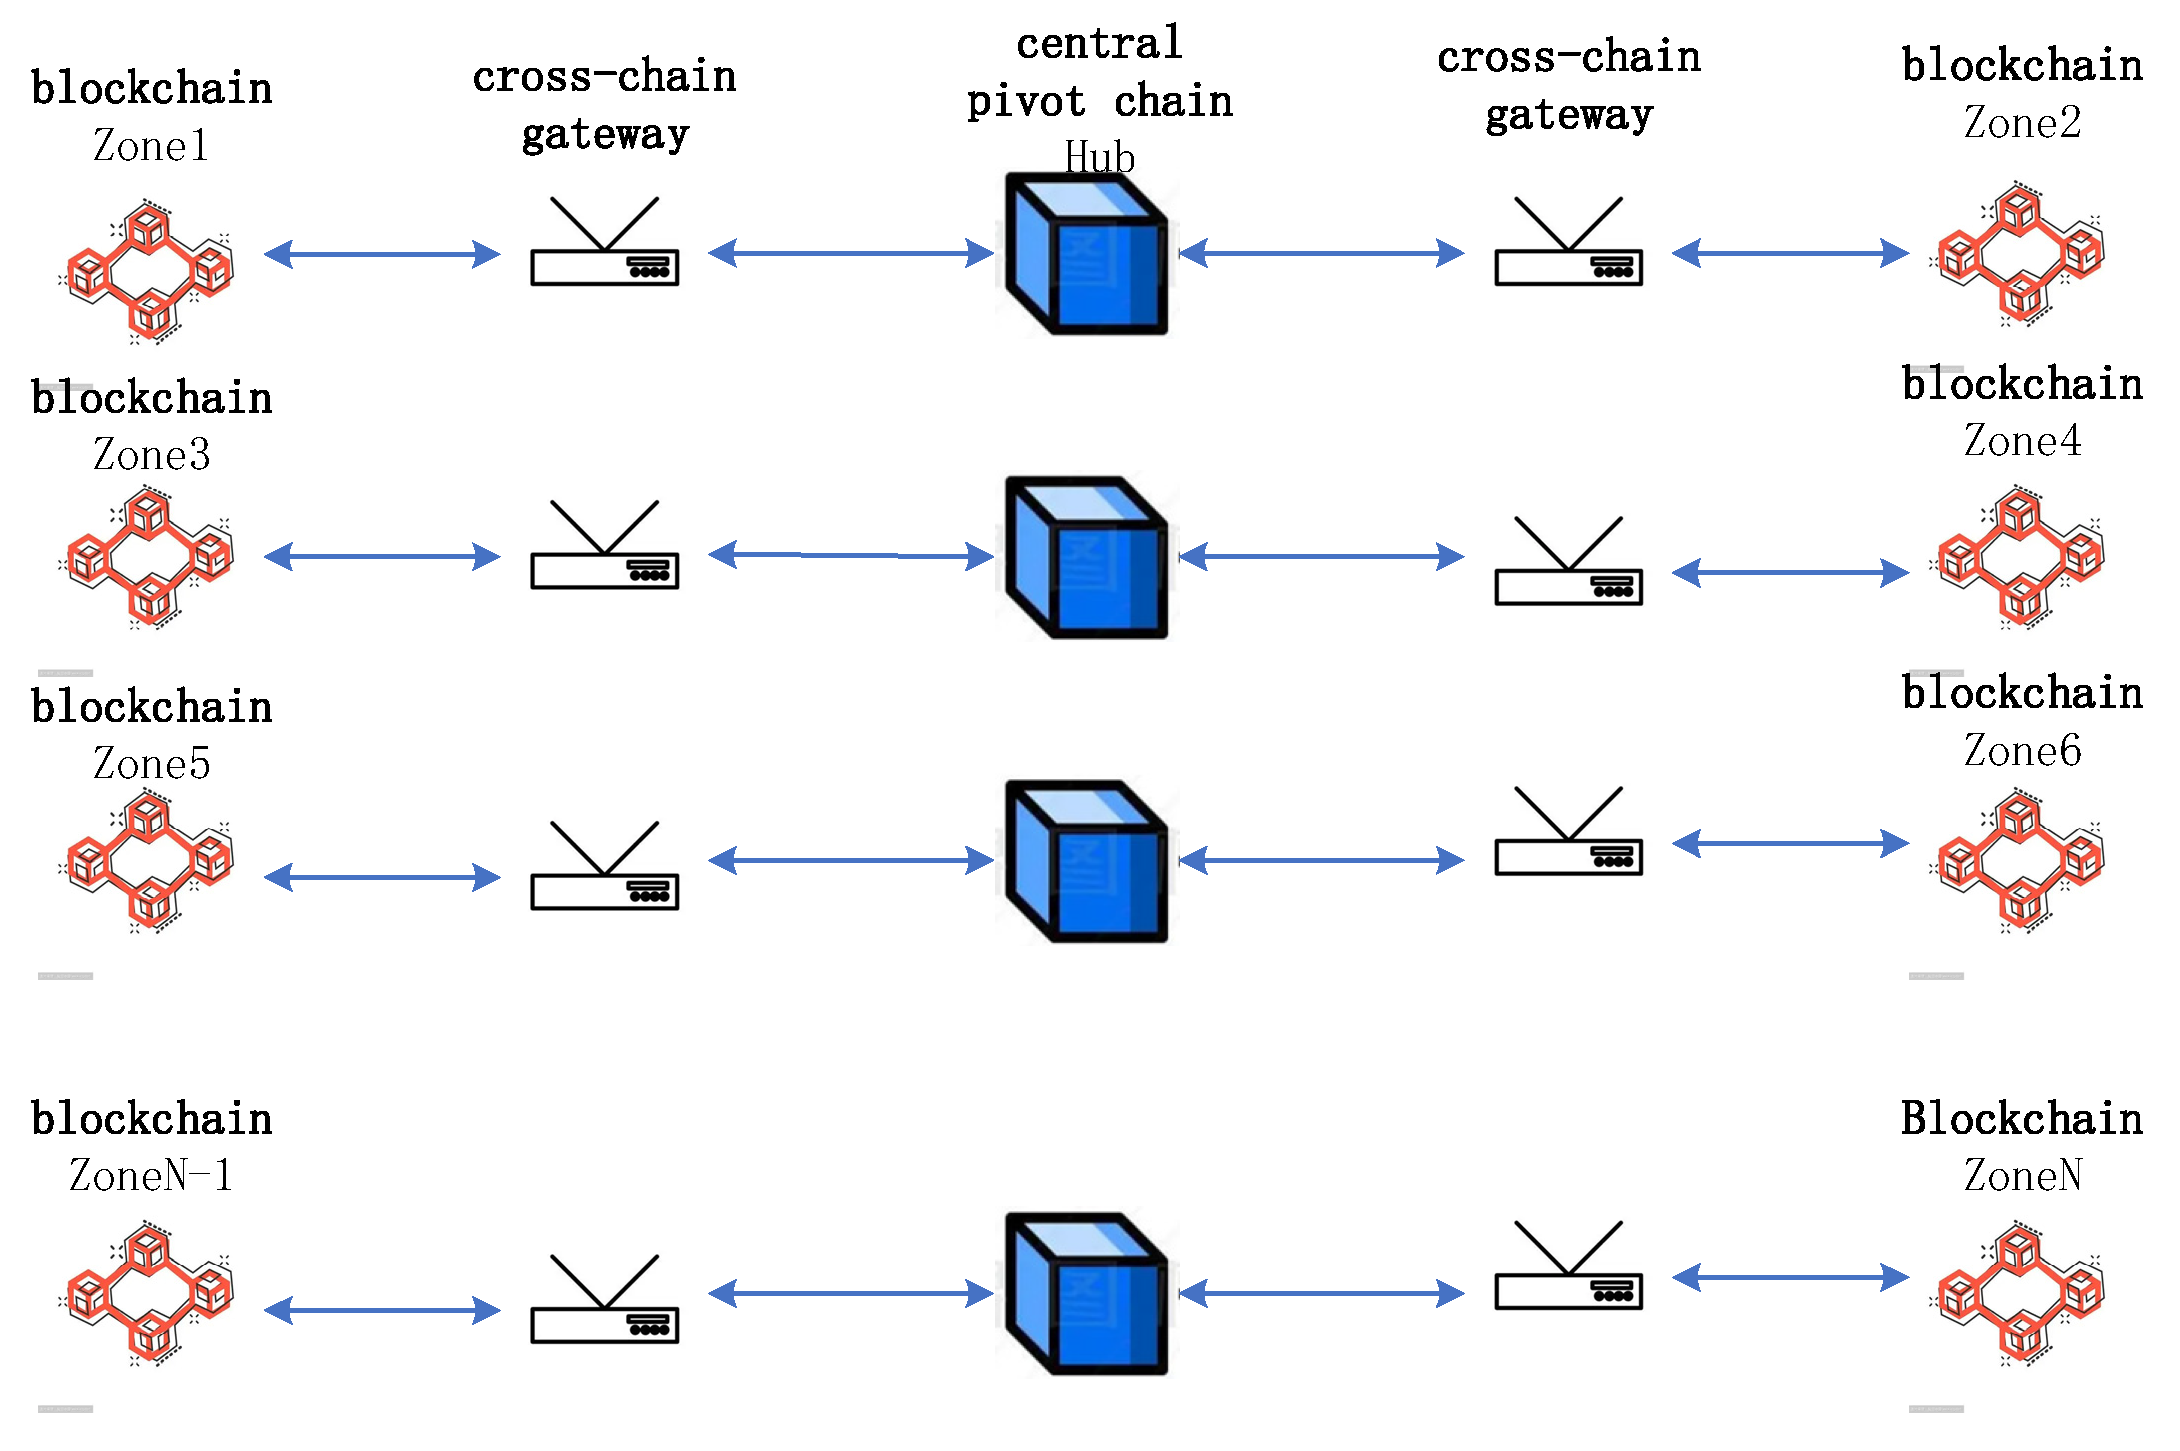
For blockchain, cross-chain transaction refers to achieving cross-chain information circulation in transferring asset information of one blockchain to another blockchain, and for the cross-chain transaction mechanism, the present invention analyses with a relay chain mechanism. The principle is shown in Figure 1. First, the virtual power plant transmits transaction information to the central hub chain through the blockchain, where the cross-chain gateway ensures the security of information transmission to prevent data from being tampered with or attacked. Interactions between blockchains are carried out through the central hub chain.
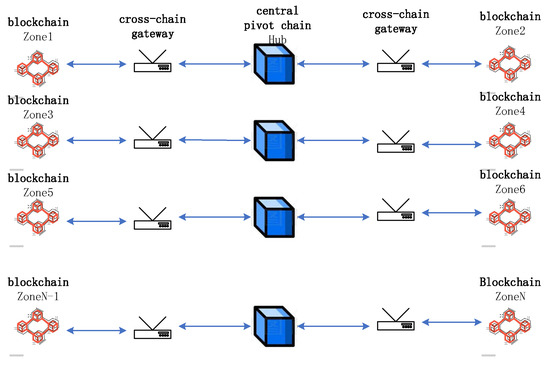
Figure 1.
Relay chain cross-chain transaction.
In a cross-chain transaction of the relay chain, it mainly connects different blockchains through the central hub chain and cross-chain gateway to achieve a cross-chain transaction. In the process of cross-chain transactions, all information and transfers need to be carried out from the relay chain, which allows the relay chain to record all cross-chain transaction information and ensure the security of cross-chain transactions.
The electricity/carbon/green certificate virtual power plant cross-chain trading framework of the present invention is shown in Figure 2 and implemented on the Z-ledger platform. In the green certificate trading and carbon trading process, the virtual power plant trading platform contains distributed new energy and various types of distributed resources, and each virtual power plant (VPP) stores its respective transaction information in its own blockchain. When VPP transactions occur, the process is as follows. First, the VPP platform provides wind/solar power generation and load forecasting information to the blockchain codes of green certificate trading, carbon trading, and electricity trading. The blockchain trading platforms then provide quota feedback based on this information, which is subject to review and verification by government regulatory authorities. Second, the VPP platform transmits transaction information to the green certificate trading platform, carbon trading platform, and electricity trading platform, while storing the transaction information in the main blockchain of the VPP. Finally, when transactions between VPPs are concluded, cross-chain trading is implemented via relay chains. Cross-chain transactions between VPPs can be achieved through the transaction platform using carbon trading relay chains and green certificate trading relay chains.
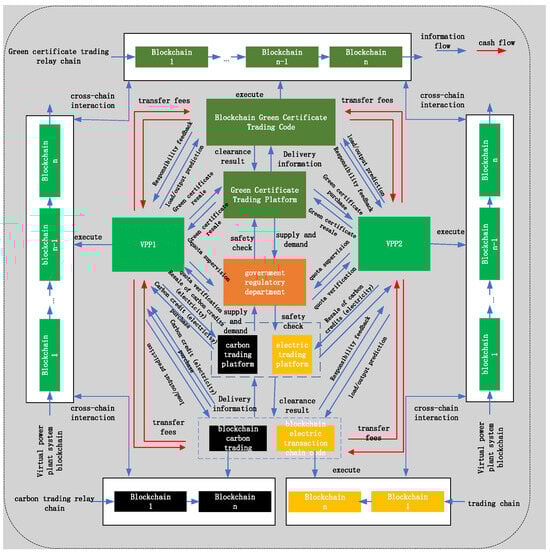
Figure 2.
Cross-chain transaction framework for multi-virtual power plants.
In the process of trading value, the carbon trading platform, green certificate trading platform, and electricity trading platform will show the supply and demand information on the blockchain, the green certificate and carbon trading, and trading electricity information in their respective relay chain to form a new chain code, whose information mainly contains the supply and demand information, and when the virtual power plant is traded from each platform to promote the transaction of the smart contract.
3. VPP Model for Cross-Chain Trading of Electricity/Carbon/Green Certificates
The virtual power plant model of the present invention mainly consists of a carbon capture power plant, a combined heat and power unit (CHP), a new energy generation unit, electric storage, and other devices. Through the carbon capture system, carbon dioxide emissions can be reduced more effectively within the virtual power plant. The structure diagram is shown below. The interaction between virtual power plants is shown in Figure 3.
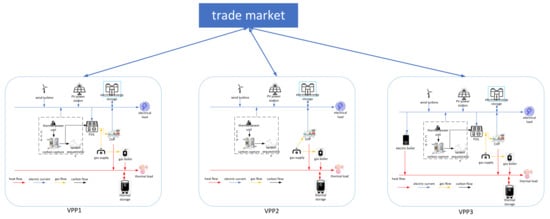
Figure 3.
VPP system architecture.
3.1. New Energy Output and Load Forecasting for Virtual Power Plants
This invention adopts the Latin Hypercube Sampling (LHS) method for scenario generation to address the uncertainty of new energy output and load forecasting. Compared with the Monte Carlo method, LHS can cause the generated scenarios to have a stratified distribution, and the data distribution is more extensive. The K-means method based on the particle swarm algorithm is then applied to reduce the scenarios to obtain the predicted values.
3.1.1. Based on LHS Scene Generation
As a method based on the principle of stratified sampling, LHS has the characteristic of spreading the sampling points evenly in the sampling space. It implements a random sampling operation for the wind power generation data and load data in different time periods of a day, firstly, assuming that the random variables of , , are input, where , are the forecast data of wind power generation and load in T time periods of a day; at the same time, , , are set as the inputs of any of the random variables, which results in the corresponding cumulative probability distributions as follows:
where , and denote the cumulative probability distribution function of WTG generation, PV generation, and electric load, respectively, and , and denote the historical load data of WTG generation, PV generation, and electric load, respectively.
The cumulative probability distribution function in the [0,1] interval is divided into N equally spaced non-overlapping spaces; N in this paper is taken as 1000 for analysis and the inverse function is obtained as:
Finally, a scenario set of scenic outputs and loads can be derived.
3.1.2. K-Means-Based Clustering Scenario Reduction
Given that the number of scenes generated by Latin Hypercube Sampling (LHS) is quite large, in order to reduce the complexity of the model computation and improve the accuracy of the computation, this paper adopts the K-means clustering method to perform the scene reduction work, which has the significant features of lower complexity and fewer input parameters. Firstly, a specific scene set is set, and the target scene tree is set to , the specific steps are as follows:
- First of all, select number of scenes as cluster centers, set the set of cluster centers as and as the sth initial scene cluster center.
- Determine the number of remaining scenes according to the set of cluster centers , and calculate the distance of the remaining scenes to the cluster centers , is the remaining scene data, is the cluster center data.
- According to the scene arrives at the cluster center clustering distance will be the remaining cluster center classified with the nearest cluster center, and again clustering to get the set of , where is the set of similar scenes.
- Update the cluster center, assuming that there are scenes in the scene clustering , calculate the sum of the distances between each scene and the other scenes as for the other scene data, for the cluster center data, and select for the scene as the new cluster center.
- Repeat steps 2, 3 until the cluster centers and cluster centers no longer change and scene cuts stop.
3.2. Virtual Power Plant Internal Model
3.2.1. CHP Unit Modeling
In this paper, the common back-pressure cogeneration unit is mainly selected as the simulation operation object, and its model is shown in Figure 4 and Equation (7).
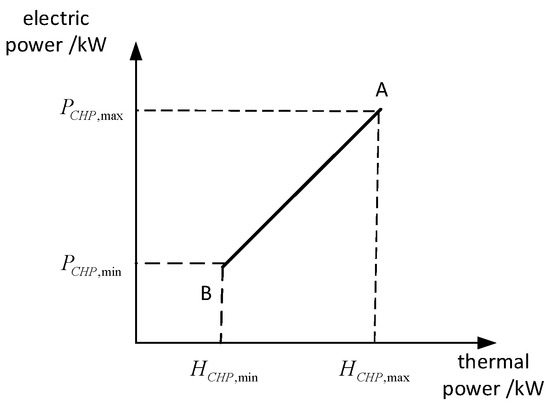
Figure 4.
Operational diagram of a back-pressure cogeneration unit.
The mathematical expression for a gas turbine is as follows:
where and are the electrical and thermal outputs of the CHP unit of virtual power plant l at time t, respectively; and are the electrical and thermal efficiencies of the CHP unit of virtual power plant l, respectively; is the natural gas consumed by the CHP unit of virtual power plant l at time t; and are the minimum and maximum values of the CHP electrical power of virtual power plant l, respectively; and are the lower and upper bounds on the thermal power generated by CHP in virtual power plant l, respectively; and are the upper and lower bounds on the creep of the CHP thermal power of virtual power plant l, respectively. and are the upper and lower limits of CHP unit electric power creep for virtual power plant l; and are the upper and lower limits of CHP thermal power creep for virtual power plant l, respectively.
3.2.2. Storage Model
3.2.3. New Energy Unit Output Constraints
3.2.4. Thermal Power Unit Output Constraints
3.2.5. Interaction Constraints with Electricity and Gas Networks
3.2.6. Gas Boilers
The gas boiler provides thermal power to the VPP with the following mathematical expression:
where is the thermal power output of the gas boiler at the time of ; is the natural gas power input to the gas boiler at the time of ; is the thermal power conversion efficiency of the gas boiler; are the upper and lower limits of the thermal power output of the gas boiler; are the upper and lower limits of the natural gas creep input to the gas boiler, respectively.
3.2.7. Carbon Capture Power Plants-Electricity to Gas
Carbon Capture Device
Carbon capture device power consumption consists of fixed power consumption and operational power consumption, which is modelled as shown below.
where is the energy consumption per unit of carbon dioxide captured; is the amount of carbon dioxide captured by the carbon capture device in the virtual power plant l at time t; is the power consumption of the carbon capture device in the virtual power plant l at time t; is the fixed energy consumption of the carbon capture device; and is the total power consumption of the carbon capture device in the virtual power plant l at time t.
Thermal Power Unit
In this invention, the thermal power plant plays a dual role: it is a major contributor to carbon emissions, and it is also the energy source that drives the carbon capture system. The power generated by the unit is split into two streams: one for the advanced carbon capture unit (ACCU), which captures and processes carbon dioxide to reduce environmental impacts; and the other for the other modules of the virtual power plant.
where is the exhaustive power output of the thermal unit of virtual power plant l at time t.
P2G Devices
Power-to-gas (P2G) plants are a key part of carbon dioxide processing, efficiently converting carbon dioxide into methane, a gas turbine feedstock for power generation. The methanation reaction, in which the volume of carbon dioxide consumed versus methane produced is 1:1, requires the addition of equilibrium constraints, as shown in the equation below:
where is the energy consumption of the P2G unit of virtual power plant l in generating methane gas at time t, is the P2G conversion efficiency of virtual power plant l; is the power of virtual power plant l in generating methane at time t, is the amount of carbon dioxide consumed by methanation of virtual power plant l at time t, is the density of carbon dioxide, is the calorific value per unit of methane, is the calorific value per unit of electricity converted, and is the amount of carbon dioxide sequestration in virtual power plant l at time t of the virtual power plant.
The virtual power plant’s power in the present invention is mainly supplied by CHP cogeneration units, carbon capture power plants, and new energy outlets, while the CHP units supply thermal energy.
where is the electrical load of virtual power plant l.
where is the heat load of virtual power plant l.
3.3. Carbon Trading
Carbon trading is mainly through the carbon trading platform to exchange carbon quotas to obtain the corresponding profit; the present invention works through blockchain technology to achieve virtual power plant cross-chain trading, not only to ensure the interaction between the virtual power plants, but also to improve the security of the transaction.
The main sources of carbon emissions in virtual power plants are mainly generated by conventional thermal power units and gas turbines, which produce carbon dioxide in the process of power generation, and the invention applies the government baseline method for carbon allowance allocation.
where is the carbon emission allowance of the virtual power plant l at the time of t, is the carbon emission allowance obtained by the CHP unit for electricity supply, is the carbon emission allowance obtained by the CHP unit for heat supply, is the carbon emission allowance obtained by the coal-fired unit of the carbon capture plant for electricity supply, and is the carbon emission allowance obtained by the unit of the gas boiler for heat supply.
Actual carbon emissions from virtual power plants can be expressed as:
where is the actual carbon emissions of virtual power plant l at the time of t, is the actual carbon emissions of CHP unit of electricity generation, is the actual carbon emissions of CHP unit of heat generation, is the actual carbon emissions of carbon capture power plant of virtual power plant l, is the carbon emissions of purchasing unit of electricity from the grid, and is the carbon emissions of a gas boiler unit of heat supply.
Then the virtual power plant carbon trading cost can be expressed as:
where is the carbon trading cost of virtual power plant l, and is the carbon trading price.
Carbon trading prices are mainly determined by supply and demand in the trading market and can be expressed as follows:
where and denote the coefficient of variation of carbon trading tariffs, respectively.
3.4. Green Certificate Trading Model
In order to encourage new energy generation, governments have proposed the new energy quota methodology, which favors new energy consumption on the one hand and new energy generation on the other. For the concept, the idea of green certificate trading was proposed. It is assumed that when a new energy-generating unit produces one unit of electricity, it can obtain one unit of green certificate.
The number of green certificates that can be sold for new energy output units for:
where is the green certificate quota factor.
The number of green certificates to be purchased for a conventional generator set can be expressed as:
As the green certificate trading price is affected by the green certificate trading price, the trend of the green certificate price change is represented through a linear representation.
where and denote the coefficient of variation of the price of green certificates, and is the market price of green certificates.
3.5. Electricity Market
As with the carbon and green certificate trading markets, electricity market prices are subject to market changes and show a linear trend. This is shown below.
where and denote the coefficient of variation of the electricity transaction price, and denotes the electricity transaction price.
(1) Objective function
The present invention aims to minimize the operating costs of the virtual power plant, which comprises carbon trading costs, green certificate trading costs, electricity trading costs, and internal operation and maintenance costs of the virtual power plant.
where is the maintenance cost of electric energy storage in virtual power plant l; is the maintenance cost of a new energy unit in virtual power plant l; is the cost of purchased natural gas in virtual power plant l; is the fuel cost of a thermal power unit in virtual power plant l.
- (1)
- Green certificate transaction costs:
- (2)
- Energy storage maintenance costs:where is the maintenance cost factor for virtual power plant l electric energy storage.
- (3)
- Fuel costs for thermal power units:where , , are fuel cost coefficients for thermal power units.
- (4)
- Gas purchase costs:where is the price of natural gas.
- (5)
- Maintenance costs of new energy units:where and are the maintenance cost coefficients of the PV and WT units of the virtual power plant l, respectively.
- (6)
- Electricity transaction costs:
4. Example Analysis
In order to verify the validity of the model developed in this paper, the VPP system in the paper includes a wind turbine, a PV plant, a CHP unit, a carbon capture power plant, a gas boiler, and an electric-to-gas conversion unit, and it also includes thermal and electric energy storage devices. The data for each equipment is shown in Table 1. In this paper, three virtual power plants are selected for analysis, the parameters of each model in these virtual power plants are consistent, virtual power plant 2 is less than virtual power plant 1 than an electric to gas device, virtual power plant 3 is more than virtual power plant 1 than an electric boiler, its wind and light output and load data are shown in Appendix B. where Table 2 shows the time-of-day electricity prices for interaction with the main grid and Table 3 shows the time-of-day gas prices for interaction with the gas grid. The energy meanings of the letters in the formulas are shown in the table in Appendix A. The new energy output and load data of Virtual Power Plant 2 and Virtual Power Plant 3 are shown in Figure A1 and Figure A2 of Appendix B.

Table 1.
Parameters of each model of VPP.
Table 2.
Time-of-day tariffs.
Table 3.
Time-of-day gas prices.
4.1. New Energy Output and Load Forecast
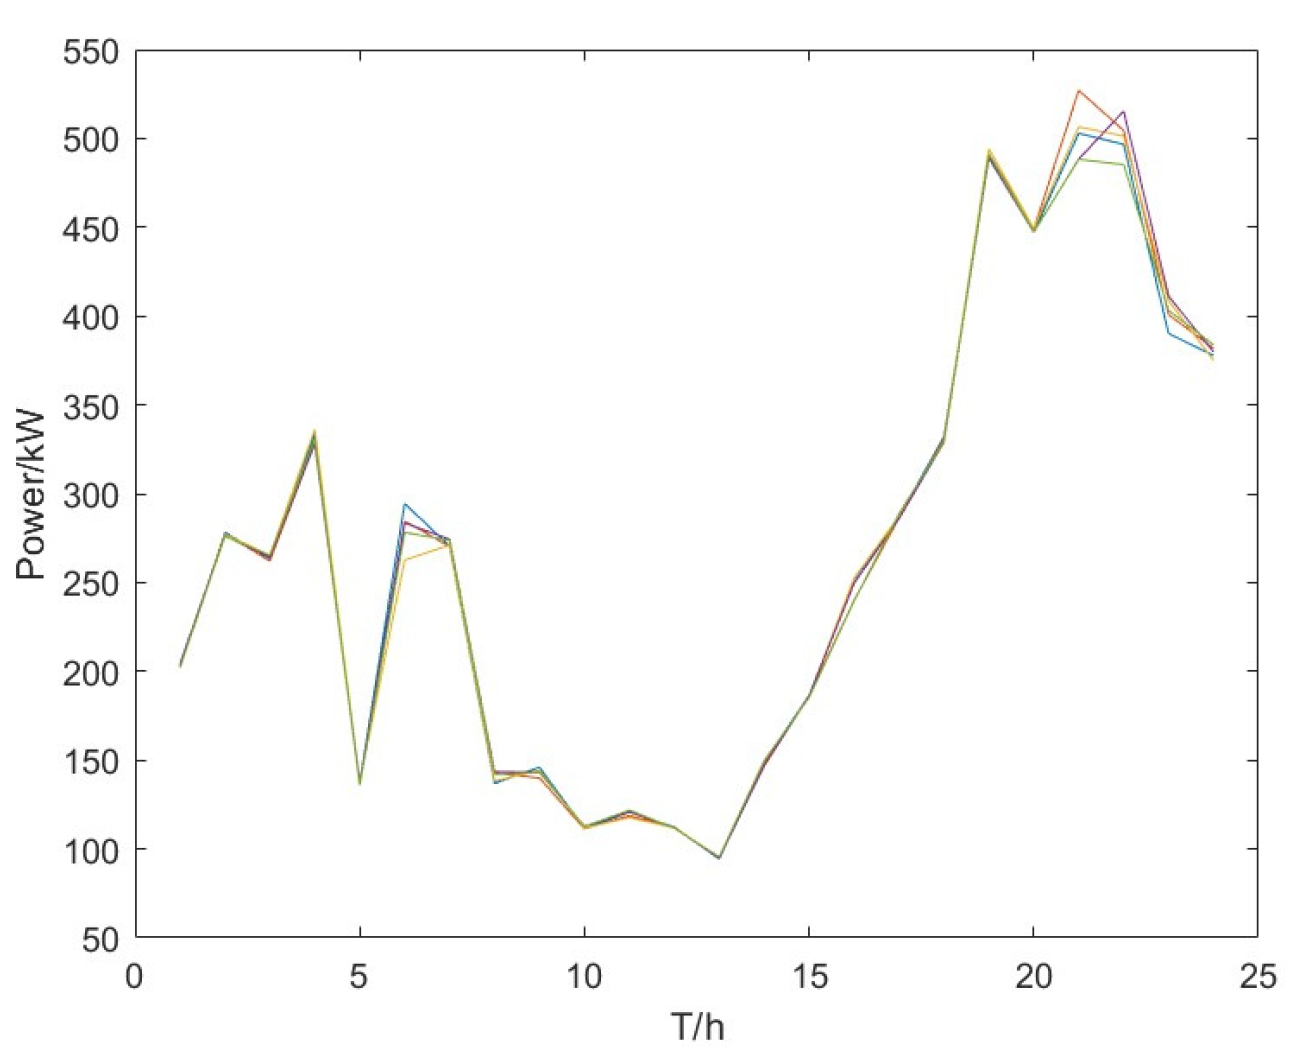
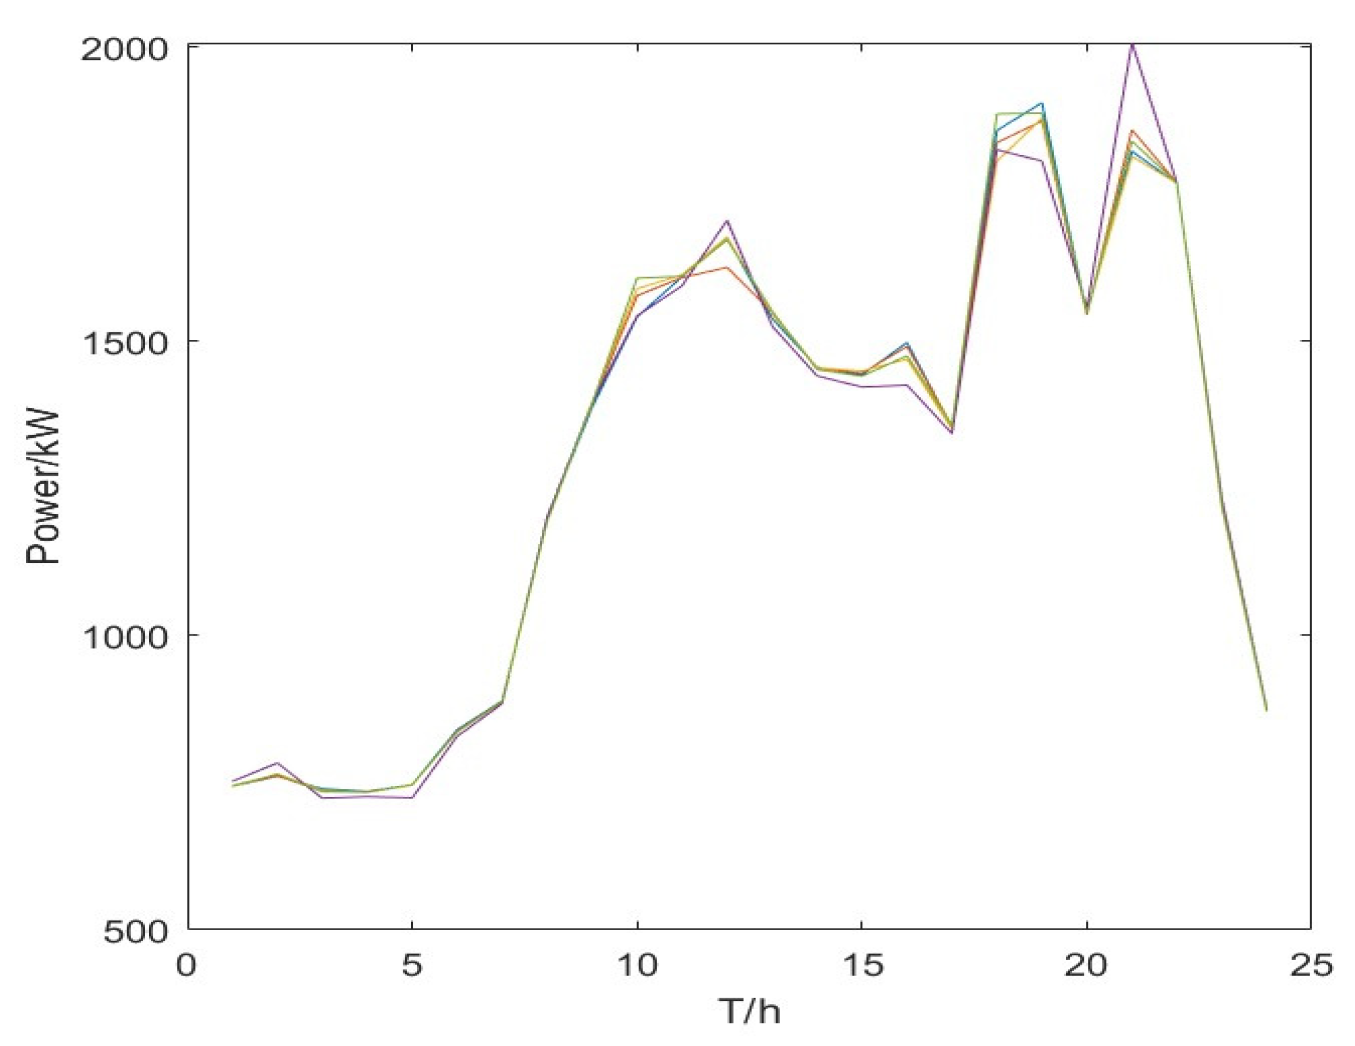
This article has taken the example of virtual power plant 1, based on the new energy output data is less, first of all, we use super Latin cube sampling to generate 500 scenarios for new energy output and load, and then we use K-means clustering to obtain 5 typical scenarios to predict and analyze the new energy output according to the proportion of the typical scenarios. The prediction results are shown in Figure 5, Figure 6 and Figure 7. The percentages of the five categories of wind power and load scenarios are shown in Table 4.
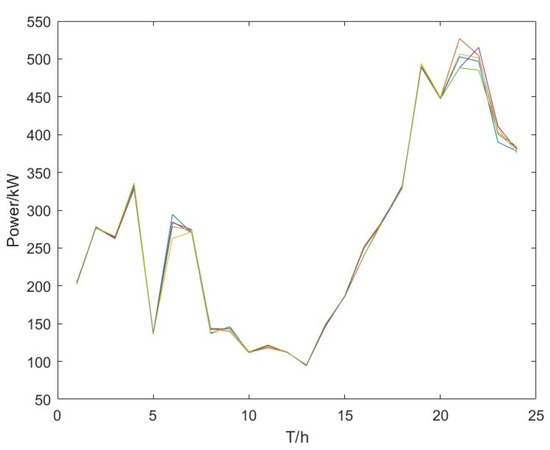
Figure 5.
Map of WTG reduction results.
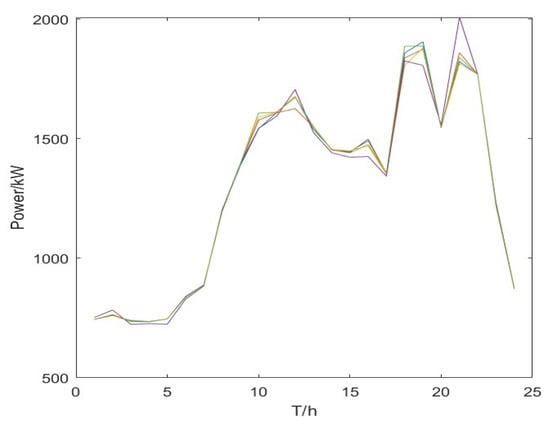
Figure 6.
Graph of electrical load reduction results.
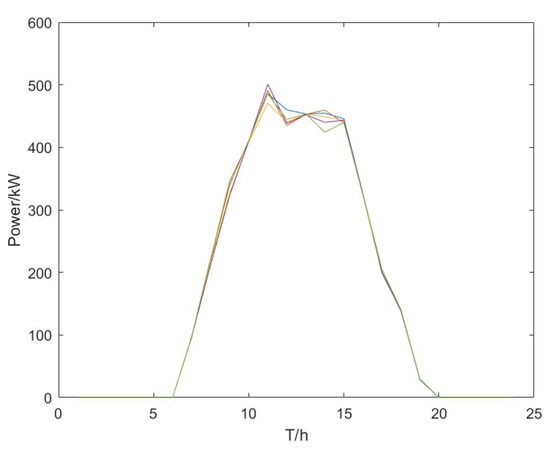
Figure 7.
Graph of the results of the reduction of photovoltaic power plants.
Table 4.
Analysis of prediction probabilities for different scenarios.
The weighted summation of the above scenarios yields the new energy forecast and load forecast map of this paper, as shown in Figure 8 [27,28].
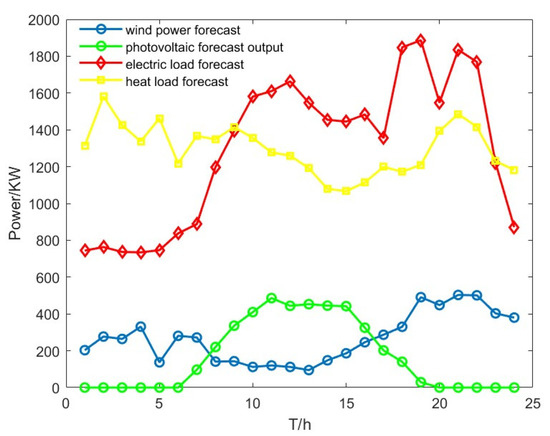
Figure 8.
VPP1 New energy output and load.
4.2. Comparative Analysis of Uncertainty Methods
For comparison, in this paper, virtual power plant 1 is analyzed for new energy output and load uncertainty analysis. This paper verifies the validity of the model by setting up three scenarios. Scenario 1 is generated by the Monte Carlo method for the scenario and clustered by K-means, Scenario 2 is a robust model for uncertainty analysis, and Scenario 3 is the analytical model of this paper. This result is shown in Table 5.
Table 5.
Comparison of new energy output and load uncertainty.
This study evaluates the operational performance of a virtual power plant under three scenarios. Scenario 1 (Monte Carlo + K-means clustering) yields a total cost of 17,186.45, 1.54 tons of carbon emissions, and 97.24% renewable energy utilization. Scenario 2 (robust model) exhibits the highest total cost (17,864.78) but achieves the lowest carbon emissions (1.41 tons) and the highest renewable energy utilization (98.86%). Scenario 3 (proposed model) demonstrates the lowest total cost (16,953.49), with carbon emissions (1.43 tons) and renewable energy utilization (98.75%) close to Scenario 2. The results indicate that Scenario 3 reduces total costs by 4.9% (compared to Scenario 2) and carbon emissions by 7.1% (compared to Scenario 1), while improving renewable energy utilization by 1.51% over Scenario 1, thereby validating the superiority of the proposed model in balancing economic and environmental objectives.
4.3. Comparative Analysis of Operating Results
In order to fully analyze this paper’s electric carbon and green certificate trading model, this paper sets up four scenarios to be analyzed. Scenario 1 is the virtual power plant operation model without considering carbon trading and green certificate trading. Scenario 2 is the virtual power plant operation model considering only carbon trading. Scenario 3 is a virtual power plant operation and trading model that only considers green certificate trading. Scenario 4 is the green certificate trading model proposed in this paper, which contains carbon and green certificate trading. The results of the trading scenarios for each of the different types of markets are shown in Table 6.
Table 6.
Scheduling results for each scene on the previous day.
Scenario 2 compared with Scenario 1: After introducing the carbon market mechanism, by adjusting the unit mix and power allocation, the carbon emission intensity is reduced to 1.51 tons per 10,000 CNY, which is 8.5% lower than Scenario 1, and the new energy consumption rate is increased to 93.45%. However, the cost of carbon trading reaches RMB 1875.46, which increases the total cost to RMB 14,576.47. Scenario 3 compared with Scenario 1: When implementing green certificate trading alone, the virtual power plant obtains green certificate income by increasing the proportion of new energy generation, and the rate of new energy consumption is further increased to 96.23%, but the carbon intensity is still 1.54 tons/10,000 CNY. Although the revenue of 104.7214 million CNY from green certificate trading partially offsets the cost, the total cost is still as high as 150.7418 million CNY. Scenario 4 of the model proposed in this paper, through the synergistic optimisation of carbon trading and green certificate trading, achieves the remarkable effect of “double reduction and one increase”. The carbon emission intensity is reduced to 1.43 tons/10,000 CNY compared with Scenario 1, the rate of new energy consumption breaks through 98% to reach 98.75%, and at the same time, 1838.25 CNY of revenue is gained through carbon trading. Although the income from electricity trading decreases (38.218 million CNY), the total cost is controlled at 169.5349 million CNY by the comprehensive income, which achieves the Pareto improvement of environmental and economic benefits. Through the design of multi-market coupling, the model in this paper has significant advantages in environmental benefits and new energy consumption, which provides theoretical support and practical reference for virtual power plants to participate in a low-carbon power system.
4.4. Analysis of Operational Results
4.4.1. Operational Impact of Quota Factors
In this subsection, in order to explore the influence of carbon quota coefficient and green certificate quota coefficient on the operation results, the carbon quota coefficient is taken as 0.1~0.8, with a step size of 0.1; the green certificate quota coefficient is taken as 10 percent~90 percent, with a step size of 5 percent, which results in the changes in carbon emissions under different quota coefficients, as shown in Figure 8.
From Figure 9, it can be seen that when the carbon quota coefficient decreases when high-emission units of coal-fired units need to buy more carbon allowances, in order to reduce the operating costs of generating units can only be reduced through the reduction of power generation to reduce the cost, and therefore the ensuing overall decline in carbon emissions. When the green certificate quota coefficient increases, the new energy consumption rate increases and carbon emissions decrease.
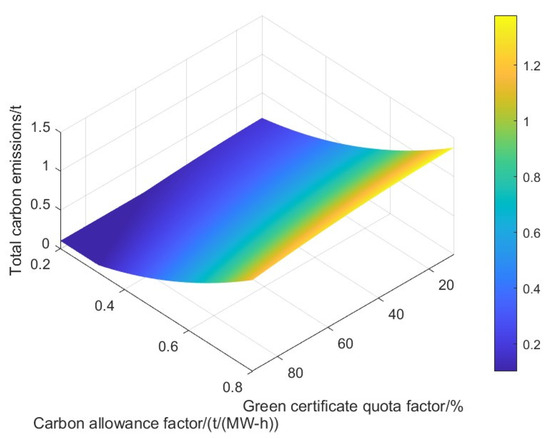
Figure 9.
Impact of quota factors on carbon emissions.
4.4.2. Analysis of System Operation Results
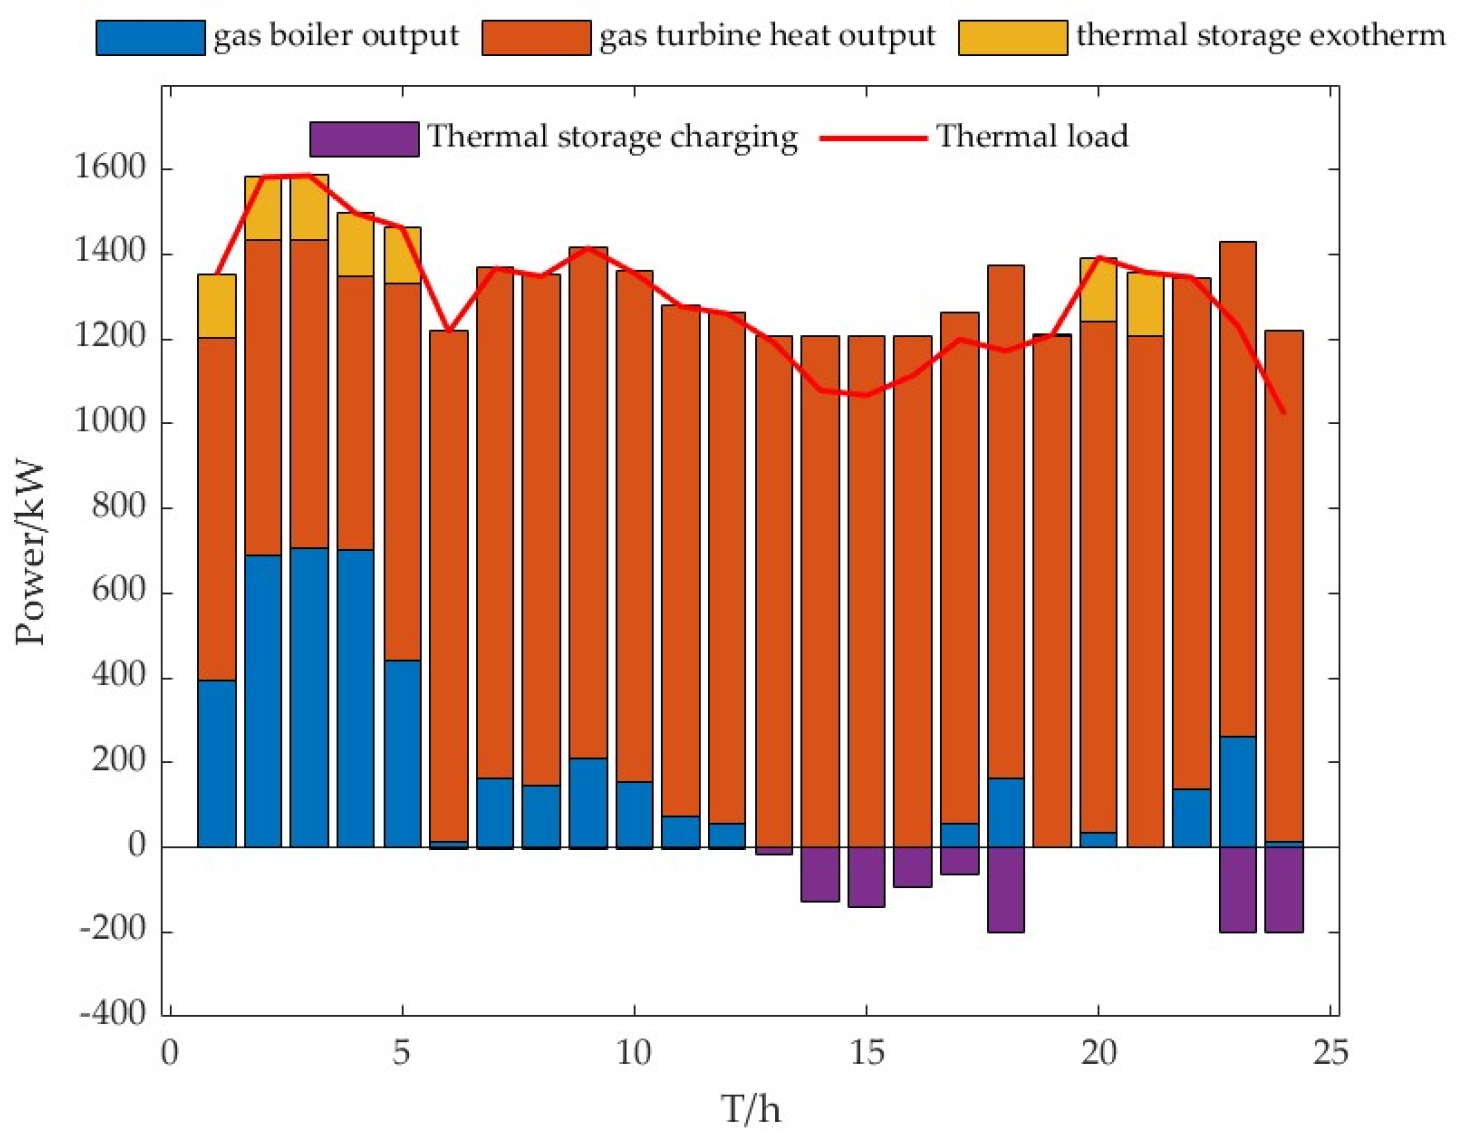
In this paper, the carbon quota coefficient is taken as 0.25, and the green certificate quota coefficient is 80%. The analysis of its operation results is shown in Figure 10. In the 0–5 time period of grid operation, the electricity price is low and the wind turbine generates a large amount of electricity, so the energy storage is charged at this moment, and at this time, the thermal power demand is more gas turbine to provide thermal power, thermal energy storage is discharged, the gas boiler and gas turbine to provide thermal power demand, and in the peak time 6–12 h the system will be sold to gain revenue from the electricity, and at the same time, the electric storage is discharged at this time, and at this time, the thermal storage is discharged. During the peak hours of 6–12, the system sells the power for profit, and the storage is discharged during this time, while the thermal power demand of the virtual plant decreases during this time, and the storage is recharged. During the usual hours 13–16, the electric storage is charged to cope with the arrival of the next peak hour, and during the evening peak hours 17–22, the electric storage is discharged to support the power, while the thermal demand is constantly having more thermal storage for heat discharge. The power and heat power balance operation diagram is shown in Figure 10 and Figure 11.
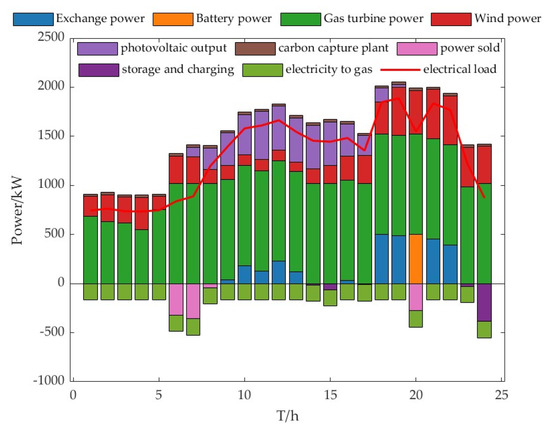
Figure 10.
Virtual power plant electric power balance diagram.
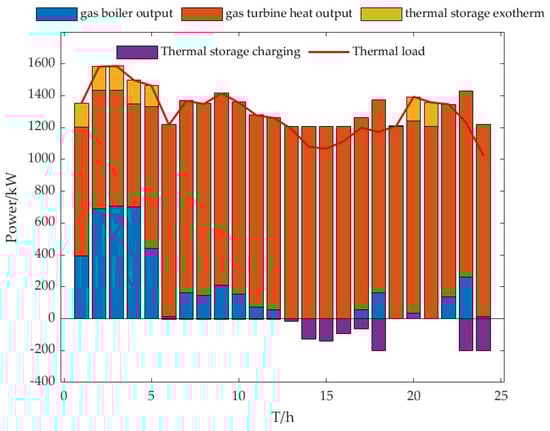
Figure 11.
Thermal power balance of a virtual power plant.
4.5. Interaction Analysis Between Different Virtual Power Plants
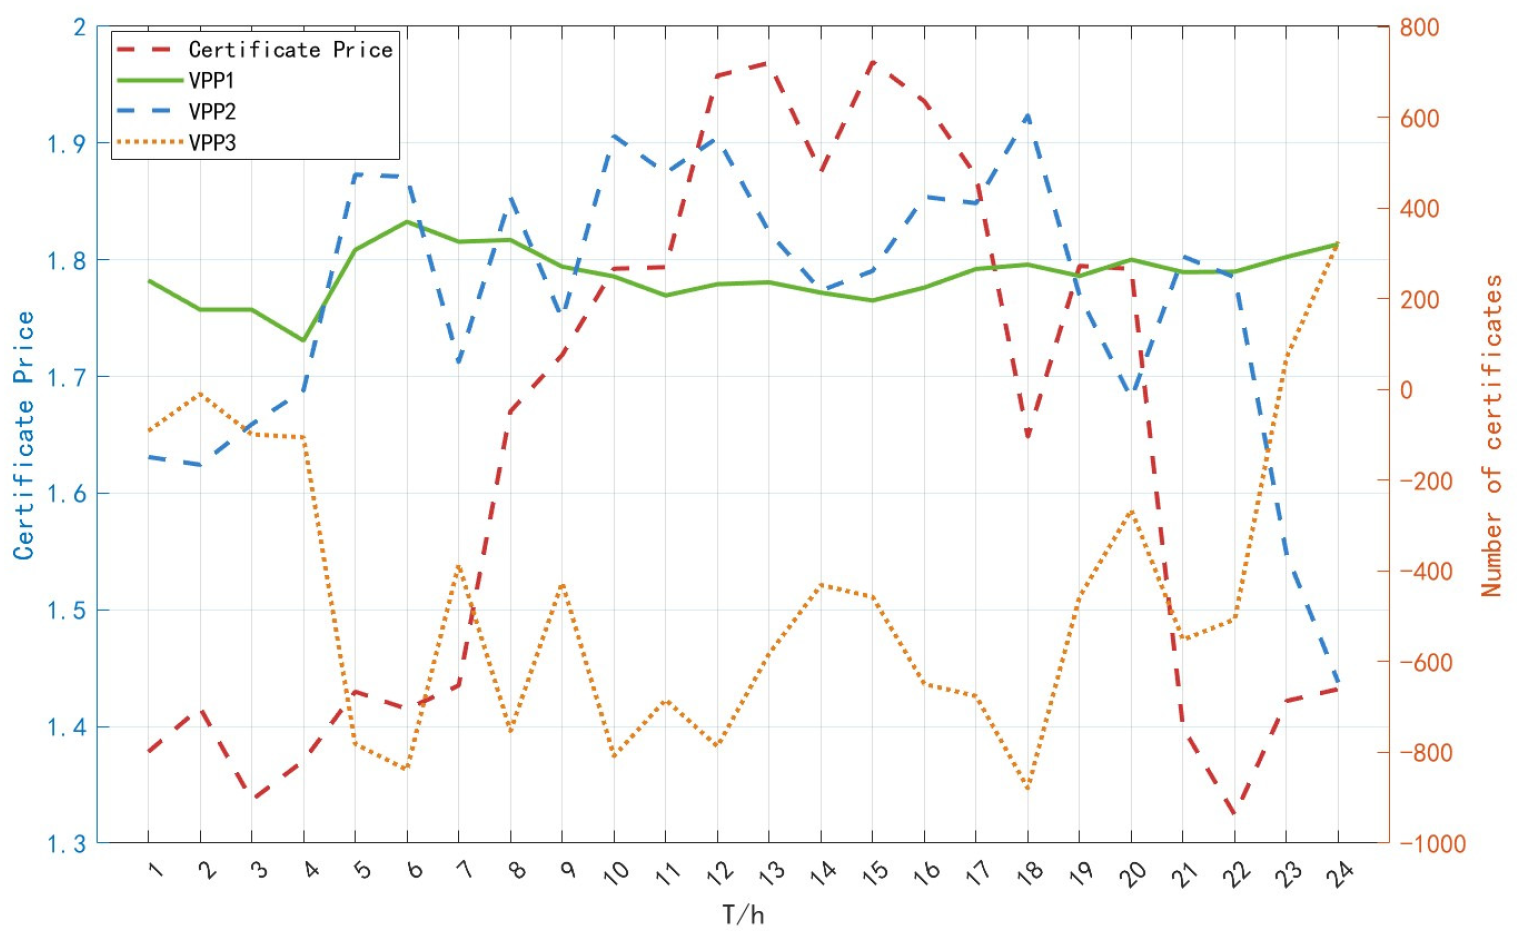
In order to fully analyze the interaction between different virtual power plants through the blockchain, this paper introduces three virtual power plants for analysis, and the electricity/carbon/green certificate interaction is shown in Figure 12, Figure 13 and Figure 14.
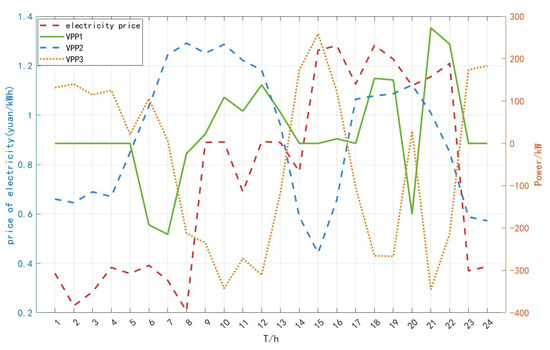
Figure 12.
Electric power interaction between virtual power plants.
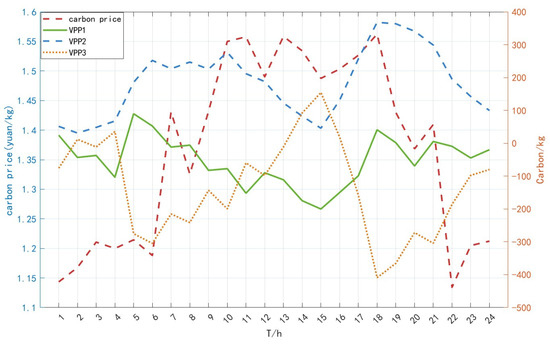
Figure 13.
Carbon interaction between virtual power plants.
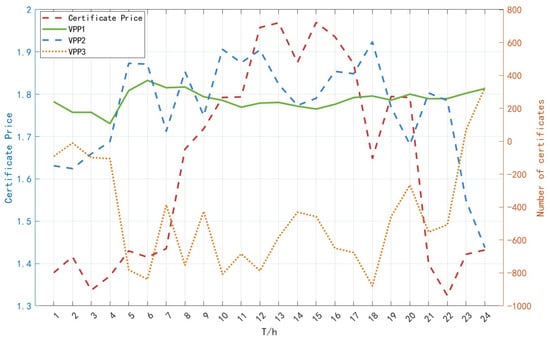
Figure 14.
Green certificate interaction between virtual power plants.
As shown in Figure 12, virtual power plant 1 and virtual power plant 2, due to the new energy output compared to virtual power plant 3, is less when the peak hours of new energy output and traditional output can not provide sufficient support, so in the peak hours more enery is purchased, and virtual power plant 3 sells power to gain revenue.
As shown in Figure 13, the carbon price increases with the arrival of peak electricity consumption, while carbon allowances are mainly rationed for conventional units to generate electricity, although the virtual power plant 1 and virtual power plant 2, due to the new energy output, is less compared to virtual power plant 3, but when the gas turbine pollution uses less units to generate electricity, it rewards a portion of the carbon allowances, so compared to virtual power plant 3, its carbon sale quantity is more.
As shown in Figure 14, the price of green certificates is positively correlated with electricity consumption. To increase new energy consumption, virtual power plant 1 and virtual power plant 2, due to the new energy output being less compared to virtual power plant 3 and virtual power plant 1’s new energy output is much smaller than the traditional unit output, so virtual power plant 1 mainly buys from the green certificate market, while virtual power plant 3’s new energy installed capacity is large, which is mainly based on the sale of green certificates.
5. Conclusions
This paper proposes a cross-chain trading strategy for electricity/carbon/green certificate virtual power plant blockchain, which, on one hand, protects the privacy of the virtual power plant transaction, and on the other hand, a less systematic carbon emission and improves the new energy consumption, and its conclusions are shown as follows.
- (1)
- This paper introduces relay blocks for an electricity/carbon/green certificate virtual power plant trading electricity trading chain, green certificate trading chain, and carbon trading chain to protect users’ cross-chain trading privacy information. Currently, however, the electricity/carbon/green certificate markets are under different regulatory regimes, and conflicting cross-market rules may lead to trading frictions. Artificial intelligence can be introduced to fully analyze the mechanisms and policies of each market to formulate real-time trading strategies.
- (2)
- The coupled electricity/carbon/green certificate trading model proposed in this paper effectively reduces carbon emissions by 8.5 percent compared with the carbon emissions without carbon/green certificate trading, and the rate of new energy consumption rises by 8.59 percent; it effectively improves the consumption of new energy and reduces carbon emissions.
- (3)
- This paper concludes that carbon emissions are lower when the carbon quota coefficient decreases, and carbon emissions are lower when the green certificate quota coefficient increases and the new energy consumption rate increases.
Author Contributions
C.Z.: Presentation of the thesis framework. W.H.: Designing cross-chain transactions and writing paper introductions. S.Z.: Design of virtual power plant models. K.P.: Design of Electricity/Carbon/Green Certificates Trading Indicators and Programs. X.H.: Design of wind power and load uncertainty description methods. X.L.: Collection of relevant materials and data. S.S.: Preparation of case studies. C.S.: Validates and assists in the preparation of the thesis calculus. Q.A.: Comment on and guide the revision of the paper. All authors have read and agreed to the published version of the manuscript.
Funding
Research and demonstration of key technology of virtual power plant for distributed energy multi-participant cooperative gaming. (202302AF080006). Research on Key Technologies for Cooperative Operation of Virtual Power Plants with Multi-Participants Cooperative Gaming. (YNKJXM20240051).
Data Availability Statement
The data used in this article are given in detail in the article for the reader’s reference.
Acknowledgments
The authors are extremely grateful to each of the authors who have helped and contributed to this paper. It is their joint efforts that enablrd this paper to be successfully published.
Conflicts of Interest
Authors Chao Zheng and Suwei Zhai were employed by the company Yunnan Power Dispatching Control Center, Yunnan Power Grid Co., Ltd. Author Wei Huang was employed by the company Kunming Power Dispatching Control Center, Kunming Power Supply Bureau, Yunnan Power Grid Co., Ltd. Authors Kaiyan Pan and Xiaojie Liu were employed by the company Dongfang Electronics Cooperation. Authors Xuehao He and Shi Su were employed by the company Electric Power Research Institute of China Southern Power Grid Yunnan Power Grid Co., Ltd. The remaining authors declare that the research was conducted in the absence of any commercial or financial relationships that could be construed as a potential conflict of interest.
Appendix A
Table A1.
Letter Meaning.
Table A1.
Letter Meaning.
| Letter | Meaning |
|---|---|
| electrical energy | |
| heat energy | |
| natural gas | |
| carbon energy |
Appendix B
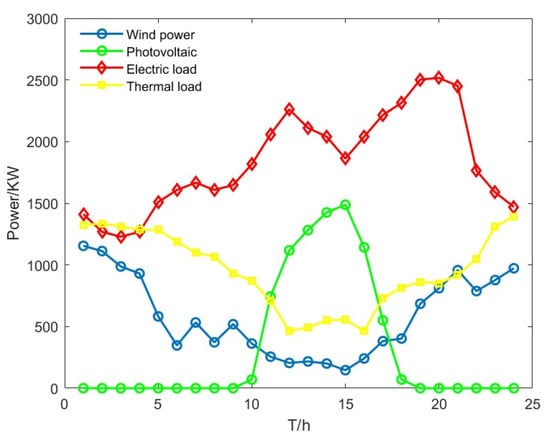
Figure A1.
Virtual Power Plant 2 New Energy Forecast and Load.
Figure A1.
Virtual Power Plant 2 New Energy Forecast and Load.
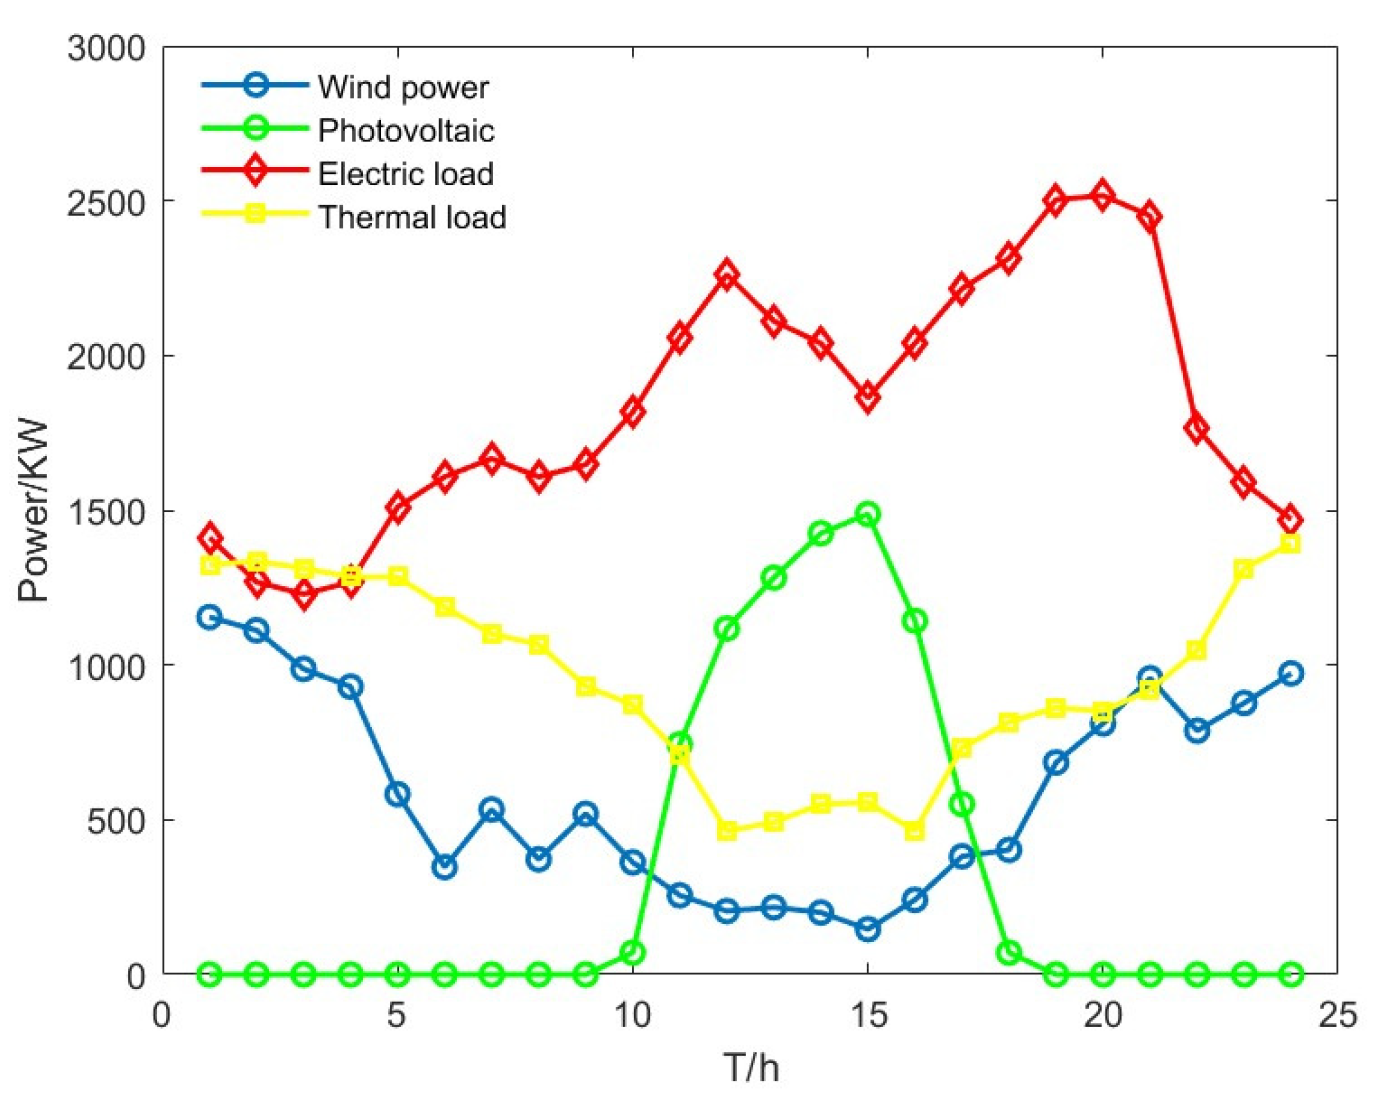
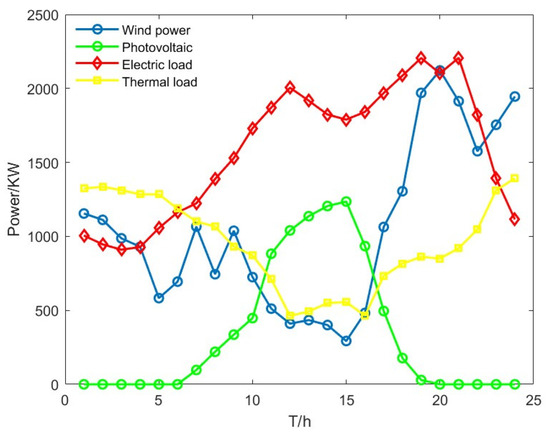
Figure A2.
Virtual Power Plant 3 New Energy Forecast and Load.
Figure A2.
Virtual Power Plant 3 New Energy Forecast and Load.

References
- Guang, F.; Deng, Y.; Luo, Y. Research on the influence effect of electric power technology progress on regional carbon emission performance and the mechanism of action. J. Jiangsu Univ. (Soc. Sci. Ed.) 2025, 27, 40–51. [Google Scholar]
- Wang, M. The Concept, Reality and Development of “Double Carbon” Industry Chain Digital Intelligence Transformation. Account. Newsl. 2025, 6, 20–28. [Google Scholar]
- Li, L. Study on the Impact of Developing Digital Economy on Urban Carbon Emission and Green Economy Transition. China Collect. Econ. 2025, 7, 29–32. [Google Scholar]
- Liao, P.S. Optimisation of Microgrid Operation Considering Carbon Right-Green Certificate Linkage Mechanism Under Blockchain Technology. Master’s Thesis, Guangxi University, Nanning, China, 2024. [Google Scholar]
- Yi, Z.; Hou, L.; Xu, Y.; Wu, Y.; Li, Z.; Wu, J.; Feng, T.; Han, L. A review of key technologies for virtual power plant aggregation and regulation of flexibility resources under market environment. China Electr. Power 2024, 57, 82–96. [Google Scholar]
- Wang, D.; Ai, Q.; Yu, T.; Zuo, J.; Lu, Y.; Li, J. Technical difficulties and solutions for trusted transactions in virtual power plants. Power Syst. Autom. 2025, 1–18. Available online: http://kns.cnki.net/kcms/detail/32.1180.TP.20241030.1550.006.html (accessed on 25 June 2025).
- Tian, B.Y.; Liu, Q.R.; Chang, X.Q.; Qi, H.Y.; Wen, Y.L.; Xu, H.Q. Design of joint trading market mechanism for carbon emission rights and green certificates based on blockchain carbon pass-through. Power Demand Side Manag. 2024, 26, 87–94. [Google Scholar]
- Hu, W.; Xia, X. A cross-chain trading model for carbon emission rights in energy blockchain electricity. J. Syst. Manag. 2023, 32, 64–72. [Google Scholar]
- Luo, Z.; Qin, J.; Liang, J.; Zhao, M.; Wang, H.; Liu, K. Optimisation of integrated energy system operation with green certificate cross-chain trading. Grid Technol. 2021, 45, 1311–1320. [Google Scholar]
- Yang, Z. A peer-to-peer energy security transaction model based on cross-chain technology. Yunnan Power Technol. 2022, 50, 47–55. [Google Scholar]
- Xenophon, A.; Hill, D. Adaptive mechanisms to refund emissions payments. Appl. Energy 2020, 278, 115689. [Google Scholar] [CrossRef]
- Agnieszka, W.; Katarzyna, L.; Paula, P. Antecedents of young adults’ willingness to support brands investing in renewable energy sources. Renew. Energy 2022, 190, 177–187. [Google Scholar]
- Wang, X.; Wang, S.; Zhang, S. Multi-market game analysis of new energy power producers’ bidding competition under the coupling of electricity-carbon-green certificate trading. Grid Technol. 2024, 48, 4125–4138. [Google Scholar]
- Song, C.; Meng, W.; Xing, B.; Shi, C.; Wang, Q.; Xia, D.; Nie, Y.; Yi, G.; Zhang, C.; Xia, H. Efficient removal of heavy metals from aqueous solutions by Mg/Fe bimetallic oxide-modified biochar. Experiments and DFT investigations. J. Clean. Prod. 2023, 136821, 0959–6526. [Google Scholar]
- Li, Y.-W.; Zhang, S.-X.; Yang, C.; Liu, Y.; Du, E.; Fan, L.; Zhang, N. A real-time electricity consumption carbon accounting method considering green power and green certificate trading. Chin. J. Electr. Eng. 2024, 1–12. Available online: http://kns.cnki.net/kcms/detail/11.2107.tm.20240828.1525.008.html (accessed on 25 June 2025). [CrossRef]
- Barrera-Santana, J.; Marrero, G.A.; Ramos-Real, F.J. Income, energy and the role of energy efficiency governance. Energy Econ. 2022, 108, 105882. [Google Scholar] [CrossRef]
- Luo, Z.; Geng, J.; Li, B.; Zhao, W.; Luo, M.; Ma, R. Robust optimal scheduling of virtual power plant distribution considering carbon-green certificate trading mechanism. Electr. Power Constr. 2023, 44, 137–148. [Google Scholar]
- Mohammed, K.; Ali, S.; Salah, K.; Kim, J. An effective design of hybrid renewable energy system using an improved Archimedes Optimisation Algorithm: Acase study of Farafra, Egypt. Energy Convers. Manag. 2023, 116907, 0196–8904. [Google Scholar]
- Wang, J.; Zhang, X. Research on carbon price interval prediction based on the combination of hybrid quantile and time-varying weights. China Manag. Sci. 2025, 1–12. [Google Scholar] [CrossRef]
- Pan, J.; Cai, C.; Zhang, H. A cross-domain authentication scheme for electric vehicle V2G based on federation chain and edge computing. Automot. Technol. 2025, 2, 71–76. [Google Scholar]
- Qiao, P. Application and promotion strategy of blockchain technology in energy trading market. China Econ. Trade Rev. 2025, 4, 13–15. [Google Scholar]
- Xue, J.; Liu, L.; Li, F.; Zhang, W.; Zhang, X.; Zhou, Y. Bilateral privacy-preserving multi-party computation scheme for energy trading. J. Cryptogr. 2025, 12, 96–116, (In Chinese and English). [Google Scholar]
- Danish, S.M.; Zhang, K.; Amara, F.; Cepeda, J.C.; Vasquez, L.F.; Marynowski, T. Blockchain for Energy Credits and Certificates: A Comprehensive Review. IEEE Trans. Sustain. Comput. 2024, 9, 727–739. [Google Scholar] [CrossRef]
- Zhang, T.Y.; Feng, T.T.; Cui, M.L. Smart contract design and process optimization of carbon trading based on blockchain: The case of China’s electric power sector. J. Clean. Prod. 2023, 397, 136509. [Google Scholar] [CrossRef]
- Giannos, O.D.P. Towards Energy Transition: Use of Blockchain in Renewable Certificates to Support Sustainability Commitments. Sustainability 2023, 15, 258. [Google Scholar]
- Ning, B.; Zhang, H.; Guo, J.; Zhang, S.; Liu, Z.; Ma, Q. Research on Green Electricity Certificate Trading Based on Alliance Blockchain. In Proceedings of the 2nd International Conference on Information, Control and Automation, Chongqing, China, 2–4 December 2022. [Google Scholar]
- Cao, Y.; Guo, X.; Dong, H.; Wang, L.; Zeng, M. Optimization of regional integrated energy system taking into account the weight of consumption responsibility. J. North China Electr. Power Univ. (Nat. Sci. Ed.) 2022, 49, 84–95. [Google Scholar]
- Qiu, B.; Song, S.; Wang, K.; Yang, Z. Optimized operation of regional integrated energy system taking into account demand response and stepped carbon trading mechanism. J. Power Syst. Autom. 2022, 34, 87–95. [Google Scholar]


Disclaimer/Publisher’s Note: The statements, opinions and data contained in all publications are solely those of the individual author(s) and contributor(s) and not of MDPI and/or the editor(s). MDPI and/or the editor(s) disclaim responsibility for any injury to people or property resulting from any ideas, methods, instructions or products referred to in the content. |
© 2025 by the authors. Licensee MDPI, Basel, Switzerland. This article is an open access article distributed under the terms and conditions of the Creative Commons Attribution (CC BY) license (https://creativecommons.org/licenses/by/4.0/).