Abstract
In this paper, the aerodynamic performance of an improved hybrid vertical-axis wind turbine is investigated, and the performance of the hybrid turbine at high tip–speed ratios is significantly enhanced by adding a spoiler at the end of the inner rotor. The improved design increases the average torque coefficient by 7.4% and the peak power coefficient by 32.4%, which effectively solves the problem of power loss due to the negative torque of the inner rotor in the conventional hybrid turbine at high TSR; the spoiler improves the performance of the outer rotor in the wake region by optimizing the airflow distribution, reducing the counter-pressure differential, lowering the inner rotor drag and at the same time attenuating the wake turbulence intensity. The study verifies the validity of the design through 2D CFD simulation, and provides a new idea for the optimization of hybrid wind turbines, which is especially suitable for low wind speed and complex terrain environments, and is of great significance for the promotion of renewable energy technology development.
Keywords:
hybrids; wind turbines; spoiler; self-starts; CFD; renewable energy; performance improvement 1. Introduction
It is widely acknowledged that energy resources play a crucial role in the global economy and the progress of human society. Moreover, they act as the main driving force behind modern industry and civilization. However, over the centuries, humans have become overly reliant and consumed large amounts of traditional fossil fuels and gas. This excessive use has pushed humanity into crises of energy security and ecological safety [1]. Faced with these global challenges, it is clear that the current global situation underscores the pressing need for nations to accelerate the development and use of renewable energy sources. This push is not only motivated by the need to tackle the current energy crisis but also because it serves as a vital method for achieving sustainable development and easing environmental pressures [2].
Wind energy is one of the most promising sources within the realm of renewable energy options. This stems from its plentiful supply, cleanliness, absence of pollution, and broad distribution across diverse regions. The primary application of wind energy is in the production of electricity. A crucial device for transforming wind energy into electricity is the wind turbine. Progress in wind turbine technology and its level of application are key factors in determining the efficiency of wind energy utilization [3,4]. The main methods for harnessing wind energy are vertical axis wind turbines and horizontal axis wind turbines [5]. Currently, horizontal-axis wind turbines are the most widely used type. With a rotation axis parallel to the ground, these turbines efficiently convert wind energy and are backed by established technology. As a result, they are often utilized in large-scale wind farms.
Vertical axis wind turbines (VAWTs), in contrast, have a rotation axis that is perpendicular to the ground [6]. These turbines are recognized for their simple structure, strong adaptability, and unique application potential, especially in low-wind-speed environments and complex terrains [7]. Vertical axis wind turbines function silently, are unaffected by wind direction, and provide simple installation and upkeep. They perform efficiently even at low wind speeds and in high turbulence [8,9].
Among these, the lift-type Darrieus vertical axis wind turbine exhibits better performance than other designs in this category. However, it exhibits low starting torque and faces challenges with self-starting. Gao Qiang and colleagues [10] presented a new hybrid wind turbine blade design that integrates variable structure, lift, and resistance. This design modifies the conventional NACA0018 airfoil blade of a wind turbine by substituting the straight blade with a folding configuration. Consequently, the wind turbine adopts a drag-type structure at lower wind speeds, improving its self-starting ability. As the rotational speed increases, the system shifts to accommodate a lift-type structure according to operational needs. However, this deformed structure increases the design difficulty and manufacturing cost relative to the structure proposed in this paper. Haijie Zhang [11] and colleagues used computational fluid dynamics (CFD) to examine the flow field structure under different tip–speed ratios and chord lengths. The interaction between blades and vortices in a vertical axis wind turbine with combined lift and drag was analyzed and discussed. The operating principle of this wind turbine type was examined. Moreover, the study investigated and analyzed the variations in air energy utilization rates of the wind turbine under different conditions. Qu Jianjun [12,13] presented a new vertical axis wind turbine, featuring a lift-resistive hybrid design with small auxiliary resistive blades. To improve the self-starting performance of conventional lift-type wind turbines, curved-resilient blades were integrated at the junctions close to the hub where the blades attach. The study by Farzad Ghafoorian [14] centered on the vertical axis wind turbine, particularly analyzing the impact of incorporating a curtain into the Darrieus–Savonius configuration to enhance its self-starting performance. Zhang [15] employed Taguchi’s method to carry out a study and conducted a systematic analysis of how the pitch angle, mounting angle, and diameter ratio jointly affect a hybrid wind turbine, with the goal of designing an optimal structure. Hosseini [16] modified the Savonius blades to Bach in the context of the drag-type wind turbine. From this perspective, Muhammad Ahmad [17] proposed a novel hybrid structure called Double-Darrieus, which replaced the internal Savonius rotor with a Darrieus rotor.
Overall, in order to enhance the performance of hybrid wind turbines while minimizing the amount and cost of the project, this study proposes an innovative wind turbine design featuring a spoiler positioned at the terminal end of its inner rotor. The primary goal of this study is to improve the torque coefficient of the inner rotor at high speeds by using a spoiler, while also reducing the drag force. This method seeks to enhance the performance of hybrid wind turbines. This enhancement scheme offers a novel concept and reference for adjusting hybrid vertical-axis wind turbines.
2. Research Modeling
This section presents the geometric model, computational setup, and theoretical equations used to analyze the turbine’s aerodynamic performance. The goal is to establish a reliable numerical framework for evaluating design improvements.
2.1. Geometric Modeling
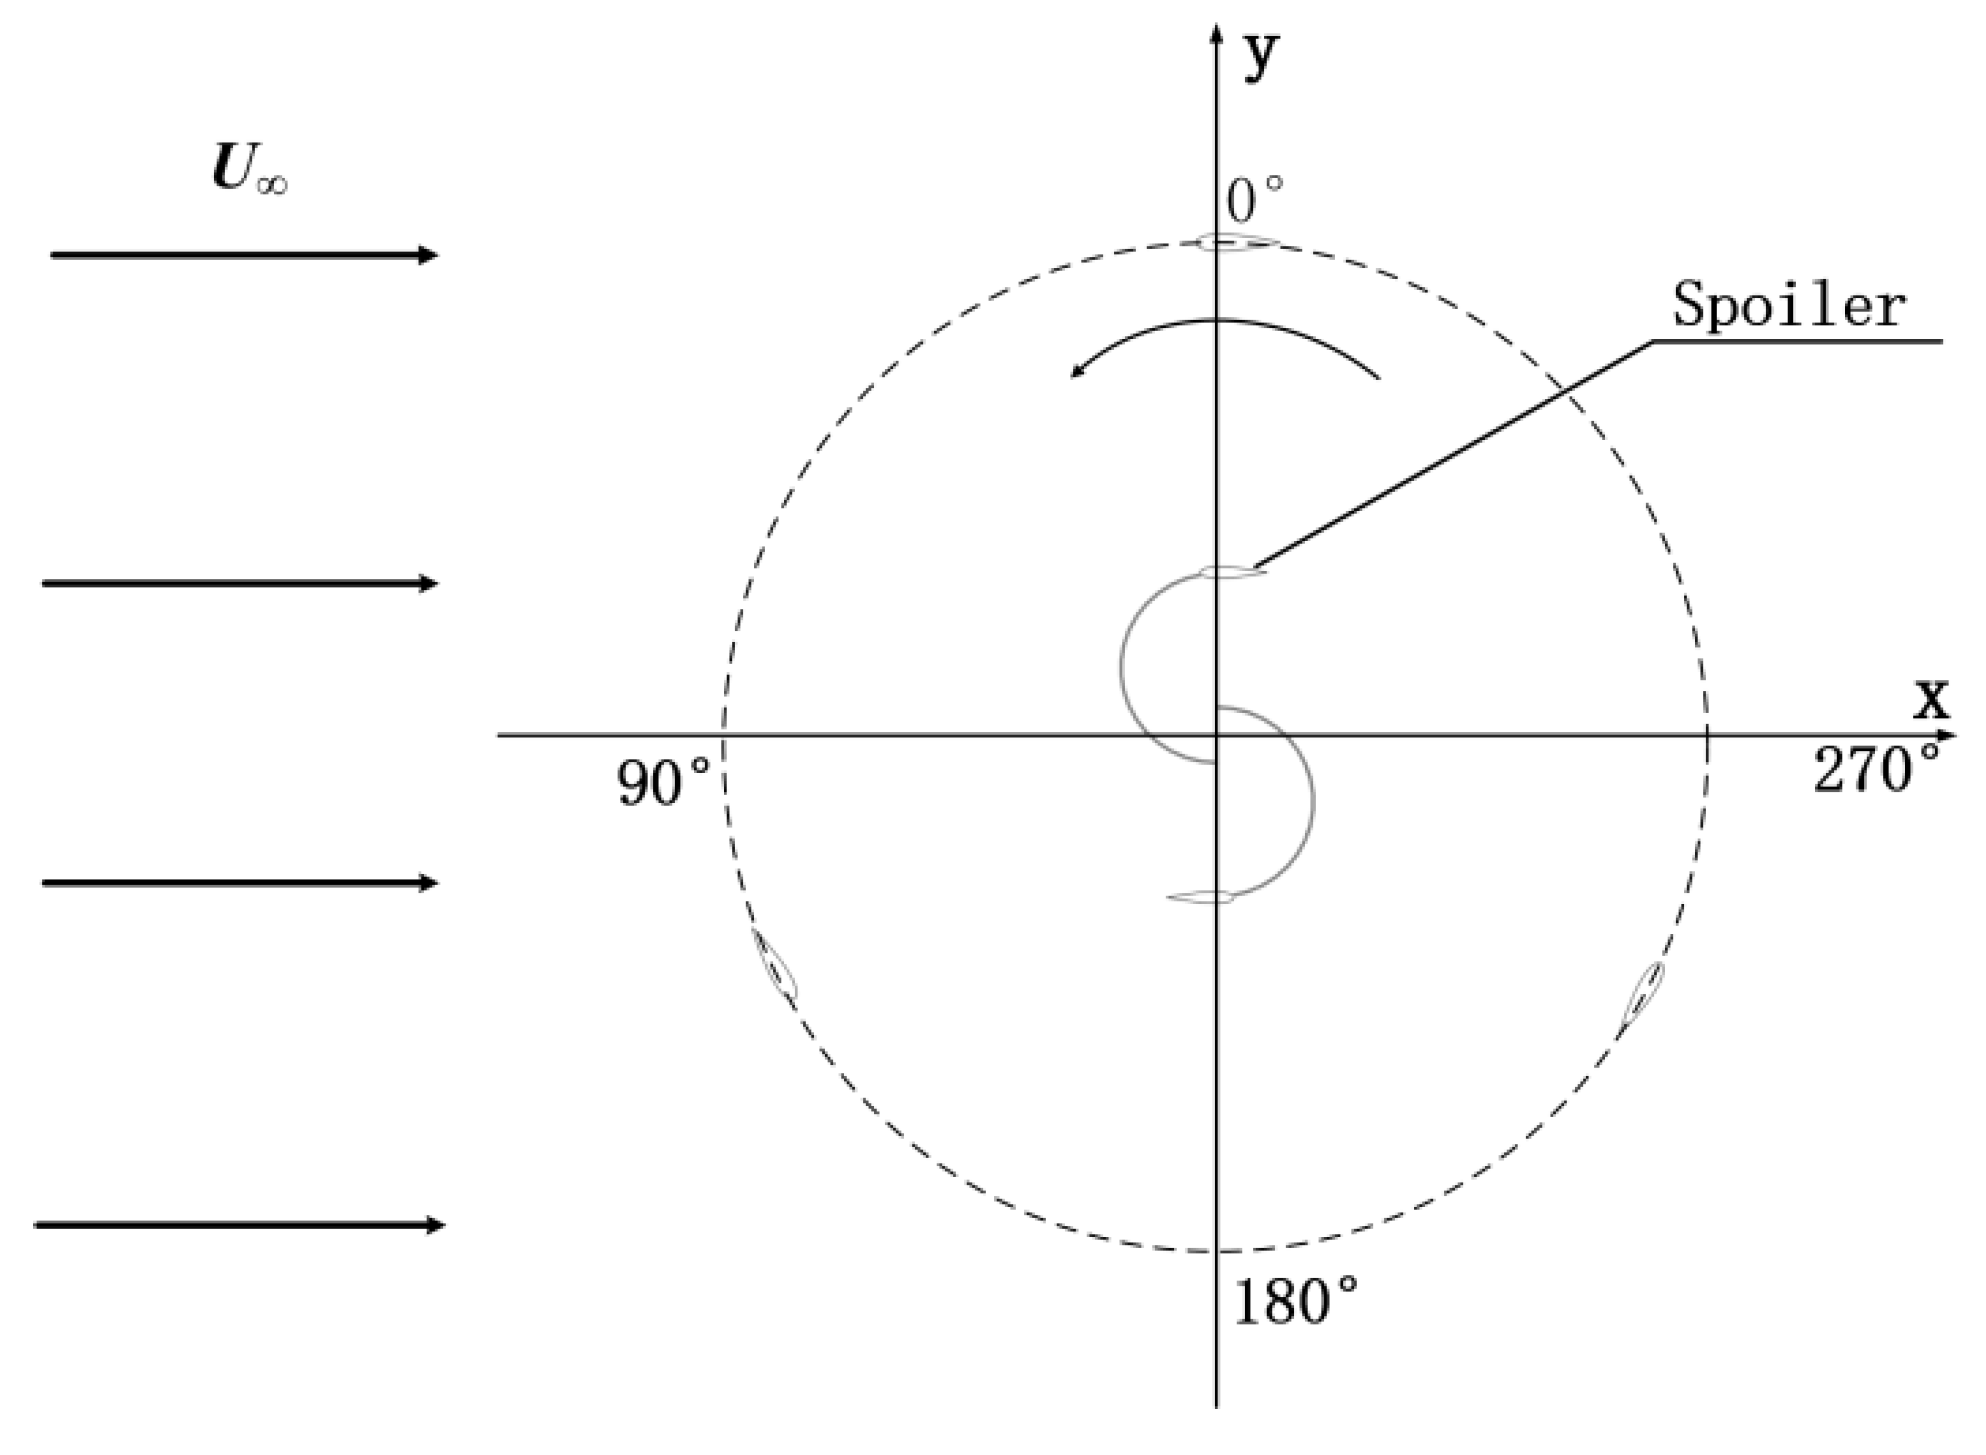
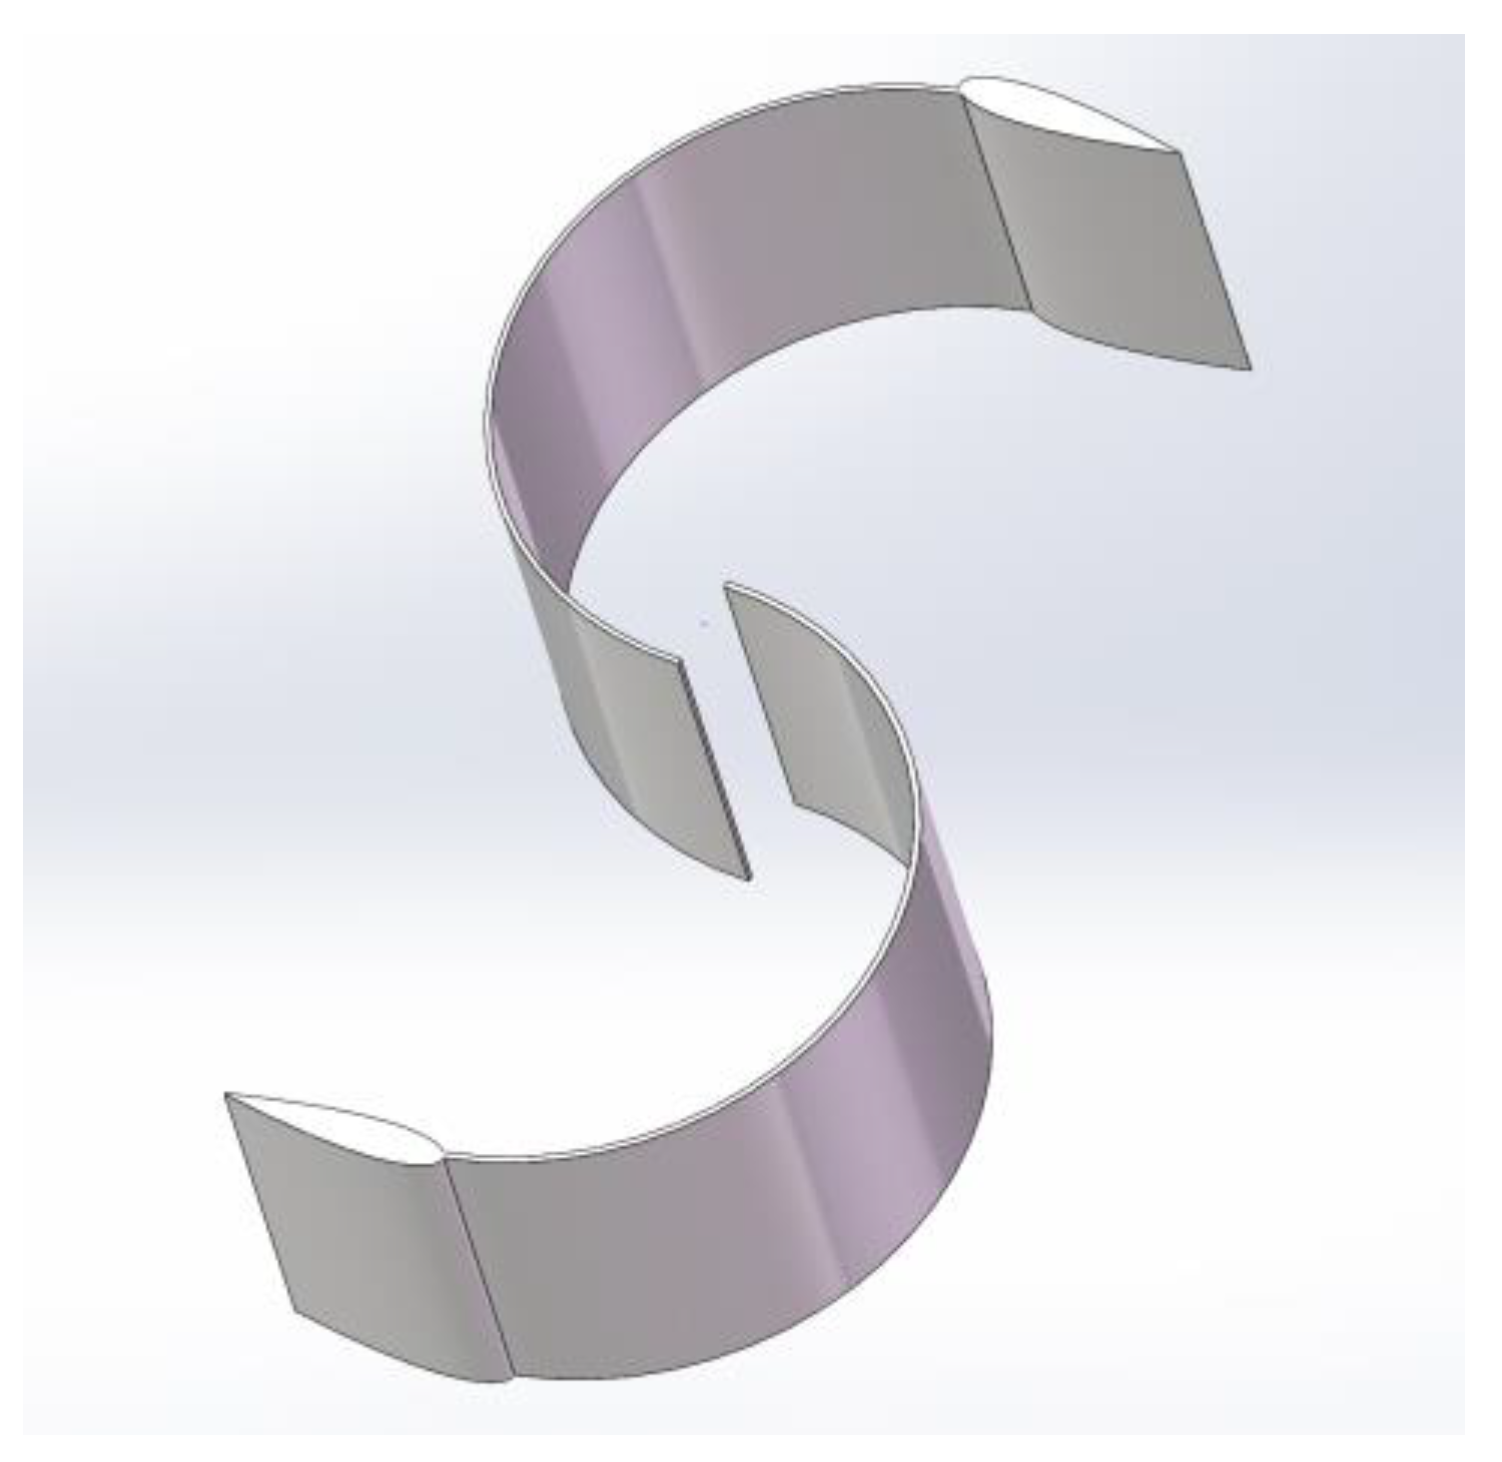
The study examines the aerodynamic performance parameters of the modified inner rotor Darrieus–Savonius wind turbine, which has been simplified and modeled as depicted in Figure 1. The turbine is a three-bladed Darrieus wind turbine with a three-bladed Darrieus blade for the outer rotor and two modified Savonius blades for the inner rotor. The inner rotor consists of Savonius blades and spoilers with NACA0018 type wings, which are designed to reduce the negative torque generated by the inner rotor. Figure 2 shows a 3D model of the inner rotor. The data for Darrieus and Savonius are derived from Sahan Chegini [18]. Starting at an azimuth of 0°, the inner and outer rotor blades were labeled as D1, D2, D3, S1, and S2, respectively. The exact geometric details of the wind turbine are outlined in Table 1 below.
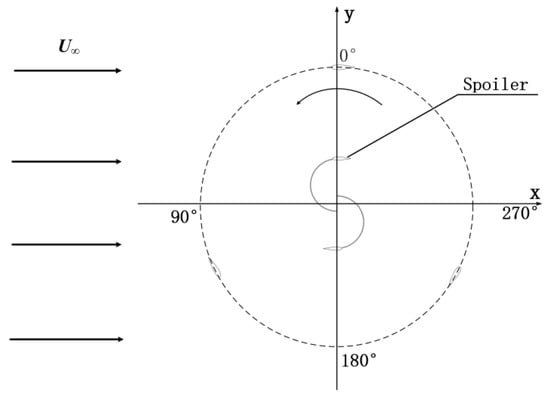
Figure 1.
The diagram depicts the fundamental 2D model of the wind turbine.
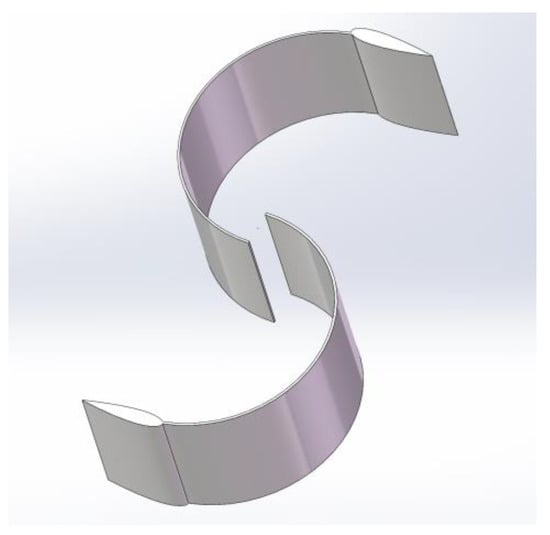
Figure 2.
3D model drawing of the inner rotor.

Table 1.
Wind turbine’s geometric parameter.
2.2. Theoretical Equation
The Navier–Stokes (N-S) equations contain the fundamental laws of physics that describe the motion of fluids. In this paper, they are used to model the characteristics of the flow field around a wind turbine, including key parameters such as velocity, pressure, and turbulence.
In this study, numerical simulations based on continuity (Equation (1)) and momentum N-S equations (Equation (2)) have been carried out to calculate various performance parameters of wind turbines. The equations are as follows [19]:
The fluid density , time , velocity vector , surface pressure , surface stress vector , and volumetric force vector per unit mass are all included in the N-S Equations (1) and (2) [20].
The SST k-ω model is extensively utilized in CFD simulations for VAWTs. The SST k-ω model combines the accuracy of the k-ω model in the near-wall region with the free-flow uniqueness of the k-ε model in the far field. It can more accurately simulate a variety of flow situations, especially those involving boundary layer and flow separation phenomena. Thus, this paper utilizes the SST k-ω model. Following this, an equation is presented as follows [21]:
Equation (3) denotes the turbulent kinetic energy equation (k), quantifying the kinetic energy within turbulence eddies and vortices. Equation (4) represents the Specific Rate of Dissipation (ω), indicating the rate at which turbulent kinetic energy is dissipated in the flow field due to viscous effects. Here, denotes the turbulent kinetic energy generated by the mean velocity gradient, Gb represents the kinetic energy of turbulence due to buoyancy, while represents the production of ω. and are the effective diffusion coefficient for k and ω and and indicate the dissipation of k and ω due to turbulence. The term denotes the cross-diffusion component, and represent the user-defined source terms, and and indicate the influence of buoyancy.
The following is the formula for turbulent viscosity based on the SST model:
where S denotes the magnitude of the strain rate and the coefficient a* suppresses turbulent viscosity, resulting in a low Reynolds number correction. F2 is then given by the following equation:
where is the distance to the next surface.
The aerodynamic efficiency of a wind turbine can be evaluated using different approaches. Among these, the moment coefficient (Cm) and power coefficient (Cp) are used most frequently as they determine the torque generated, respectively, by the turbine blades and the energy conversion rate. The moment coefficient is as follows:
where M is the torque of the wind turbine in units of N·m, A is the swept area of the wind turbine in units of m2, R is the radius of the wind turbine in units of m, and indicates the incoming wind speed in units of m·s−1.
The formula for calculating the power coefficient is shown below [22]:
where ω is the angular velocity of the wind turbine rotation in units of rad·s−1.
The tip–speed ratio represents the ratio of the linear velocity at the tip of the blade to the incoming wind speed, and is generally expressed as λ, defined by Equation [23]:
The relationship between Cp and Cm is as follows:
3. Numerical Method
This section details the computational framework used to analyze the wind turbine’s performance, including domain setup, boundary conditions, and solver settings. It validates the model through grid and time-step independence tests, ensuring accurate simulations. The methods provide the foundation for evaluating the turbine’s aerodynamic improvements in later sections.
3.1. Computational Domain
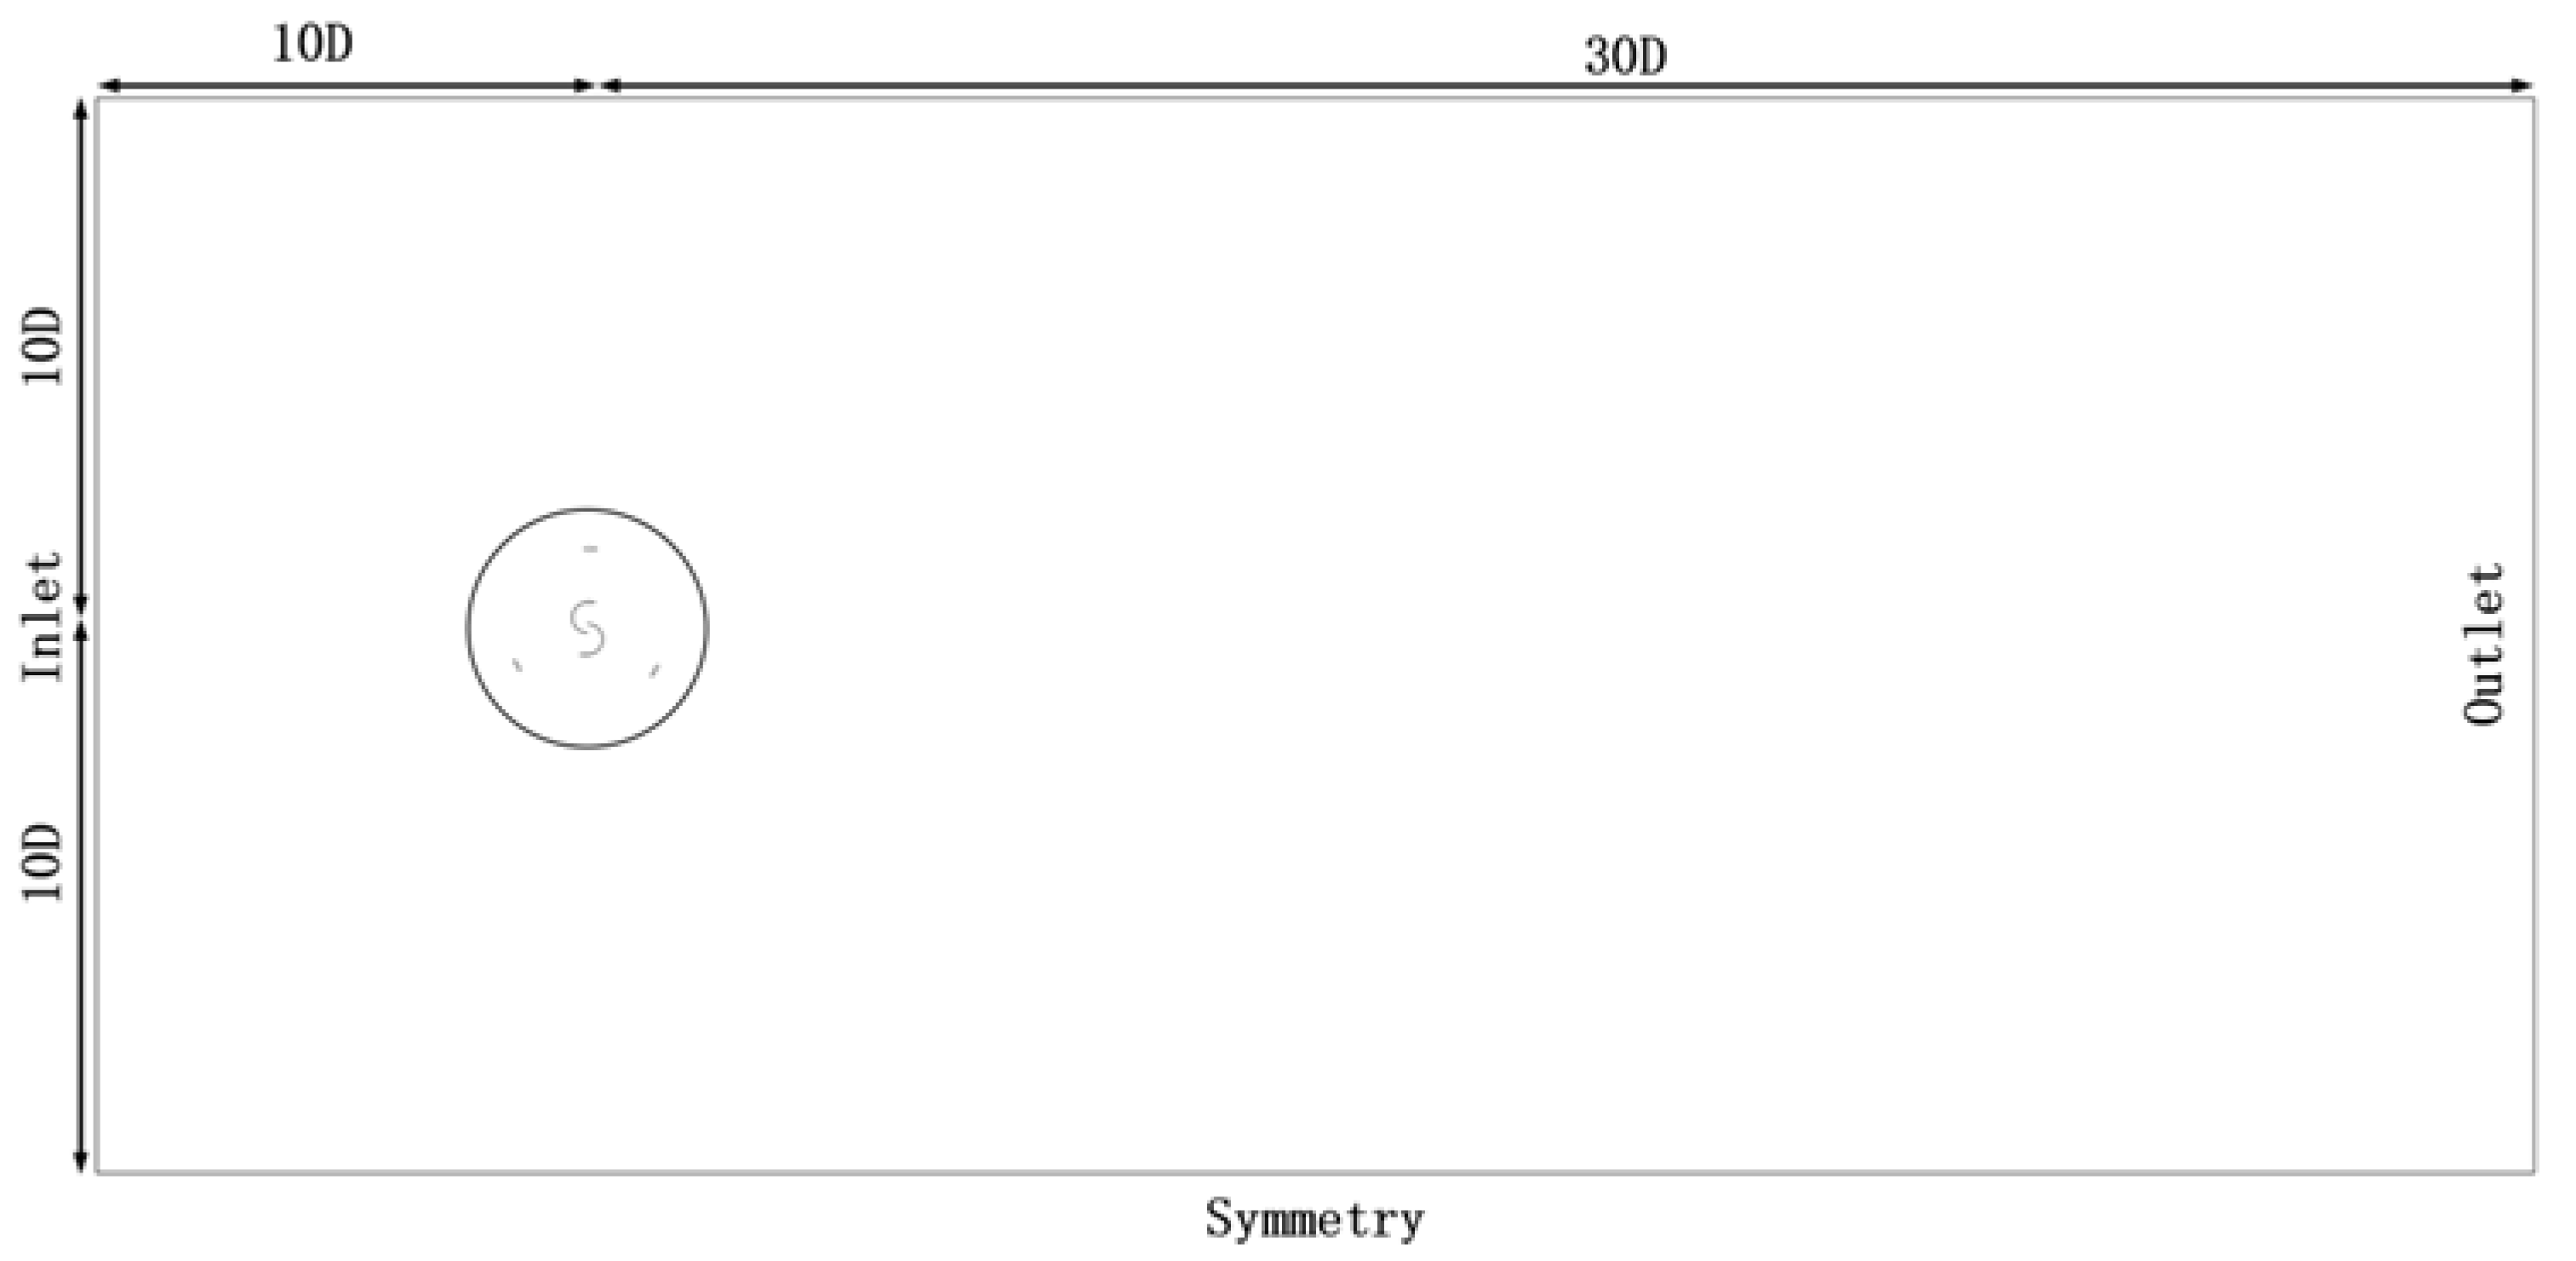
The research was conducted in a two-dimensional computational domain. As shown in the authors’ previous studies and simulations, this domain can efficiently simulate wind turbine performance with reduced computational resources [24,25,26]. Within the two-dimensional computational domain, there are a steady-state domain and a rotational domain. A Darrieus wind turbine and a modified Savonius wind turbine are located within the rotational domain. The geometric parameters of the modified Savonius wind turbine match those of the previously mentioned wind turbines. The turbine’s rotor is selected, with its rotational region positioned 1.5D away, 10D from the inlet, 30D from the outlet, and 10D from each side. The rotor turns in a counterclockwise direction. The computational domain for this configuration is illustrated in Figure 3.

Figure 3.
Schematic representation of the wind turbine’s computational domain.
3.2. Simulation Settings
3.2.1. Boundary Condition
The current study used the ANSYS FLUNT 2024R2 computational fluid dynamics solver to perform calculations for the specific problem using the finite control volume method. The boundary conditions of the simulation are based on the experimental work by Castelli et al., as outlined in the reference paper [27]. The current numerical analysis will apply a fixed wind speed of 9 m/s to the inlet boundary condition. The blades of the turbine are represented as walls with no-slip conditions and will rotate at the rotor’s angular velocity. The steady-state and rotating domains are connected by a non-conformal interface through the sliding mesh technique. The TI is 5%.
3.2.2. Solver Settings
The SST k-ω turbulence model was selected due to its basis in the Reynolds-averaged N-S equation and its use of the dynamic slip grid. In all numerical experiments, the Mach number stays below 0.3, and the flow is deemed incompressible [28]. As a result, the SIMPLE algorithm was used to couple the pressure–velocity equations with the SST k-ω turbulence model. In the region adjacent to the wall, the SST k-ω model was employed to improve simulation accuracy near the wall. In the free shear flow region, the k-ε model was utilized to leverage its performance away from the wall in the free stream. The air density is 1.225 kg/m3 with a viscosity of 1.79 × 10⁻⁵ Pa. The outflow surface pressure is set to 0 Pa. A second-order implicit method is used for time discretization, and the convergence iteration residuals are established at 10−5 [29]. To accomplish this objective, 30 iterations are performed at each time step to ensure convergence. To derive Cp from Cm in the last two cycles, a 10-turn operation will be carried out.
3.2.3. Convergence Criterion
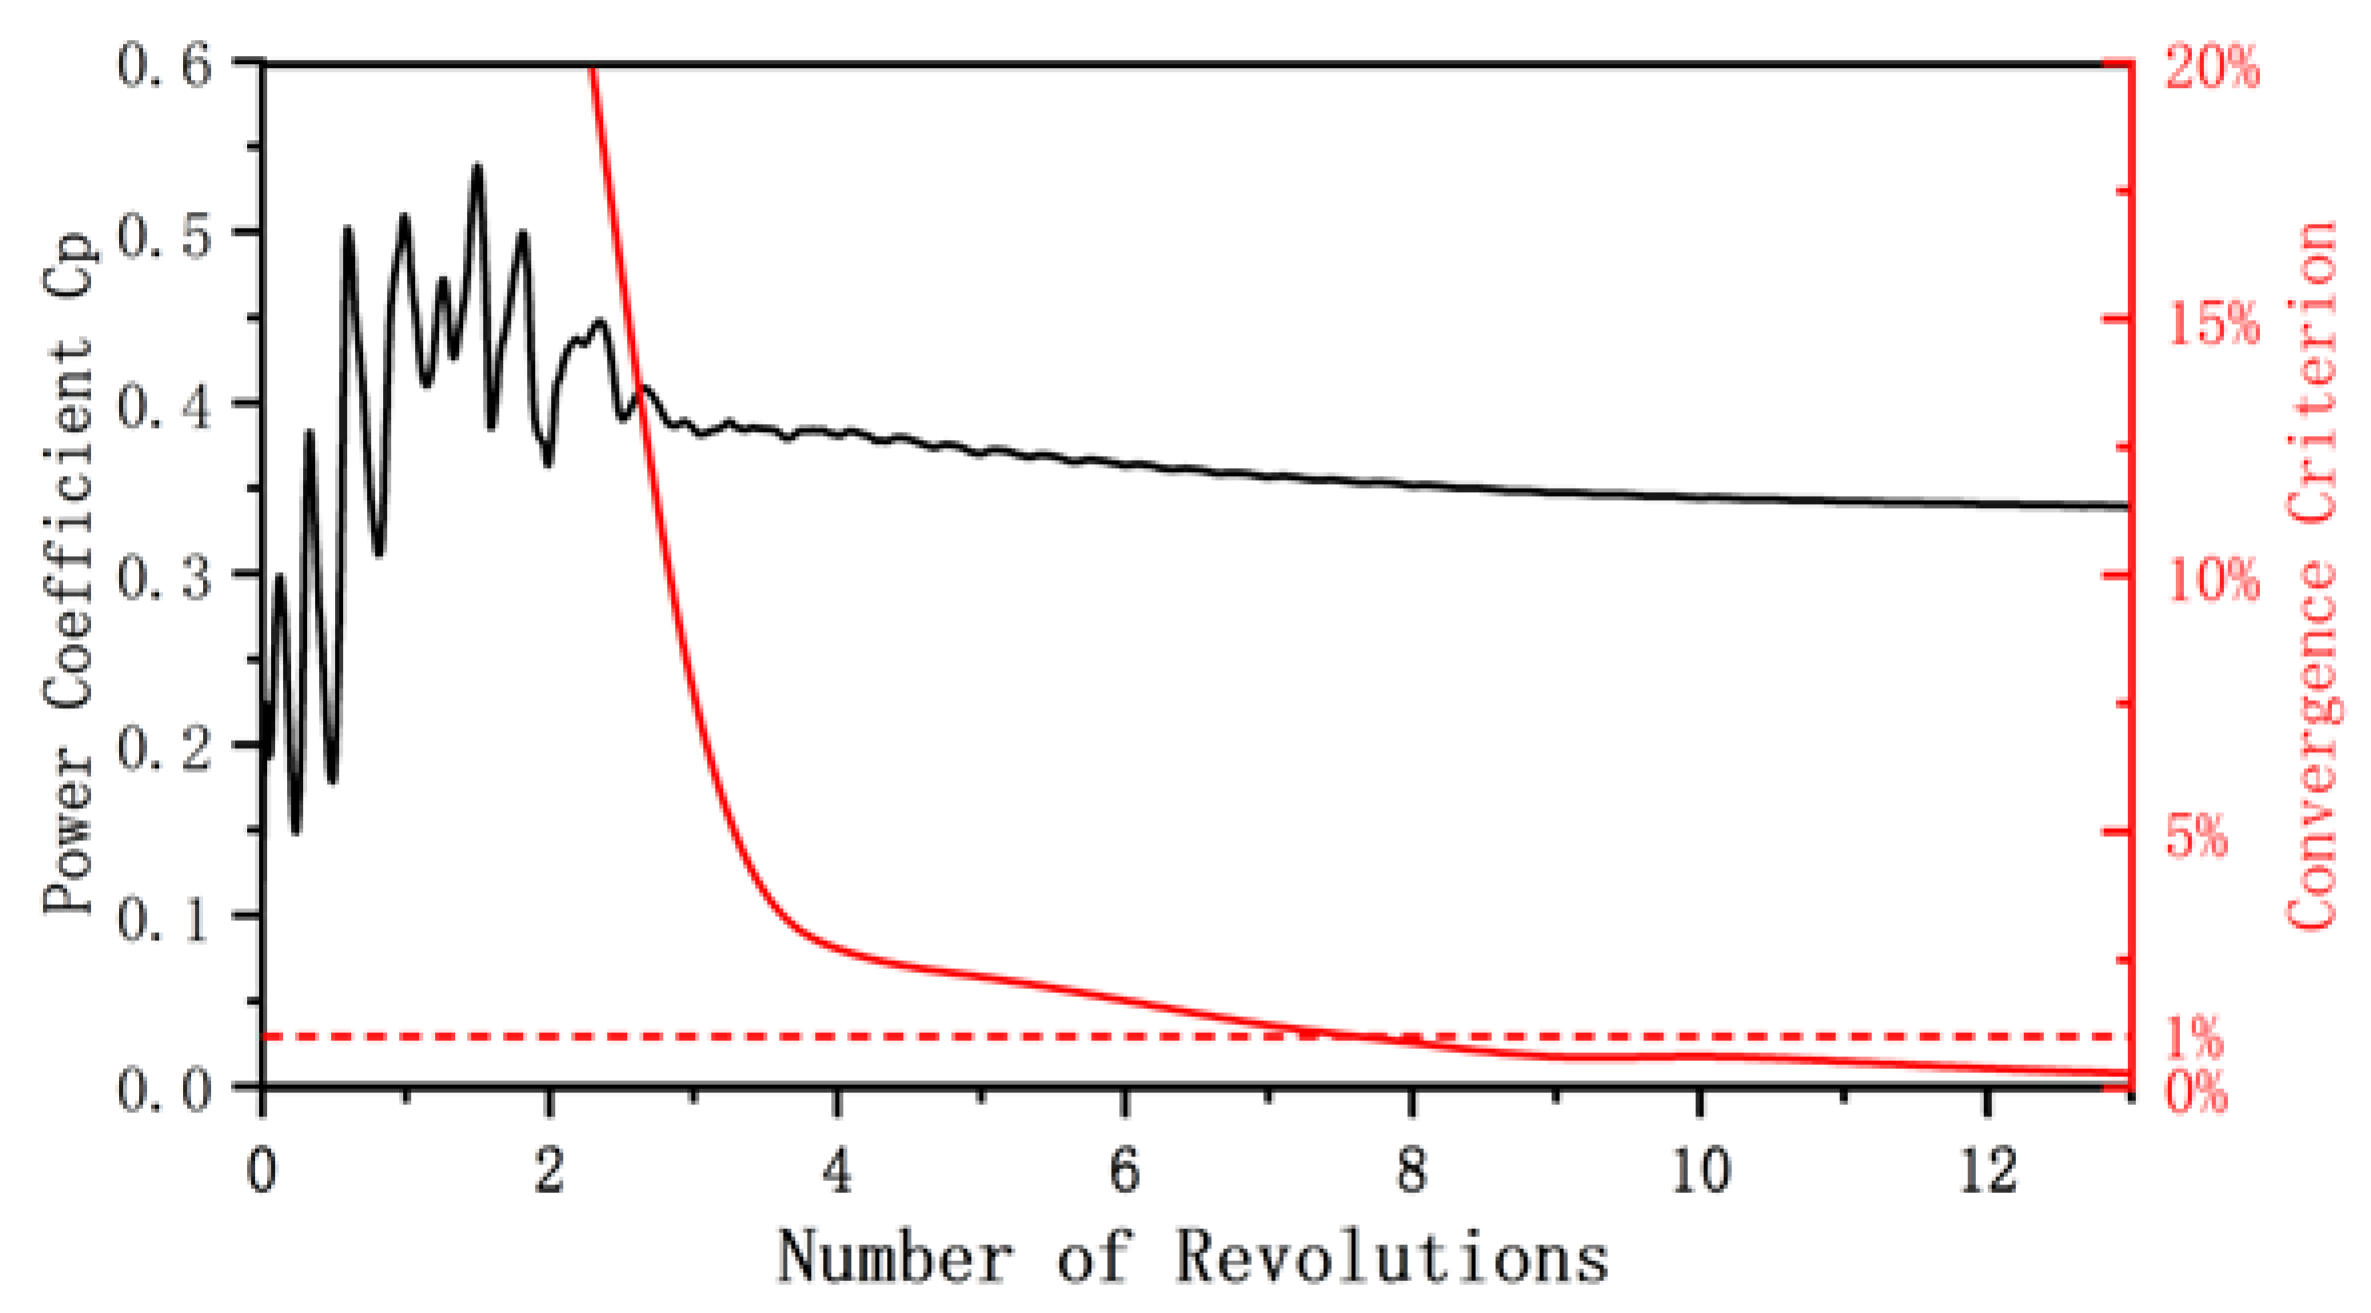
After computing the values, it is crucial to conduct a convergence check to ensure the accuracy of the results. To assess the power coefficient, the wind turbine is subjected to multiple rotations during testing [30]: once the power coefficient meets the convergence criteria in Equation (11), five additional rotations are carried out to reduce any possible influence of randomness.
As illustrated in Figure 4, the difference between Cp for the 8th rotation and Cp for the 7th rotation is 0.897%, satisfying the convergence criterion outlined in Equation (11). The wind turbine was then rotated five additional times to reduce the convergence error to 0.327%, finally reaching a converged solution. The process took about 18 h.
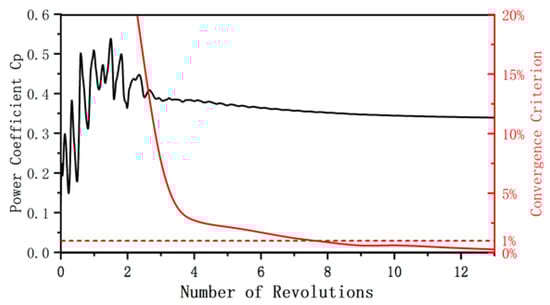
Figure 4.
Convergence criterion and power coefficient at TSR = 2.63 for the turbine’s 13 revolutions (The red dashed line represents the convergence baseline).
3.3. Evaluation of the Simulation Model
3.3.1. Verification of Grid Independence
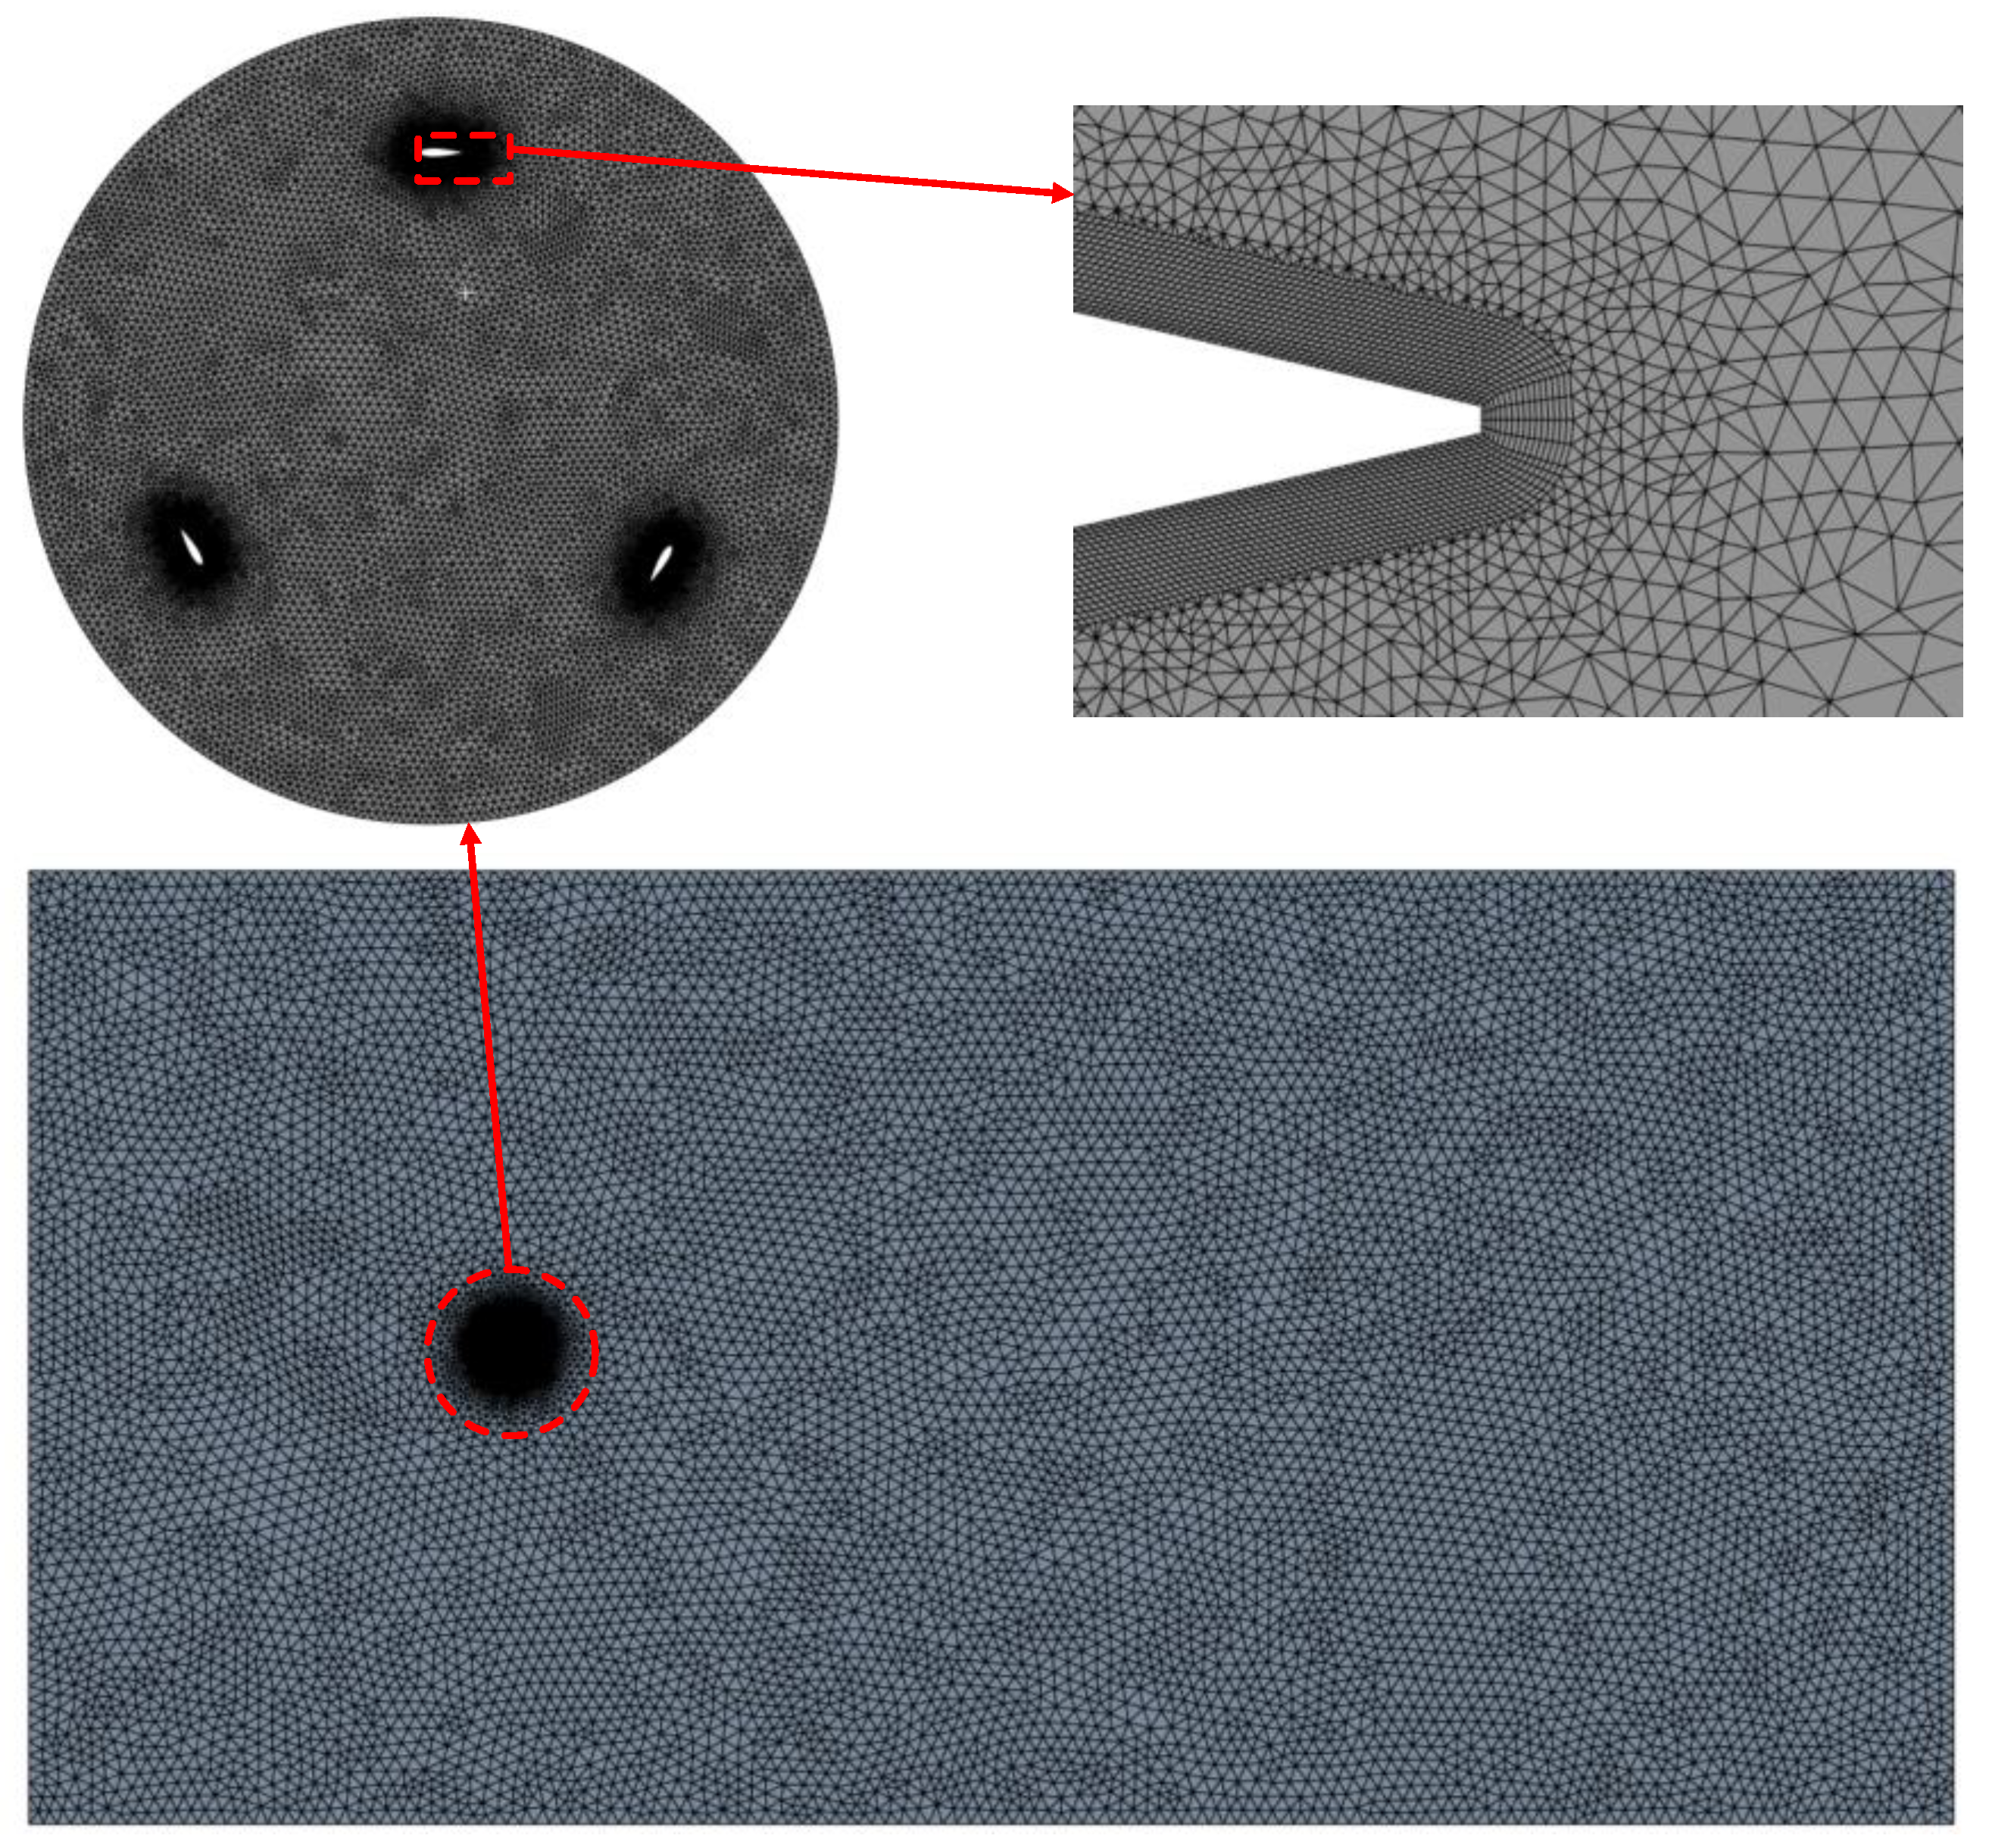
Choosing the right method for spatial discretization is vital for achieving accurate results in computational fluid dynamics (CFD). This also demands careful meshing to avoid errors, as shown in Figure 5. Considering the limited computing resources, the grid settings used in the Darrieus type use the same parameters as those required for the improved wind turbine. The aim is to minimize computing resources while reducing the impact on authenticity. In the present simulation, domain discretization is carried out using ANSYS-Mesh. A complex flow pattern forms near the blade wall edge, where a boundary layer is applied. The height of the initial mesh layer on the blade surface is determined using the wall function method, with the dimensionless wall distance y+ set to approximately 1. This study examines four separate grid densities, each independently generated, with detailed parameters outlined in Table 2. These grids comprise four uniformly refined two-dimensional structures. These mesh models demonstrate high-quality mesh, with the minimum orthogonal mass surpassing 0.7 and the maximum skewness staying under 0.5.
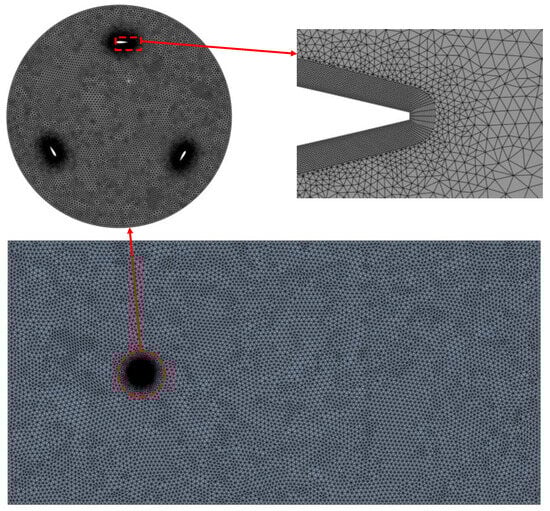
Figure 5.
Generated mesh.
Table 2.
Grid dimensions.
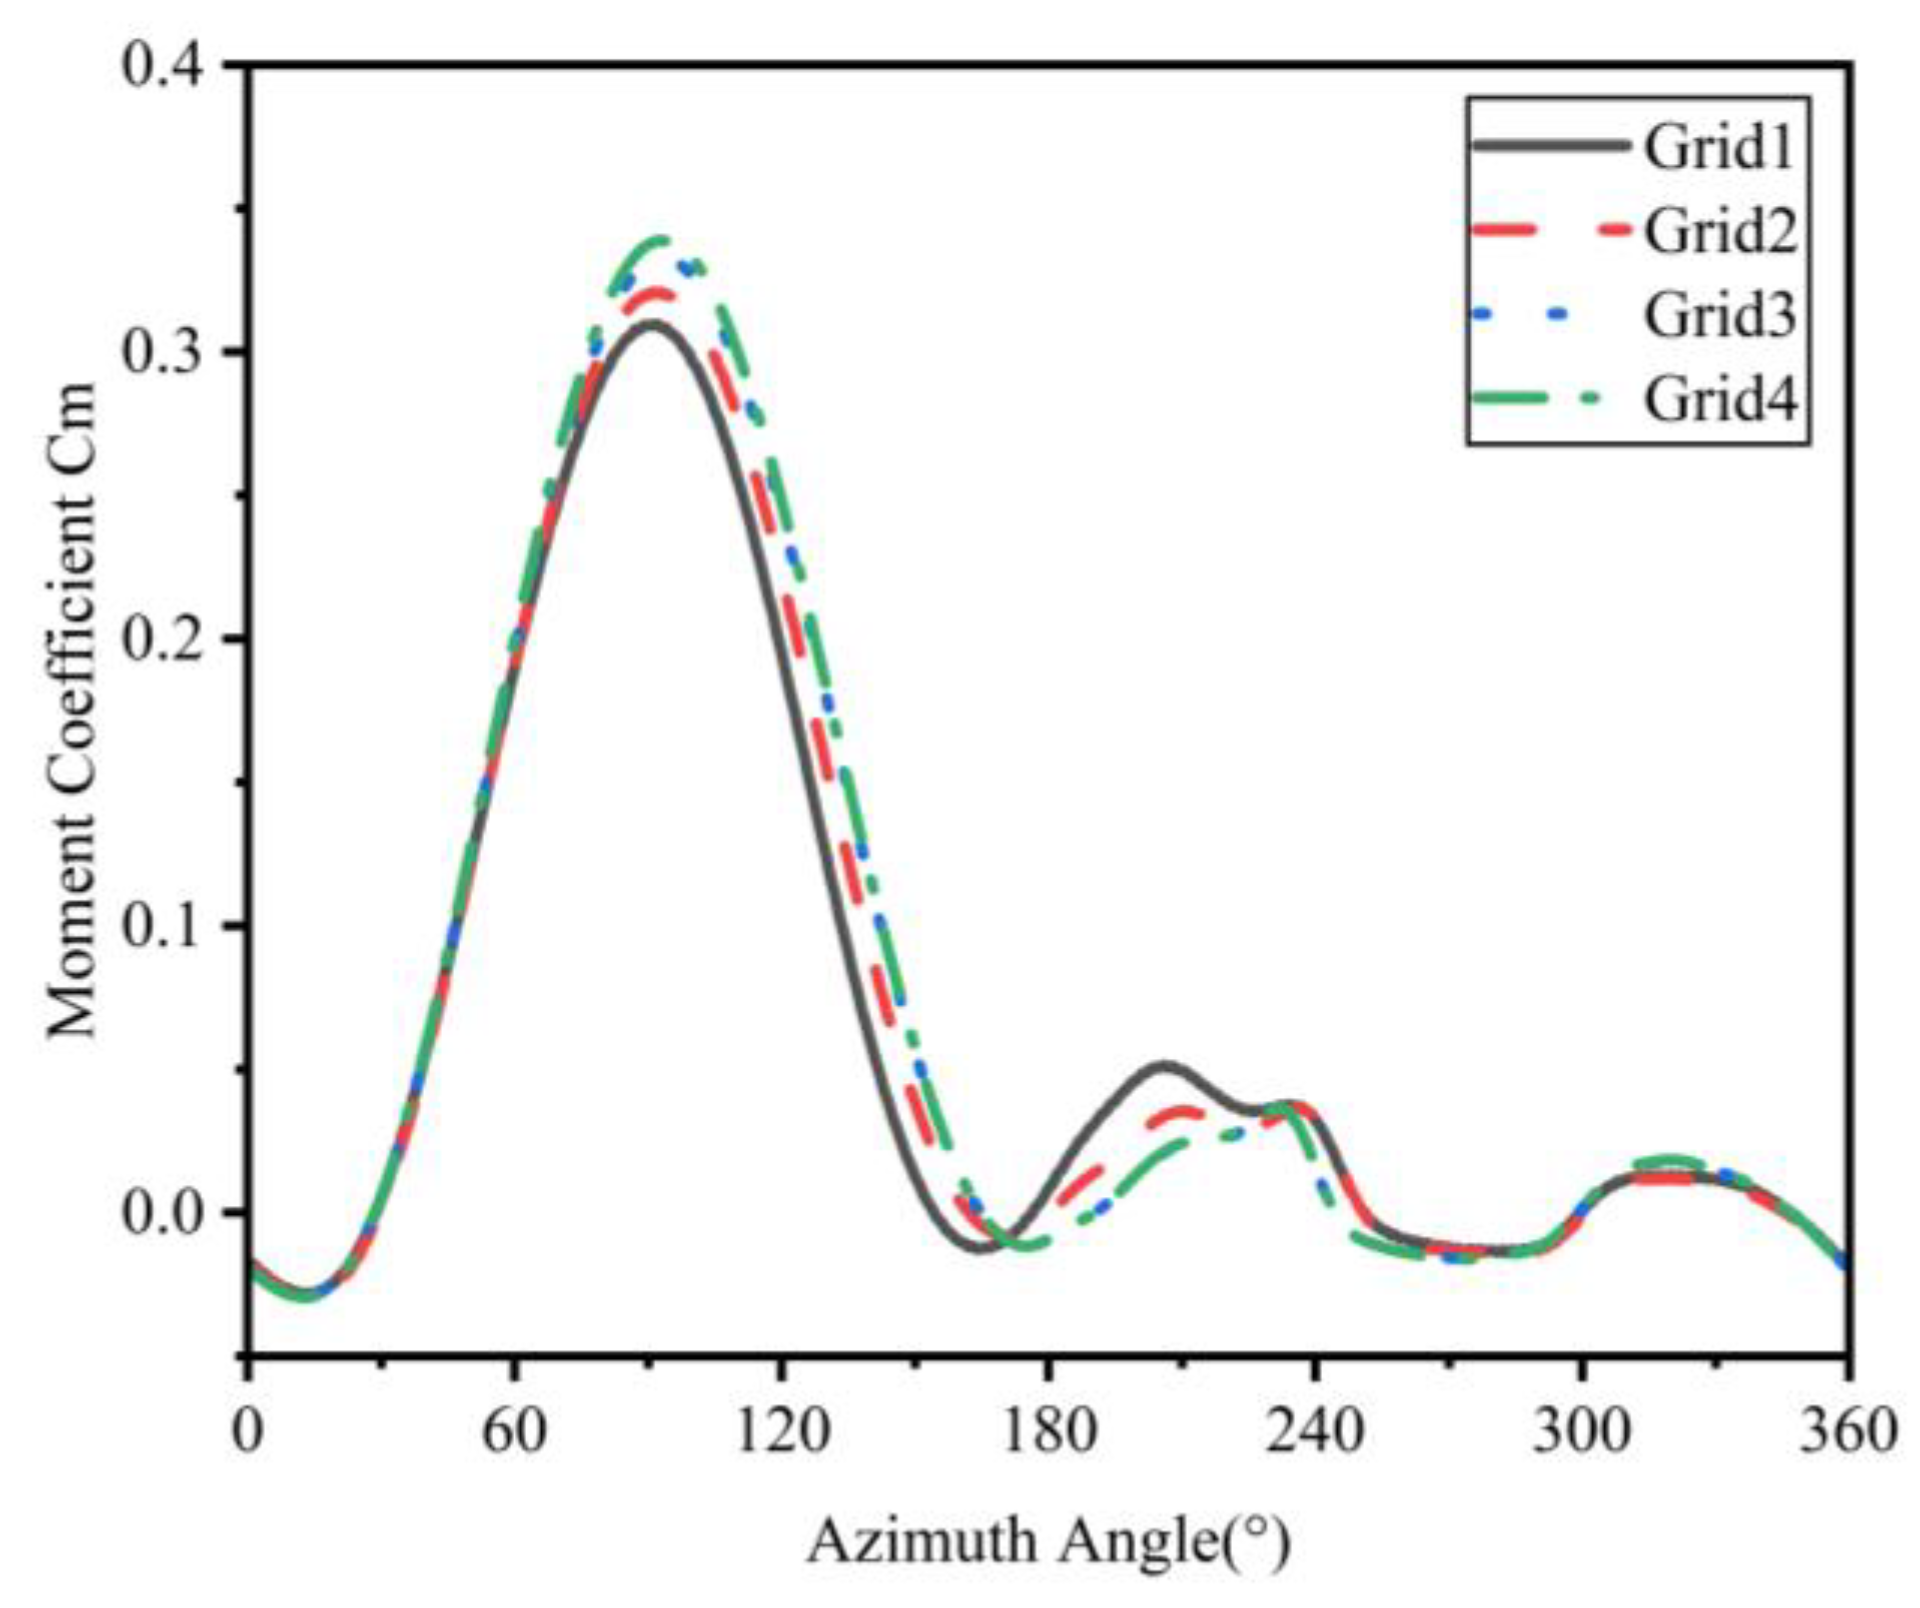
Figure 6 shows how the moment coefficient changes with the azimuth angle, particularly when the tip–speed ratio is fixed at 2. The figure shows that the moment coefficient variation curves for grid 3 and grid 4 are highly similar, with negligible differences. However, when analyzing the range of angles between 170 and 205 degrees, the curves from grid 1 and grid 2 exhibit notable divergence compared to those of grid 3 and grid 4 [31].
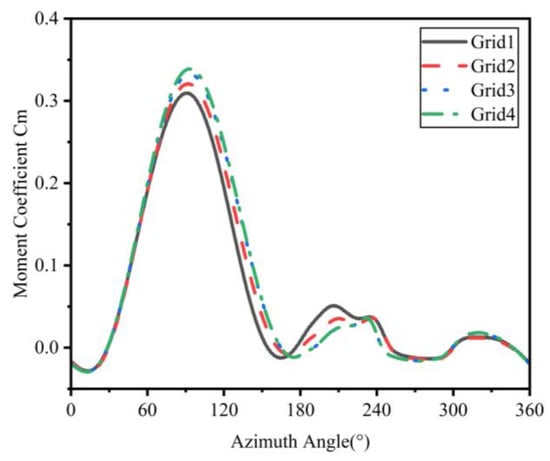
Figure 6.
Plot of moment coefficients for different azimuthal angles corresponding to different numbers of meshes for TSR = 2.63.
3.3.2. Time-Step Independence Validation
Temporal discretization is equally important when compared to spatial discretization. The time step is usually determined by the azimuthal time increment of the wind turbine. An excessively small time step can increase computational time, whereas a large time step might miss certain transient behaviors, thus reducing result accuracy. Thus, choosing a suitable time step is vital for ensuring the accuracy of transient simulations [32]. In order to determine the independence of the time steps, it was decided to analyze them using Grid 3. The study utilized three separate time intervals. When the wind turbine rotates by 0.5 degrees, 1 degree, and 1.5 degrees, the corresponding time intervals are selected accordingly. The exact values obtained are listed in Table 3. The formulae for the wind turbine speed and time step are given as follows:
Table 3.
Step size of wind turbine rotation angle and its time step.
In these formulas, T stands for the rotational cycle of the wind turbine and α represents the rotation angle of the wind turbine for the current time step, measured in degrees (°).
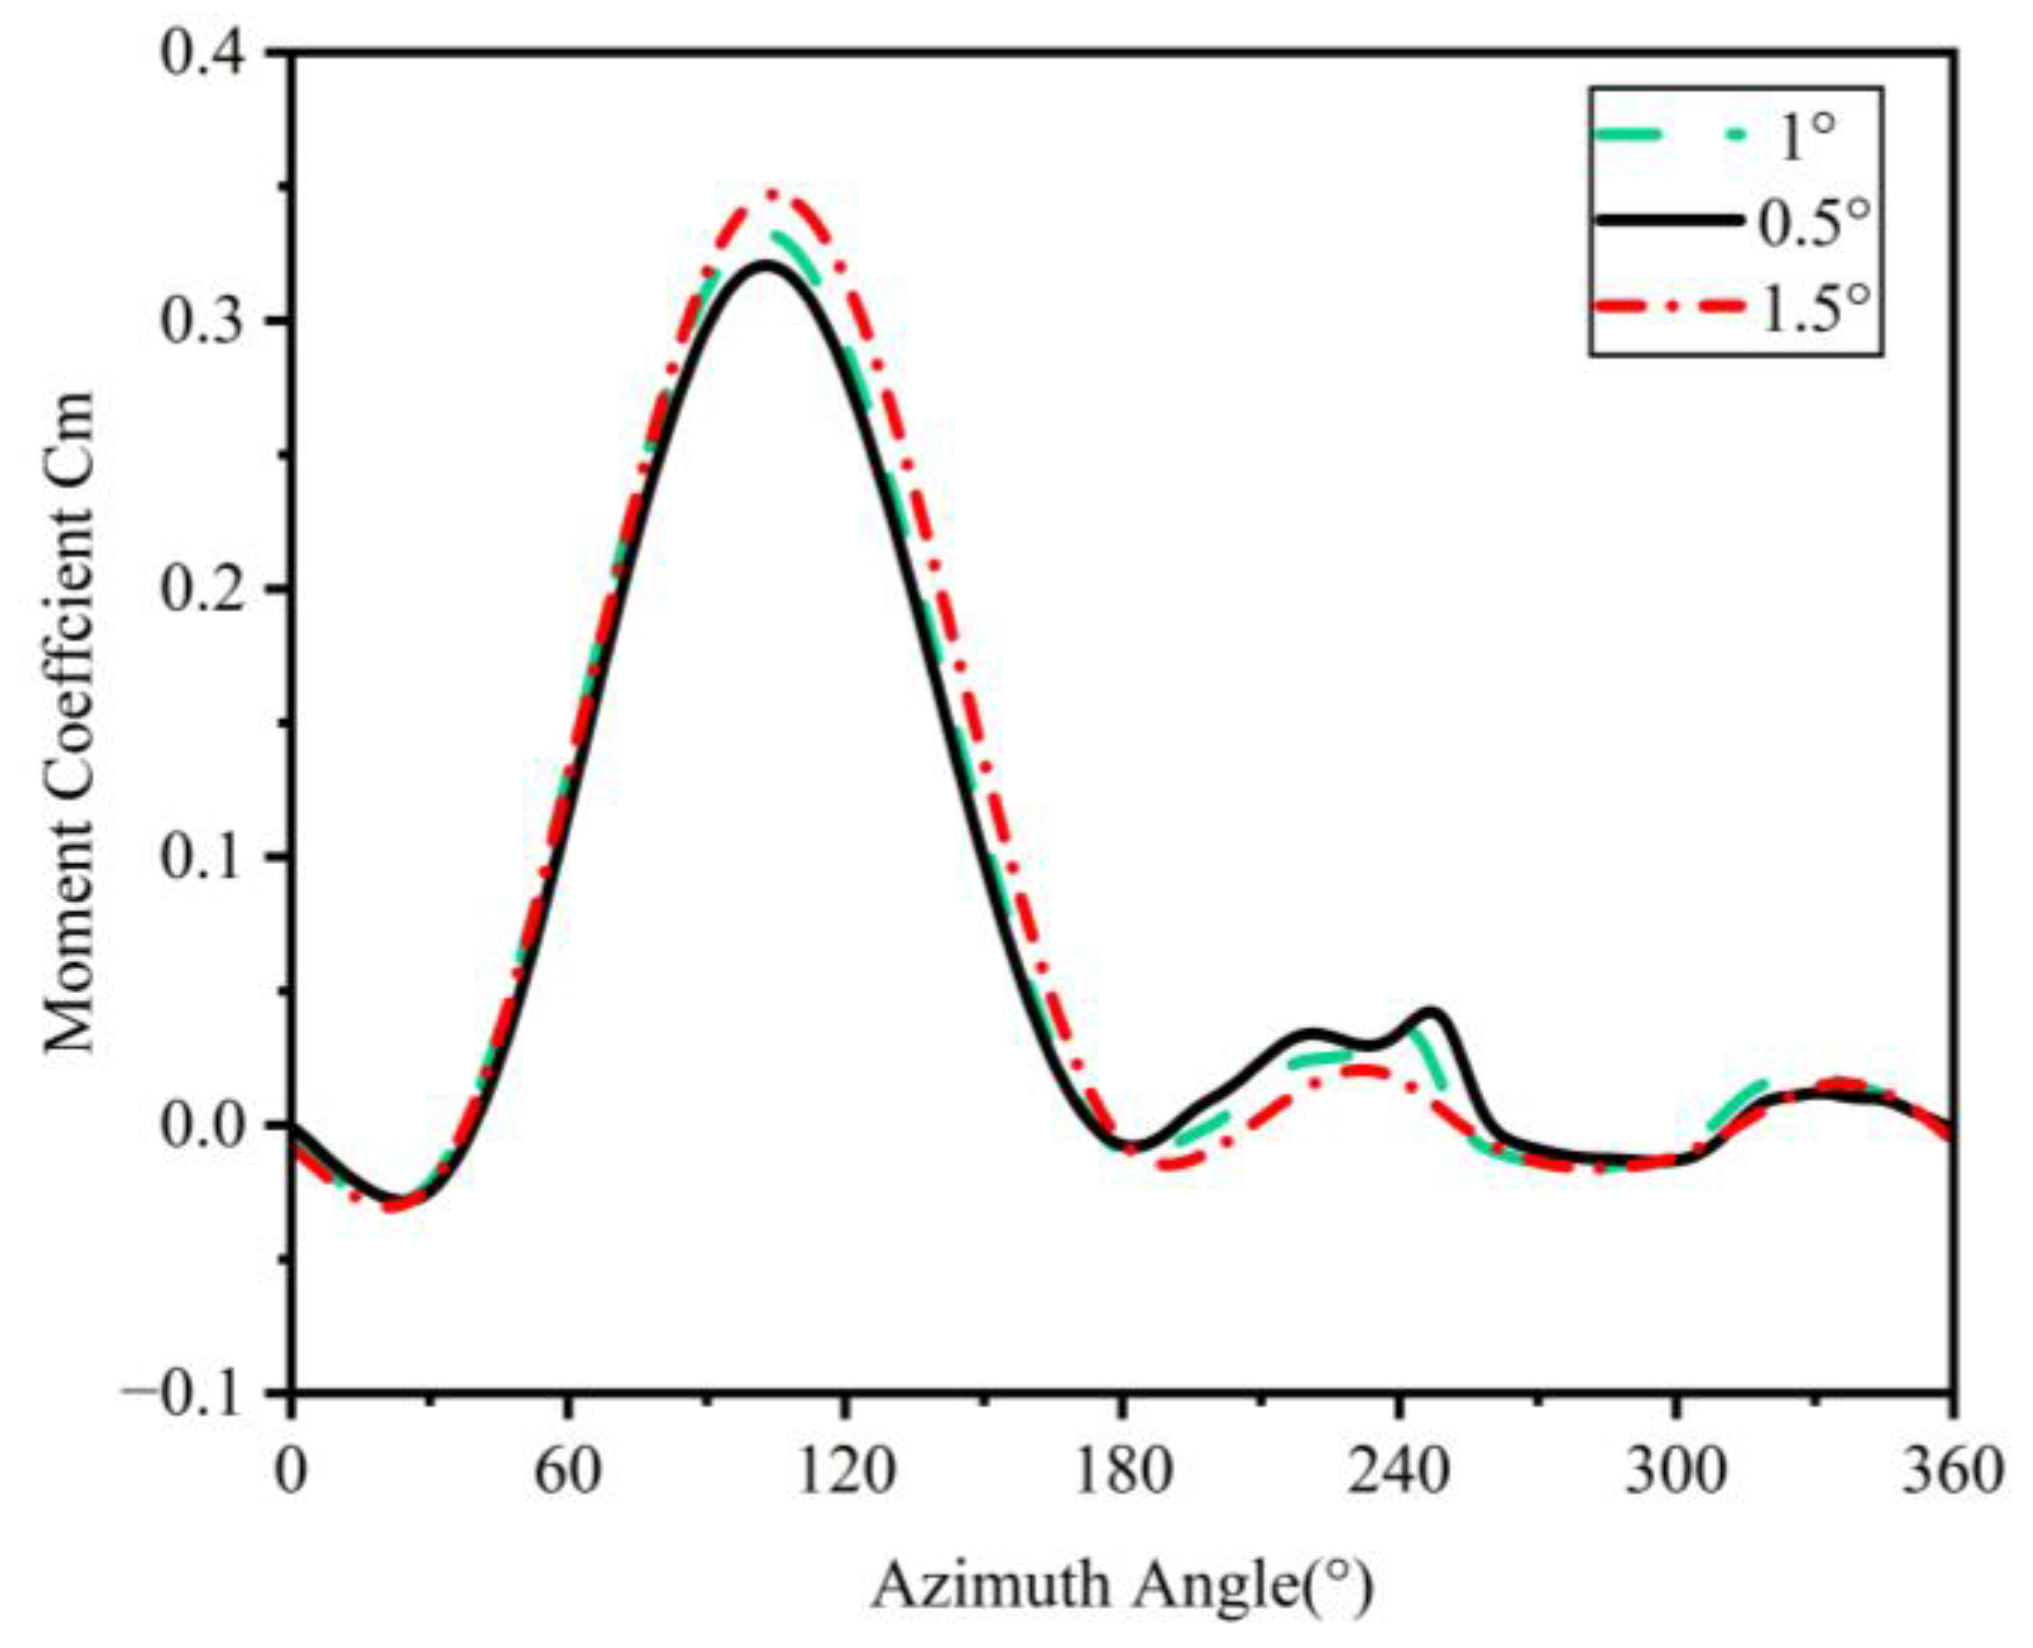
Figure 7 shows the torque coefficient at TSR = 2.63 in different times, from which it can be observed that the effect of changing the time step from 1.5° to 1° in order to obtain differences between the evolution of the coefficient of torque. Therefore, the time step required for the wind turbine numerical simulation was taken as the wind turbine rotating one degree, so as to obtain accurate calculation results, and make the least unnecessary calculation and simulation time.
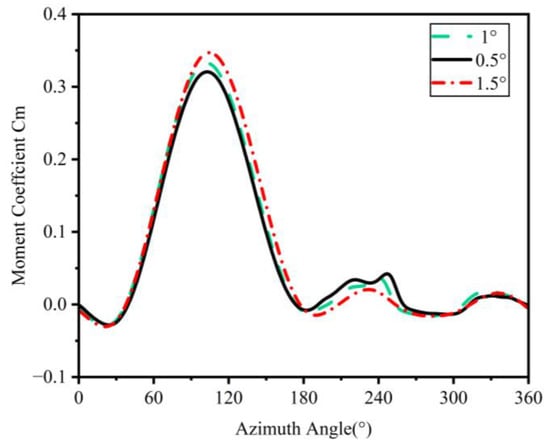
Figure 7.
A single blade’s instantaneous moment coefficient versus azimuth at TSR = 2.63 at various time steps.
3.3.3. Validation of the Model
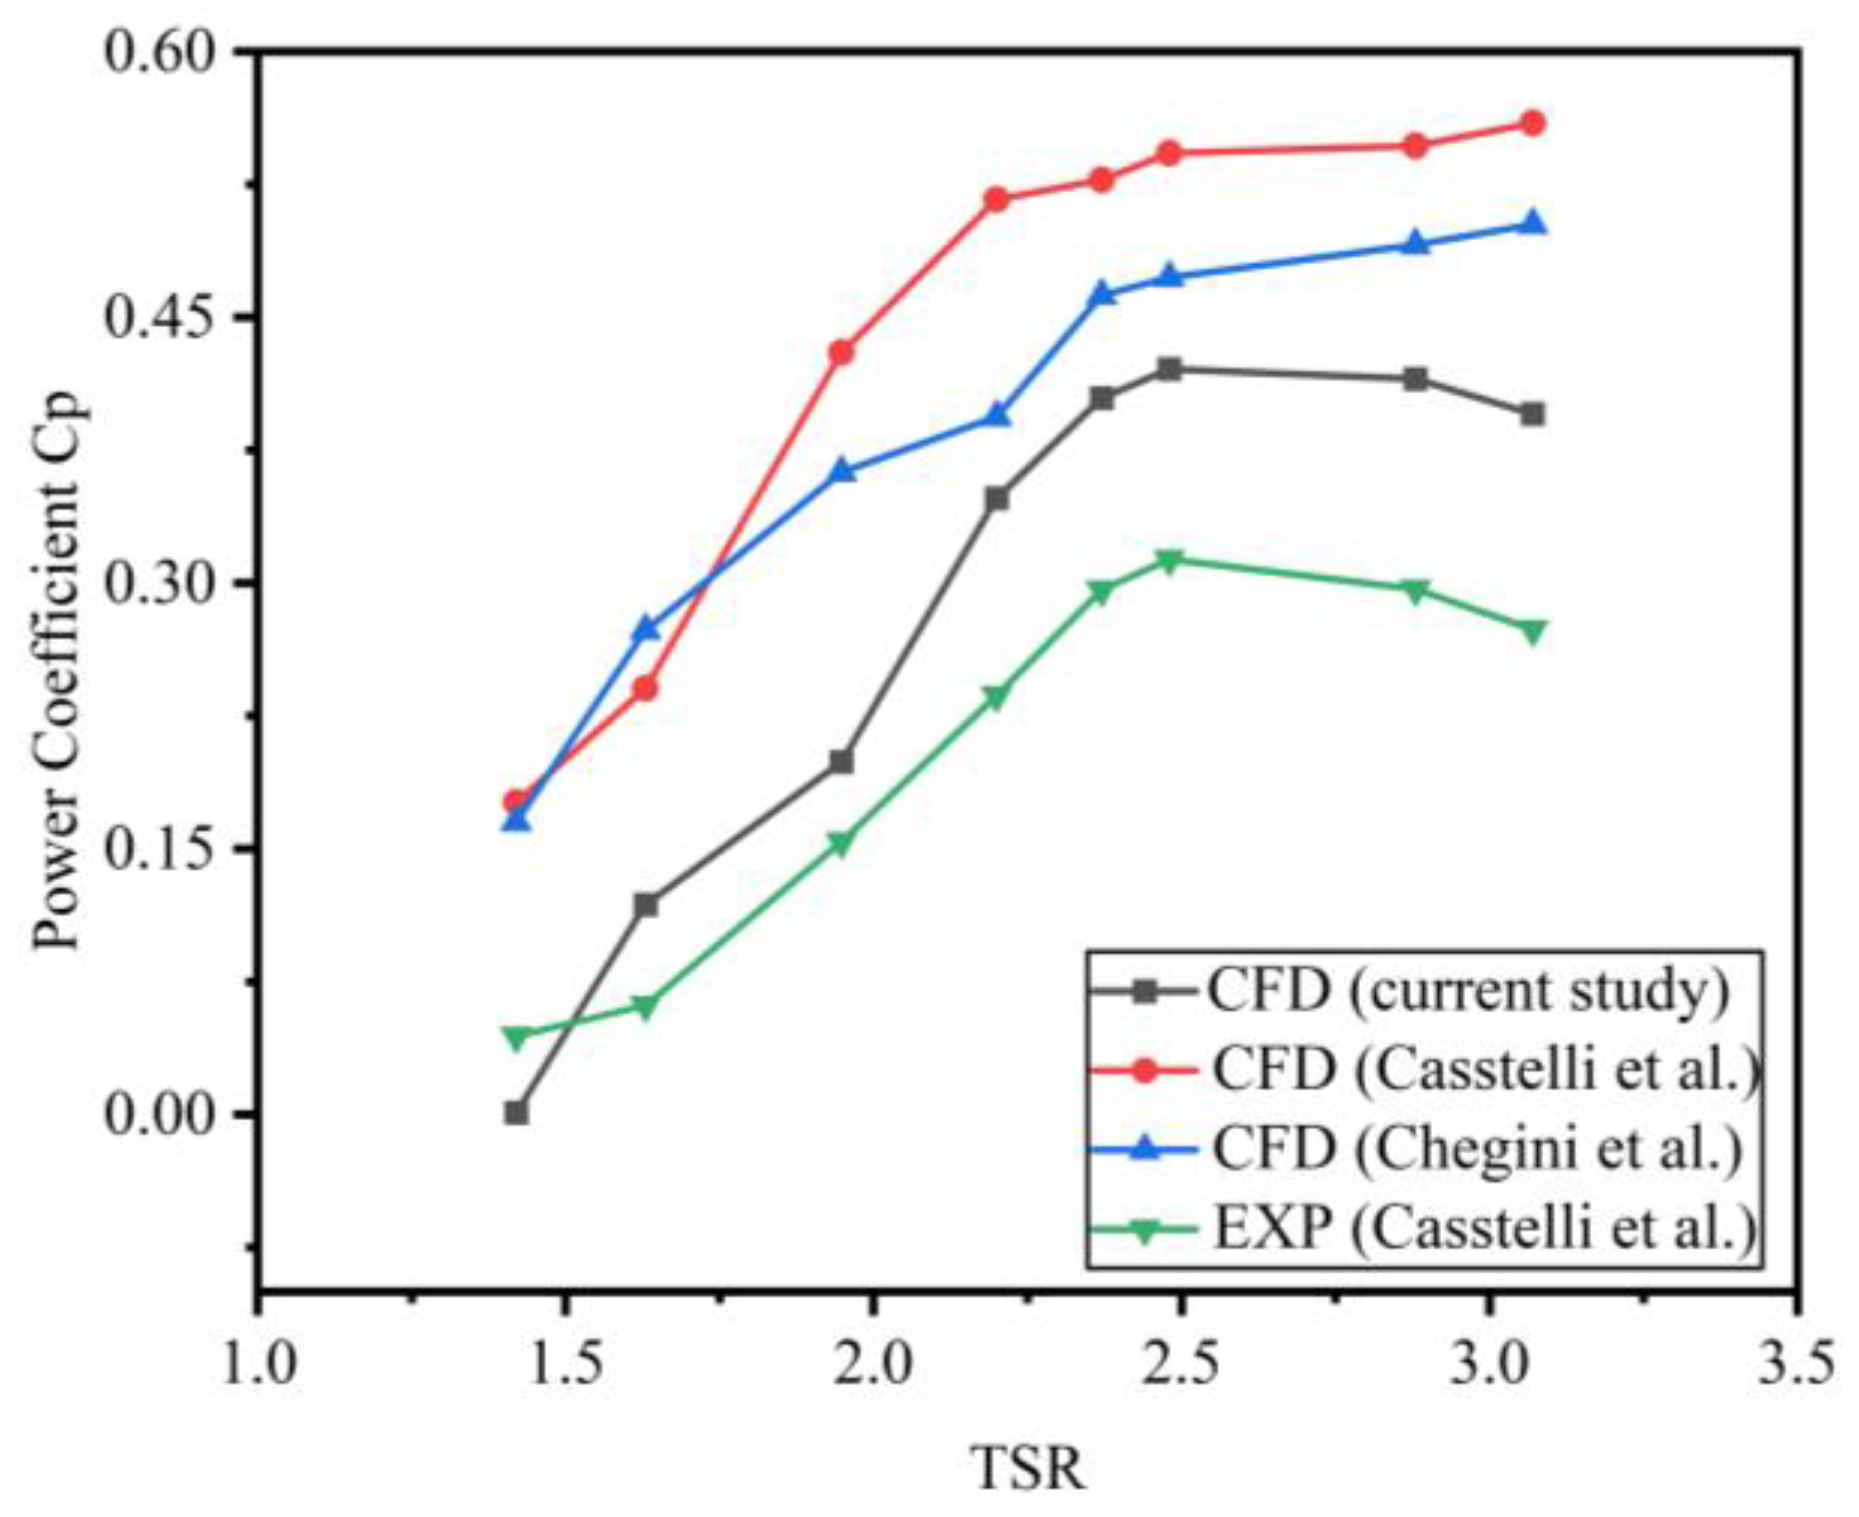
After thoroughly validating the model, including mesh and time step independence, the effectiveness of numerical modeling validation became clear. This process was highly efficient in confirming the accuracy of the results and validating the model’s independence. This study investigates the control case from Castelli’s work [33] and then compares the CFD simulation results with both numerical and experimental data. In addition to the cases outlined in this CFD study, an extra case from a previous CFD study will be provided. This aims to evaluate the accuracy of the results and verify the trends observed in the plots of the current study. The experimental study was excluded from the CDF simulation due to the lack of blockage consideration. The inlet boundary condition for the airflow was set at 9 m, corresponding to a wind tunnel speed of 9 m/s. The validation process involved eight distinct TSR values, ranging from 1.4 to 3.3. The results of this validation are shown in Figure 8.
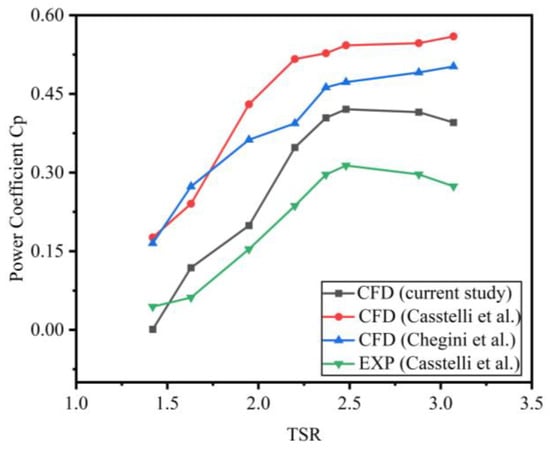
Figure 8.
CFD at different TSRs (using data from our study and the literature) [18,27].
As shown in Figure 8, the current CFD result displays a trend graph similar to the experimental and numerical studies by Castelli et al. and Chegini et al., i.e., about 28% difference in the mean value of Cp [18]. The similarity suggests that the current study is precise and closely matches the real situation. Although the latest CFD results show a significant improvement over previous studies, a gap between CFD and experimental data is still apparent. This difference mainly arises from the simplified nature of the URANS-based method. The positive simulation outcomes in this study are mainly due to the optimization of several critical factors: the turbulence model, mesh resolution, time step, wind turbine rotational speed, and boundary conditions. Furthermore, the numerical simulation result in this study is significantly higher than the experimental outcome. This difference may stem from the simplified modeling of the blade support arm and the neglect of mechanical frictional losses. Moreover, they overlook losses at the blade tip vortex and 3D vortices, disregarding the 3D effect on fluid flow. Perhaps the experiment will have some errors and uncertainties. Excluding turbulence intensity data not provided in the experiment will increase the discrepancy between simulated and experimental results. In summary, the model used in this study offers a reasonable prediction of the vertical axis wind turbine’s performance, based on the discussed results.
4. Result Analysis
In this section, the advantages of the proposed new structure are derived after numerical simulations of different types of hybrid wind turbines, where the inlet wind speed is set to 9 m/s and the turbulence intensity is set to 5% in the numerical simulations covered below, and the rest of the settings are consistent with the numerical simulation validation section above.
4.1. Conventional Hybrid Wind Turbines
As indicated in a previous study, the Darrieus wind turbine demonstrates superior performance at high tip–speed ratios. However, its performance is notably unsatisfactory at low tip–speed ratios, especially regarding poor self-starting capabilities under such conditions. Scholars have presented their own explanations for this issue. At a low tip–speed ratio, there is an area that does not generate enough torque or even produces negative torque, referred to as the dead zone [34,35]. This feature leads to the Darrieus wind turbine having a poor self-starting ability. By contrast, the Savonius wind turbine demonstrates superior self-starting capability. Therefore, Darrieus and Savonius are combined to enhance wind turbine performance at low tip–speed ratios. Figure 9 shows a performance comparison between traditional hybrid wind turbines and Darrieus wind turbines.
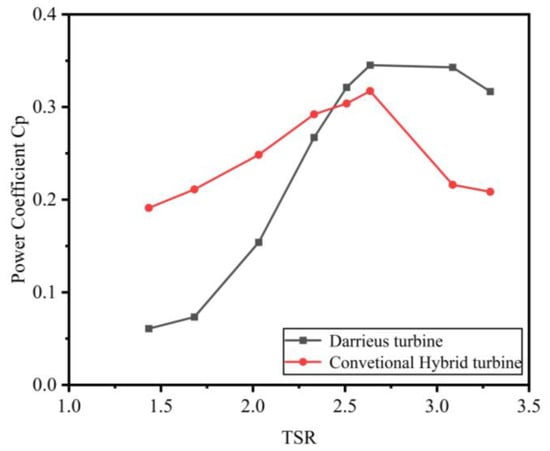
Figure 9.
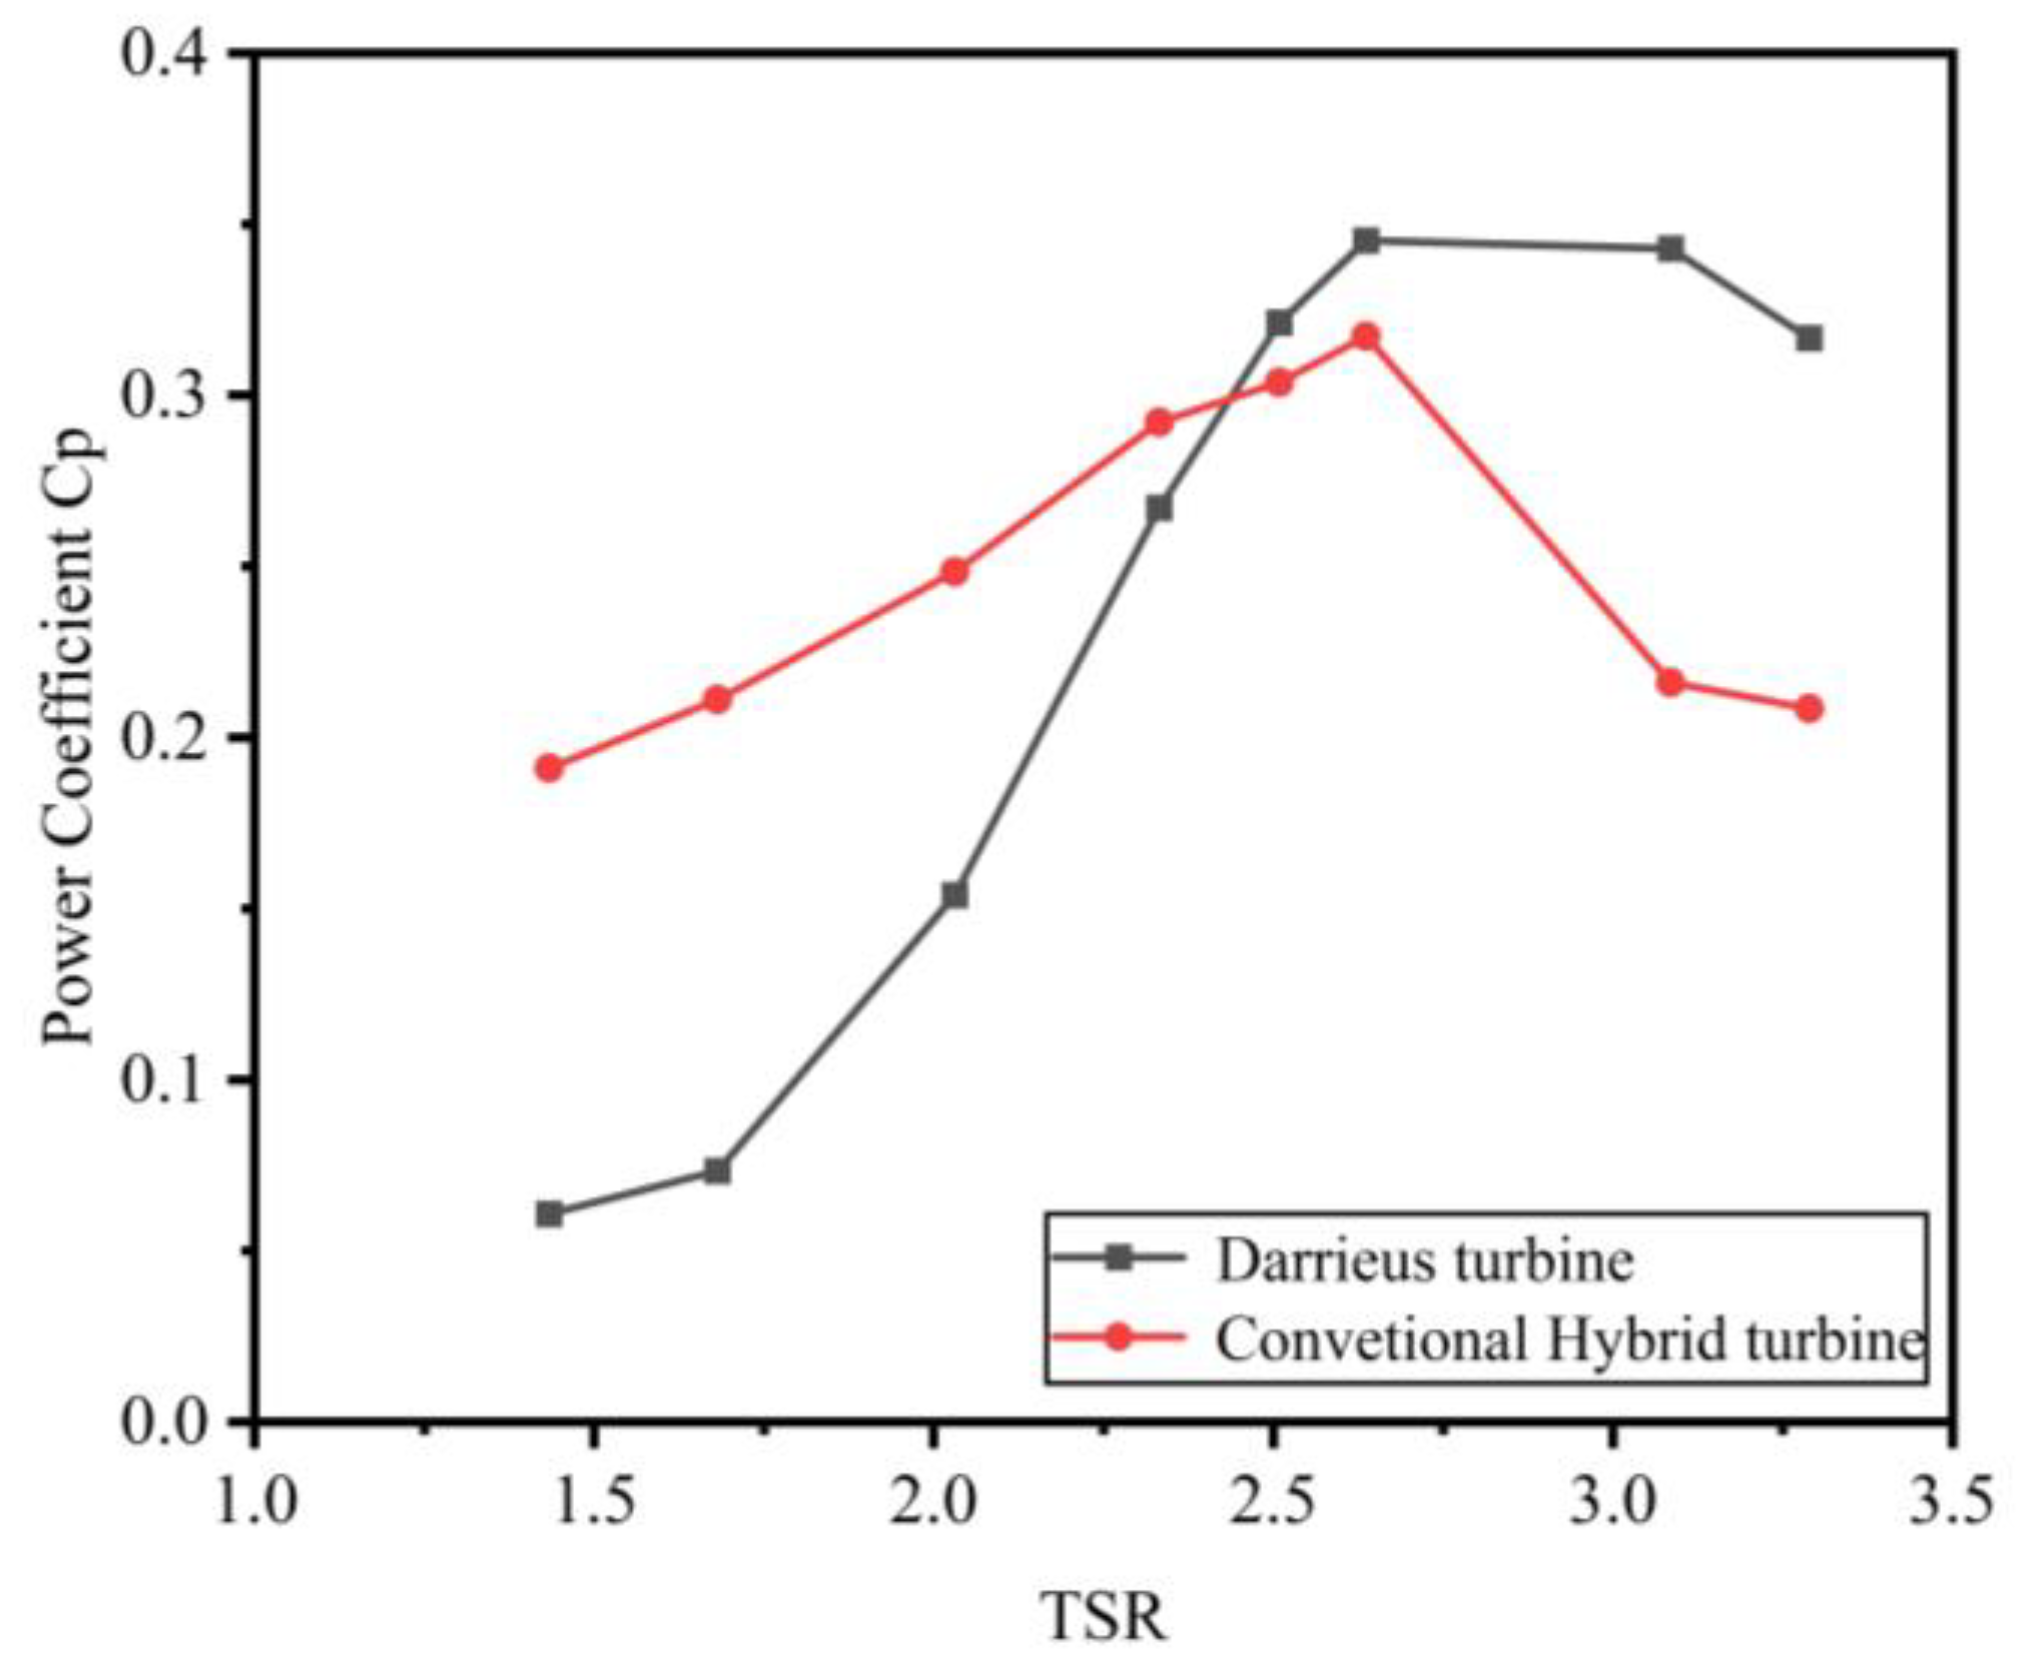
The power coefficient of Darrieus and conventional hybrid turbines changes with varying tip–speed ratios.
As shown in Figure 9, at lower blade tip–speed ratios, the hybrid wind turbine exhibits a notable improvement in the power coefficient, reaching up to twice the value seen in a Darrieus-type wind turbine. In other words, the torque coefficient can be improved, primarily because of the substantial torque produced by the drag-type blades. By contrast, in the high tip–speed ratio region (TSR > 2.5), the hybrid wind turbine’s power coefficient decreases by 36% compared to the Darrieus type. This occurs because an excessively high tip–speed ratio causes the drag-type blade to generate negative torque, stopping the rotation of the hybrid wind turbine.
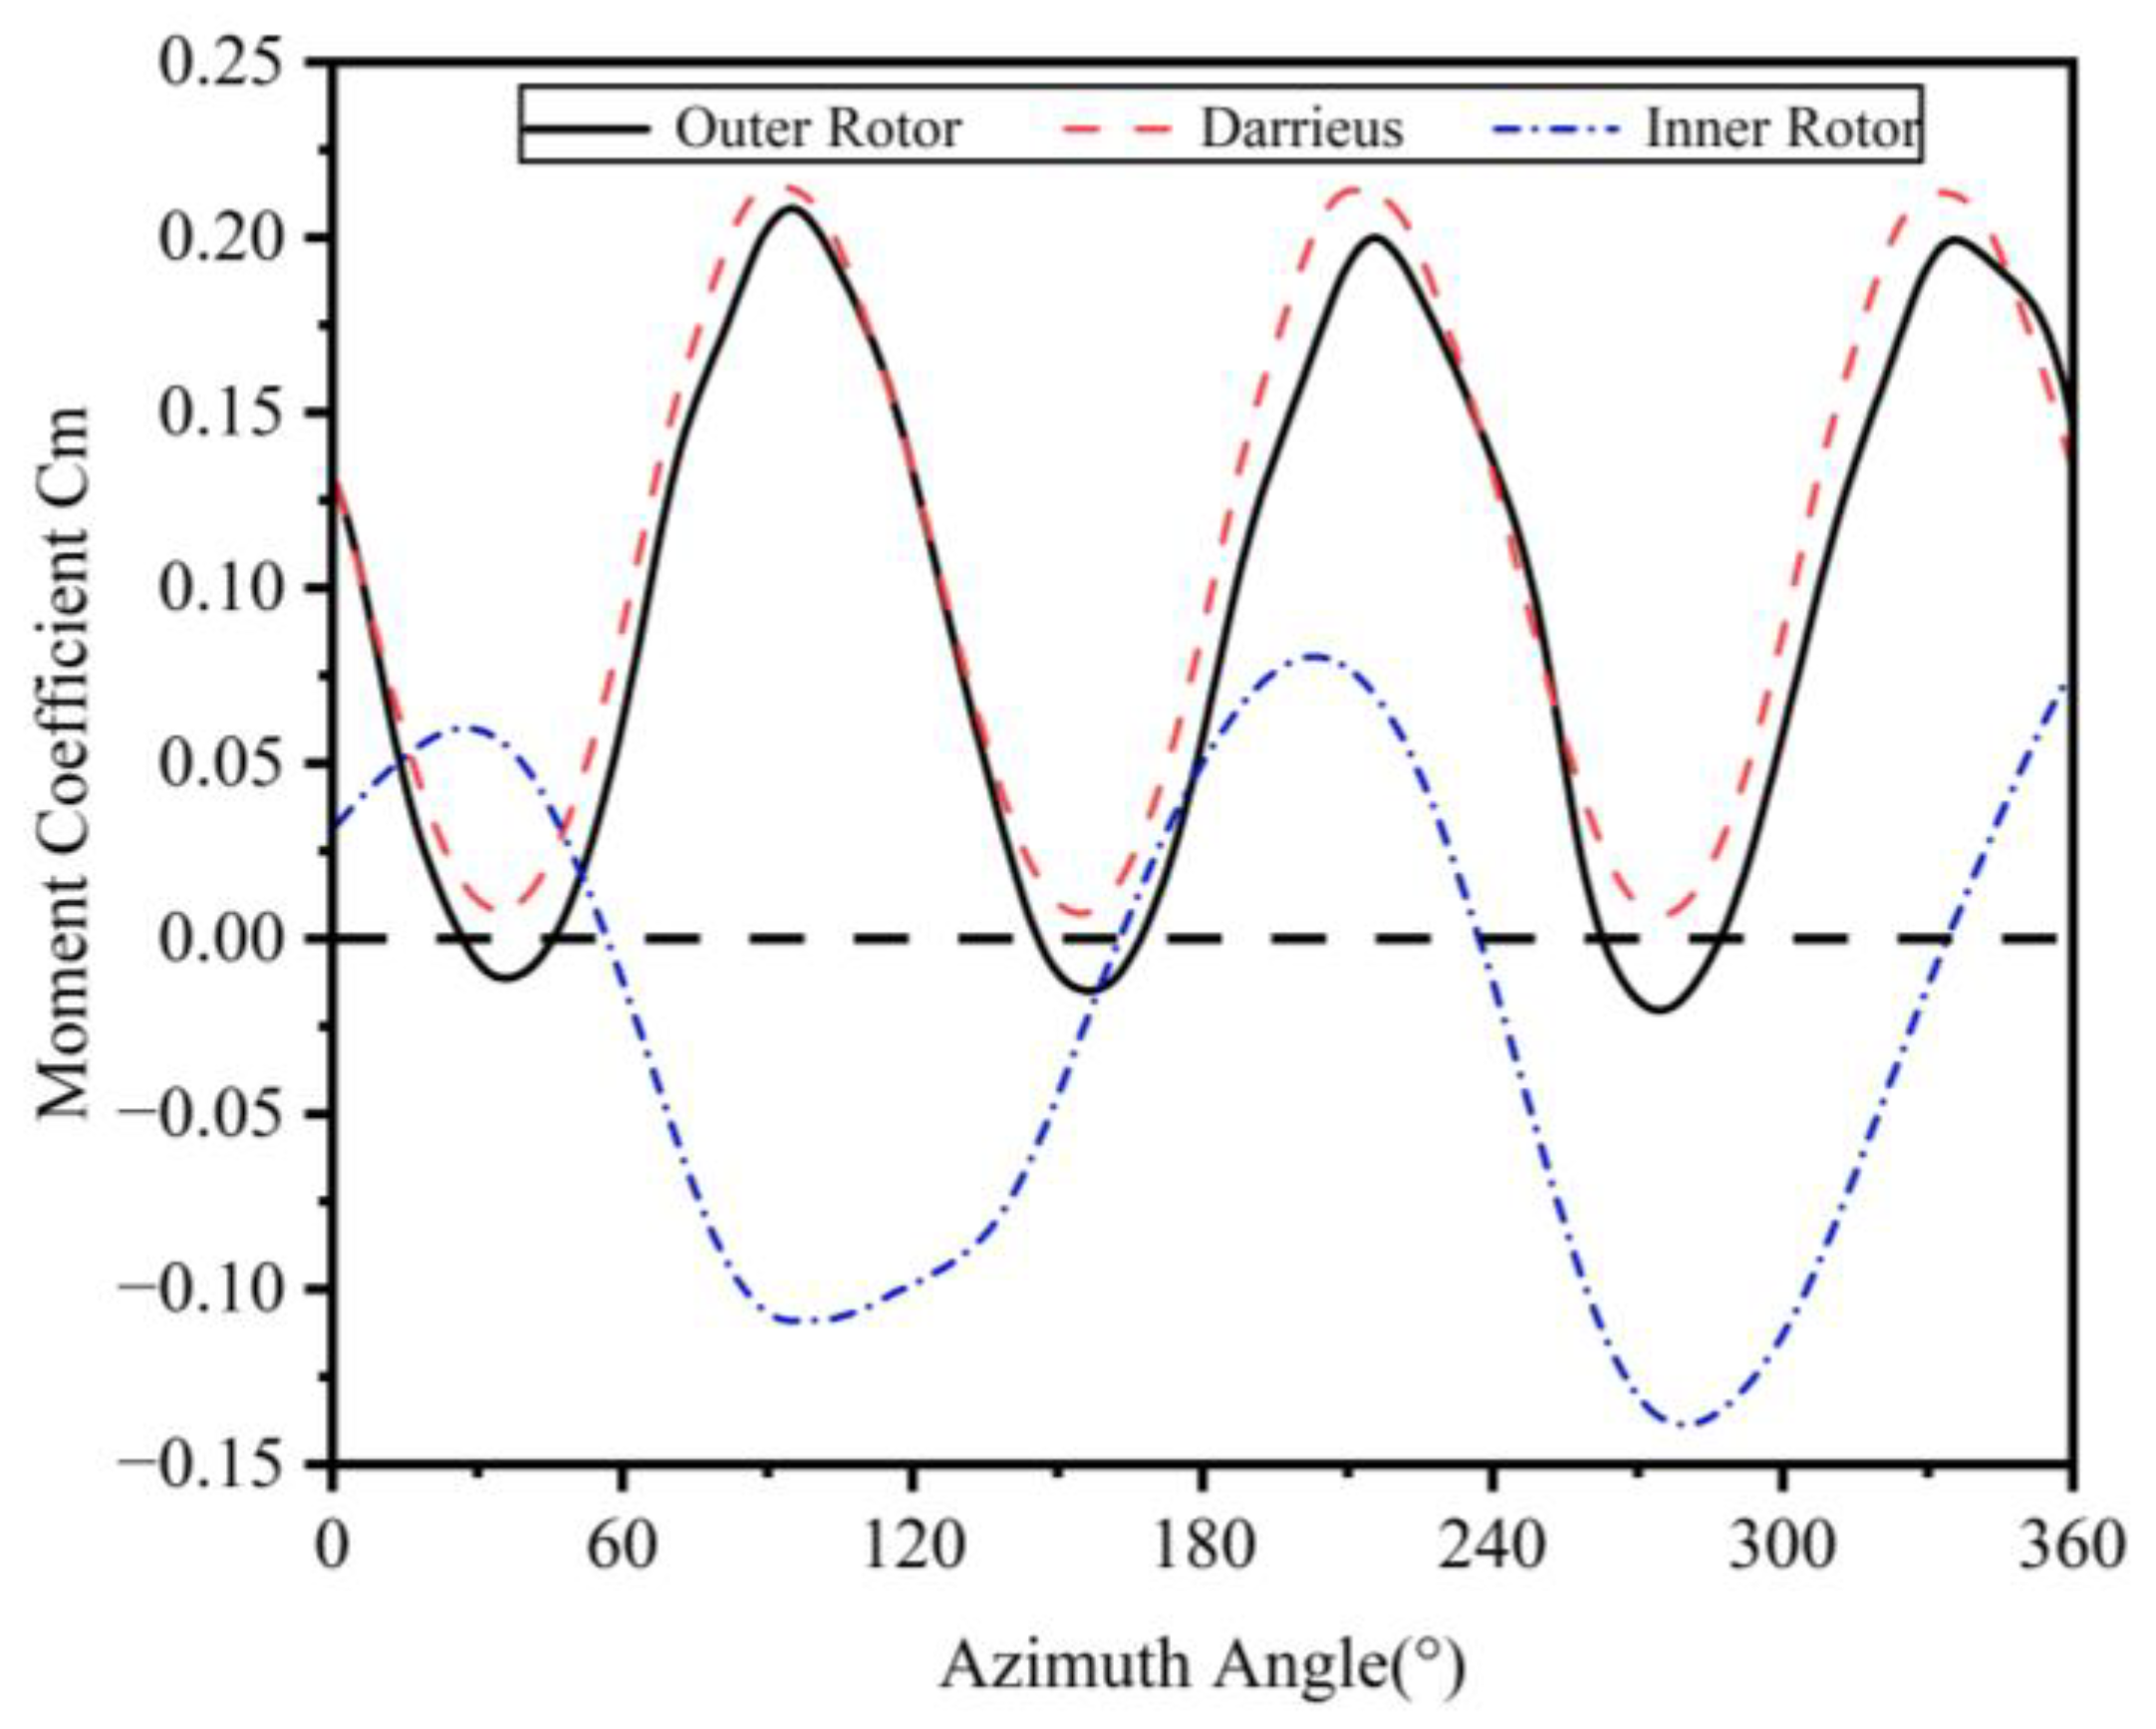
Figure 10 shows the change in torque coefficient of the blades with azimuth during a full rotation cycle for both the hybrid and Darrieus-type wind turbines, at a blade tip–speed ratio of 3. At this particular blade tip–speed ratio, the thrust of the inner rotor is observed to decrease. Within the azimuth angles of 57° to 165° and 237° to 334°, it shows negative torque coefficients. This represents 57% of the rotation cycle. The absolute value of the negative coefficients is much larger than that of the positive ones, leading to a smaller overall coefficient factor.
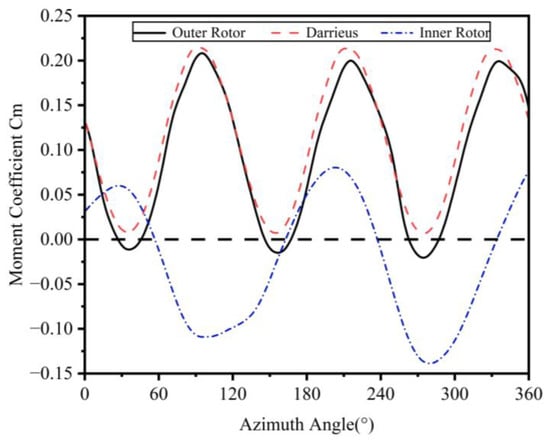
Figure 10.
Torque coefficients of inner and outer rotor (Darrieus) at different azimuth angels.
When a wind turbine’s tip–speed ratio increases, the rotational speed of both its inner and outer rotors increases substantially. This increase in speed results in a significant boost to their dynamic performance. As a result, this has a more significant effect on drag-type blades, leading to a decrease in efficiency. Thus, it is essential to decrease the negative torque produced by the inner rotor blade at higher tip–speed ratios. Thus, this paper utilizes a new type of modified inner rotor blades, with deflectors added to the ends of the inner rotors. This will help improve the overall performance of a wind turbine.
4.2. Hybrid Wind Turbines with Modified Inner Rotor
We compare and contrast the self-starting performance and power coefficients of the modified hybrid turbines, conventional hybrid turbines, and Darrieus-type turbines. Aerodynamic performance will also be considered.
4.2.1. Torque Coefficient (Cm)
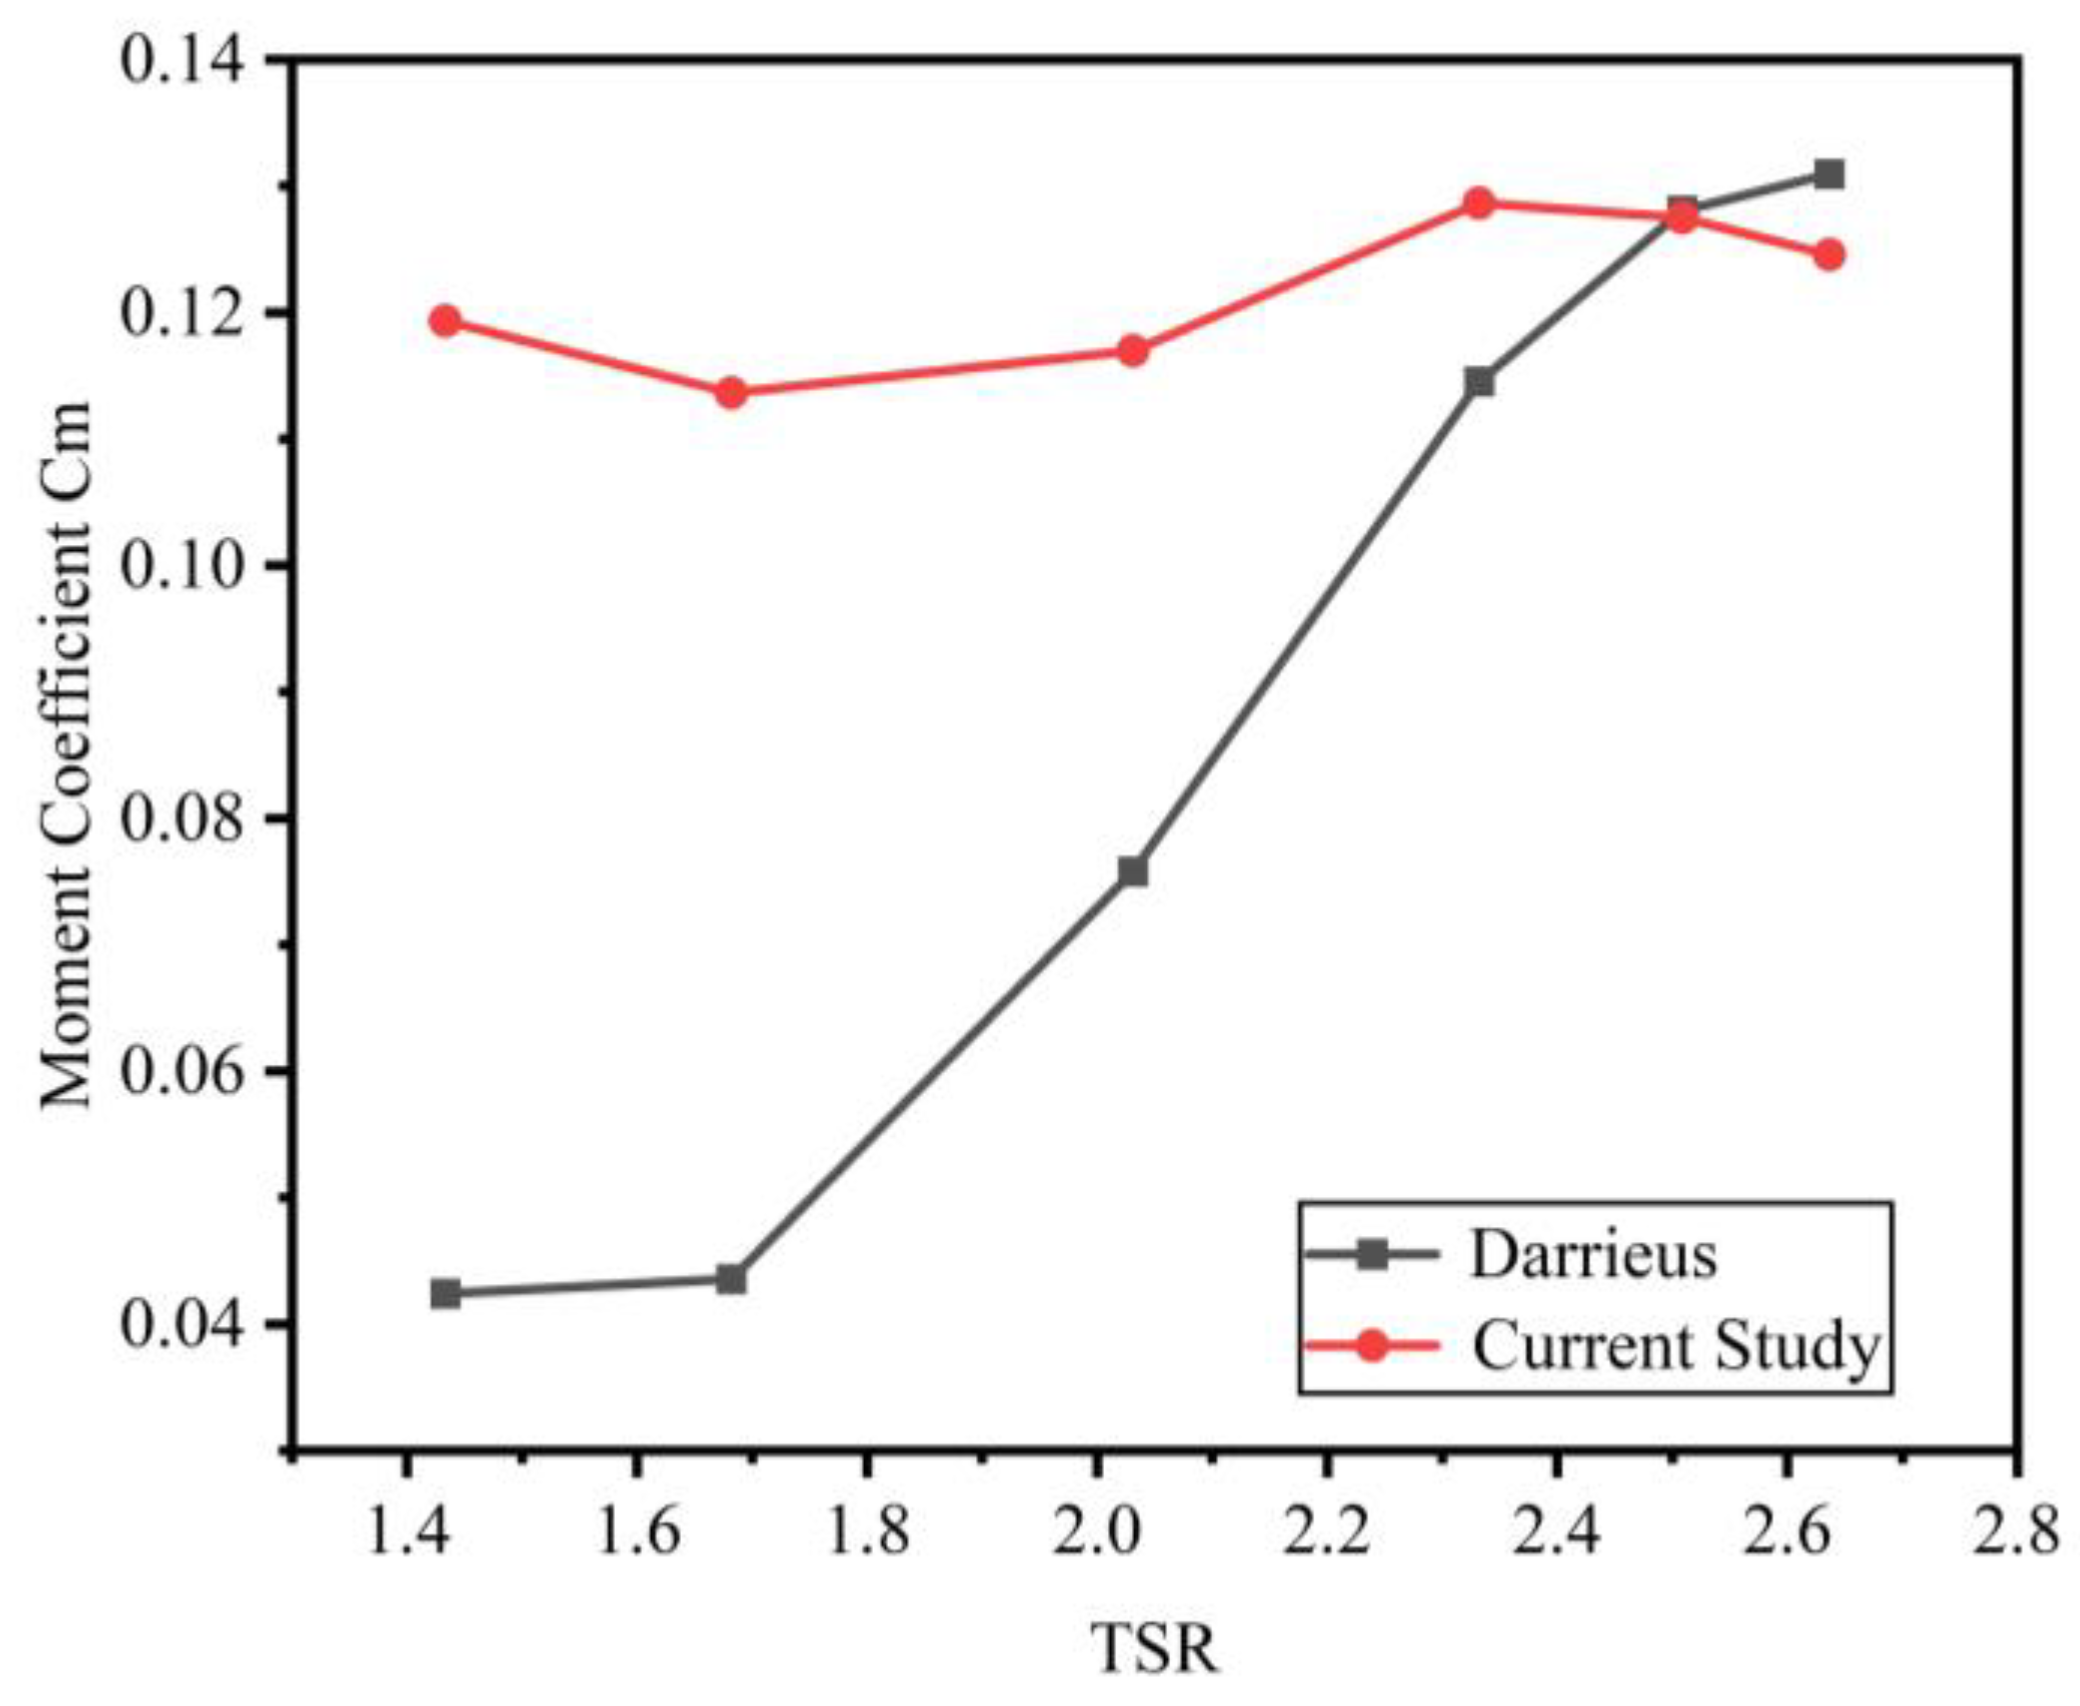
The torque coefficient acts as a crucial indicator for evaluating the self-starting ability of a wind turbine. Here, we examine the connection between the wind load torque coefficients of the newly modified hybrid vertical-axis wind turbine and the conventional Darrieus straight-bladed vertical-axis wind turbine. This comparison clearly demonstrates the self-starting performance of both the modified hybrid wind turbine and the traditional Darrieus wind turbine at various blade tip–speed ratios. It can be clearly seen in Figure 11 that the torque coefficient of the modified hybrid wind turbine surpasses that of conventional Darrieus wind turbines, especially at blade tip–speed ratios up to 2.51. Notably, the torque coefficient of the improved hybrid vertical axis wind turbine is 182% higher than that of the Darrieus wind turbines with the same tip–speed ratio of 1.43. This substantial rise significantly boosts the self-starting ability of the wind power generation system, especially when the tip–speed ratio is comparatively low. The modified hybrid vertical axis wind turbine shows a 20.6% increase in the average torque coefficient compared to the conventional Darrieus wind turbine.
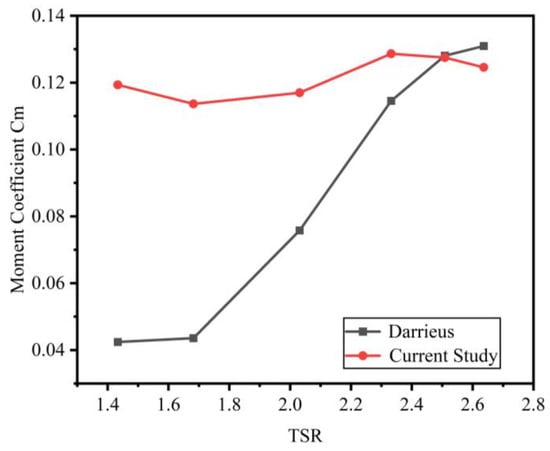
Figure 11.
Moment coefficient at different TSRs for the modified turbine and Darrieus turbine.
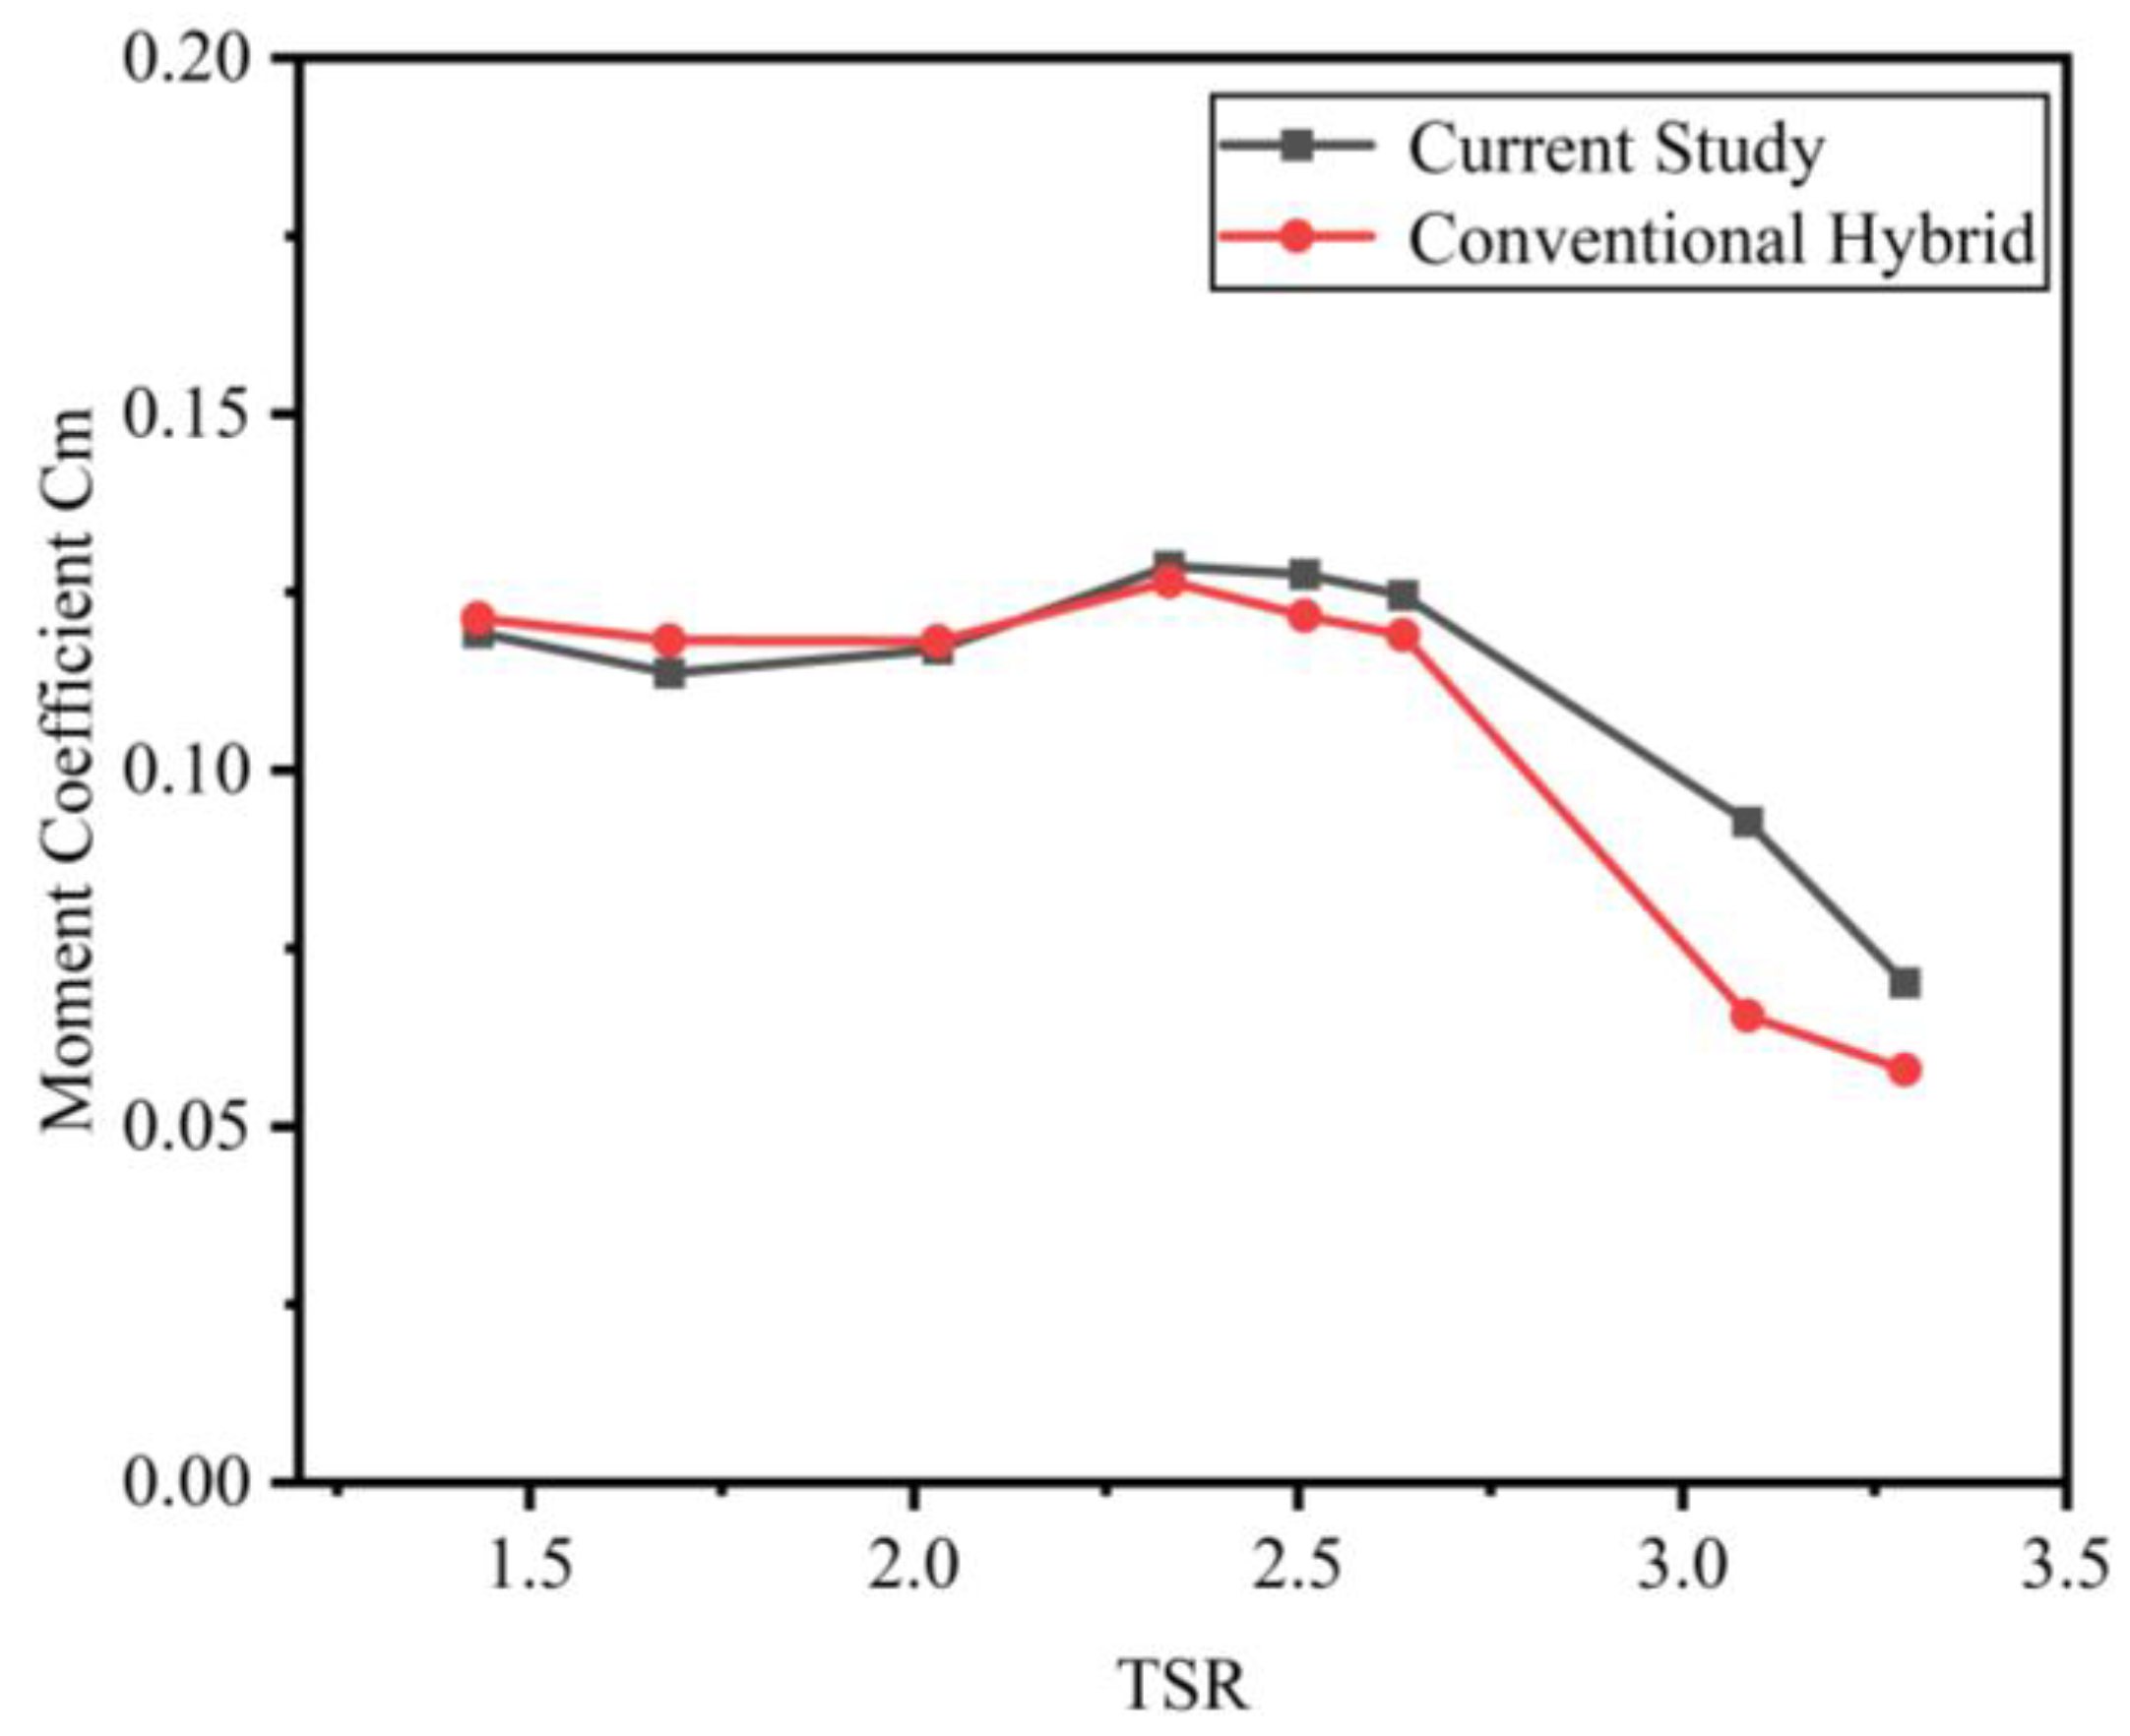
In contrast, the hybrid vertical-axis wind turbine adapted from an inner-rotor design shows a higher torque coefficient than the conventional hybrid vertical-axis wind turbine. As shown in Figure 12, the torque coefficient of the modified hybrid wind turbine at various tip–speed ratios (TSRs) aligns with that of the conventional hybrid wind turbine at different TSRs. Before a TSR of 2.03, the difference in the torque coefficient between the two turbines is minimal. However, as the TSR increases beyond this threshold, the benefits of the modified hybrid wind turbine become more apparent. Notably, at a tip–speed ratio of 3.08, the torque coefficient of the modified hybrid wind turbine exhibits a substantial rise of 41.5% over the traditional hybrid wind turbine. By contrast, within the range of relatively low tip–speed ratios prior to this point, the maximum difference in torque coefficient between the modified and traditional hybrid wind turbines is only 4%.
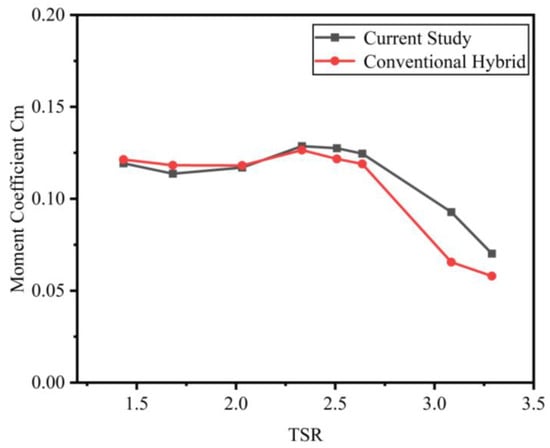
Figure 12.
Modified and conventional types at different TSRs.
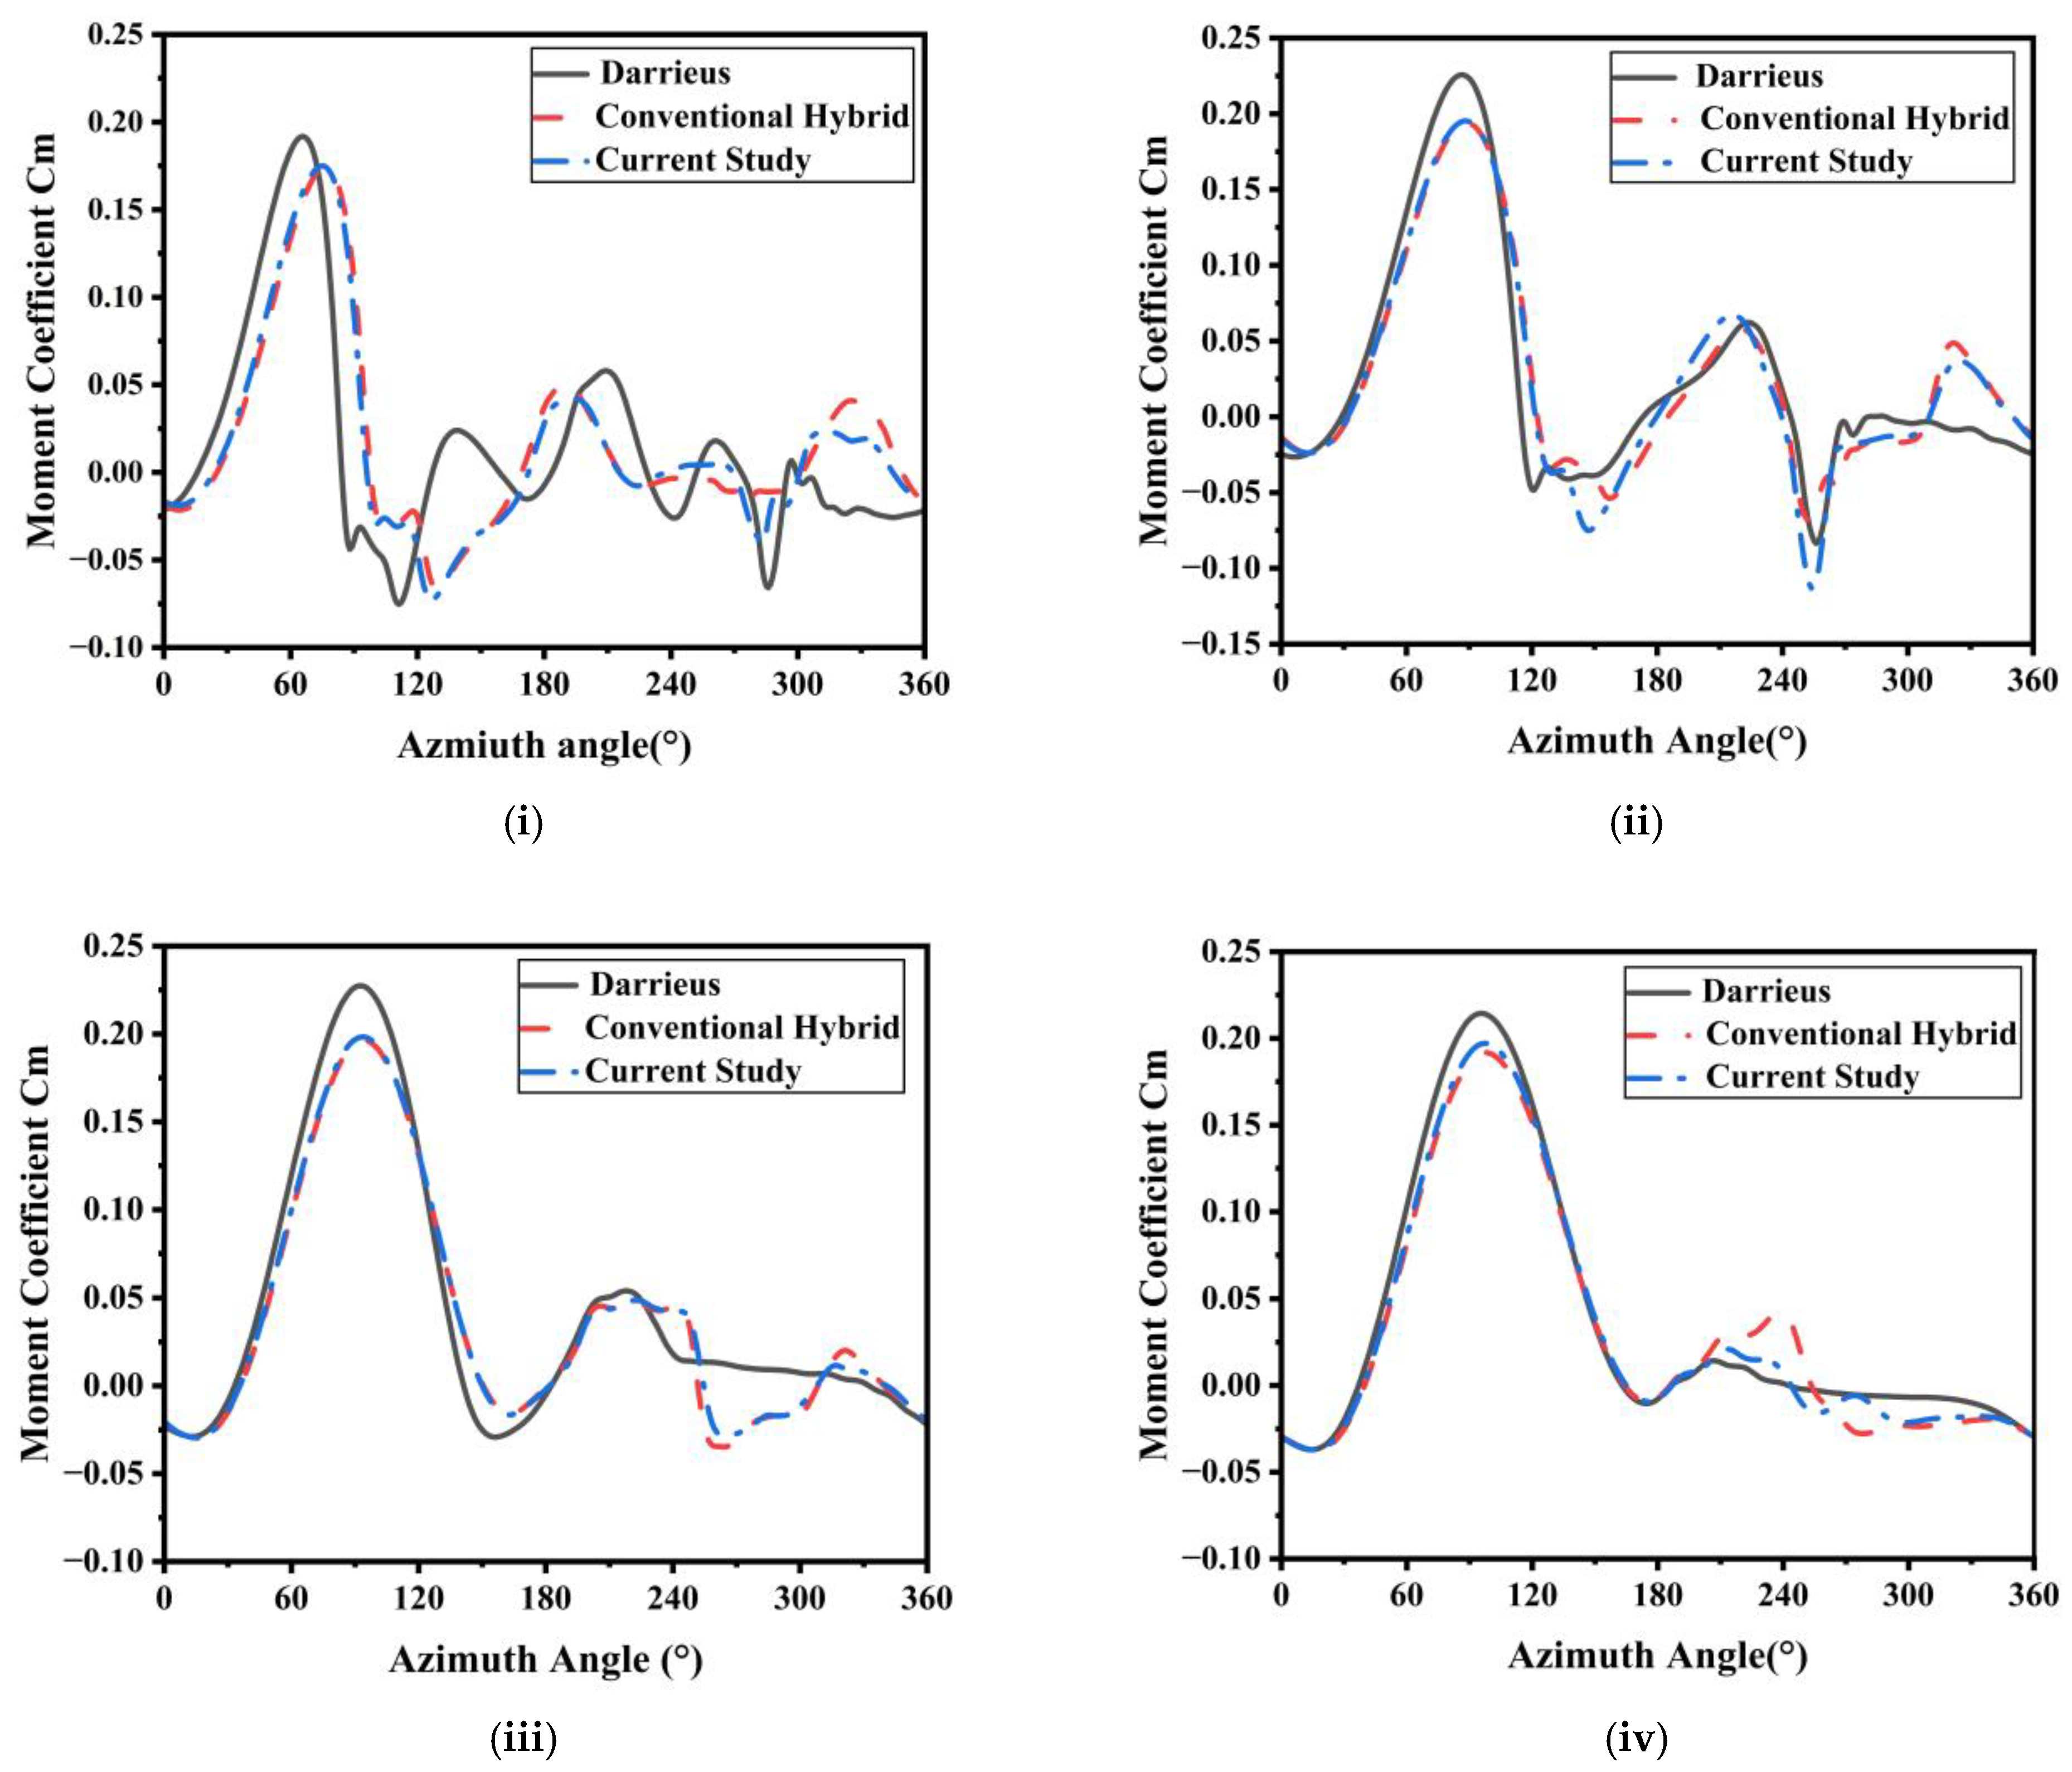
Figure 13 illustrates the variation of single blade torque coefficient with azimuth angle for hybrid wind turbine and Darrieus wind turbine outer rotor at different tip–speed ratios. This diagram clearly shows that the inner rotor’s presence greatly affects the trend of the outer rotor’s torque coefficient. This effect is especially evident around 90 degrees and in the range from roughly 190 to 350 degrees. The inner rotor’s presence leads to low tip–speed ratios. The inner rotor is trailing behind the rotor. Currently, in the windward area, changes in the inner rotor speed have little effect on the outer rotor. However, when the blades function on the leeward side and the external rotor lies within the wake region of the internal rotor, it does have a notable impact on blade performance. Its Cm is reduced by a maximum of 32% in the leeward side. However, with a modified inner rotor, 8% less Cm reduction was observed compared to the conventional inner rotor; thus, this modified inner rotor has a lesser impact on the operational stability of the external rotor compared to a conventional inner rotor.
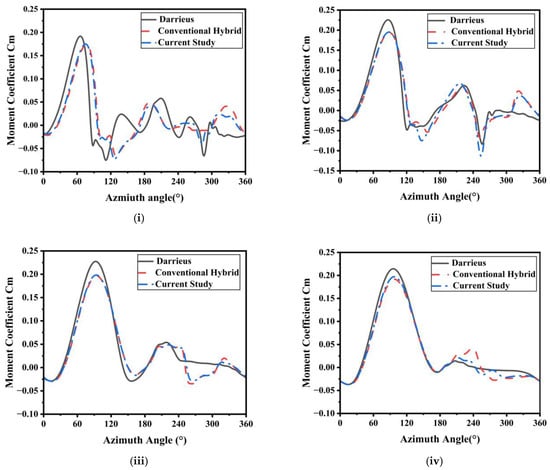
Figure 13.
Variations in the single blade moment coefficient at different azimuth angles for various tip–speed ratios: (i) λ = 1.43, (ii) λ = 2.03, (iii) λ = 2.5, and (iv) λ = 3.08.
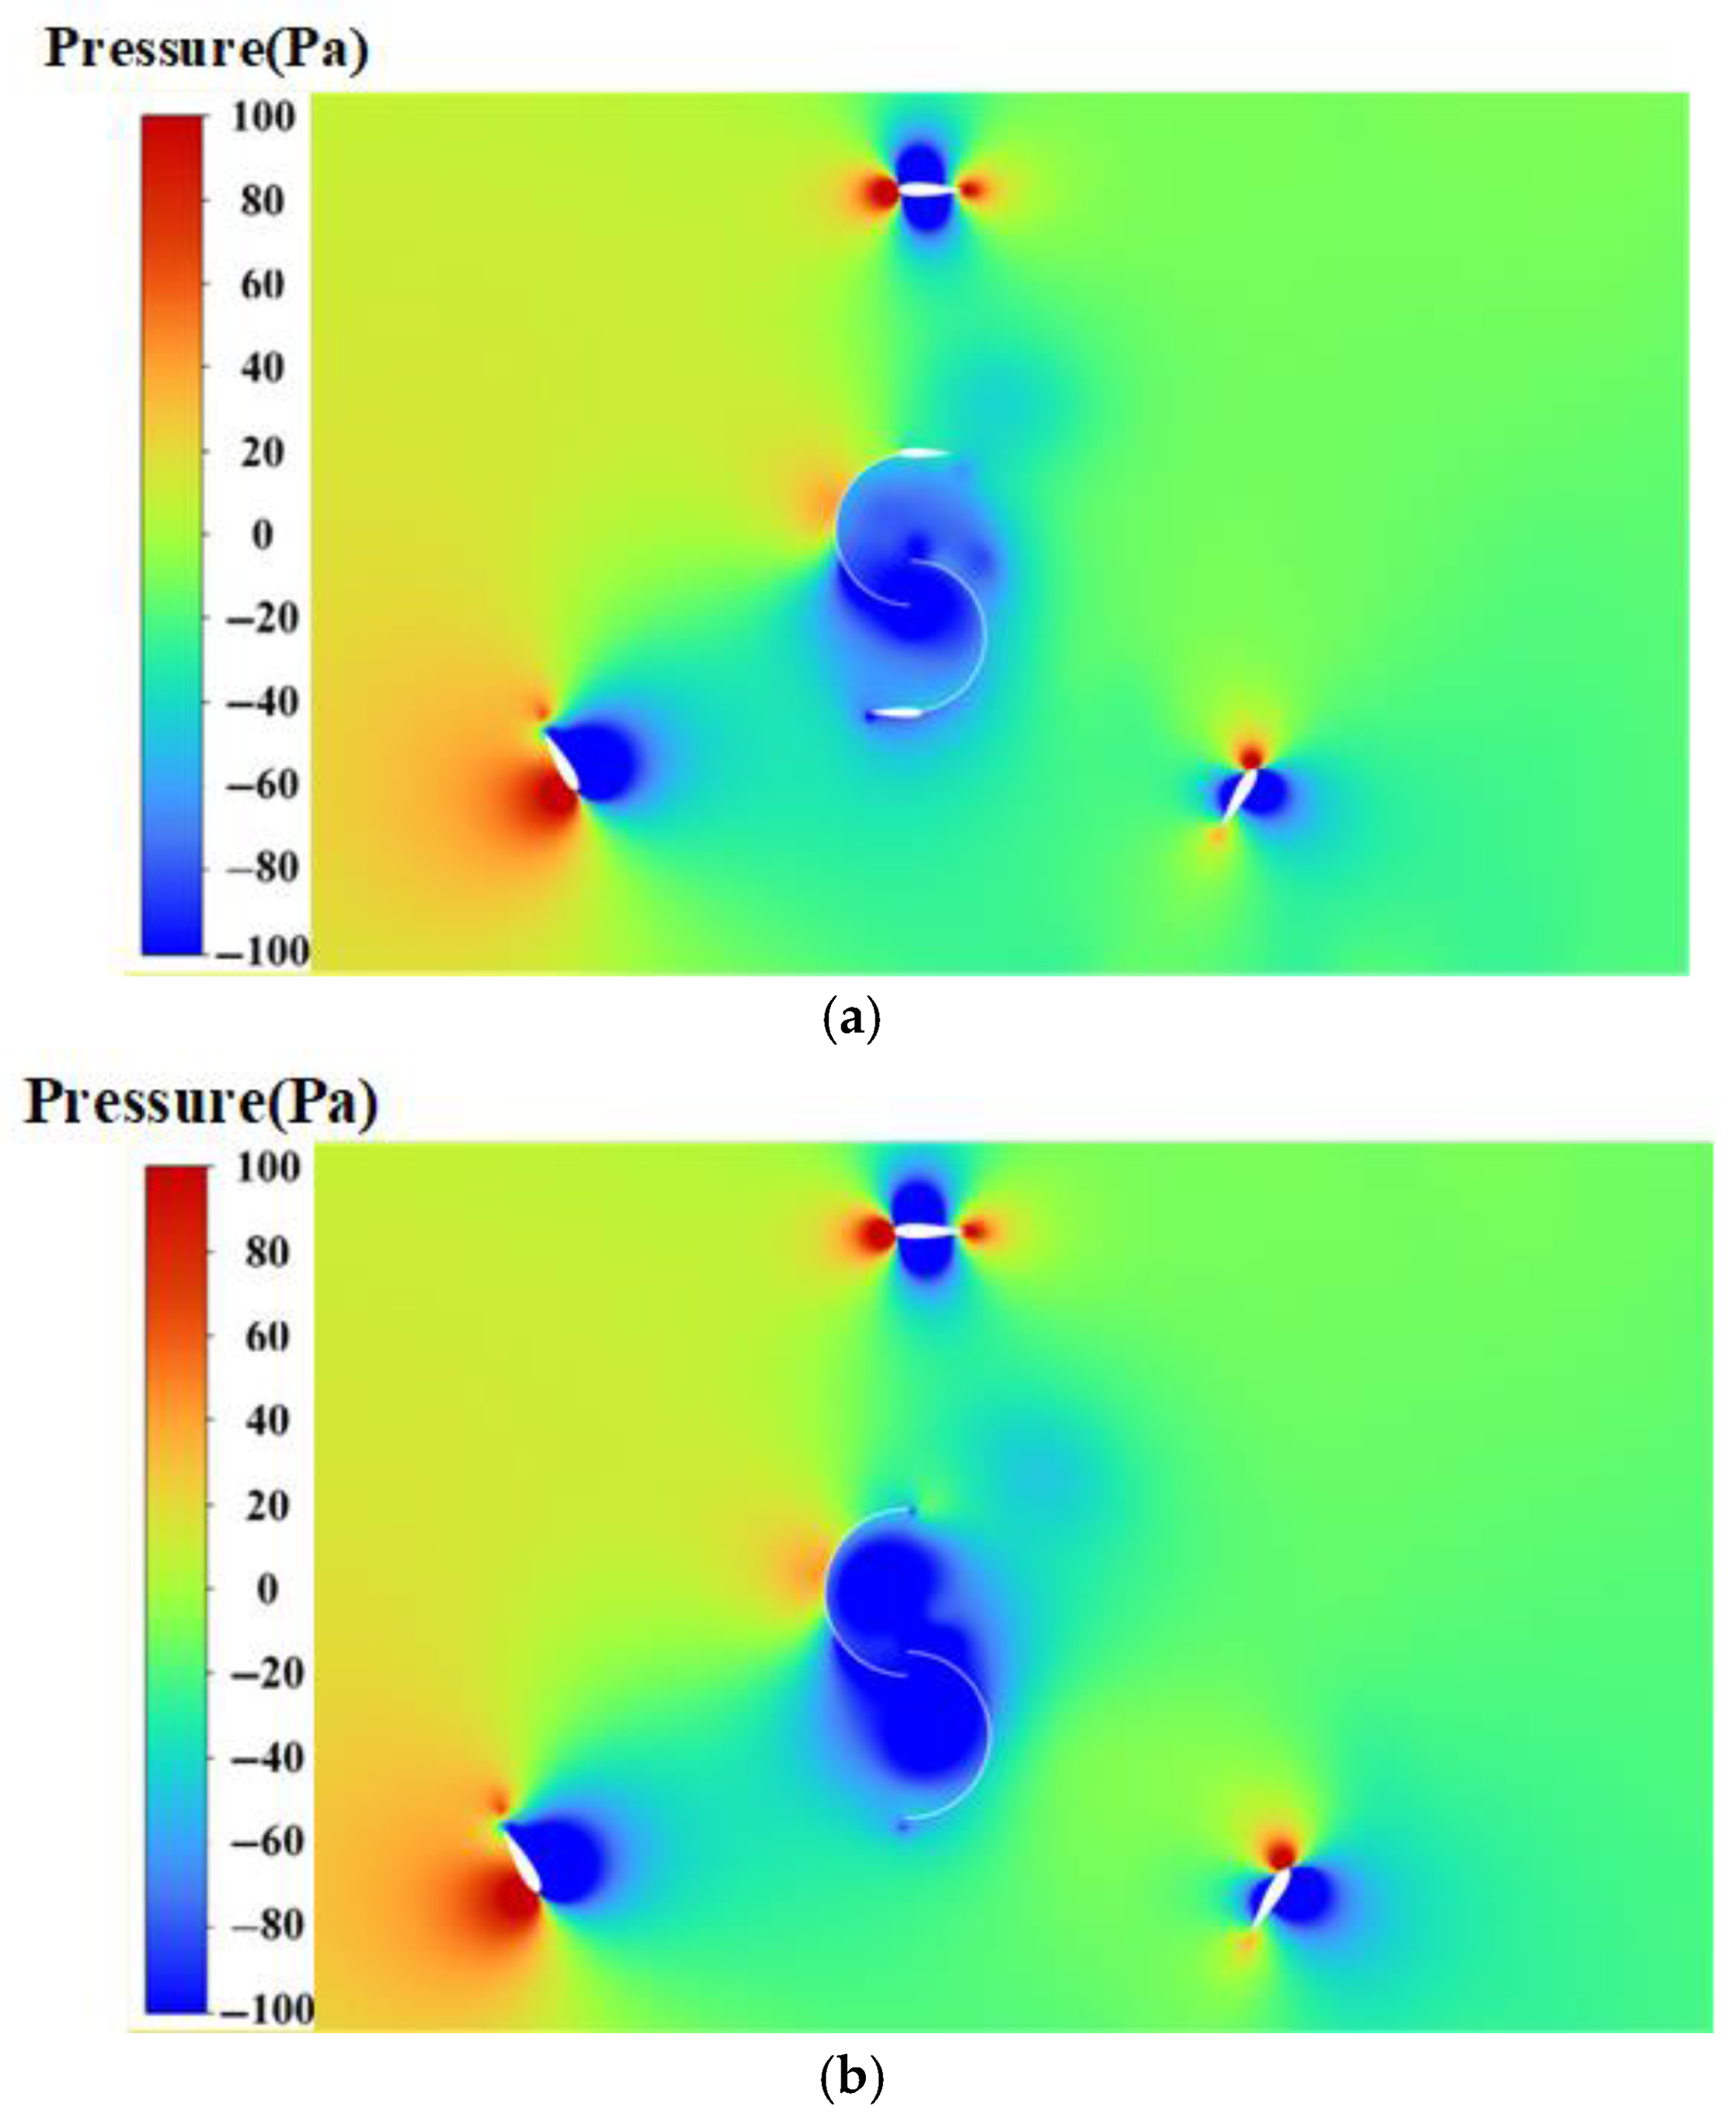
As shown by the pressure cloud in Figure 14, at this moment, only the incoming wind impacts the upstream section of the outer rotor blade. As a result, the pressure distribution on the high-pressure side stays uniform, just as it does on the low-pressure side. The inner rotor of the hybrid wind turbine exerts substantial pressure on the windward side. The pressure in the inner low-pressure area is steadily decreasing. In the redesigned hybrid wind turbine, the pressure difference across the upper part of the inner rotor is relatively smaller, as the difference in pressure values is about 70 pa. By contrast, the pressure difference across the upper part of the inner rotor in a traditional hybrid design is notably larger, i.e., about 130 pa. Thus, the traditional inner rotor faces increased resistance at higher tip–speed ratios, impeding the wind turbine’s overall rotation and negatively impacting its performance. The modified type shows outstanding torque performance, with an average torque coefficient 7.4% higher than that of the conventional type.

Figure 14.
Pressure distribution diagram: (a) modified (b) traditional.
4.2.2. Power (Cp)
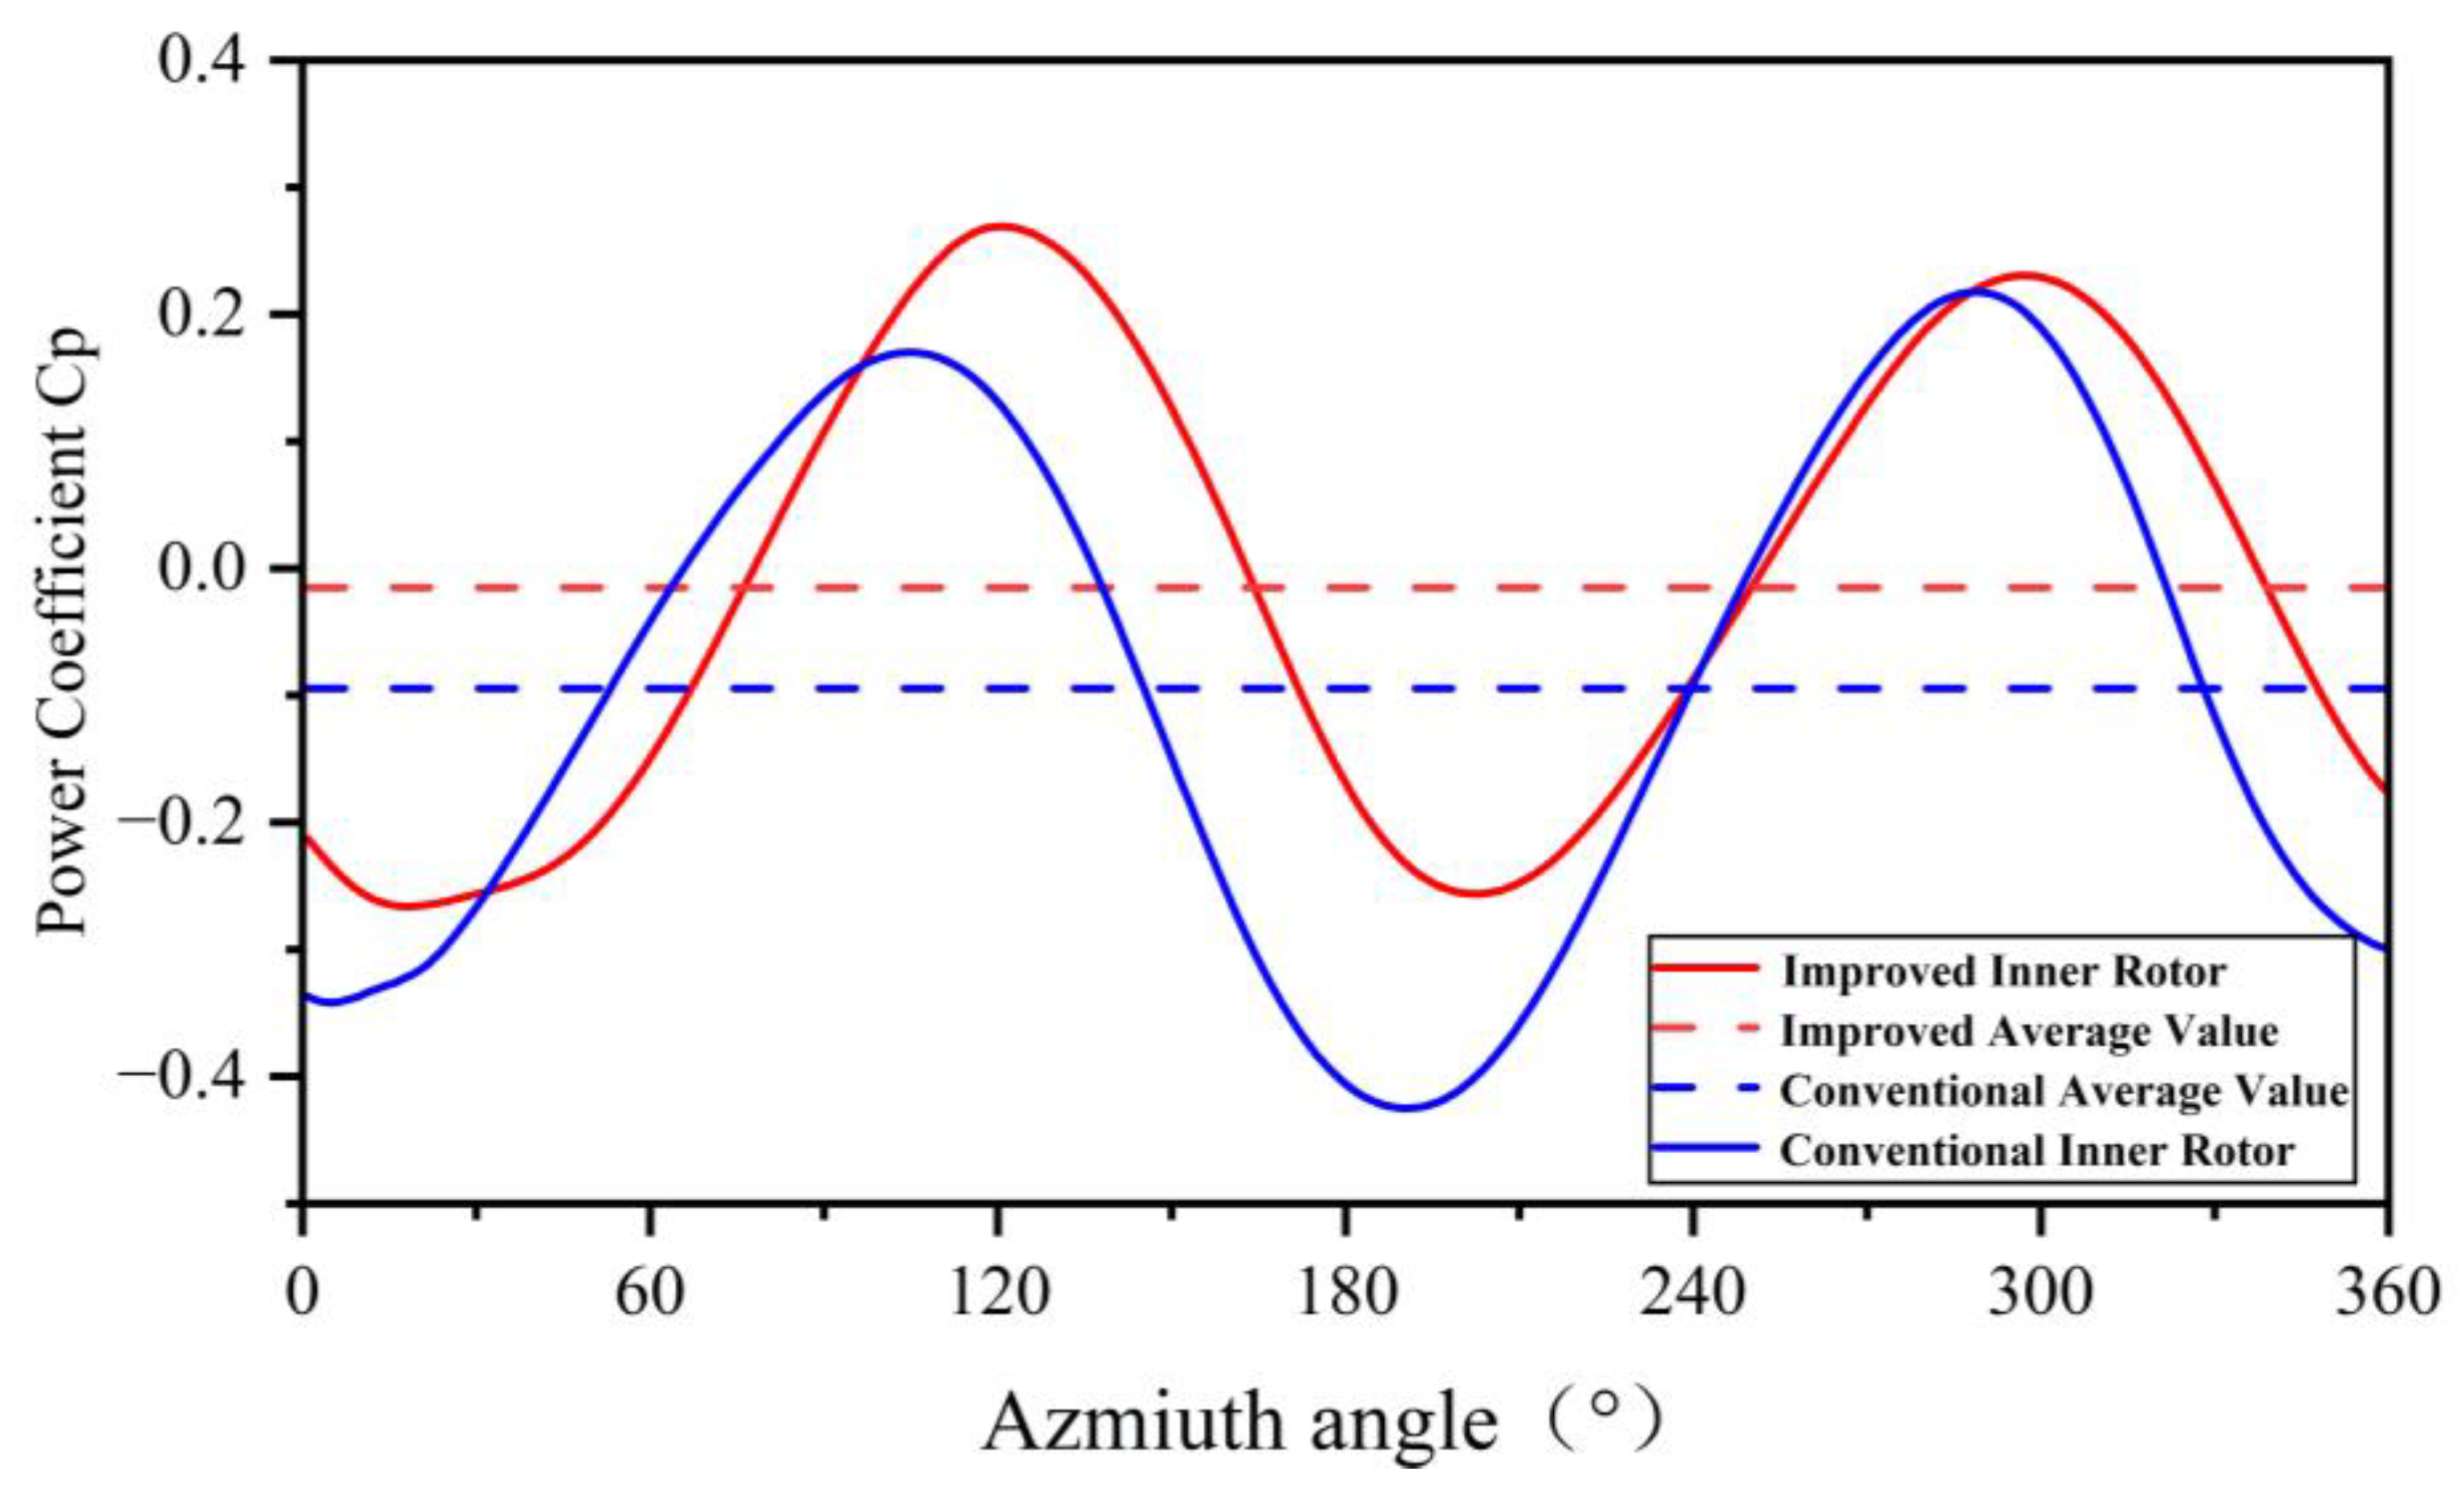
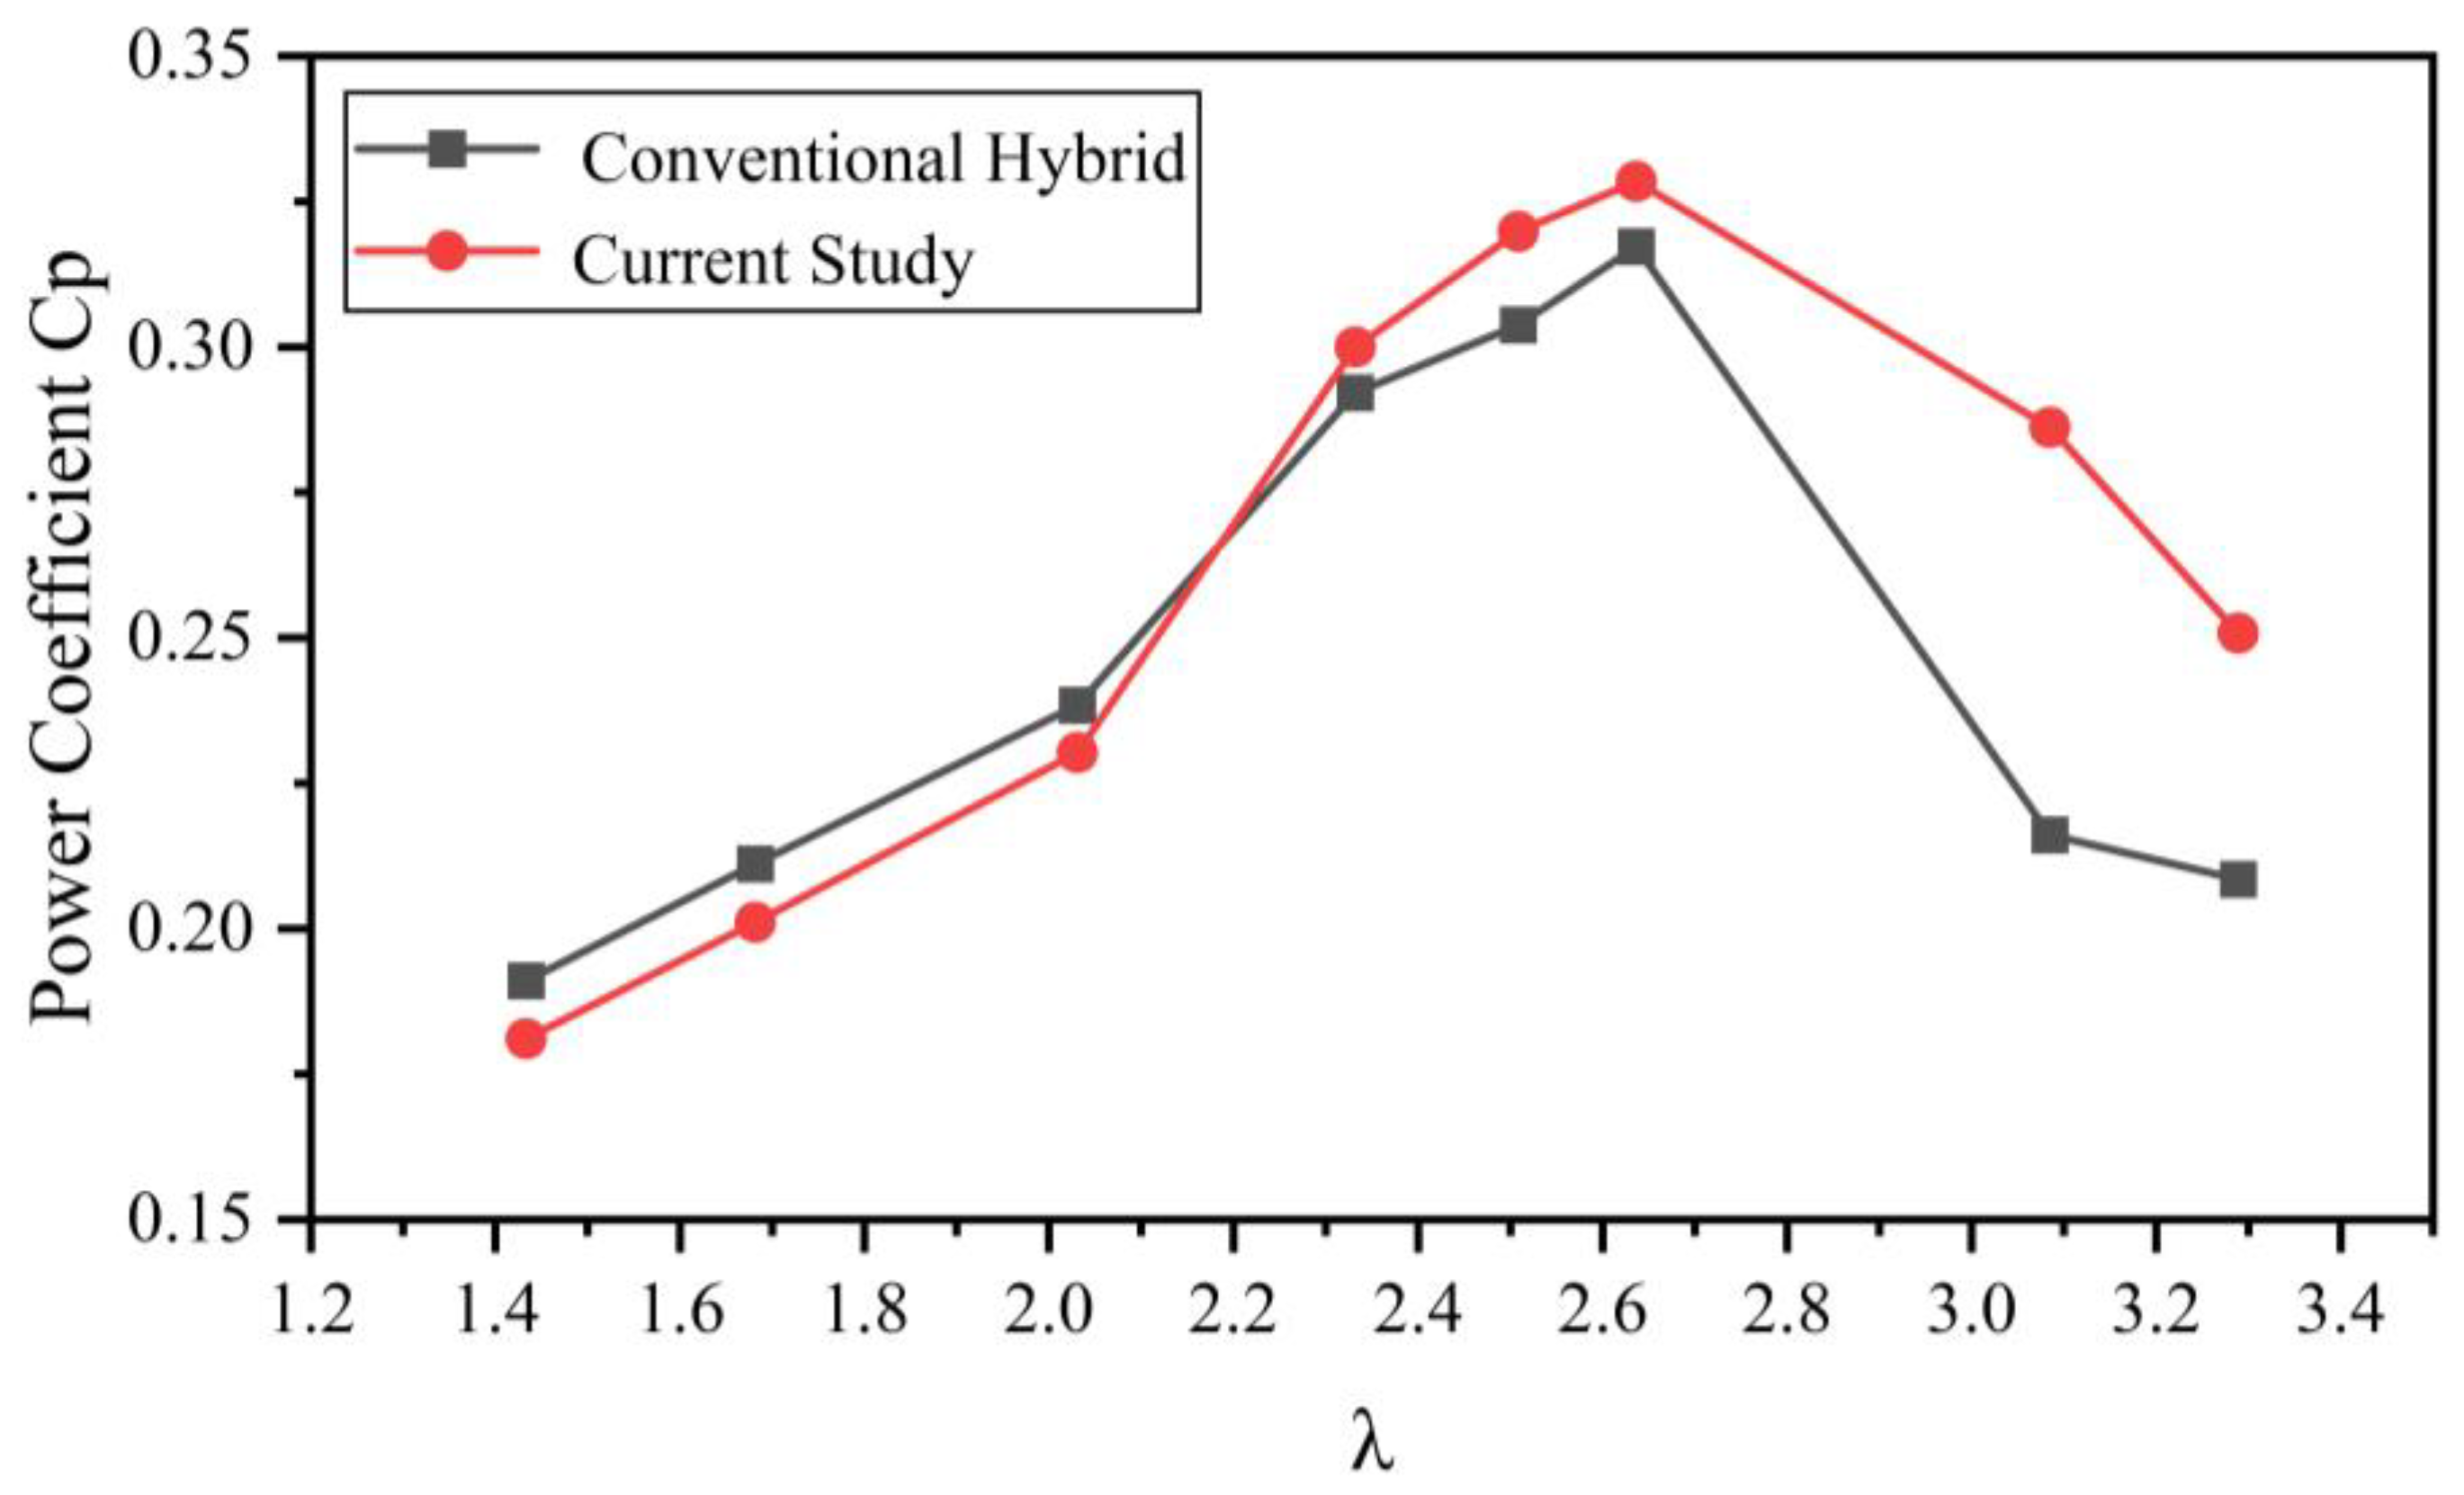
This section examines the Cp value of the modified hybrid wind turbines. The analysis uses simulation results, which are then compared with those from the conventional Darrieus–Savonius hybrid wind turbine, to gain a more thorough understanding. We will start our analysis by comparing the power coefficients produced by both inner rotor configurations at the same blade tip–speed ratios. As shown in Figure 14, the average power coefficients at a blade tip–speed ratio of 3.08 are approximately 80% higher than those of a conventional Savonius-type inner rotor. As shown in Figure 15, the modified inner rotor outperforms the Savonius rotor in the angular ranges of 0–32°, 97–242°, and 287–360°. These sectors comprise up to 70% of the total area, significantly contributing to the improved performance of the modified blades. To offer a more effective power comparison between the two types, Figure 16 shows the power coefficients of both the modified and traditional hybrid wind turbines at different tip–speed ratios. It is also worth noting that the overall shape of the Cp-λ plot changes. As illustrated in the figure, the maximum power coefficient was increased. When λ varied between 1.4 and 2.2, the power coefficients of the modified hybrid wind turbine were lower than those of the conventional type. However, within the λ range of 2.2 to 3.2, the modified hybrid wind turbine demonstrated better performance. This indicates that, unlike the conventional hybrid wind turbine, the modified design effectively tackles the problem of power coefficient reduction at high blade tip–speed ratios and reduces negative power generation. The greatest improvement reached 32.4%. The overall average power factor has also been increased by 11.3%, which improves the overall performance of the composite vertical axis wind turbine.
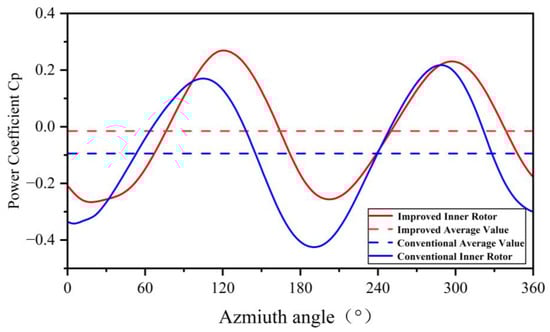
Figure 15.
Inner rotor power coefficient of different azimuth angles.
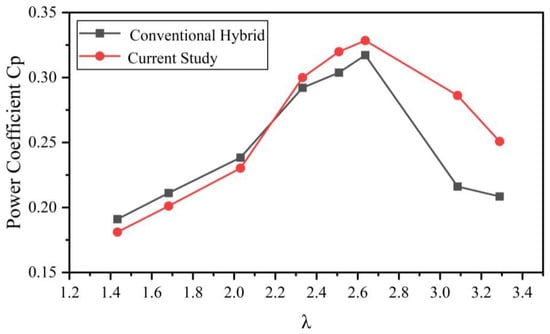
Figure 16.
Examination of power coefficients at different blade tip–speed ratios.
Figure 17 shows that the inner rotor of a standard hybrid wind turbine produces significantly higher levels of turbulent kinetic energy than before the inner rotor’s influence. This rise leads to a more distinct development of turbulent kinetic energy in the downstream flow field. These changes impact not only the inner rotor but also modify the aerodynamic properties of the downwind outer rotor blades. A lower turbulence intensity often suggests that the wind will be gentler and more consistent, which is typically beneficial for wind turbines. Wind turbines generally operate more efficiently with steady winds and reduced turbulence. Severe turbulence may lead to unpredictable wind shifts, preventing the turbine blades from consistently functioning at their best. This can lower efficiency and inflict greater damage on the wind turbine’s components, given the wind’s constant changes. By contrast, the inner rotor of a hybrid wind turbine produces minimal levels of turbulence kinetic energy. This energy can, to some extent, reduce the non-uniform turbulence linked to the inner rotor. As a result, it lessens the impact of disturbances from the inner rotor on the outer rotor blade’s loads. The reason is that placing a deflector at the inner rotor’s termination point can enhance airflow. As a result, this may decrease turbulence generation and diminish the intensity of the wake area. The modified inner rotor generates approximately 60% less turbulent kinetic energy than the conventional inner rotor. At the same time, it can enhance the efficiency of the inner rotor and, to some extent, improve the torque performance of the outer rotor within the wake region, leading to a higher power coefficient for the outer rotor.
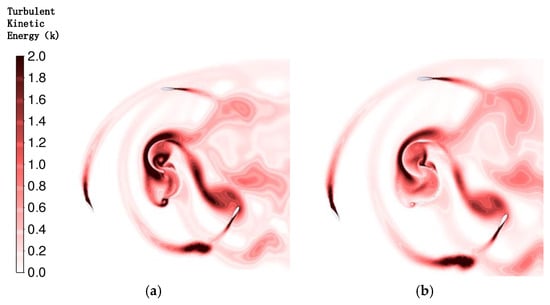
Figure 17.
Turbulent kinetic energy diagram. (a) Conventional hybrid. (b) Modified hybrid.
4.3. Wake Characteristics
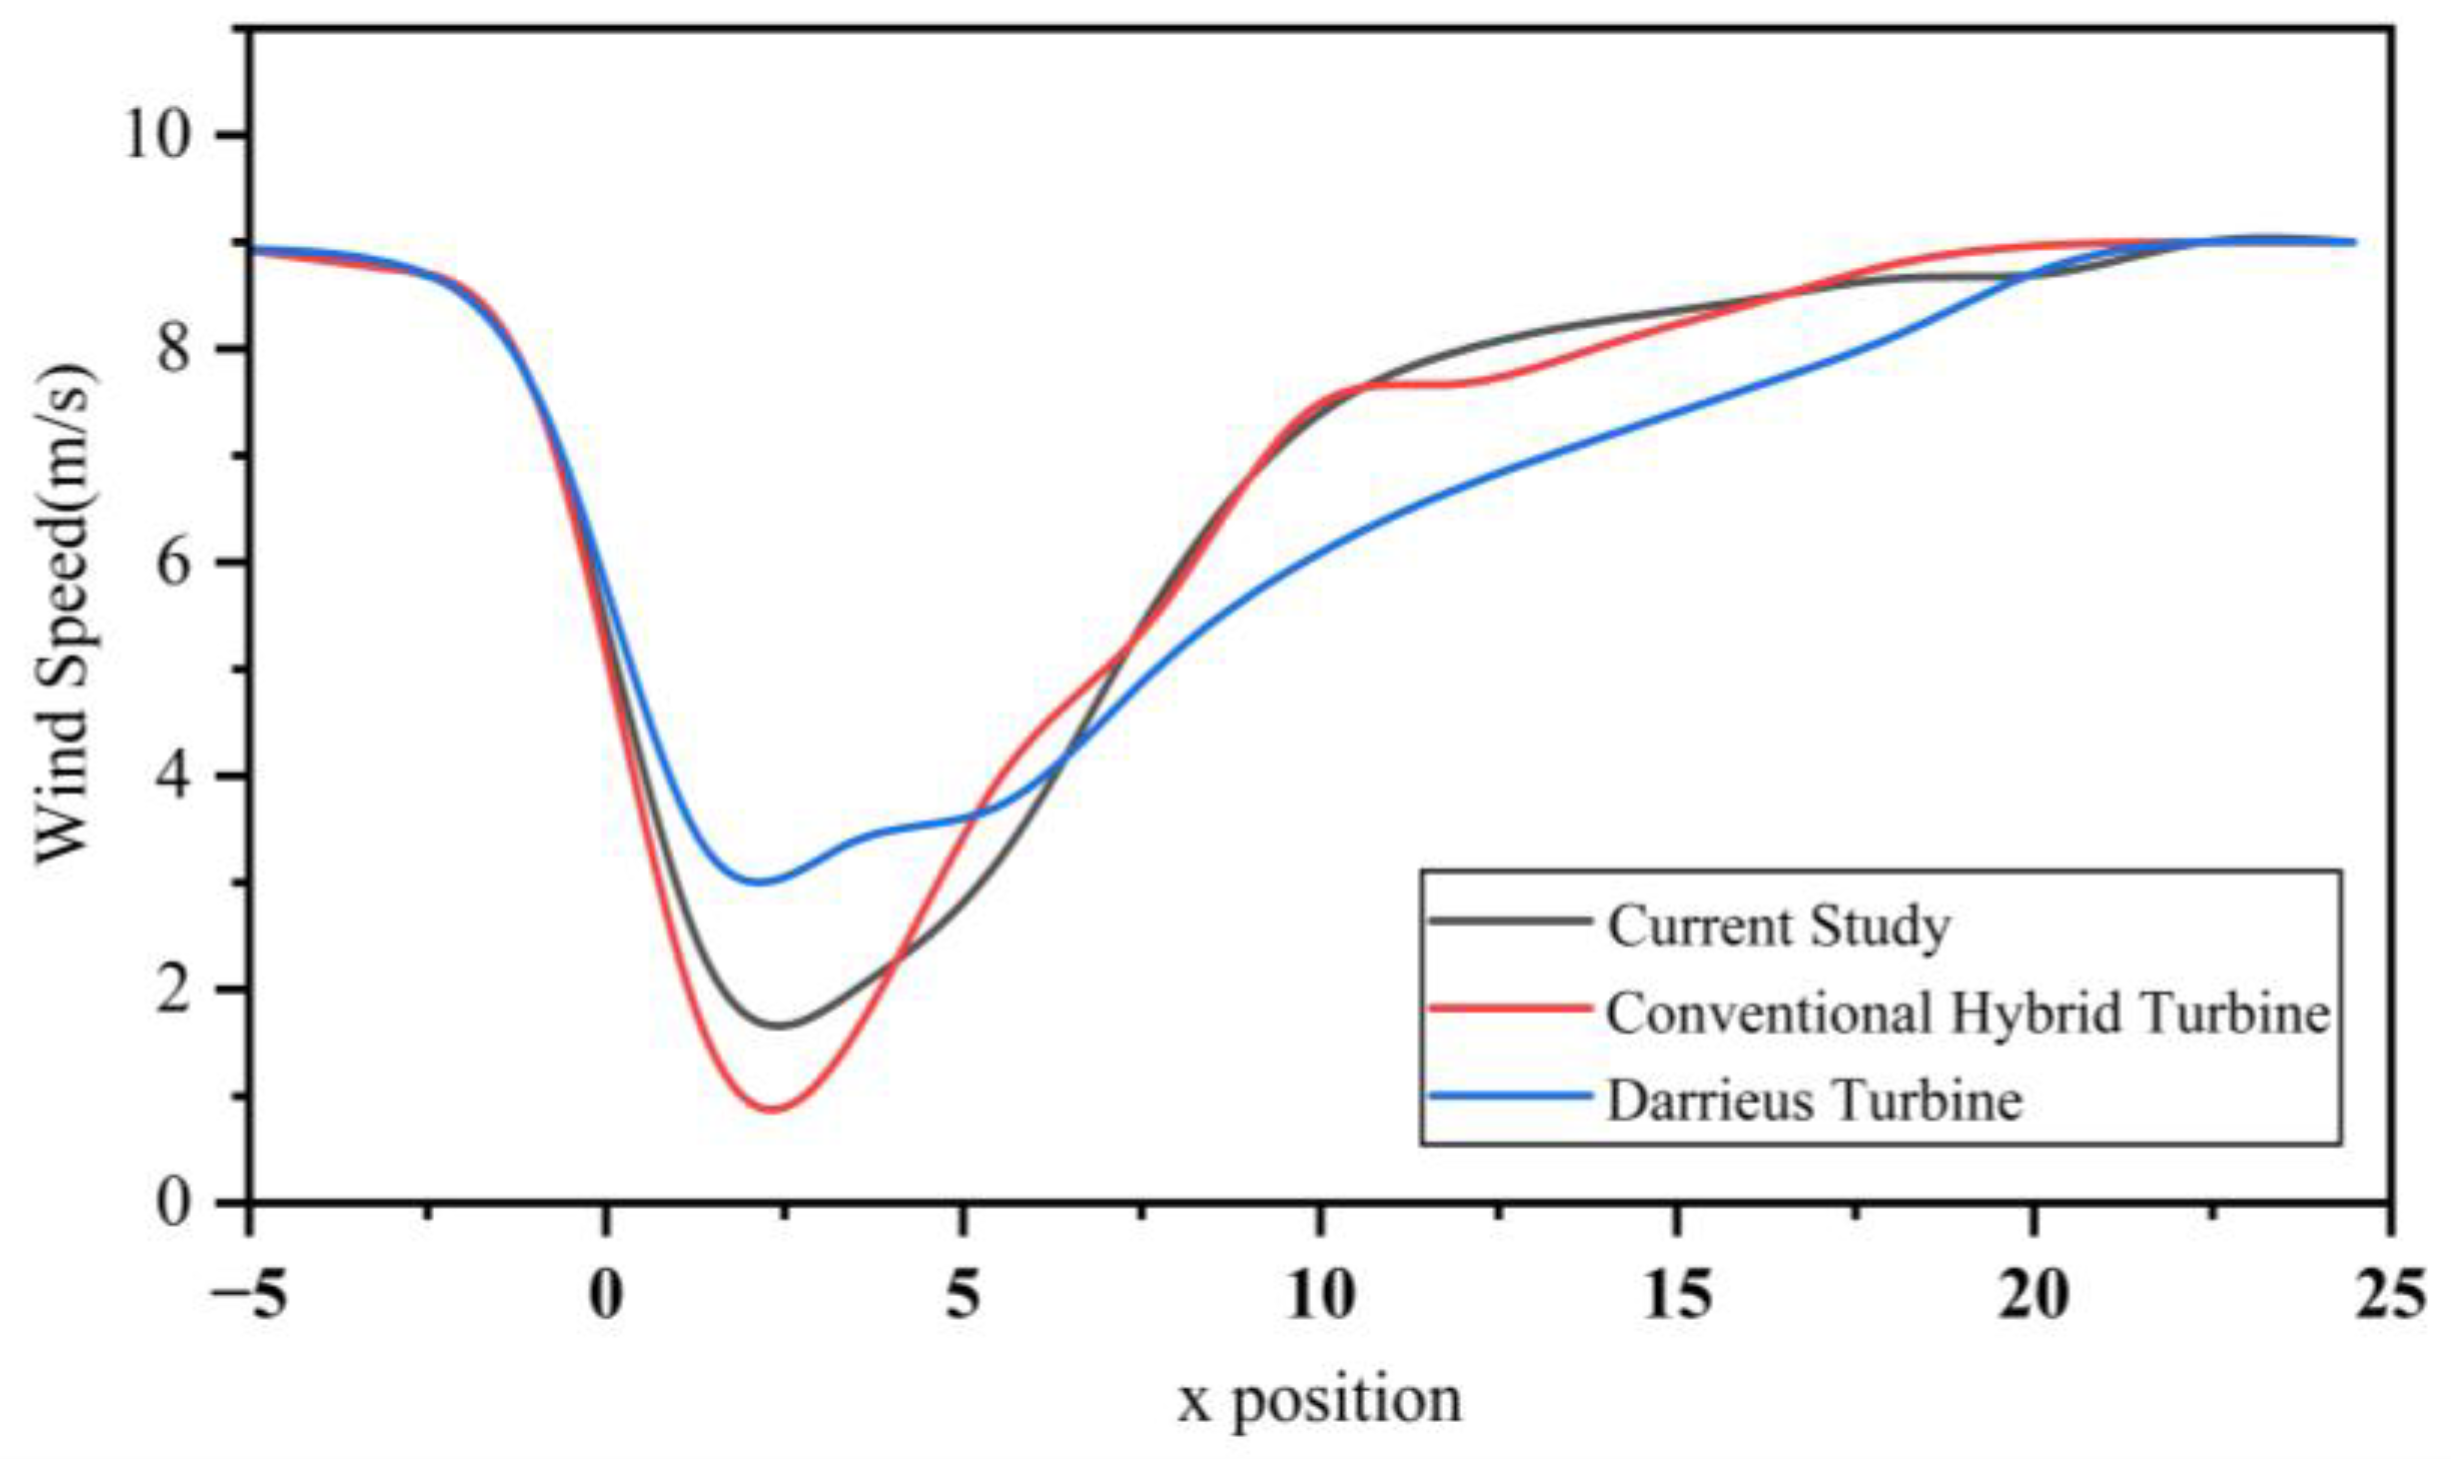
Figure 18 presents the normalized profile of the wake velocity in the x-direction for each wind turbine. As illustrated in the figure, the wake velocity of the hybrid wind turbine recovers to approximately 80% at 10 m downstream from the turbine axis and nearly reaches the free stream velocity at 15 m. In contrast, the traditional Darrieus turbine starts to recover its performance near the free-stream conditions at a distance of 18 m downstream. This shows that the wake recovery effect of the hybrid wind turbine is better. Moreover, the diagram shows that the improved hybrid wind turbine has a smaller low-speed zone than the traditional hybrid wind turbine, mainly because of the spoiler’s effect. This aids in enhancing wake recovery.

Figure 18.
Wind turbine wake velocity normalization curve.
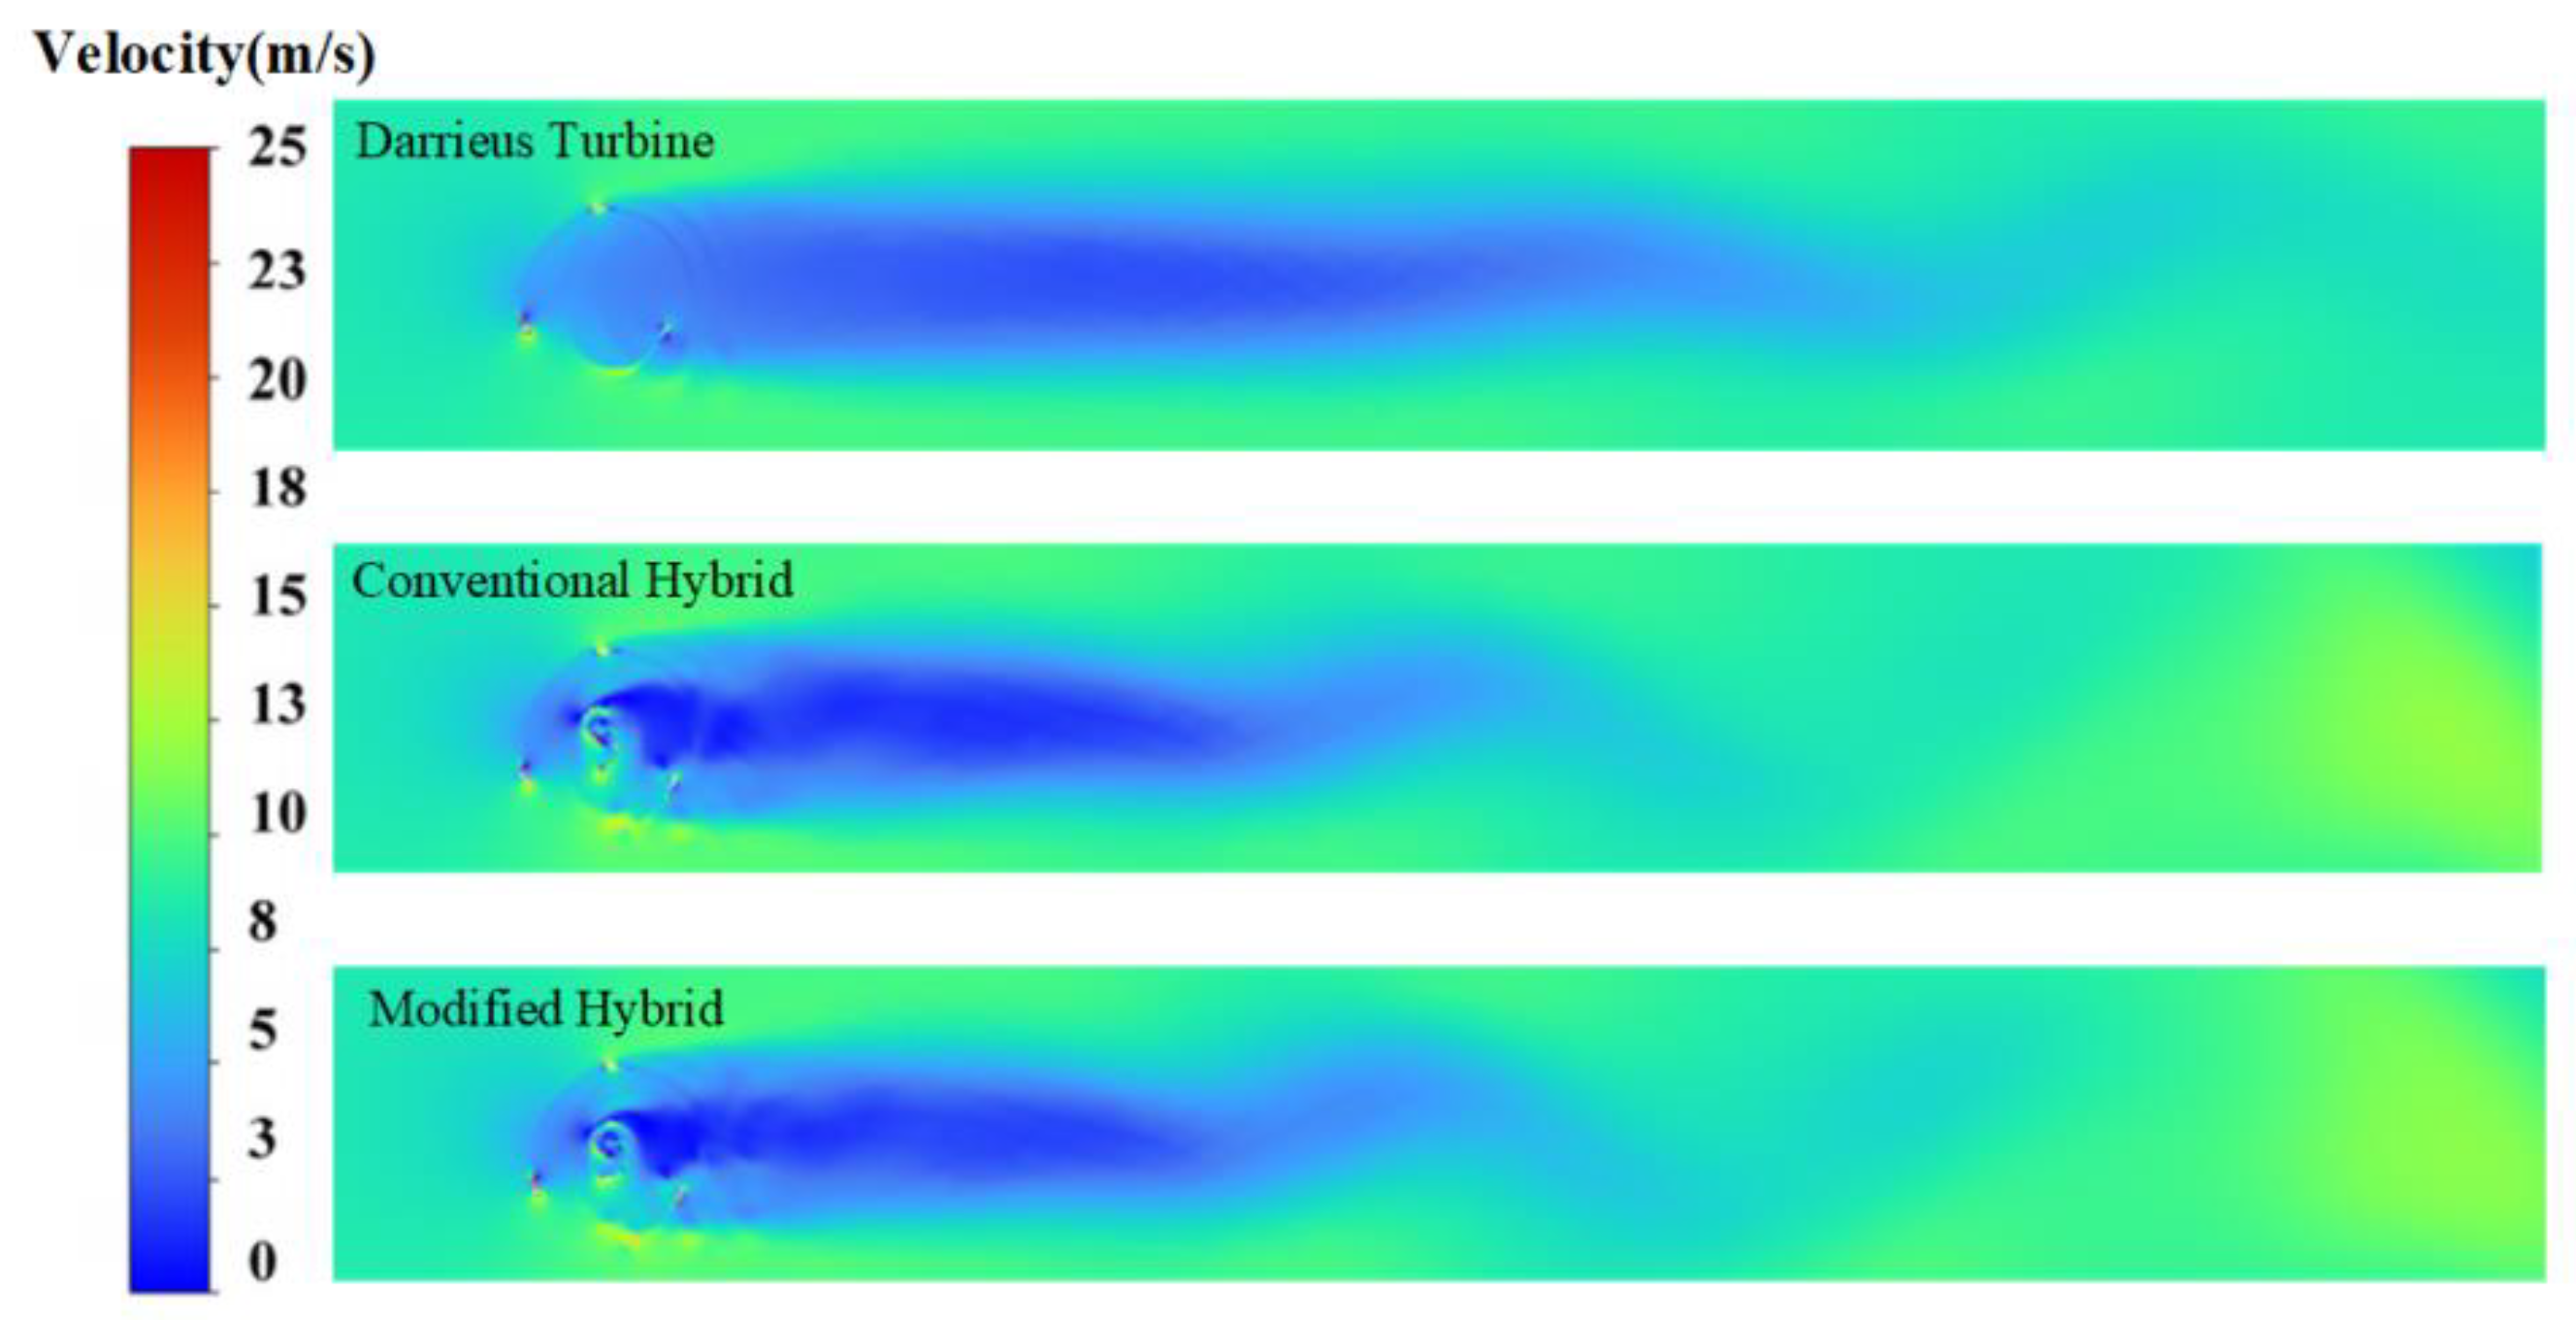
Figure 19 shows the wake flow patterns for both hybrid vertical-axis wind turbines and the straight-bladed Darrieus turbine. As seen in the figures, the wind speed reductions in the wake regions of the hybrid wind turbines are more significant than those of the Darrieus wind turbine. Nevertheless, it is also clear that the wake region of the hybrid wind turbine dissipates more rapidly. A detailed analysis of the velocity field reveals that the decrease in velocity stems from the inner part of the compound type. This factor leads to a more rapid decay of the wake and shows considerably less recovery. For the hybrid vertical axis wind turbine, at high rotor speeds, the vortex intensity becomes substantial. This powerful vortex aids in disrupting the outer rotor’s vortex structure. As a result, it speeds up the dissipation of wake vortices in the turbine’s wake area. This process facilitates the breakdown and reformation of the wake, thereby reducing its impact on downstream wind turbines.
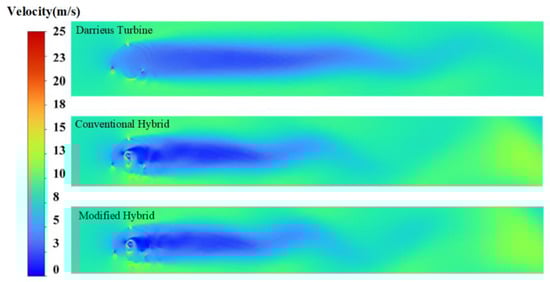
Figure 19.
Various wind turbines’ wake distribution diagram.
5. Conclusions
In this study, a modified internal rotor design method to improve the power coefficient as well as the self-starting performance of a composite vertical-axis wind turbine is proposed, and its torque coefficient, power coefficient, and wake flow are analyzed. This design provides a theoretical basis for the optimization of a composite vertical axis wind turbine. The following conclusions are drawn from this study:
- At lower tip–speed ratios, the presence of the inner rotor leads to hysteresis in the performance of the outer rotor and improves the performance of the outer rotor in the leeward zone, increasing the torque coefficient tremendously compared to the vertical-axis wind turbine, while decreasing it by only 4% at the maximum compared to the conventional composite vertical-axis wind turbine. However, the hysteresis effect gradually disappears as the blade tip–speed ratio increases.
- Hybrid vertical-axis wind turbines with modified inner rotor can improve the performance degradation of conventional hybrid generators at high blade tip ratios, with smaller counterpressure differentials than conventional inner rotors, which appropriately reduces inner rotor drag at high blade tip ratios, with torque coefficients increasing by up to 41.5%, and average torque coefficients increasing by 7.4%, which improves overall self-starting performance.
- The inner rotor with a spoiler boosts the average power coefficient by 80% compared to the conventional Savonius-type, reducing negative torque and strengthening the turbine’s overall power, with a maximum improvement of 32.4% and an 11.3% rise in the average power coefficient. The enhanced inner rotor also generates less turbulence, minimizing outer rotor impact and indirectly improving overall turbine performance.
In summary, this study has further investigated the field of composite vertical-axis wind turbines by proposing a novel inner rotor structure that reduces the power coefficient loss at high blade tip–speed ratios. However, the effects of structural differences, such as pitch angle, length, airfoil shape, and other parameters, were not taken into account and were not experimentally verified. Therefore, further research is needed to investigate the effects of different types of spoilers and installation methods on the layout of composite vertical axis wind turbines, as well as their experimental validation in the future.
Author Contributions
Conceptualization, S.C., Z.Q. and Y.C.; methodology, S.C., C.C. and J.W.; software, Y.C. and Y.Y. (Yuan Yang); validation, C.S., J.X. and J.W.; formal analysis, S.C., X.C. and Z.Q.; investigation, C.S. and C.C.; resources, J.X., X.C. and A.W.; data curation, Y.Z., C.C. and A.W.; writing—original draft preparation, Y.Z., Y.C., Y.Y. (Yongfei Yuan), and X.C.; visualization, Y.Y. (Yongfei Yuan), Y.C. and A.W.; supervision, J.X. and Y.Y. (Yuan Yang); project administration, Y.C., J.W., Y.Z. and X.C.; funding acquisition, Y.C., Z.Q. and Y.Z. All authors have read and agreed to the published version of the manuscript.
Funding
This research was funded by National Natural Science Foundation of China (grant number 51376096), “Fourteenth Five-Year Plan” Provincial Key Construction Discipline Project of Jiangsu Province (2022-0802 Mechanical engineering) and Jiangsu Engineering Research Center for Wind Energy Application.
Data Availability Statement
Some or all data, models, or code that support the findings of this study are available from the corresponding author upon reasonable request.
Conflicts of Interest
The authors declared no potential conflicts of interest with respect to the research, authorship, and/or publication of this article.
References
- Cao, J.W.; Wei, J.H.; Li, X. Potential assessment and spatio-temporal pattern of solar-wind power generation in Qinghai province. J. Sol. Energy 2023, 44, 255–265. [Google Scholar] [CrossRef]
- Wang, C. Evaluation methods and potential analysis of renewable energy resources. Mod. Ind. Econ. Inform. 2023, 13, 155–156+159. [Google Scholar] [CrossRef]
- Hand, B.; Cashman, A. A review on the historical development of the lift-type vertical axis wind turbine: From onshore to offshore floating application. Sustain. Energy Technol. Assess. 2020, 38, 100646. [Google Scholar] [CrossRef]
- Wang, C.C.; Du, Q.P.; Wang, X.; Wang, D.M.; Shi, L.; Li, X. A Review of Foreign Policies on Renewable Energy. North China Electr. Power Technol. 2017, 65–70. [Google Scholar] [CrossRef]
- McKay, P.; Carriveau, R.; Ting, D.S.K. Wake impacts on downstream wind turbine performance and yaw alignment. Wind Energy 2013, 16, 221–234. [Google Scholar] [CrossRef]
- Ullah, T.; Sobczak, K.; Liśkiewicz, G.; Khan, A. Two-Dimensional URANS Numerical Investigation of Critical Parameters on a Pitch Oscillating VAWT Airfoil under Dynamic Stall. Energies 2022, 15, 5625. [Google Scholar] [CrossRef]
- Zhang, S.B.; Zhu, S.G.; Tao, D.X.; Zhang, G.X.; Lu, J. A Review of Large-scale Wind Turbine Technology. Henan Sci. Technol. 2023, 42, 17–21. [Google Scholar] [CrossRef]
- Wang, Z.; Wang, Y.; Zhuang, M. Improvement of the aerodynamic performance of vertical axis wind turbines with leading-edge serrations and helical blades using CFD and Taguchi method. Energy Convers. Manag. 2018, 177, 107–121. [Google Scholar] [CrossRef]
- Chong, W.T.; Muzammil, W.K.; Wong, K.H.; Wang, C.T.; Gwani, M.; Chu, Y.J.; Poh, S.C. Cross axis wind turbine: Pushing the limit of wind turbine technology with complementary design. Appl. Energy 2017, 207, 78–95. [Google Scholar] [CrossRef]
- Gao, Q.; Lian, S.; Yan, H. Aerodynamic performance analysis of adaptive drag-lift hybrid type vertical Axis wind turbine. Energies 2022, 15, 5600. [Google Scholar] [CrossRef]
- Zhang, H.J.; Huang, D.G.; Wu, G.Q.; Wang, Y.D. Research on the Mutual Interference between Blades and vortices of Lift-Drag Composite Vertical-axis Wind Turbines. Mech. Des. Manuf. 2014, 76–79. [Google Scholar] [CrossRef]
- Qu, J.J.; Wang, J.Y.; Zhao, Y.; Zhang, L. The influence of drag blades on the aerodynamic performance of lift-drag composite vertical axis Wind turbines. J. Drain. Irrig. Mach. Eng. 2018, 36, 223–229. [Google Scholar]
- Zhao, Z.Z.; Chen, J.R.; Wang, T.G.; Li, T.; Zheng, Y. Research on the Influence of Interfering Airflow on the Aerodynamic Characteristics of Φ Type Wind Turbines. J. Mech. Eng. 2016, 52, 181–187. [Google Scholar] [CrossRef]
- Ghafoorian, F.; Mirmotahari, S.R.; Eydizadeh, M.; Mehrpooya, M. A systematic investigation on the hybrid Darrieus-Savonius vertical axis wind turbine aerodynamic performance and self-starting capability improvement by installing a curtain. Next Energy 2025, 6, 100203. [Google Scholar] [CrossRef]
- Zhang, J.; Wang, C.; Liu, W.; Zhu, J.; Yan, Y.; Zhao, H. Optimization of the energy capture performance of the lift-drag hybrid vertical-axis wind turbine based on the Taguchi experimental method and CFD simulation. Sustainability 2023, 15, 8848. [Google Scholar] [CrossRef]
- Hosseini, A.; Goudarzi, N. Design and CFD study of a hybrid vertical-axis wind turbine by employing a combined Bach-type and H-Darrieus rotor systems. Energy Convers. Manag. 2019, 189, 49–59. [Google Scholar] [CrossRef]
- Ahmad, M.; Shahzad, A.; Akram, F.; Ahmad, F.; Shah, S.I.A. Design optimization of Double-Darrieus hybrid vertical axis wind turbine. Ocean Eng. 2022, 254, 111171. [Google Scholar] [CrossRef]
- Chegini, S.; Asadbeigi, M.; Ghafoorian, F.; Mehrpooya, M. An investigation into the self-starting of darrieus-savonius hybrid wind turbine and performance enhancement through innovative deflectors: A CFD approach. Ocean Eng. 2023, 287, 115910. [Google Scholar] [CrossRef]
- Kortleven, M. Simulation Verification and Optimization of a Vertical Axis Wind Turbine Using CFD; Delft University of Technology: Delft, The Netherlands, 2016. [Google Scholar]
- Maalouly, M.; Souaiby, M.; ElCheikh, A.; Issa, J.S.; Elkhoury, M. Transient analysis of H-type vertical axis wind turbines using CFD. Energy Rep. 2022, 8, 4570–4588. [Google Scholar] [CrossRef]
- Samaouali, A.; Kadiri, I. CFD comparison of 2D and 3D aerodynamics in H-Darrieus prototype wake. e-Prime-Adv. Electr. Eng. Electron. Energy 2023, 4, 100178. [Google Scholar] [CrossRef]
- ul Hassan, S.S.; Javaid, M.T.; Rauf, U.; Nasir, S.; Shahzad, A.; Salamat, S. Systematic investigation of power enhancement of Vertical Axis Wind Turbines using bio-inspired leading edge tubercles. Energy 2023, 270, 126978. [Google Scholar] [CrossRef]
- Posa, A. Dependence of the wake recovery downstream of a Vertical Axis Wind Turbine on its dynamic solidity. J. Wind Eng. Ind. Aerodyn. 2020, 202, 104212. [Google Scholar] [CrossRef]
- Posa, A. Secondary flows in the wake of a vertical axis wind turbine of solidity 0.5 working at a tip speed ratio of 2.2. J. Wind Eng. Ind. Aerodyn. 2021, 213, 104621. [Google Scholar] [CrossRef]
- Alexander, A.S.; Santhanakrishnan, A. Mechanisms of power augmentation in two side-by-side vertical axis wind turbines. Renew. Energy 2020, 148, 600–610. [Google Scholar] [CrossRef]
- Tong, G.; Li, Y.; Tagawa, K.; Feng, F. Effects of blade airfoil chord length and rotor diameter on aerodynamic performance of straight-bladed vertical axis wind turbines by numerical simulation. Energy 2023, 265, 126325. [Google Scholar] [CrossRef]
- Castelli, M.R.; Ardizzon, G.; Battisti, L.; Benini, E.; Pavesi, G. Modeling strategy and numerical validation for a Darrieus vertical axis micro-wind turbine. In Proceedings of the ASME 2010 International Mechanical Engineering Congress and Exposition, Princeton, NJ, USA, 12–18 November 2010; Volume 7, pp. 409–418. [Google Scholar] [CrossRef]
- Balduzzi, F.; Bianchini, A.; Maleci, R.; Ferrara, G.; Ferrari, L. Critical issues in the CFD simulation of Darrieus wind turbines. Renew. Energy 2016, 85, 419–435. [Google Scholar] [CrossRef]
- Shukla, S.; Ramanan, C.J.; Bora, B.J.; Deo, A.; Alom, N. Numerical analysis of vertical axis wind turbine blades in ANSYS Fluent. Mater. Today Proc. 2022, 59, 1781–1785. [Google Scholar] [CrossRef]
- Khan, A.; Irfan, M.; Niazi, U.M.; Shah, I.; Legutko, S.; Rahman, S.; Alwadie, A.S.; Jalalah, M.; Glowacz, A.; Khan, M.K. Centrifugal Compressor Stall Control by the Application of Engineered Surface Roughness on Diffuser Shroud Using Numerical Simulations. Materials 2021, 14, 2033. [Google Scholar] [CrossRef]
- Hijazi, A.; ElCheikh, A.; Elkhoury, M. Numerical investigation of the use of flexible blades for vertical axis wind turbines. Energy Convers. Manag. 2024, 299, 117867. [Google Scholar] [CrossRef]
- Lam, H.F.; Peng, H.Y. Measurements of the wake characteristics of co-and counter-rotating twin H-rotor vertical axis wind turbines. Energy 2017, 131, 13–26. [Google Scholar] [CrossRef]
- Castelli, M.R.; Englaro, A.; Benini, E. The Darrieus wind turbine: Proposal for a new performance prediction model based on CFD. Energy 2011, 36, 4919–4934. [Google Scholar] [CrossRef]
- Celik, Y.; Ingham, D.; Ma, L.; Pourkashanian, M. Novel hybrid blade design and its impact on the overall and self-starting performance of a three-dimensional H-type Darrieus wind turbine. J. Fluids Struct. 2023, 119, 103876. [Google Scholar] [CrossRef]
- Sun, X.; Chen, Y.; Cao, Y.; Wu, G.; Zheng, Z.; Huang, D. Research on the aerodynamic characteristics of a lift drag hybrid vertical axis wind turbine. Adv. Mech. Eng. 2016, 8, 1687814016629349. [Google Scholar] [CrossRef]

Disclaimer/Publisher’s Note: The statements, opinions and data contained in all publications are solely those of the individual author(s) and contributor(s) and not of MDPI and/or the editor(s). MDPI and/or the editor(s) disclaim responsibility for any injury to people or property resulting from any ideas, methods, instructions or products referred to in the content. |
© 2025 by the authors. Licensee MDPI, Basel, Switzerland. This article is an open access article distributed under the terms and conditions of the Creative Commons Attribution (CC BY) license (https://creativecommons.org/licenses/by/4.0/).