1. Introduction
Every year, the sun provides the earth’s surface with energy with a flux density of
in the range of 0.3 and
, making it the primary and most abundant source of energy on the planet [
1,
2,
3]. This energy serves as the primary guarantee for the survival of humans, animals, and plants, among other things. It stimulates processes such as photosynthesis, hydrological cycles, atmospheric balance, and terrestrial mass transport. These processes are typically brought about by the unequal distribution of solar energy that the earth receives, which is occasionally brought on by the earth’s sporadic orientation in different seasons and times of the year [
4,
5,
6]. However, as time goes on, the need for energy to meet human demands continuously rises. The cost of adopting renewable technologies, their accessibility, and the lifespan of the same plants, as well as global disasters and endemic diseases like COVID-19 and malaria, among others, can make it difficult to achieve the Sustainable Development Goals (SDGs) of complete electrification using clean and renewable energy [
7,
8,
9]. The majority of the energy demand is in rural areas, with statistics showing that 81.52% of areas lack access to electricity. Mozambique, the study area, has a rate of about 22 million people without access to electrification, making it one of the countries in Sub-Saharan Africa with the highest rate of de-electrification. Many of these people live in remote areas (rural and district outskirts), where population density is relatively discrete [
10,
11,
12]. Like in other rural areas, this area still relies heavily on hydroelectric conversion technology, such as thermal power plants, wind farms, and tidal conversion, to produce energy. However, there is a strong call for the adoption of solar PV formation technologies [
13,
14] which are a clean, sustainable, efficient, and low-cost source that can be used in any region where there is full sun, using solar cells that directly convert solar energy into electricity [
2,
6,
15]. This is necessary to ensure the conservation of the ecosystem and ecological balance in the surrounding regions, preserving the characteristic species that are endangered by the implementation of the technologies previously described. Furthermore, variations in solar energy cause variations in the PV power output of a solar plant, which in turn causes variations in electrical power [
16,
17]. Large-area power plants are more likely to generate power more consistently, whereas small-area power plants are more susceptible to solar oscillations because of cloud cover. The uneven distribution of solar energy throughout the earth’s surface is the cause of this. But only about 80% of the sun’s total solar energy reaches the earth’s surface; the rest is absorbed by the atmosphere and its components, with 25% of that energy being reflected back into space by reflection mechanisms. This is due to its trajectory, which reduces solar energy by 5% absorption by aerosols, 7% by uniformly mixed gases, 10% by water vapor, and 10% by the ozone layer [
15]. Dispersion processes, MIE dispersion, Rayleigh, absorption, and the reflection of solar energy are all highlighted [
6,
18,
19]. Furthermore, the direction of the Earth in relation to the land that the Mozambican region faces defines this distribution [
14,
20]. The earth facing the sanctuary of the projection of solar radiation with wide exposure is favored by the varied areas during the hot season, as per Kepler’s law of areas [
6,
21,
22]. As a result, it receives more heat from the sun, which increases the likelihood of exciting, spreading, and dispersing atmospheric particles. Additionally, it is the hot and rainy season, which literally means that the rainfall clears the atmosphere of solid particles and permits a higher incidence of solar energy [
10,
23,
24]. The opposite happens during the cold season, when the area receives a smaller amount of solar energy despite being diametrically opposed to the greatest incidence of solar energy. This results in a greater absorption of solar energy and a lower transmittance of this resource because fewer solid particles, which are primarily suspended in the atmosphere, are scattered [
15,
25,
26]. This is the time to focus more on solar system design and sizing so that the systems can support all seasons by operating in accordance with the month with the least amount of solar energy available [
27,
28,
29]. The fact is that human activity processes, like the release of gases into the atmosphere, can sometimes affect even the minimum energy and cause a significant decrease in solar energy. These processes can be modeled to remove variations in a solar plant’s power output [
18,
19,
30]. In order to size solar systems with the actual solar energy available in all locations and so reduce energy fluctuations, there is a greater emphasis on monitoring solar energy in order to gain a better understanding of solar energy [
25,
31].
Furthermore, recent research analyzed the elevation and energy, together with economic metrics, and also matched the applicability of single axis tracking systems, according to the study of solar energy resource mapping, site suitability, and technoeconomic feasibility analysis for utility-scale PV power plants [
9,
23,
32]. Research has used a hybrid Pythagorean fuzzy-based decision approach to evaluate renewable energy projects based on sustainability goals and found that solar energy was the most appropriate renewable resource [
33,
34,
35]. Studies have evaluated the viability of solar PV-based microgrids using both single-criteria and multi-criteria decision analysis, and they come to the conclusion that they are not as economically appealing in the near future [
36,
37]. In short measurement metrics of 0.1 to 0.001 s, studies have identified the variability of solar energy in the spatial order [
22,
26,
38]. These studies also show a pattern of progressive energy increases, but they also use the cloud fractal model to observe the cloud and note more interesting intermediate-sky characteristics that are prone to variability [
26,
38]. The radiation was found to exhibit fluctuations and progressive increases in short measurements [
29,
39]. This suggests a decrease in energy and its increments in the regression and correlational analysis of the coefficients over the whole distance [
25,
38,
40]. Using a machine learning model, this summarized solar energy fluxes at the earth’s surface with a build-up of believable extrapolations during summertime [
28,
29,
39]. The resulting arrangement shows the potential of the world’s solar resources in tropical areas like Mozambique. Compared to larger plants, which have a compromised incidence and can be entirely obscured by the passage of an occulting atmospheric cloud, other mapping analyses of variability show more variability in small areas [
11,
12,
21,
41,
42]. However, the output of machine learning models does not fully approximate the experimental energy to the theoretical energy under standardized conditions, that is, the theoretical solar energy as in the statistical theoretical model, even when analysis conditions are met without the use of predictive parameters of solar energy. Using coefficients and/or occasionally the amount of solar energy measured at the location, the description of earlier research shows the energy distribution geospatially. However, a number of factors that primarily hinder solar energy’s journey to the Earth’s surface and result in the drop in the power curve, depicted in
Figure 1, under various energy content conditions upon arrival at the Earth’s surface, make this a significant contribution and advancement in understanding the power of solar energy available on the Earth’s surface in a geolocalizable region.
There are a number of factors that present different output powers in different portions of solar energy incidence affected by the fluctuations in energy upon arrival at the Earth’s surface, as shown in
Figure 1a. The power drop is interpreted by the fluctuations in solar energy, which are caused by the opposition to the passage of solar energy by the composition of particles in the atmosphere and its significant constituents (aerosols, dust, gases, and ozone, among others), here identified as the local cloud. As illustrated in
Figure 1b, a solar plant’s output power also exhibits a wide range for various day types, including clear, cloudy, and intermediate days, with the potential for high energy flow densities and significant complications from the perspective of solar energy use. Only by integrating all atmospheric factors, which are represented by the transmittances and absorptances of all atmospheric constituent parameters, can the actual availability of solar energy supplies be predicted, offering a potential solution to this fluctuation problem. Given this, the problem is ignorance regarding solar energy’s true proportion and mapping with regard to the resource that is actually accessible and extracted while accounting for all atmospheric factors, with worldwide validity for all regions and in comparable patterns for even desert regions and uninhabitable seas that can be thought of as an alternative for the effective implementation of PV utilization, as well as offering a methodology and a consultation tool for various solar energy assessment projects. Solar energy is mapped across the Mozambican region in this study, which also conditions solar energy for different kinds of sky. Though they did not use mapping by
and its
, earlier investigations did use a mapping and analysis strategy. The mapping of solar energy behavior that we describe here, however, eliminates all fluctuations caused by the geometry of space by using the
magnitude. To totally eliminate variations in solar energy, global energy was measured in light of characteristics that decrease its arrival at the earth’s surface. This is an additional feature that was incorporated in earlier approaches. In order to estimate the actual energy resource in any region, all atmospheric parameters were calculated based on the amount that they absorb, reflect, or disperse into the void, taking into account their transmittance and absorptance. The
is determined using machine learning models that minimize the inaccuracy in the energy evaluated from the
and in the determined power output in order to increase efficiency and minimize error induced into the findings. In addition to employing both short-term and long-term measurements, it made it possible to interpolate solar energy across the nation and determine the predicted energy for applications aimed at regulating and optimizing solar harnessing systems. A sample of solar energy was gathered for this purpose between 2012 and 2014, from April to December, using pyranometers to measure at short-range intervals of 1 to 10 min. This sample’s treatment indicates a propensity for rises on days with intermediate-sky conditions, in contrast to fluctuations in other locations that tend to have substantial energy deviations in relation to solar energy. The frequency and tendency to increase increments of clear-sky days were higher in 2012 than in 2013 and 2014, according to regional mapping. The frequency of occurrence density was higher in 2012, but it decreased to 2014, when there was a greater inclination to increase the
. Both the frequency and tendency to increase
were higher on cloudy-sky days. According to observations and spectra reported in the literature, intermediate-sky days exhibit a fluctuating form with intermediate incremental characteristics between the high frequencies of clear days and the low frequencies of clouded sky days. By mapping the available resources throughout the region, these findings aid in the categorical elimination of energy oscillations upon arrival to the earth’s surface.
4. Discussion
Clear-sky day counts have a stronger tendency to decline, declining between 2012 and 2014. On the other hand, it is evident in the South: the province of Maputo (UEM-Maputo) has an of 0.8491 in 2012, 0.756 in 2013, and 0.8963 for the interpolated year 2014, indicating 0.2830 in the assessment of all day types. Its greater prevalence in Gaza’s Dindiza and Massangena provinces is 0.7612, 0.7653 in 2012, 0.6589, 0.7428 in 2013, and 0.7412, 0.7426 in 2014, indicating 0.2537, 0.2476 for all sky types. In the province of Inhambane (Pomene station), the numbers were 0.7509 in 2012, 0.7743 in 2013, and 0.7728 in 2014; nevertheless, the overall number of days was 0.5157. There was a higher flow in 2012 of around 0.7845, 0.7038 in 2013, 0.7712 in 2014, and 0.4961 for all kinds of days in the mid-region, in the province of Tete (Marávia). All clear-sky days in Sofala province are classified as 0.3189, while 0.7361 was recorded in 2012 and 0.1101 and 0.1206 in 2013 and 2014. It was recorded in 2012 at 0.7258 and 0.7245, in 2013 at 0.7771 and 0.7741, in 2014 at 0.7771 and 0.7789, and in the classification of all days in the province of Manica (Nhapassa-1 and Nhapssa-2). In the Zambezia province (Lugela-1 and Luugela-2), it was recorded at 0.7275, 0.6385, and 0.1580 in 2012, 0.1582 in 2013, 0.1662, 0.1587 in 2014, and 0.3506, 0.3184 on all days. On all clear-sky days in the northern region, 0.4434, 0.1629, 0.1678, and 0.2021 were recorded in the province of Cabo Delgado (Chomba) in 2012, 2013, and 2014, respectively. The year 2012 saw 0.5854 and 0.5444, 2013 saw 0.4412 and 0.4413, 2014 saw 0.1640 and 0.1652, and for all days, 0.3969 and 0.3832 were recorded in the province of Nampula (Nanhupo-1 and Nanhupo-2). In 2012, scores of 0.6049, 0.6332, 0.6173, 0.6629, 2014, 0.5128, and 0.6528 were recorded, and for all kinds of clear-sky days, 0.5783 and 0.6496 were recorded, in the province of Niassa (Massangulo-1).
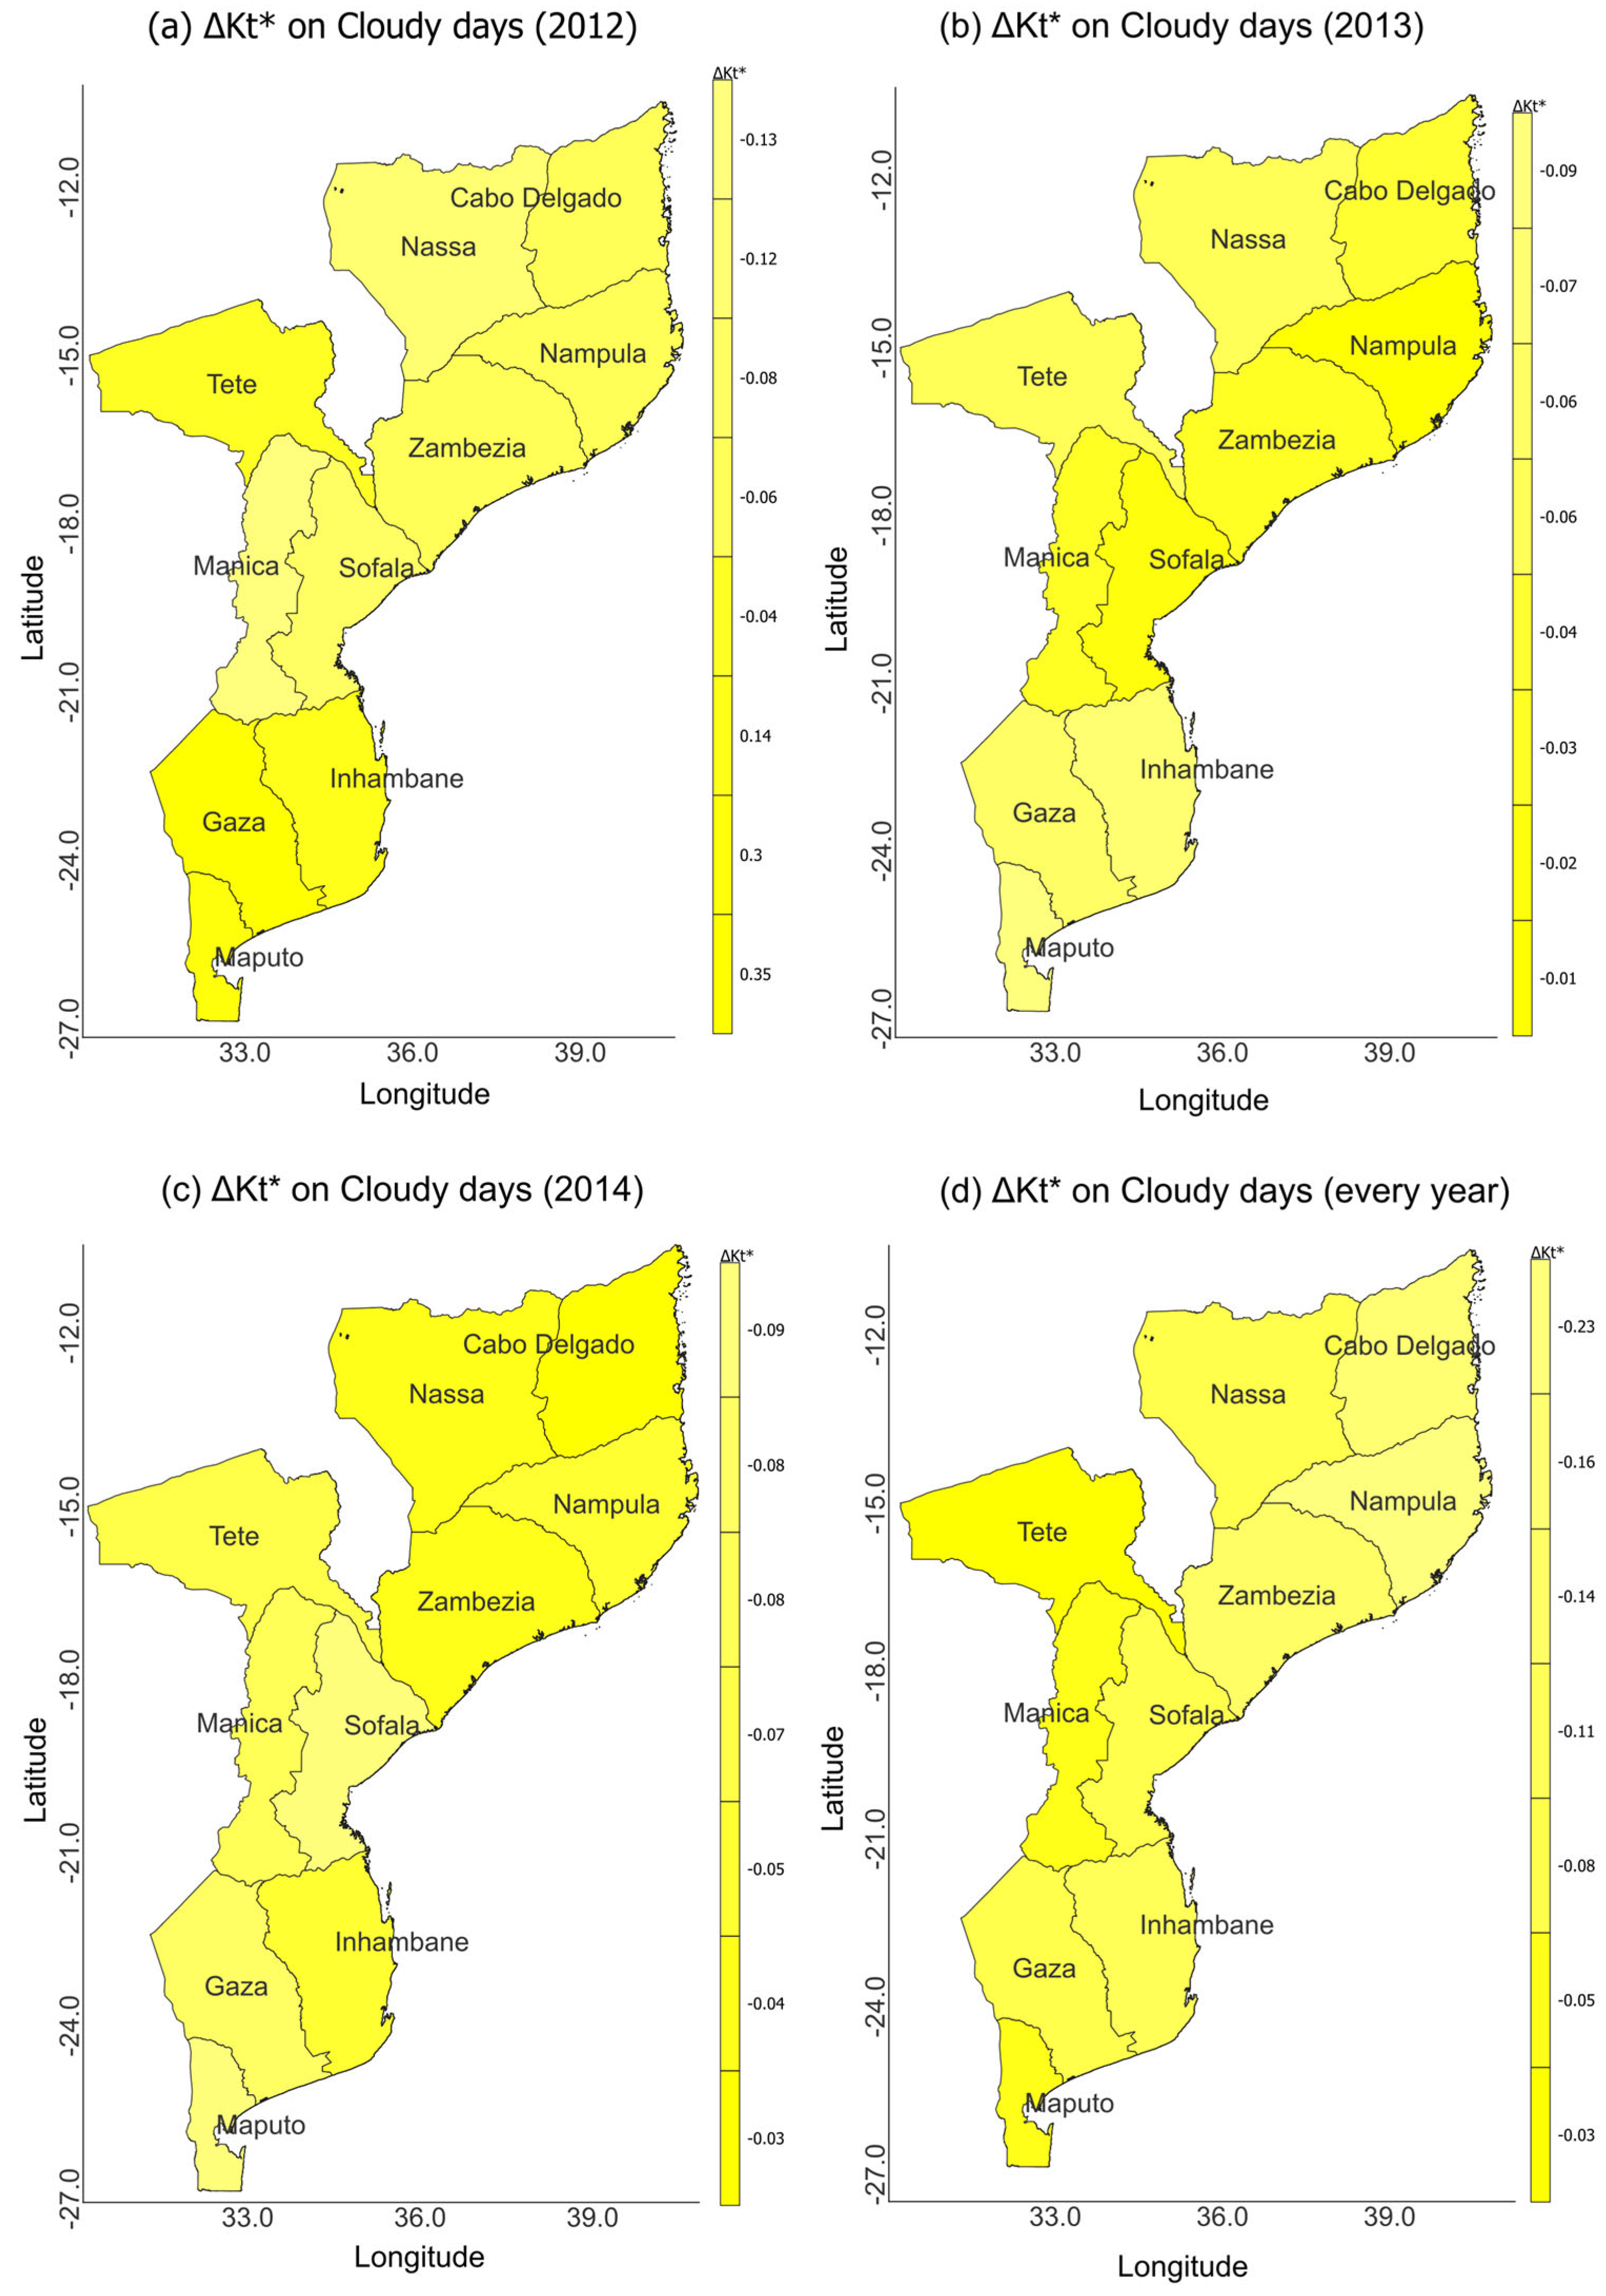
There is a greater tendency for the number of cloudy days to increase, rising from 2012 to 2014, as shown in the southern region: In the province of Maputo (UEM-Maputo) 0.5272 was observed in 2012, 0.5244 in 2013, and 0.6523 in 2014, and 0.1757 on all days. In the Gaza Strip (Dindiza and Massangena) in 2012, 0.4671 and 0.4863 were recorded, in 2013 0.4214 and 0.4263, in 2014 0.4263 and 0.1557, and 0.1421 on all days analyzed. In the province of Inhambane (Pomene), in 2012, 0.4263 was observed, 0.4043 in 2013, 0.4453 in 2014, and 0.2832 on all days analyzed with cloudy skies. In the Tete (Marávia) province in the central region, 0.4858, 0.4557, 0.4239, and 0.3138 were recorded on all days in 2012, 2013, 2013, and 2014, respectively. In the mid-region: 0.4605, 0.623, 0.6234, and 0.1950 were recorded on all days in the province of Sofala (Nhangau) in 2012, 2013, and 2014. In the province of Manica (Nhapassa-1 and Nhapassa-2), 0.3885 and 0.3037 were recorded in 2012, 0.511 and 0.5544 in 2013, and 0.5502, 0.4703, and 0.4808 on all days in 2014. Lugela-1 and Lugela-2 in the province of Zambezia maintained 0.3037 and 0.2932 in 2012, 0.0678 and 0.0639 in 2013, and 0.0610 and 0.0626 in 2014, but 0.1441 and 0.1399 for all kinds of days. In the northern region, 0.0798, 0.0740, and 0.0513 were recorded in the province of Cabo-Delgado (Chomba) in 2012, 2013, and every observation day. In the province of Nampula (Nanhupo-1 and Nanhupio-2), 0.0798 and 0.4014 were recorded in 2012, 0.2369 and 0.1851 in 2013, 0.0756 and 0.0756 in 2014, and 0.2380 and 0.2040 for all day types. In the province of Niassa (Massangulo-1 and Massangulo-2) scores was recorded at 0.4125, 0.3329, 0.3850, and 0.3773 in 2012, 0.3064 and 0.3671 in 2014, and 0.3681 and 0.3591 for all kinds of days.
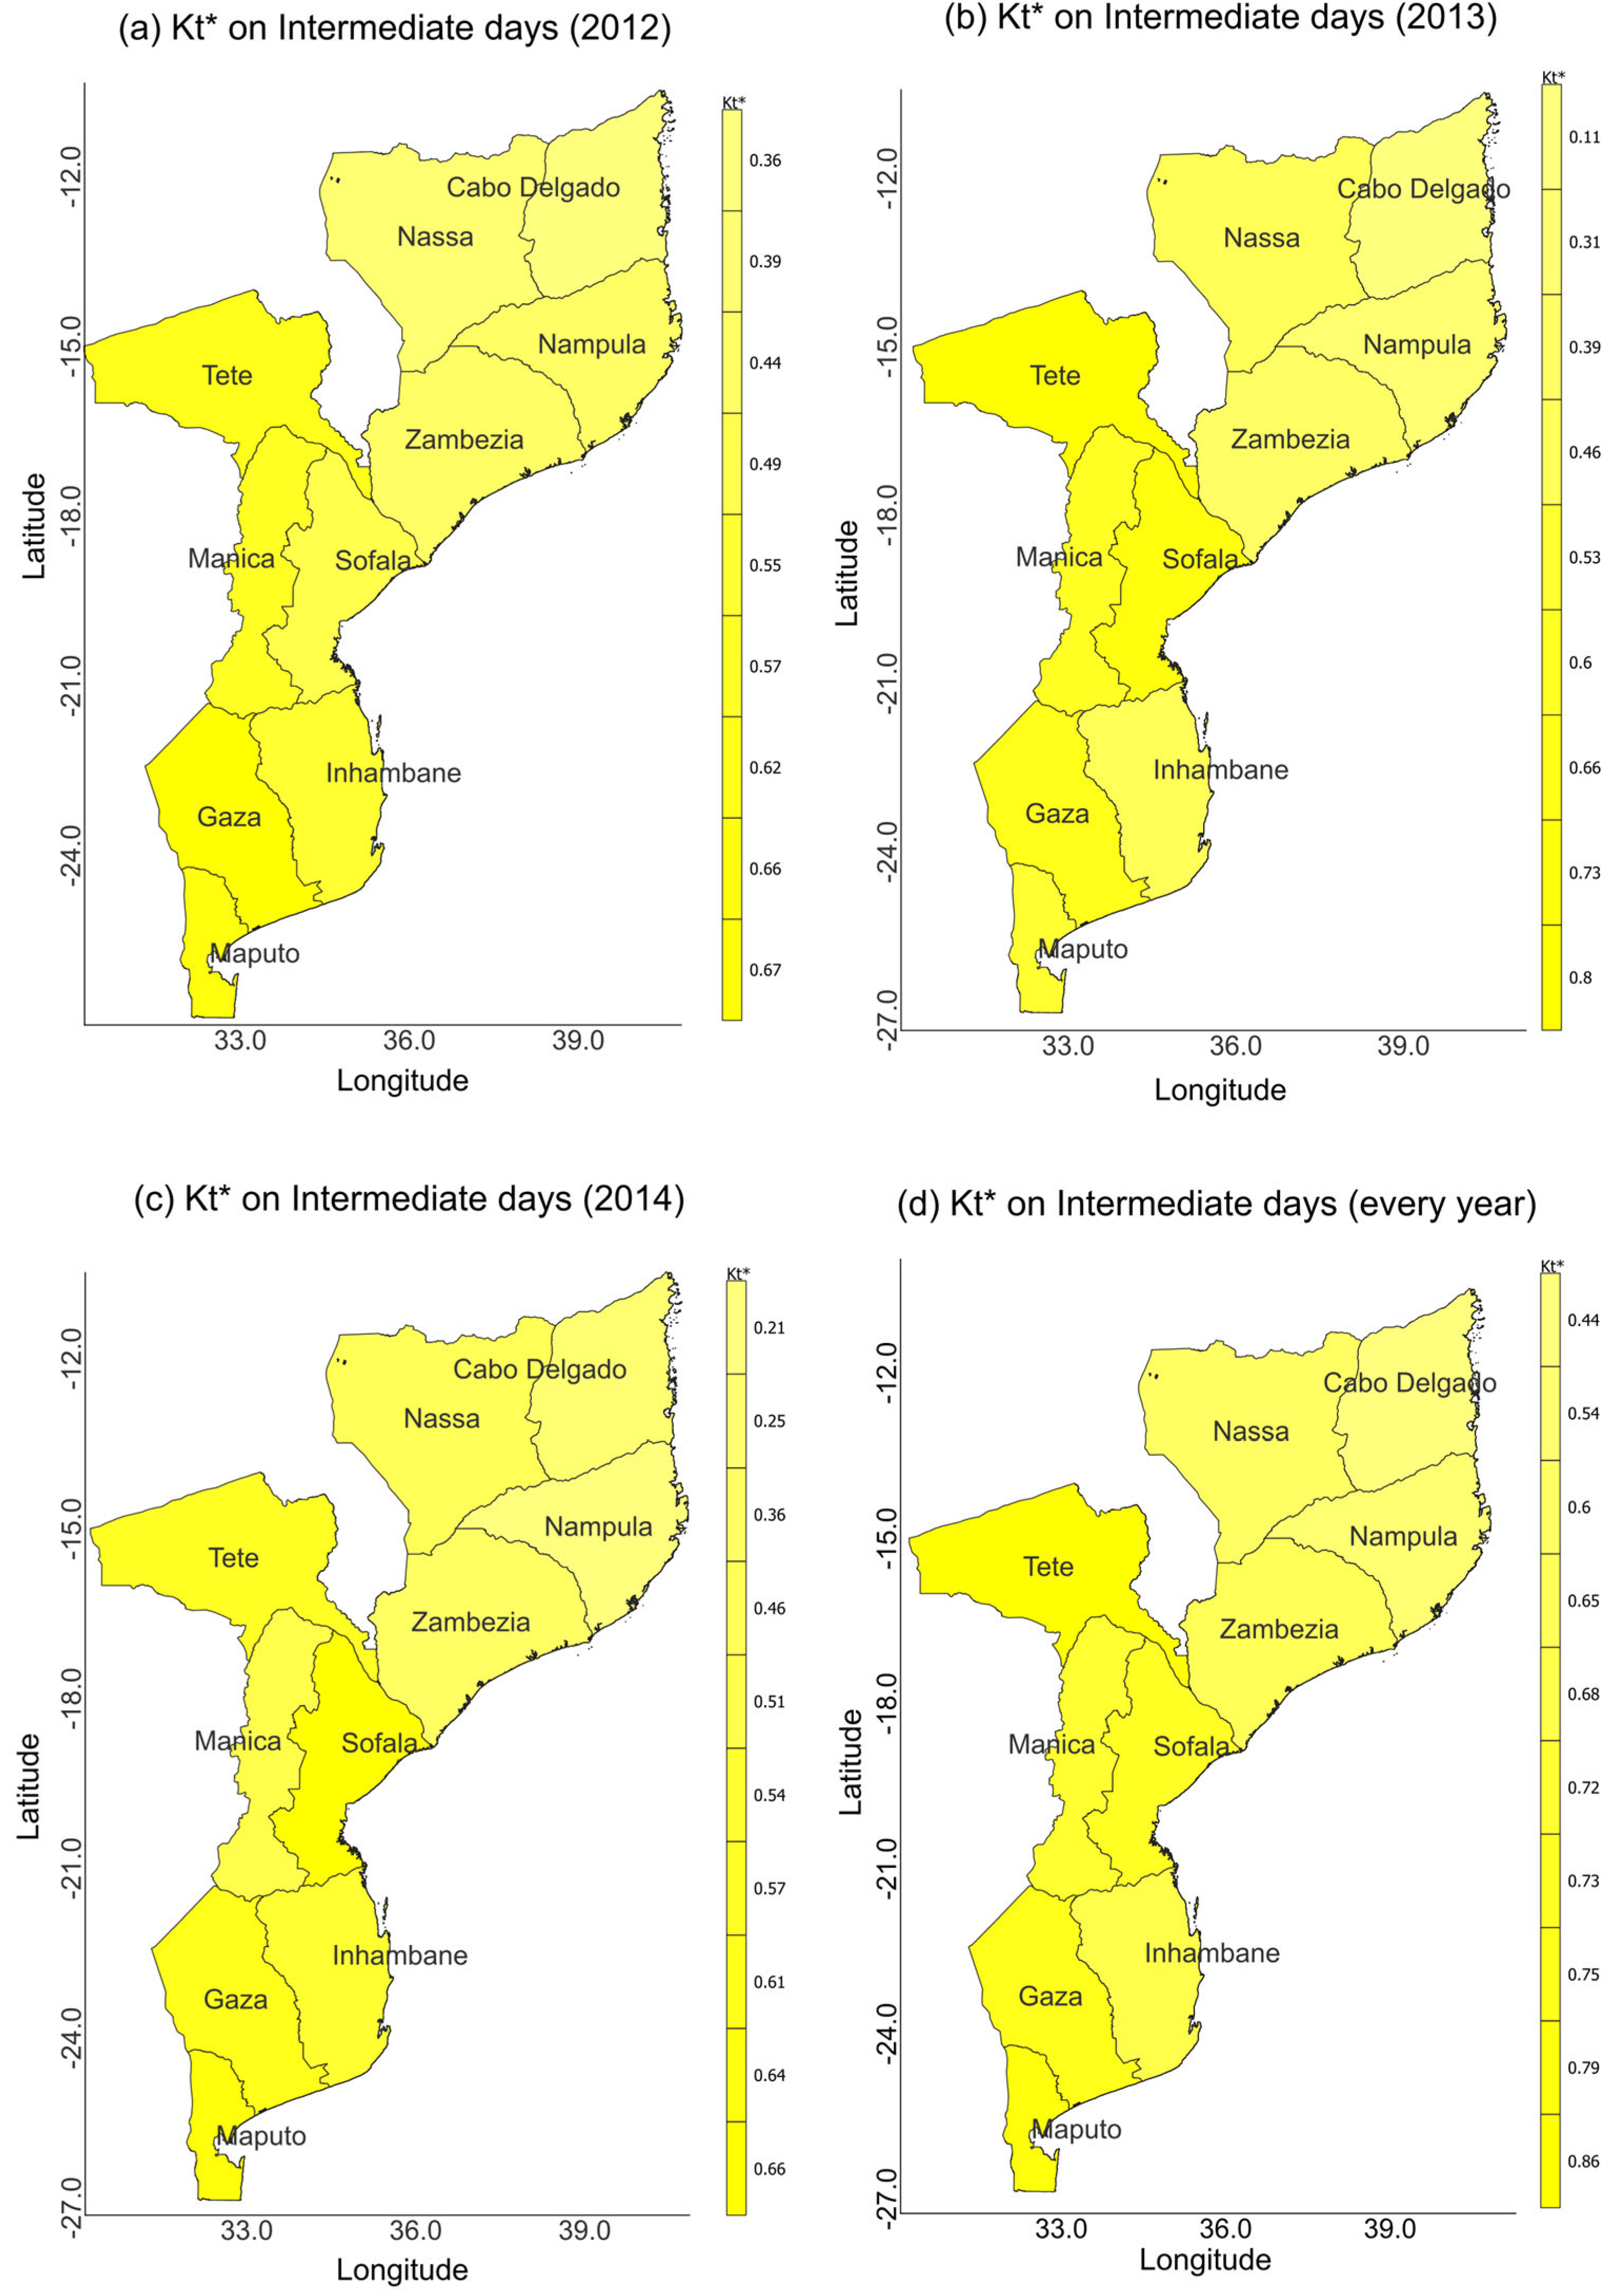
The observation for intermediate-sky days has a tendency in all years, with lower characteristics close to cloudy and higher characteristics close to clear, between the years 2012, to 2014; however, it is shown that in the South region, in the province of Maputo (UEM-Maputo), in the year 2012, 0.6808 was observed; in 2013, 0.6856 was observed; in 2014, 0.6823 was observed; and 0.6803 was observed for all types of days. In Gaza province (Dindiza and Massangena), in 2012, approximately 0.6828 and 0.6825 were observed; in 2013, 0.5862 and 0.5896 were observed; in 2014, 0.5826 and 0.5814 were observed; and 0.21 and 0.1954 were observed for observations in all years of measurements. In the province of Inhambane (Pomene), in 2013, 0.6481 was observed; in 2014, 0.6334 was observed; and 0.4272 was observed for all types of days. In the mid-region, in the province of Tete (Marávia), in 2012, 0.6595 was observed; in 2013, 0.5781 was observed; and 0.4272 was observed on all types of days. In the province of Sofala (Nhangau), approximately 0.6046 was observed in 2012, approximately 0.0853 in 2013, and approximately 0.0853 in 2014, but 0.2584 for all types of days. In the province of Manica (Nhapassa-1 and Nhapassa-2), in 2012, 0.5611 and 0.5700 were observed; in 2013, 0.6402 and 0.6411 were observed; in 2014, 0.6411 and 0.6423 were observed; and for all types of days, 0.4007 and 0.6174 were observed. In the province of Zambezia (Lugela-1 and Lugela-2), in 2012, 0.5297 and 0.4652 were observed; in 2013, 0.1104 and 0.1123 were observed; in 2014, 0.1123 and 0.1159 were observed; and for all days, 0.2293 and 0.2510 were observed. In the northern region: 0.3584 was recorded in 2012 and 0.1122 in 2013 in the province of Cabo-Delgado (Chomba); nonetheless, 0.1568 was recorded for all kinds of intermediate-sky days. In the province of Nampula (Nanhupo-1 and Nanhupo-2), 0.4991, 0.4656, 0.4393, 0.3495, 0.2201, and 0.1136 were recorded in 2012, 2013, 2013, and 2014, respectively; however, 0.3861 and 96 were recorded for all day types. In Niassa province (Massangulo-1 and Massangulo-2), 0.4973 and 0.5041 were recorded in 2012, 0.5118 and 0.5169 in 2013, and 0.4230 and 0.5031 in 2014. For all types of days, 0.4773 and 0.5281 were recorded.
Since the mapping is done over interprovincial distances of temporal spacing, the results of the measurement and mapping of solar energy are consistent with the spatial-temporal correlation analysis in Hoff and Perez (2010) [
20] and Lohmann (2018) [
38], which measure the same degree of tuning and behavior of different types of days, observing the energy correlation and bimodality characteristics of solar energy in terms of the
. This research differs in terms of the metric and measurement intervals applied, and each station’s energy content is found in addition to measuring the variability in a station both temporally and spatially.
The frequency of clear-sky days, increased more frequently in 2012 than in 2013 and 2014. The southern portion of the province, however, saw −0.0343 in 2012, −0.0306 in 2014, −0.0305 in 2014, and −0.0114 for all days in the province of Maputo (UEM-Maputo). In Gaza Province (Dindiza and Massangena), it was recorded at −0.0943 and −0.0035 in 2012, −0.0843 and −0.0754 in 2013, and −0.0314 and −0.0263 on all days. While −0.0549 was recorded on all days, −0.0036, −0.0721, and −0.00927 were recorded in the province of Inhambane (Pomene) in 2012, 2013, and 2014, respectively. In the mid-region, in the province of Tete (Marávia), in 2012, around −0.0260 was observed; in 2013, −0.1256; and for all types of days, −0.0505 was observed. In the province of Sofala (Nhangau), in 2012, −0.0597 was observed; in 2013, −0.0110 was observed; in 2014; −0.0156 was observed; and, on all days, −0.0272 was observed. In the provinces of Manica (Nhapassa-1 and Nhapassa-2), in 2012, it was maintained around −0.0597 and −0.0403; in 2013, −0.0627 and −0.0627 were observed; in 2014, −0.0627 and −0.0628 were observed; and for all types of days, −0.0552 and −0.0425 were observed. In the province of Zambezia (Lugela-1 and Lugela-2), in 2012, −0.0414 and −0.0475 were observed; in 2013, −0.0853 and −0.0875 were observed; and in 2014, −0.1132 and −0.0602 were observed; however, the evaluation in all types of days shows −0.0801 and −0.0645. In the northern region, the province of Nampula (Nanhupo-1 and Nanhupo-2) shows −0.0793 and −0.0544 in 2012, −0.0881 and −0.0882 in 2013, and −0.0909, −0.0908, −0.0861, and −0.0778 in 2014 for the examination of all clear-sky day types. In the province of Niassa (Massangulo-1 and Massangulo-2), it was found to be around −0.1109 and −0.0349 in 2012, −0.1111 and −0.0408 in 2013, and −0.0697 and −0.0504 in 2014. Nevertheless, it was recorded to be −0.0972 and 20 on all types of days.
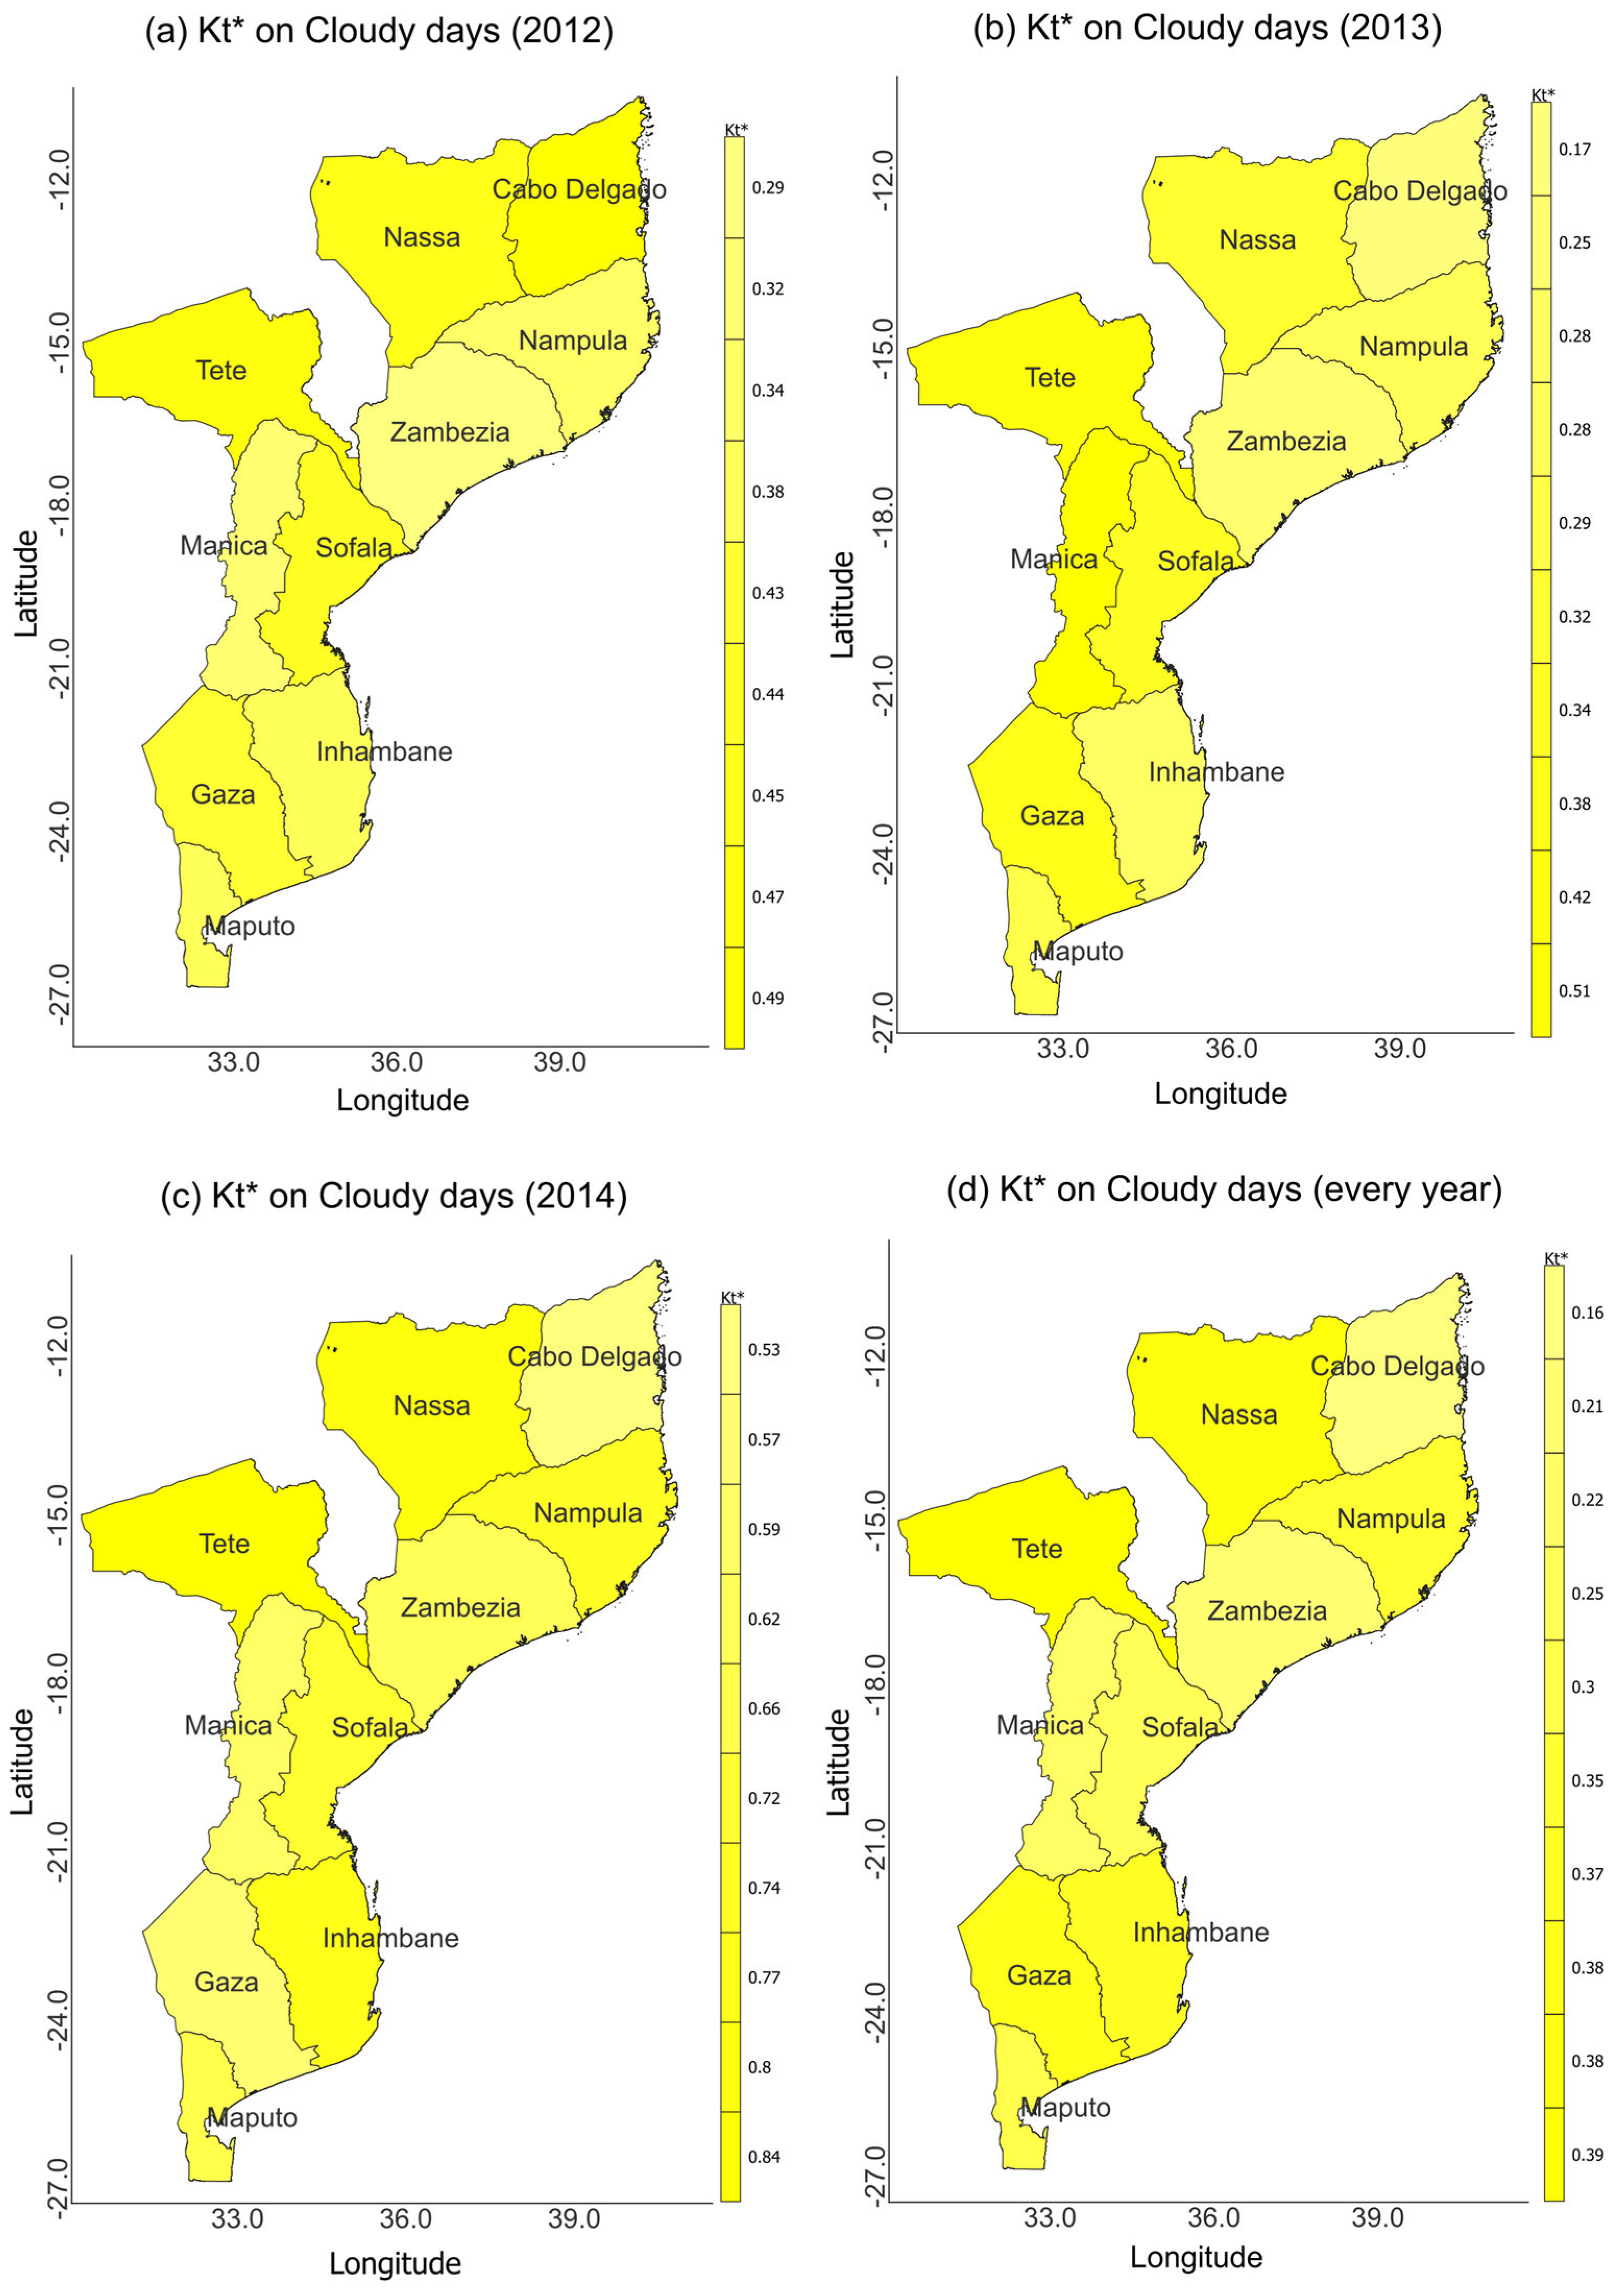
On cloudy days, there is a greater frequency and tendency for increases and increases in the clear-sky index, with a greater frequency of occurrence and density in 2012, decreasing to 2014, where a greater tendency for the was observed, that is, the decline in the index and its increase is diverse. However, it can only be observed that, throughout the southern region, in the province of Maputo (UEM-Maputo), during the year 2012, −0.0515 was observed; in 2013, −0.0514 was observed; in the year 2014, −0.0512 was observed; and for all days, −0.0172 was observed. In the province of Gaza (Dindiza and Massangena), it was possible to observe during the year 2012, −0.0832 and −0.0045; in the year 2013, −0.0541 and −0.0544 were observed; and for all types of days, −0.0277 was observed. In the province of Inhambane (Pomene), in 2013, −0.0706 was observed and in 2014, −0.0697 was observed; however, for all types of days, −0.0468 was observed. In the mid-region: in the province of Tete (Marávia), in 2012, −0.0598 was observed; in 2013, −0.0491 was observed; and for all types of days, −0.0363 was observed. In the province of Sofala (Nhangau), in 2012, −0.0329 was observed; in 2013, −0.0001 was observed; in 2014, −0.0125 was observed; and for all types of days, −0.0111 was observed. In the province of Manica (Nhapassa-1 and Nhapassa-2), in 2012, −0.0385 and −0.0455 were observed; in 2013, −0.0905 and −0.0921 were observed; in 2014, −0.0923 and −0.915 were observed; and for all types of days, −0.0435 was observed. In the province of Zambezia (Lugela-1 and Lugela-2), in 2012, −0.0660 and −0.0679 were observed; in 2013, −0.0372 and −0.0346 were observed; in 2014, −0.0356 and −0.0356 were observed; and for all types of days, −0.0463 and 474 were observed. In the northern region, in the province of Cabo Delgado (Chomba), −0.0498 was recorded in 2012, −0.0414 in 2013, and −0.0304 for all days. The following values were recorded in the province of Nampula (Nanhupo-1 and Nanhupo-2): −0.0638 and −0.0474 in 2012; −0.0513 and 0.0005 in 2013; −0.0476 and −0.0476 in 2014; and −0.0542 and −0.0315 for all types of days. It was recorded as −0.0754 and −0.0557 in 2012, −0.0654 and −0.0380 in 2013, −0.0245 and −0.0621 in 2014, and −0.0551 and 9 for all types of days in the province of Niassa (Massangulo-1 and Massangulo-2).
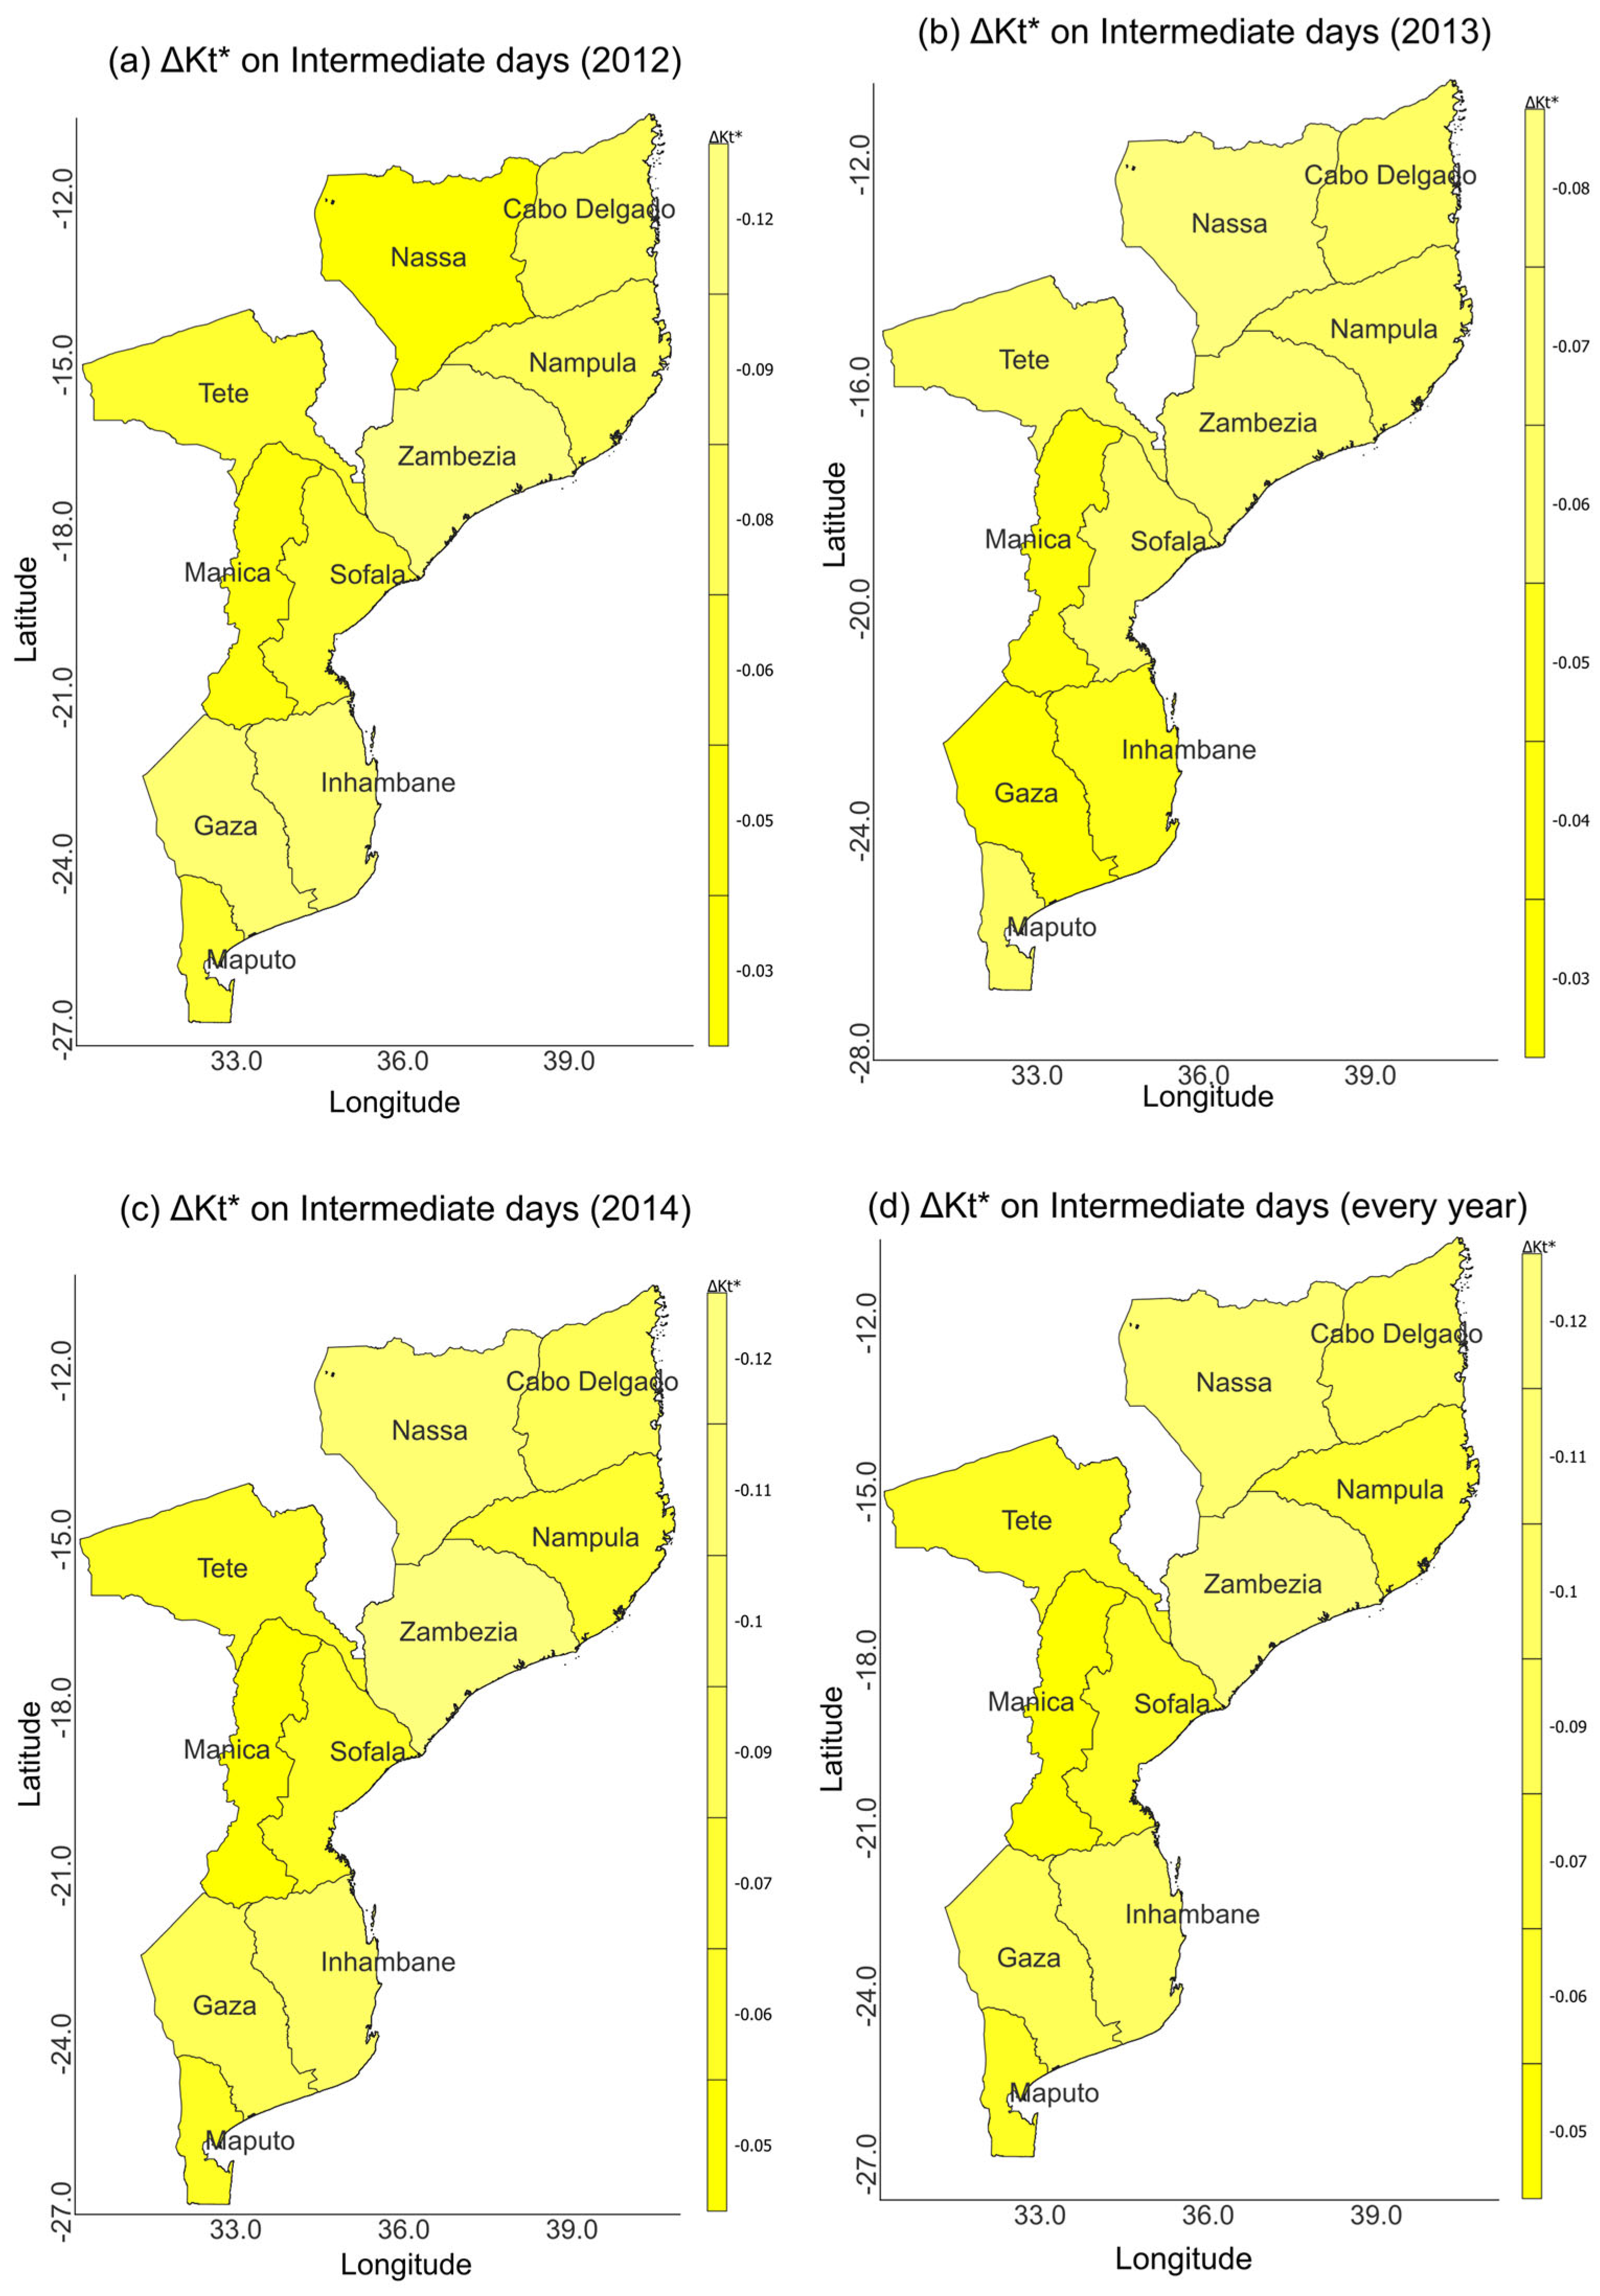
For intermediate-sky days, it has intermediate incremental characteristics between the high frequencies of clear days and the low frequencies of cloudy-sky days, presenting itself in a fluctuating manner. However, the following can be observed throughout the southern region: in the province of Maputo (UEM-Maputo), during the year 2012, −0.0553 was observed; in the year 2013, −0.0554 was observed; in the year 2014, −0.0546 was observed; and for all types of days, −0.0184 was observed. In the province of Gaza (Massangena and Dindiza), in 2012, −0.1220 and −0.126 were observed; in 2013, −0.1167 and −0.1067 were observed; and for all types of days, it was possible to observe −0.0407 and −0.0398. In the province of Inhambane (Pomene), in 2013, it was possible to observe −0.0802, in 2014 it was only possible to observe −0.1106, and for all types of days it was possible to observe −0.0636. In the mid-region: in the province of Tete (Marávia), in 2012, only −0.0621 could be observed and in 2013, −0.0592 was observed; however, for summary in all types of days, −0.0404 was shown. In the province of Sofala (Nhangau) in 2012, it was possible to observe −0.0502; in 2013, −0.0061 was observed, in 2014, −0.0161 was observed; and for all types of days, −0.0208 was observed. In the province of Manica (Nhapassa-1 and Nhapassa-2), in 2012, it was possible to observe −0.0468 and −0.0626; in 2013, it was possible to observe −0.0762 and −0.0762; in 2014, −0.0762 and −0.0762 were observed; and for all types of days, −0.0664 and −0.0717 were observed. In the province of Zambezia (Lugela-1 and Lugela-2), in 2012, it was possible to observe around −0.0599 and −0.1161; in 2013, −0.0684 and −0.0607 were observed; in 2014, −0.0669 and −0.0728 were observed; and for all types of days, it was observed −0.0651 and −0.08322. In the North region: in the province of Cabo-Delgado (Chomba), in 2012, only −0.0766 could be observed; in 2013, −0.0662 was observed; and for all types of days, −0.0472 could be observed. In the province of Nampula (Nanhupo-1 and Nanhupo-2), in 2012, it was possible to observe −0.0679 and −0.0677, in 2013, it was possible to observe −0.0662 and −0.0636, in 2014, it was possible to observe −0.0654 and −0.0644, and for all types of days, it was possible to observe −0.0653. In the province of Niassa (Massangulo-1 and Massangulo-2), in 2012, it was possible to observe −0.0740 and −0.0580; in 2013, −0.0856 and −0.0533; and in 2014, it was possible to observe −0.0366 and −0.0505; however, for days with all types of skies, it was possible to observe −0.0654 and −0.0539.
However, the above-mentioned increases in the
are primarily due to the atmosphere’s little attenuation, which is primarily caused by uniformly mixed gases. Ozone attenuates a little more than uniformly mixed gases; however, some models do not include a separate absorption term for evenly mixed gases. The amount of ozone in the atmosphere obviously affects this. In a specific investigation of a range of thousands of kilometers between measurement sites, Mucomole et al. (2024) [
29] similarly report the observation results of
, noting an incremental dynamic. However, the mapping done here specifically demonstrates the incremental dynamic primarily on clear-sky days, followed by intermediate-sky days that are amplified as high solar energy fluctuations and deviations, thereby increasing the likelihood of variability in a solar plant’s solar power output (additionally see
Supplementary Material provided on data set
mozambique_ghi_kWh_per_m2_per_day.csv).
The three primary attenuators are additionally found to be water vapor, aerosols, and (dispersion) by air molecules; however, the relative significance of water vapor and aerosols again depends on their atmospheric concentration. Additionally, the absorptance of aerosols is dependent on the albedo of single scattering. In general, the transmittances of molecular absorbers are not affected by the zenith angle. The Rayleigh and aerosol transmittances decrease significantly with zenith angle, these results are similarly analyzed in Duffie and Beckman, (1991) [
2], Iqbal (1983) [
15], Mucomole et al. (2024) [
29], and Mucomole et al. (2025) [
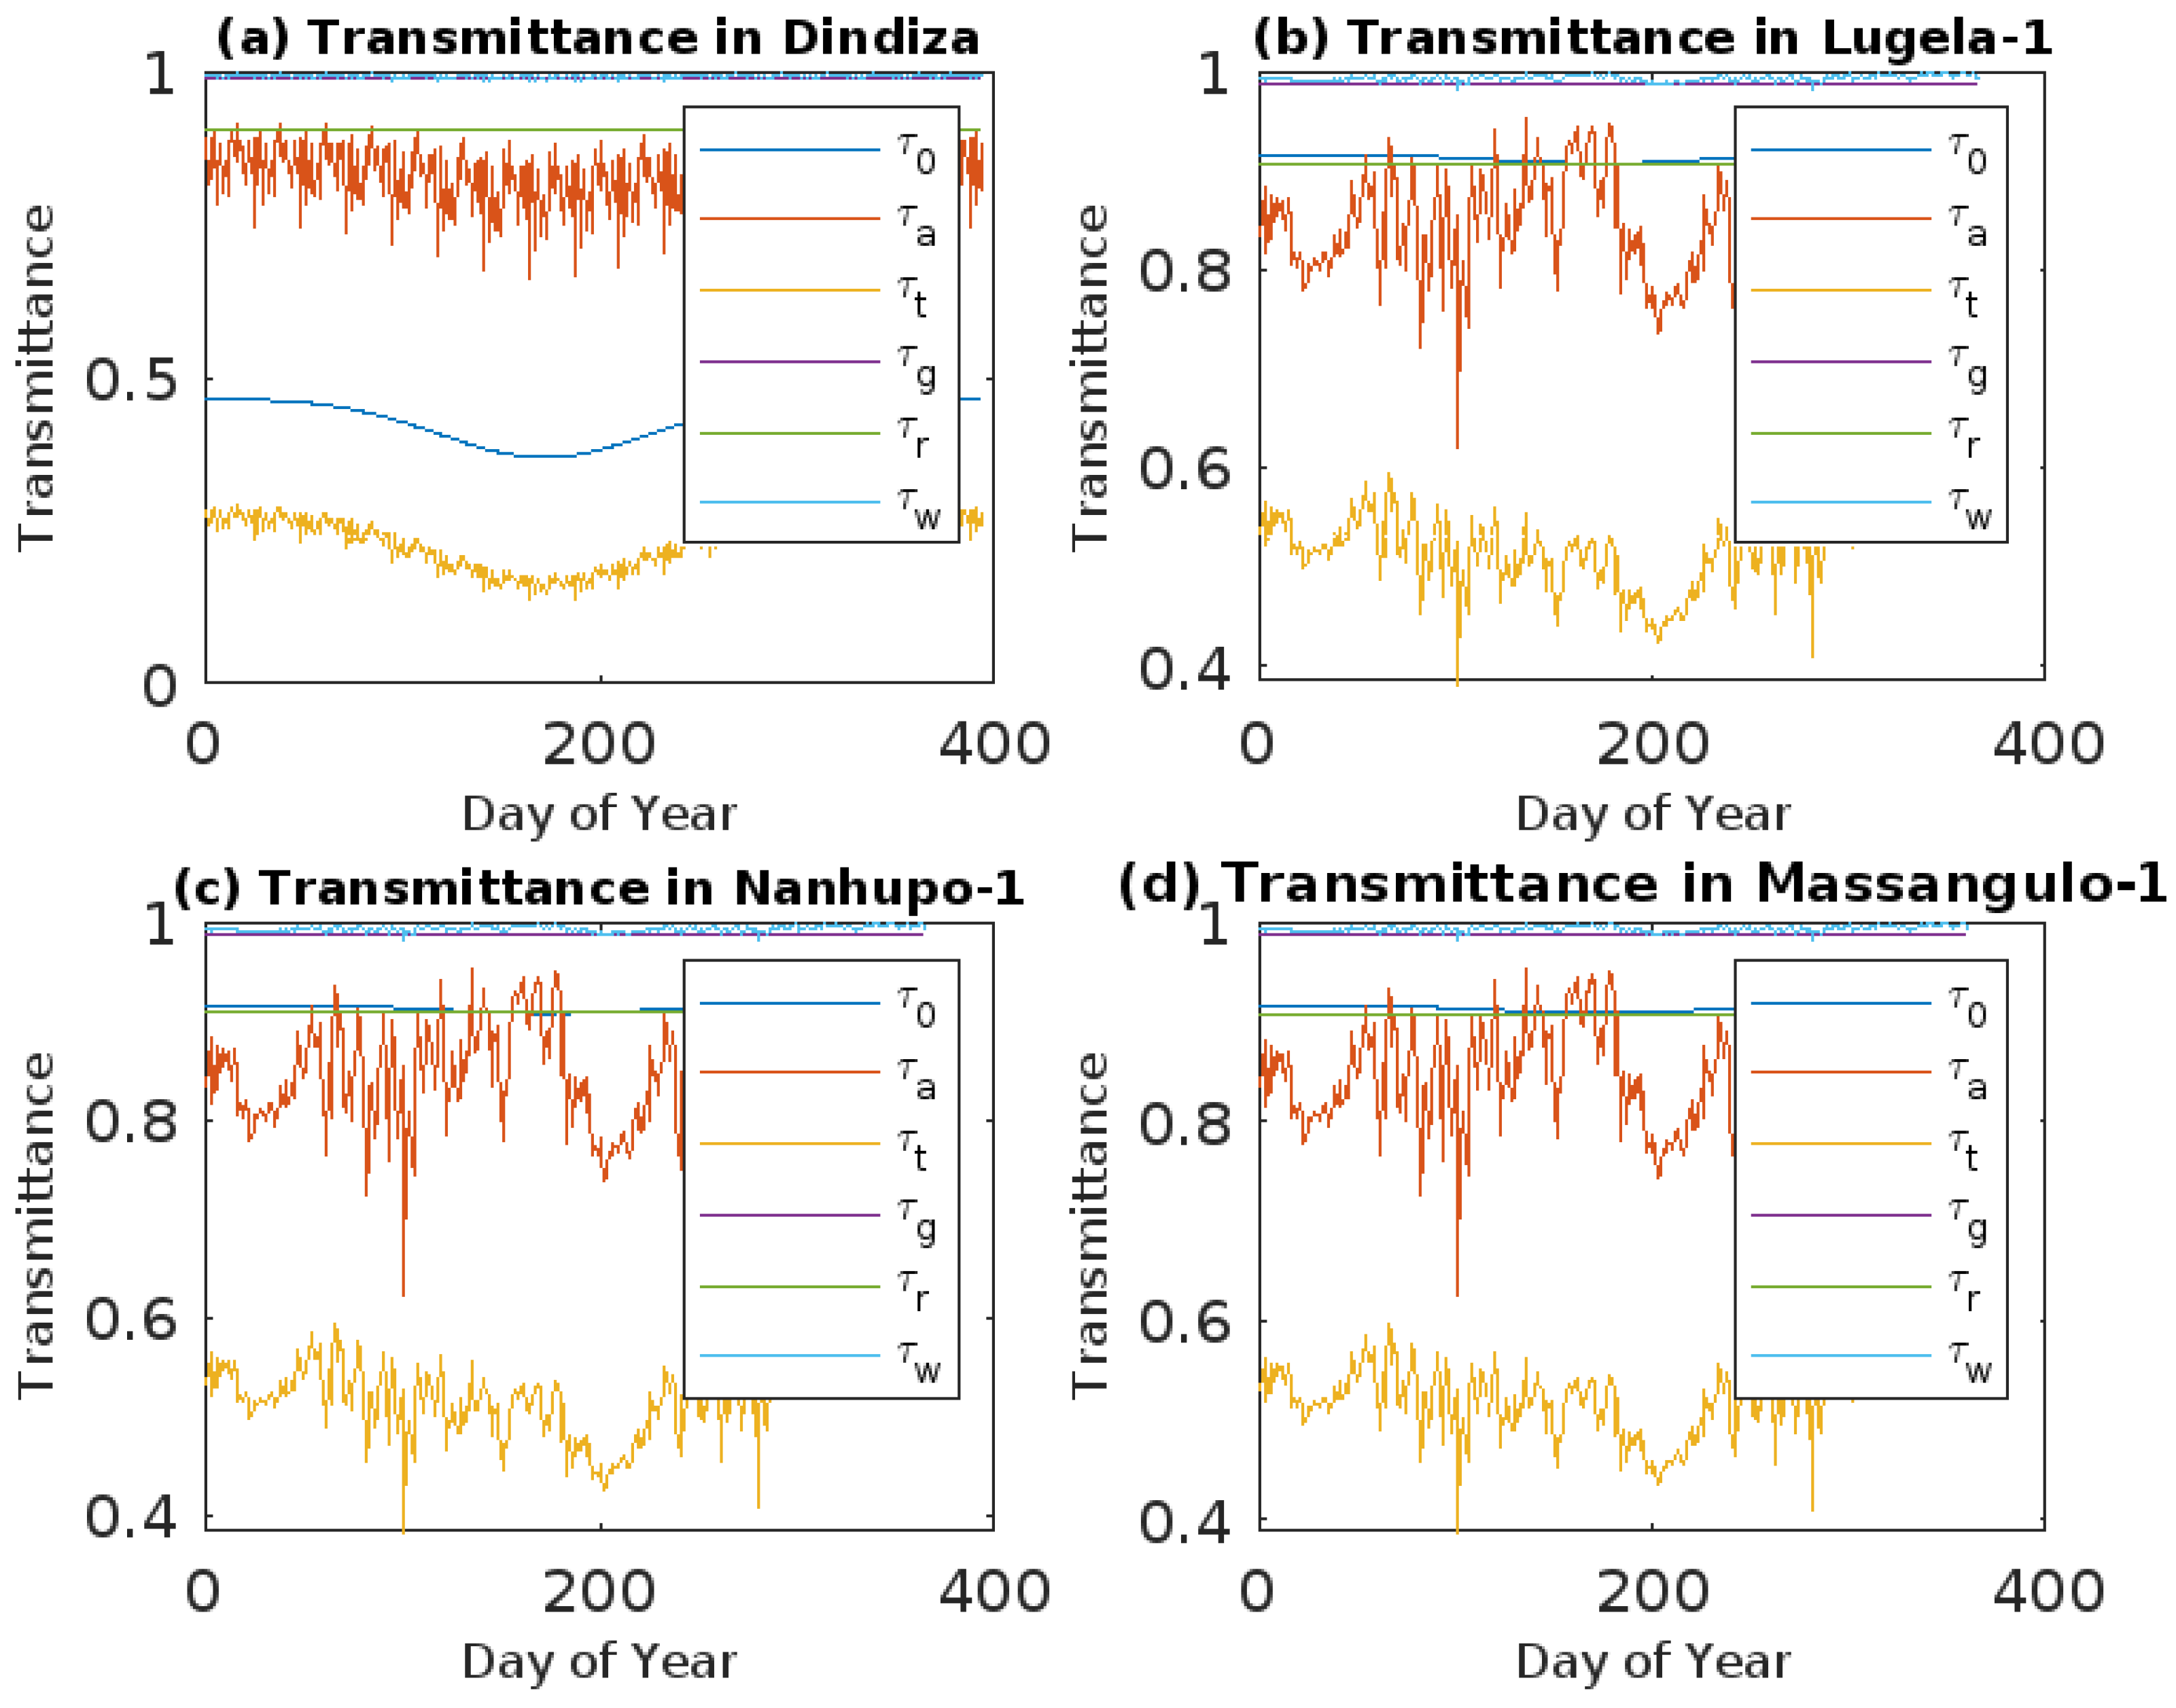
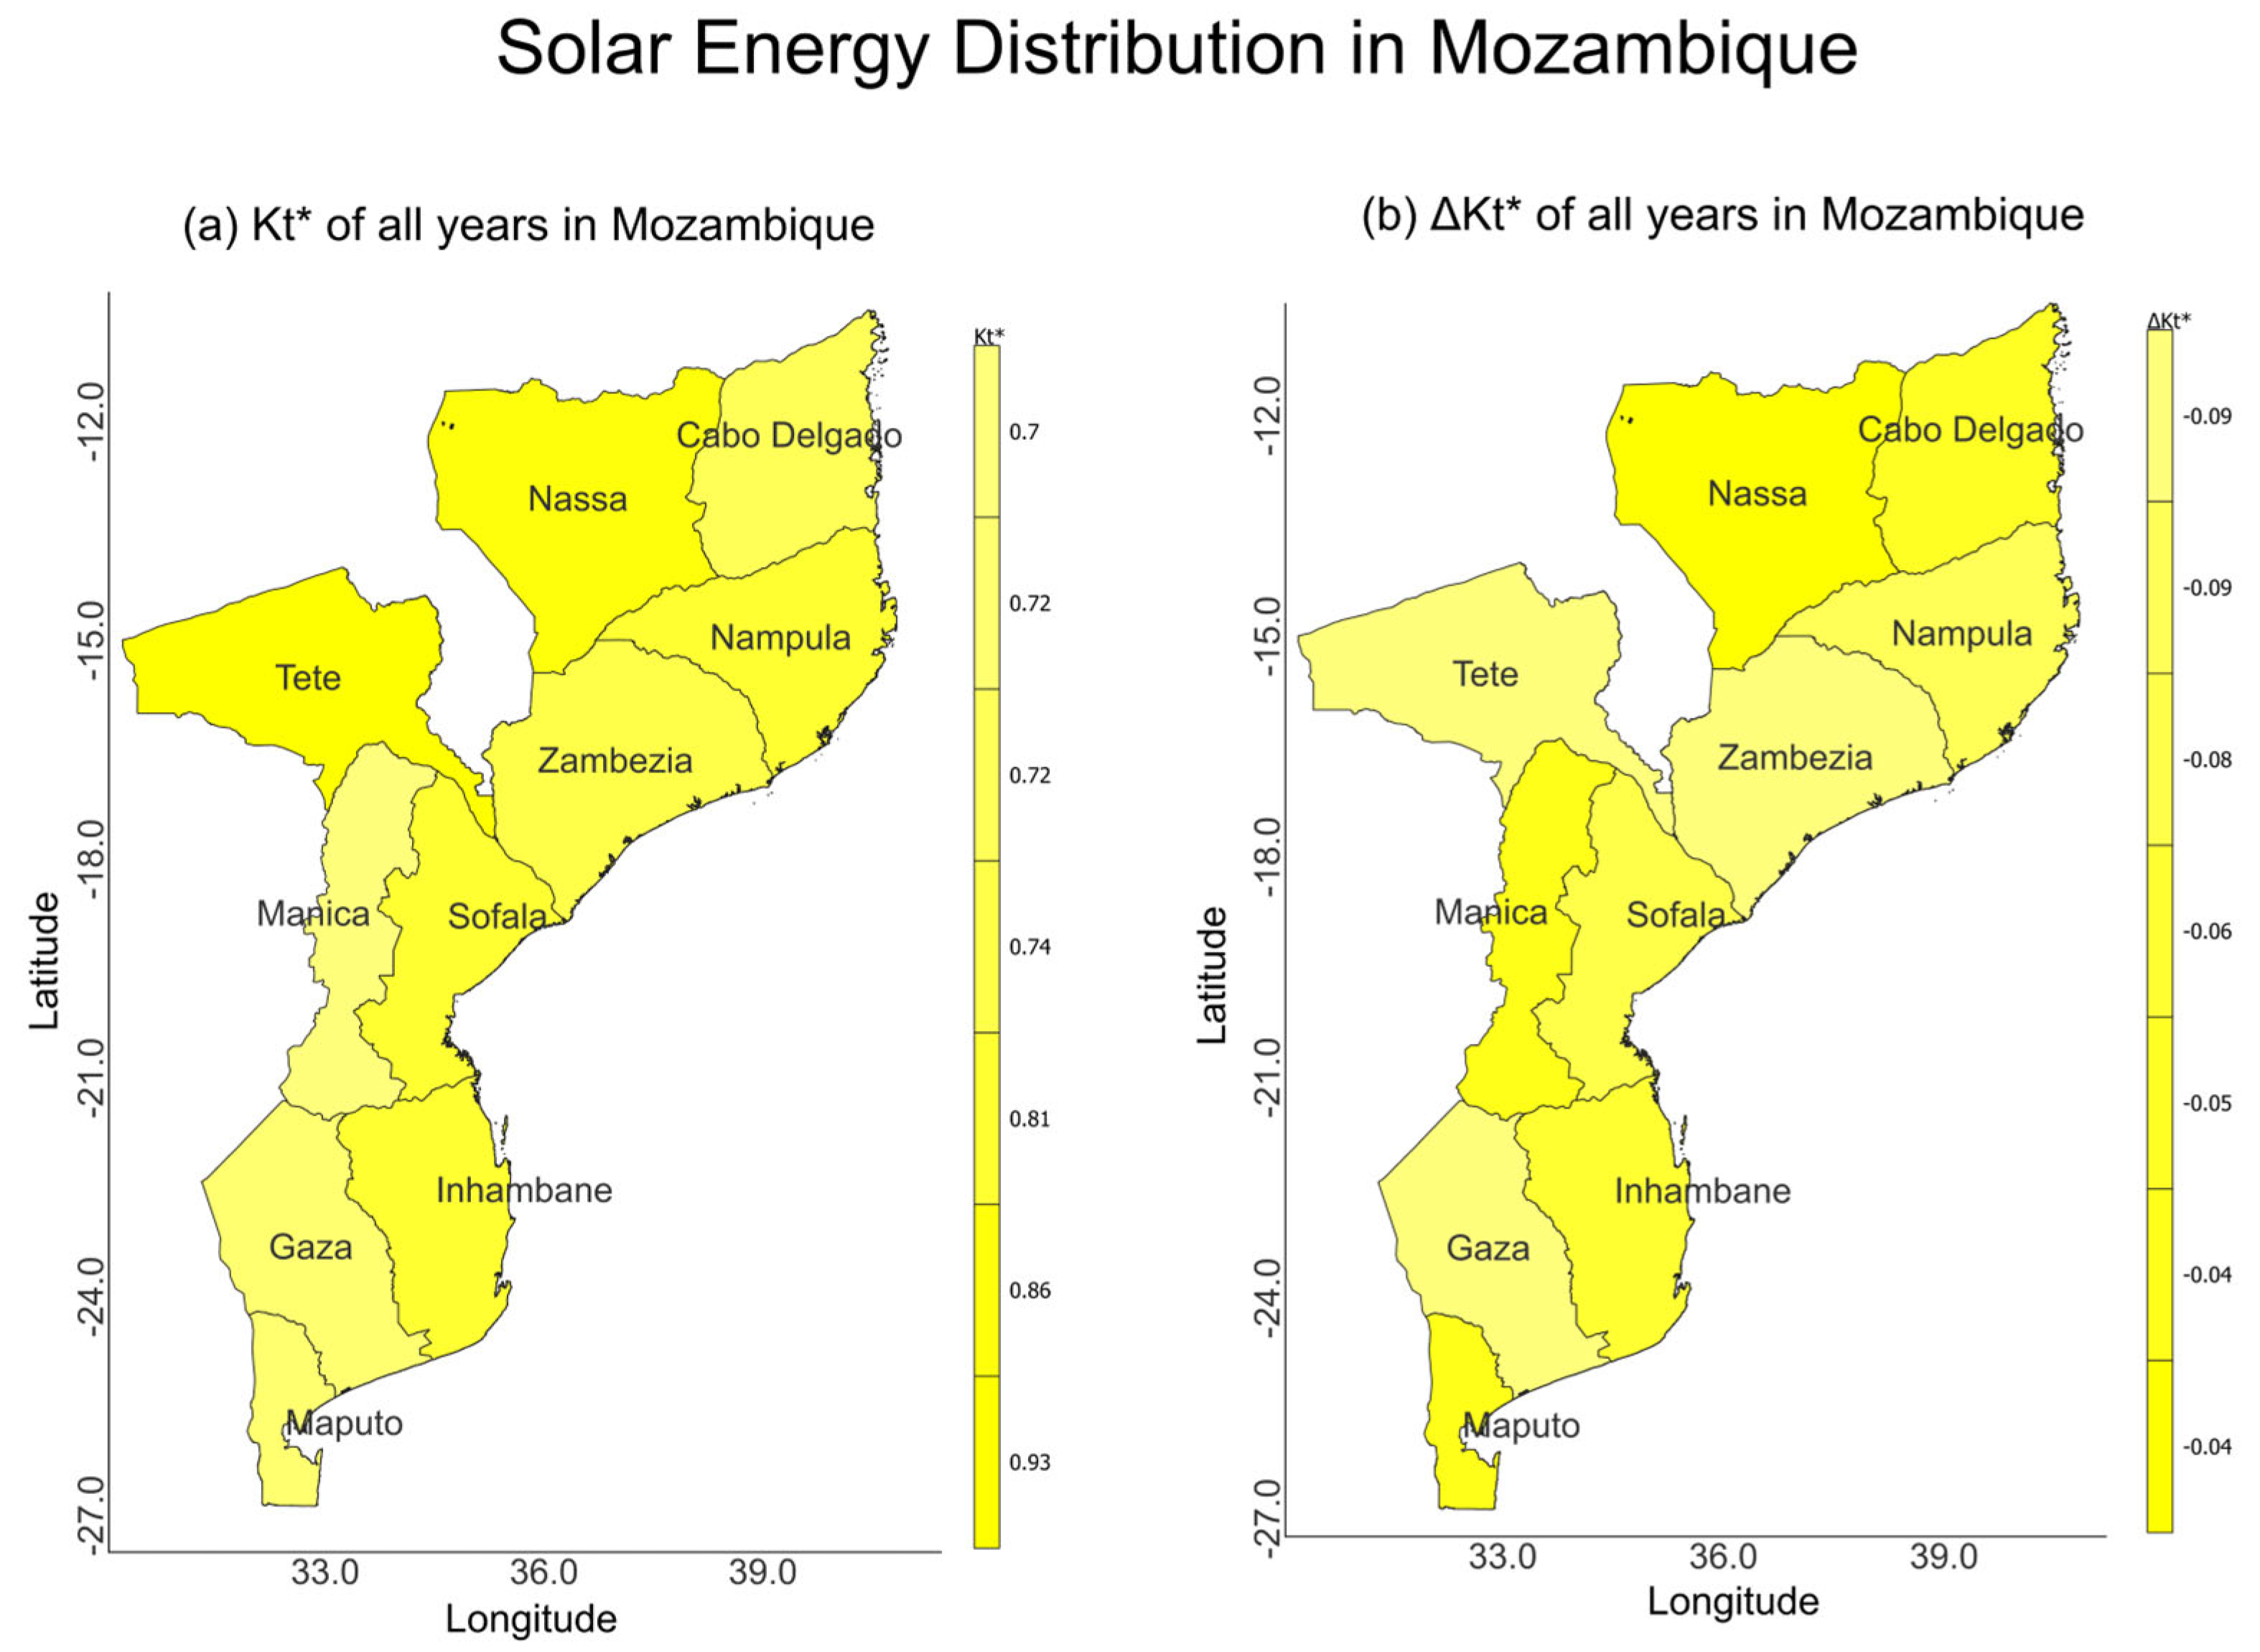
6], who observe the same cloud interference; however, here, the cloud is modeled in such a way as to perceive the totative horizontal energy with a focus on its mapping, observing in all results that there is high transmissivity in hot periods with correlated seasons in terms of transmittances in the order of 0.92, intra-mid (central) and northern regions as well as mid–southern and northern regions.
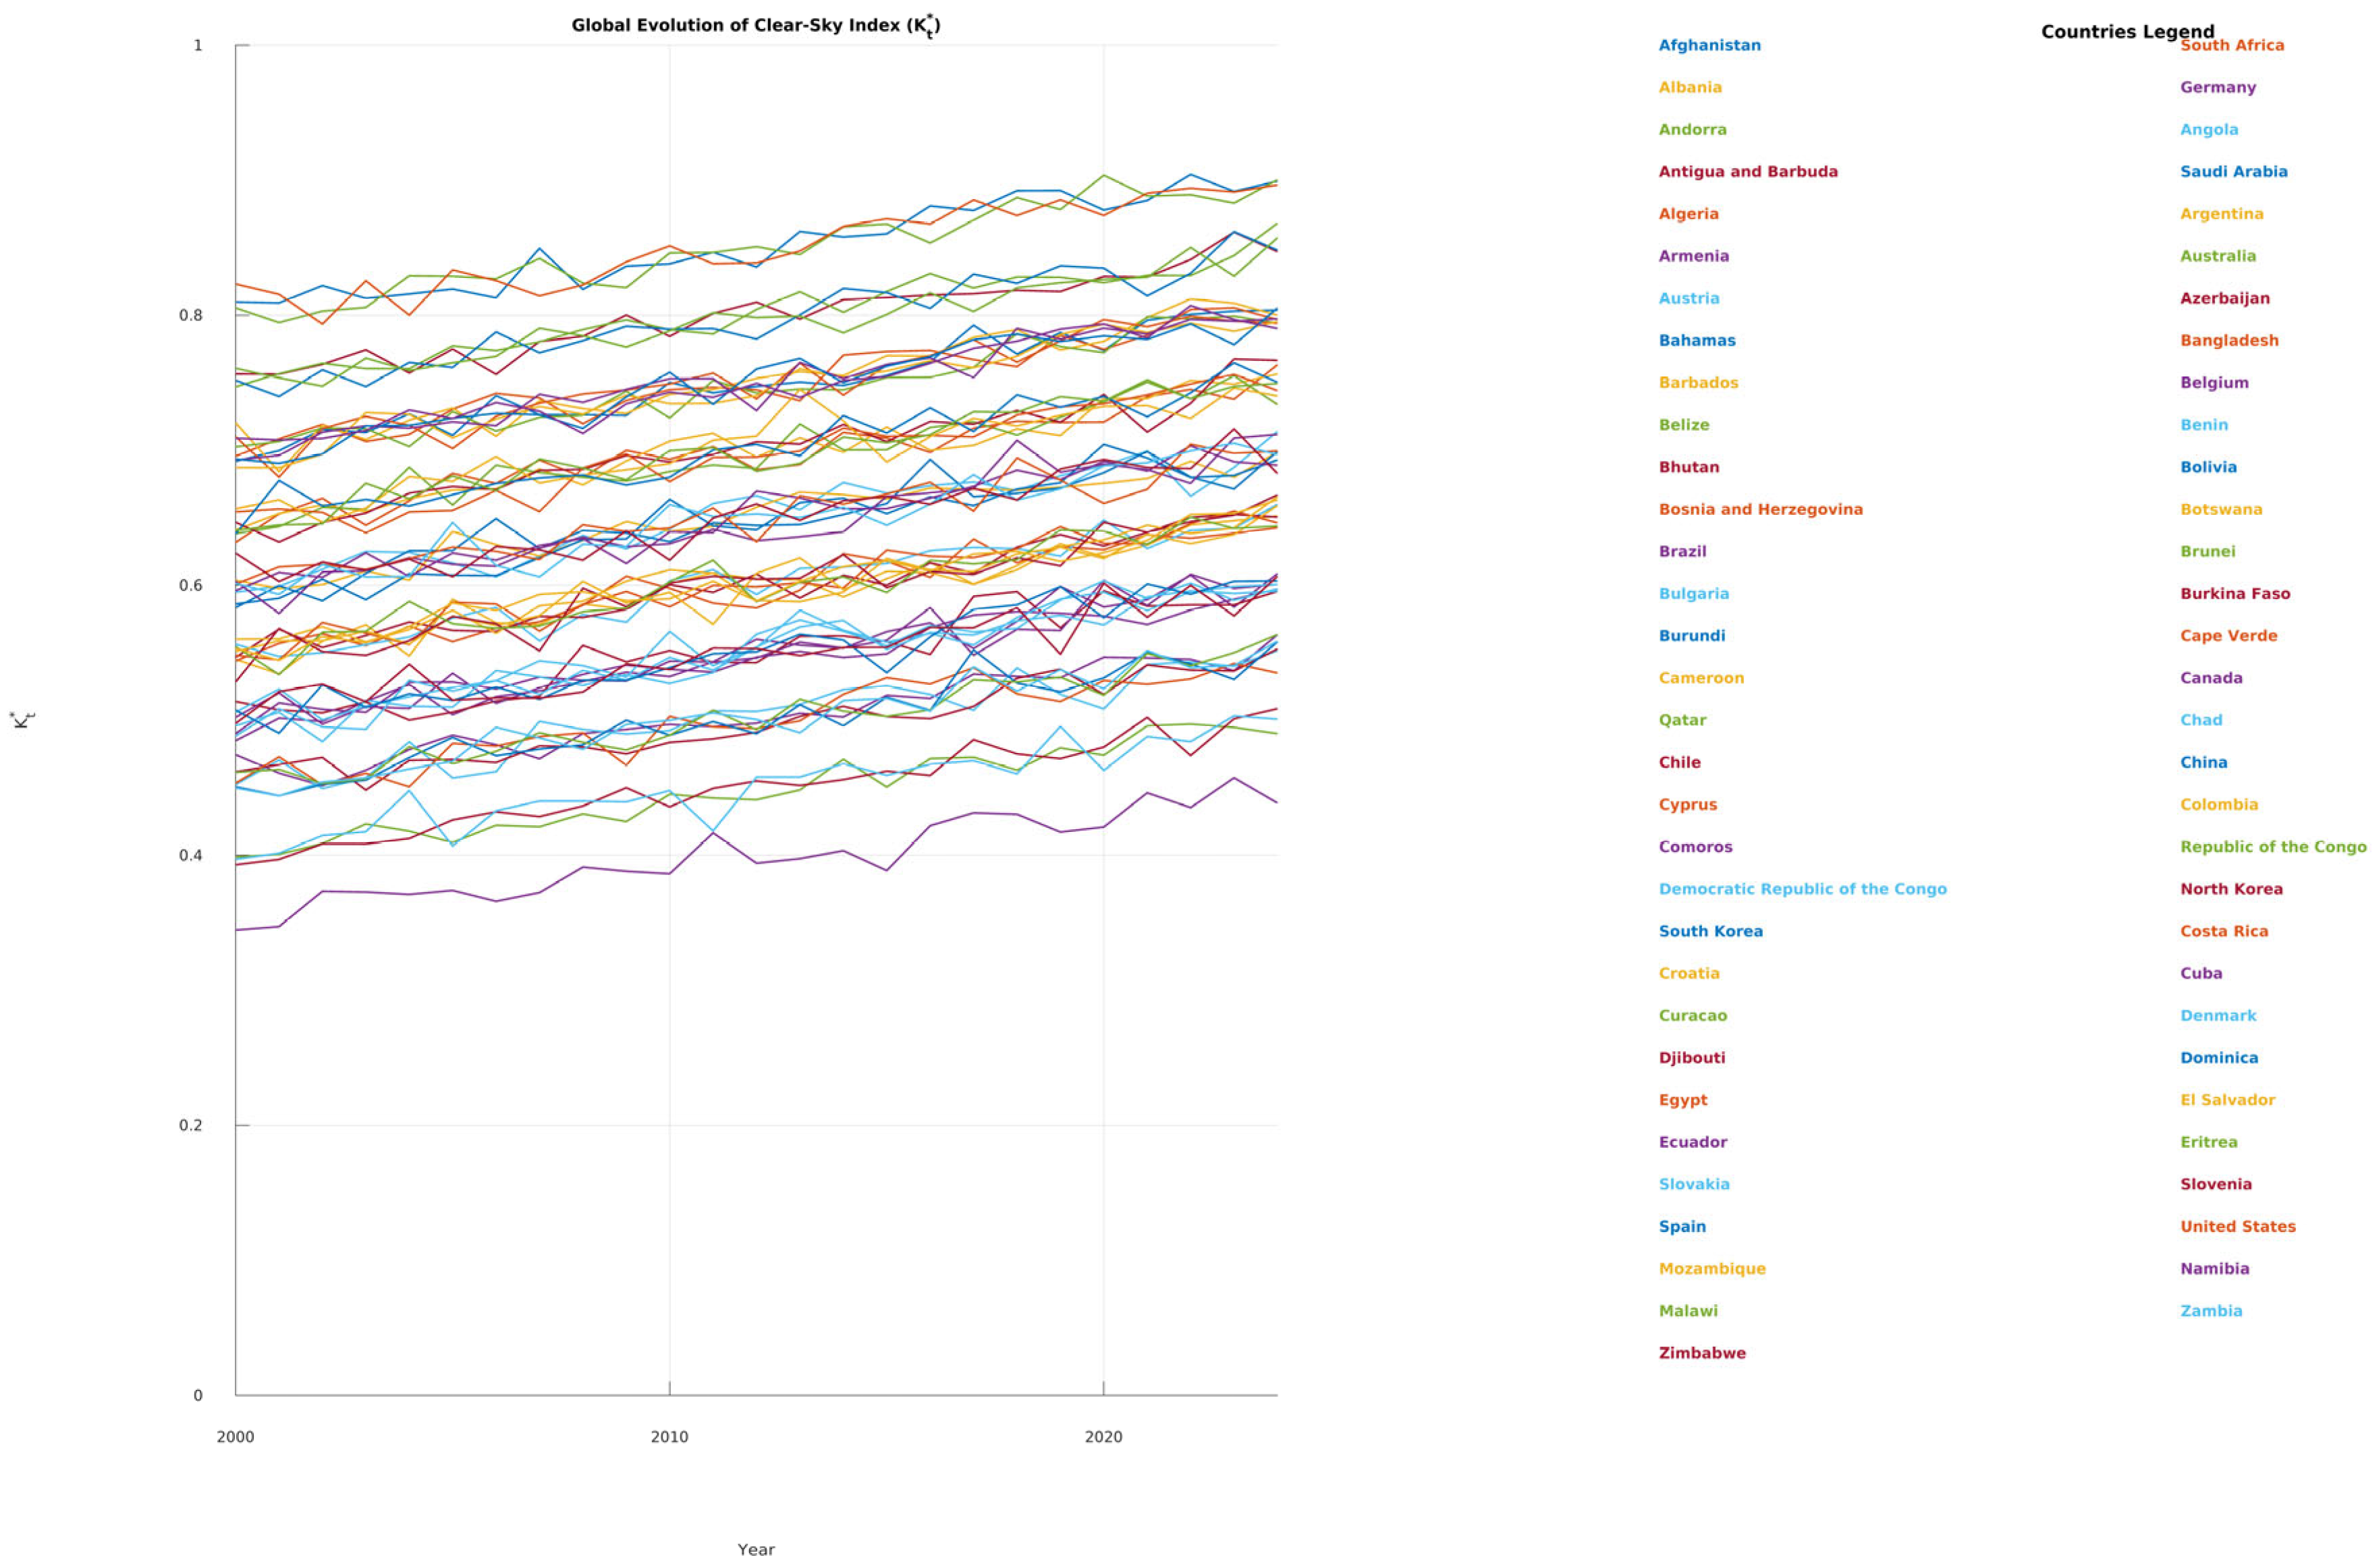
The sky of Africa is among the clearest in the world; countries Morocco, Ethiopia, Namibia, and Botswana are among the nations with the purest skies. With a low, clear sky, Mozambique rates higher than nations like Nigeria, Cameroon, and the Democratic Republic of the Congo, but lower than those in the north and south. The skies in Asia are the cleanest, whereas the skies in the Americas are high and clear. In general, clear-sky scores are low in Europe.
5. Conclusions
The adoption of alternative sources is encouraged by the need to find energy to fulfill the increasing demand. Compared to other renewable energy sources like wind and hydro, solar technology is a clean, sustainable resource that does not harm the environment when used. The ozone layer, uniformly mixed gases, aerosols, and water vapors that contribute to the attenuation, dispersion, and other forms of reduction of solar energy, such as attenuation, absorption, and reflection, are among the atmospheric parameters that are being modeled and mapped in order to completely eliminate the variability of solar energy on the earth’s surface. This is because the emission of gases has been stimulating fluctuations that affect the adherence to this resource and reduce the effectiveness and permanence of the plants.
The atmospheric transmittance contributes approximately 0.98 during the hot and rainy season compared to 0.56 during the cold and dry season. This is to account for the region of study’s orientation with respect to the sun, which absorbs more energy and promotes its dispersion to the surface. On the other hand, there are greater circulations of hydrological circle parameters, which promote the fall of particles like dust and Aitkins’s aerosols in the atmosphere and a greater incidence of direct solar energy.
In high-altitude regions, the transmittance of uniformly mixed gases is higher than that of the ozone layer. Water vapor and aerosols follow, creating a cumulative transmittance that affects the variable form of solar energy that reaches the earth’s surface.
The number of clear-sky days increases as a result of human activity that releases particles into the atmosphere, such as dust, aerosols, uniformly mixed gases, and substances that strengthen the ozone layer. Therefore, the , which was 0.8956 in 2012, is in the range of 0.6986 in 2014. Conversely, on cloudy days, the intensifies between 0.3569 and 0.5214, indicating an increase in cloudiness, with a concentration on the mid and northern regions along the study region. This is caused by emissions from mining activities as well as the involvement of natural cyclones, which assist in transporting masses of different particles to unfavorable regions, resulting in this situation. Lower characteristics, which resemble the behavior of cloudy-sky days, and higher characteristics, which resemble clear-sky days, are displayed on clear-sky days. Energy fluctuates in various frequency scales, with a focus on high solar energy trends, which affect a solar plant’s output. As a result, solar generation must be dimensioned in relation to the total energy presented.
The clear-sky days that have been mapped exhibit a high incidence flow, with values near one in the categorization diagram. Cloudy days, on the other hand, exhibit a low deviation with features in the low order of the categorization diagram. In contrast, the intermediate days have tendencies of large deviation of solar energy values, displaying characteristics that fall somewhere in between those of the two categories of days.
Variability in the amount of solar energy that reaches the earth’s surface is caused by the high tendency for high swings in solar energy on days with intermediate features in comparison to other days that also show a high flux and solar energy flux.
On the other hand, days in between show a steady decline in solar energy with long, flattened borders and a central maximum. The clear-sky days degrade gradually and then abruptly to frequencies below 0.0003 with significant variance, while the clear days vary abruptly to frequencies below 0.002.
Mozambique performs upper middle in terms of clarity than hot, desert countries like Saudi Arabia, Qatar, and Egypt, but better than those with nublated or frisky climates. There are significant clearness taxes in insular countries like Curaçao and the Maldives. Tropical countries like Brazil and Mozambique have moderate clearness indices, whereas arid climates increase the .
The frequency of growing trends in clear-sky days is larger in 2012 than it is in 2013 and 2014. increases are more common and show an increasing trend on cloudy-sky days. In 2012, the frequency of occurrence density was higher, but it decreased until 2014, when the trended higher. Between the high frequencies of clear days and the low frequencies of cloudy-sky days, intermediate-sky days vary in their incremental characteristics.


