1. Introduction
The current power grid is shifting towards decentralized models in order to accommodate more renewable energy sources and meet net zero emissions targets. Standalone microgrids (SMGs) are one of the decentralized power system models. SMG control is more complicated than grid-connected control due to the substantial vulnerability to frequency and voltage changes [
1]. An SMG is a standalone power system that typically includes renewable energy sources. Microgrids with a higher percentage of renewable DG resources commonly exhibit frequency fluctuations due to power imbalance because these resources are inherently intermittent.
System frequency and voltages may vary if there is an imbalance between the supply and demand for power. As a result, generation adequacy is frequently a serious issue in SMG systems. To overcome this, a variety of demand-side management strategies are routinely used. Demand Response (DR) schemes are often classified into two categories: incentive-based programs (IBP) and price-based programs (PBP). Direct Load Control, Demand Bidding/Buyback Programs, and Capacity Market Programs are representative examples of Incentive-Based Programs (IBPs). These programs typically offer financial incentives to consumers who agree to reduce or shift their electricity usage during peak periods or under system stress conditions. In contrast, Time-of-Use (TOU) Pricing, Real-Time Pricing (RTP), and Critical Peak Pricing (CPP) are key examples of Price-Based Programs (PBPs). These mechanisms rely on dynamic or time-varying electricity tariffs to influence consumer behavior, encouraging load shifting in response to price signals. Consumer privacy and system scalability are the main challenges of Direct Load Control (DLC) DR programs, and it is challenging to introduce and integrate price-based DR into different energy markets [
2]. As a result, it is clear that certain customers will be against DR programs. DR initiatives become an impractical solution when certain customer segments are present in the SMG system and are unable to alter their electricity usage behaviour.
On the other hand, the integration of renewable energy into the power system is driven by economic benefits and the mitigation of climate change. However, integrating renewable energy presents a number of difficulties for the current power system, including problems with reliability. Reference [
3] presents an interconnection planning method aimed at significantly enhancing the reliability of multiple microgrids. The paper demonstrates numerical simulations on a practical hybrid AC/DC microgrid system, showing that the proposed method can reduce interconnection costs by up to 21.8% compared to conventional uncertainty-based approaches. Reference [
4] proposes a comprehensive microgrid planning model designed to determine the optimal sizing and generation mix of distributed energy resources (DERs), as well as to select the appropriate microgrid type, either AC or DC. In this study, the selection of the microgrid type is based on economic criteria, where the planning objective incorporates several cost components: the investment and operational costs of DERs, the cost of energy procurement from the main grid, and the reliability cost associated with supply interruptions.
Considering this, SMG systems assist in managing reliability concerns by generating and storing electricity locally. The installed capacity of the generating resources, storage systems, and backup generators must be increased in this situation to address the reliability concern of SMGs. A crucial issue that arises is who should bear this additional price. Regardless of the consumer sector or how much electricity they use, should they all pay the same rate, or should those with a specific load profile pay more? Some large consumers have had contract-based reliability with providers in traditional power systems to acquire the required reliability specific to their industry. However, in recent years, there have been increasing expectations from almost all customers for a higher level of reliability, due to the intense dependence of life and businesses on electricity. Consequently, utilities and electricity providers are planning accordingly to satisfy the customers’ expectations of power supply reliability. Maintaining a high level of reliability requires continuous investment in expansion, replacement and preventive maintenance, which require funds to accomplish during the lifetime of grids. This fund will be sourced from customers, but it is not feasible to arrange a specific contract with each customer, like the traditional approach with large customers, as this approach is very admin intensive. On the other hand, utilities and electricity providers are looking for methods to enable them to allocate the cost of reliability to customers quickly and fairly. This cost allocation is much more critical in SMGs, as the main component of future power systems. It is important to note that the cost of reliability in renewable-rich SMGs is usually higher than conventional power systems due to the intermittency of renewables and the need for extra investment in energy storage or other instruments for reliability improvement. These characteristics of renewable-rich microgrids highlight the significance of developing a fair allocation of reliability cost amongst customers within an SMG. This is the motivation behind developing this paper to develop a fair method for allocating reliability costs in an SMG to different customers, which would be an effective decision-making tool for utilities and electricity providers. Numerous research studies have been conducted on methods for calculating Customer Interruption Cost (CIC), primarily focusing on quantifying the economic impact of power outages across different customer categories. However, there is limited or virtually no research that addresses the crucial issue of allocating the cost burden of reliability improvement investments among various customer sectors within a standalone microgrid (SMG), particularly based on their electricity usage patterns during Loss of Load (LOL) events. The primary objective of this research is to develop a systematic approach for distributing the costs associated with reliability enhancements of an SMG among its connected customer sectors. While several studies have proposed methods for estimating reliability-related costs, they lack a clear methodology for how these costs should be equitably shared among different customer sectors in a microgrid environment. This research gap is explicitly identified and further examined through the detailed literature review presented in the following section.
Adequacy analysis, sometimes referred to as reliability analysis in distribution planning, is the analysis that determines the likelihood of customers’ access to a consistent supply [
5,
6,
7,
8]. In recent years, many academics have investigated methods for improving generation reliability and examined the cost of reliability. Liu et al. [
5] proposed a consumer-centric reliability assessment to estimate the marginal cost of distribution system reliability. Ghajar [
9] used the quantitative power system reliability technique to calculate the marginal cost of a generation system. The proposed technique involves estimating the incremental projected unserved energy at a specific operational reserve and lead time and multiplying this value by the generation system’s average unserved energy cost. Most studies [
9,
10,
11] have used the sub-sector customer damage function (SSCDF), which further segments consumers into sub-sectors to obtain a more precise knowledge of interruption cost because interruption cost is not consistent among customers from various sectors. This was mainly concerned with calculating the cost of customer interruption (CIC) to various industry sectors, and outages are divided into those that were anticipated and those that were not.
The cost of reliability enhancement has been calculated using a variety of methods by many academics, but as far as the author is aware, there are no research publications that describe how this cost should be distributed among the various customer sectors. Customers should be charged for the costs incurred by the supplier since they should be expected to pay for the cost of reliability upgrades in the power system [
12]. Furthermore, the cost of reliability improvement should be covered by the same consumer when they are unable or unwilling to support generation adequacy in the SMG system by declining to engage in demand-side management actions. Additionally, the CIC varies by customer sector [
13,
14], so some are more willing than others to pay for a reliability increase [
3]. A few load-shedding events are also acceptable in several consumer sectors, such as warehouses, in exchange for cheaper electricity prices. Because of this, they will not agree to pay for reliability upgrades unless the cost is equally distributed among all customer sectors.
In general, there are large differences between the customer demand profiles of different customer sectors. Additionally, demand for each customer segment changes over time. It is necessary to evaluate at least hourly demand for the full year to properly handle the load profile. Contrarily, most of the earlier research suggested various tariff plans that included demand-side control techniques by considering the load profile on an annual, monthly, weekly, or daily basis. Ghajar and Billinton [
13] introduce the concept of employing a composite customer damage function (CCDF) to evaluate the cost of interruption in their research study. The cost of a given interruption will vary between customers when a utility serves a wide range of customer types. A weighted average based on the annual peak demand or energy consumption of each customer group is advised to combine individual charges. Interruptions less than one and a half hours long are usually weighted using annual peak demand, whereas longer interruptions are weighed using annual energy usage.
Demand-based tariff plans cannot handle this research challenge for an SMG system because they are typically applicable in grid-connected systems. Due to the intermittent nature of renewable energy resources, traditional pricing models do not take variable generation costs into account. Additionally, each consumer pays the same unit price for electricity, regardless of the amount of RES power generated during use. Therefore, under present tariff schemes, consuming less electricity is not rewarded when renewable energy is scarce (cloudy days). In the past, a variety of pricing strategies have been created to offer incentives to customers who take part in demand response (DR) schemes. There were no pricing schemes that were specifically designed to divide customers into different groups and divide cost obligations among them.
Evaluation of the reliability level is key to this research concept, for which the corresponding literature is reviewed here. For the software business, Kavita Sahu and R. K. Srivastava offered proposals for improving the usefulness of reliability prediction models [
15]. The purpose of the paper is to identify the importance of reliability prediction models for various software sectors. A fuzzy analytic hierarchy process (Fuzzy AHP) technique was presented by Abdulaziz Attaallah et al., to assess the priorities and overall data security of big data security in the health sector [
16]. To create a dynamic digital healthcare data breach scenario Ahmed H. Almulihi et al., use fuzzy-based analysis to determine the accuracy of the healthcare datasets [
17]. Fuzzy logic and neural networks were included in the approach presented by Kavita Sahu and R. K. Srivastava for the evaluation and prediction of software reliability. The reliability of software computational techniques has been improved using a variety of soft computing techniques [
18,
19]. A strategy to choose the optimum reliability prediction model was put out by Kavita Sahu et al. The suggested approach combines the analytical hierarchy method (AHP), hesitant fuzzy (HF) sets, and TOPSIS (technique for order of preference by similarity to ideal solution). Additionally, it has been determined that a numerical evaluation of web applications’ durability may have an impact on their service life and low-cost administration. In this context, Kavita Sahu et al. suggested a method to illustrate and carry out a numerical evaluation of durability in this context. The study concludes that a useful methodology for assessing the durability properties of online applications is the hesitant fuzzy-based symmetrical technique of the Analytic Hierarchy Process (AHP) and Technique for Order of Preference by Similarity to Ideal Solution (TOPSIS) [
20]. Using the MATLAB toolbox, Kavita Sahu and R. K. Srivastava introduced fuzzy logic (FL) and neural network (NN) algorithms to forecast software reliability. These techniques include neural networks, fuzzy neural networks, and neural-fuzzy networks [
21]. The various taxonomies of usability and the design hierarchical usability of software models were described by Yoosef B. Abushark et al. This study uses the fuzzy AHP-TOPSIS model, a multiple-criteria decision-making (MCDM) model, to assess usability. This MCDM model is simple to integrate into the current software engineering reliability evaluation. The six potential choices are assessed using the five key usability criteria [
22].
The contribution of this article is to present a method for identifying appropriate payment obligations to each customer sector for the incurred investment costs of SMG system reliability improvement. To the author’s knowledge, no prior research has attempted to address this subject or offer a solution to this research problem.
The rest of the paper is structured as follows. The problem formulation is defined in
Section 2. The proposed methodology is described in
Section 3. The reliability evaluation approach is explained in
Section 4. The case study used in this research work is described in
Section 5. The results of the simulations are further described in
Section 6. A conclusion is provided in
Section 7.
3. Proposed Methodology
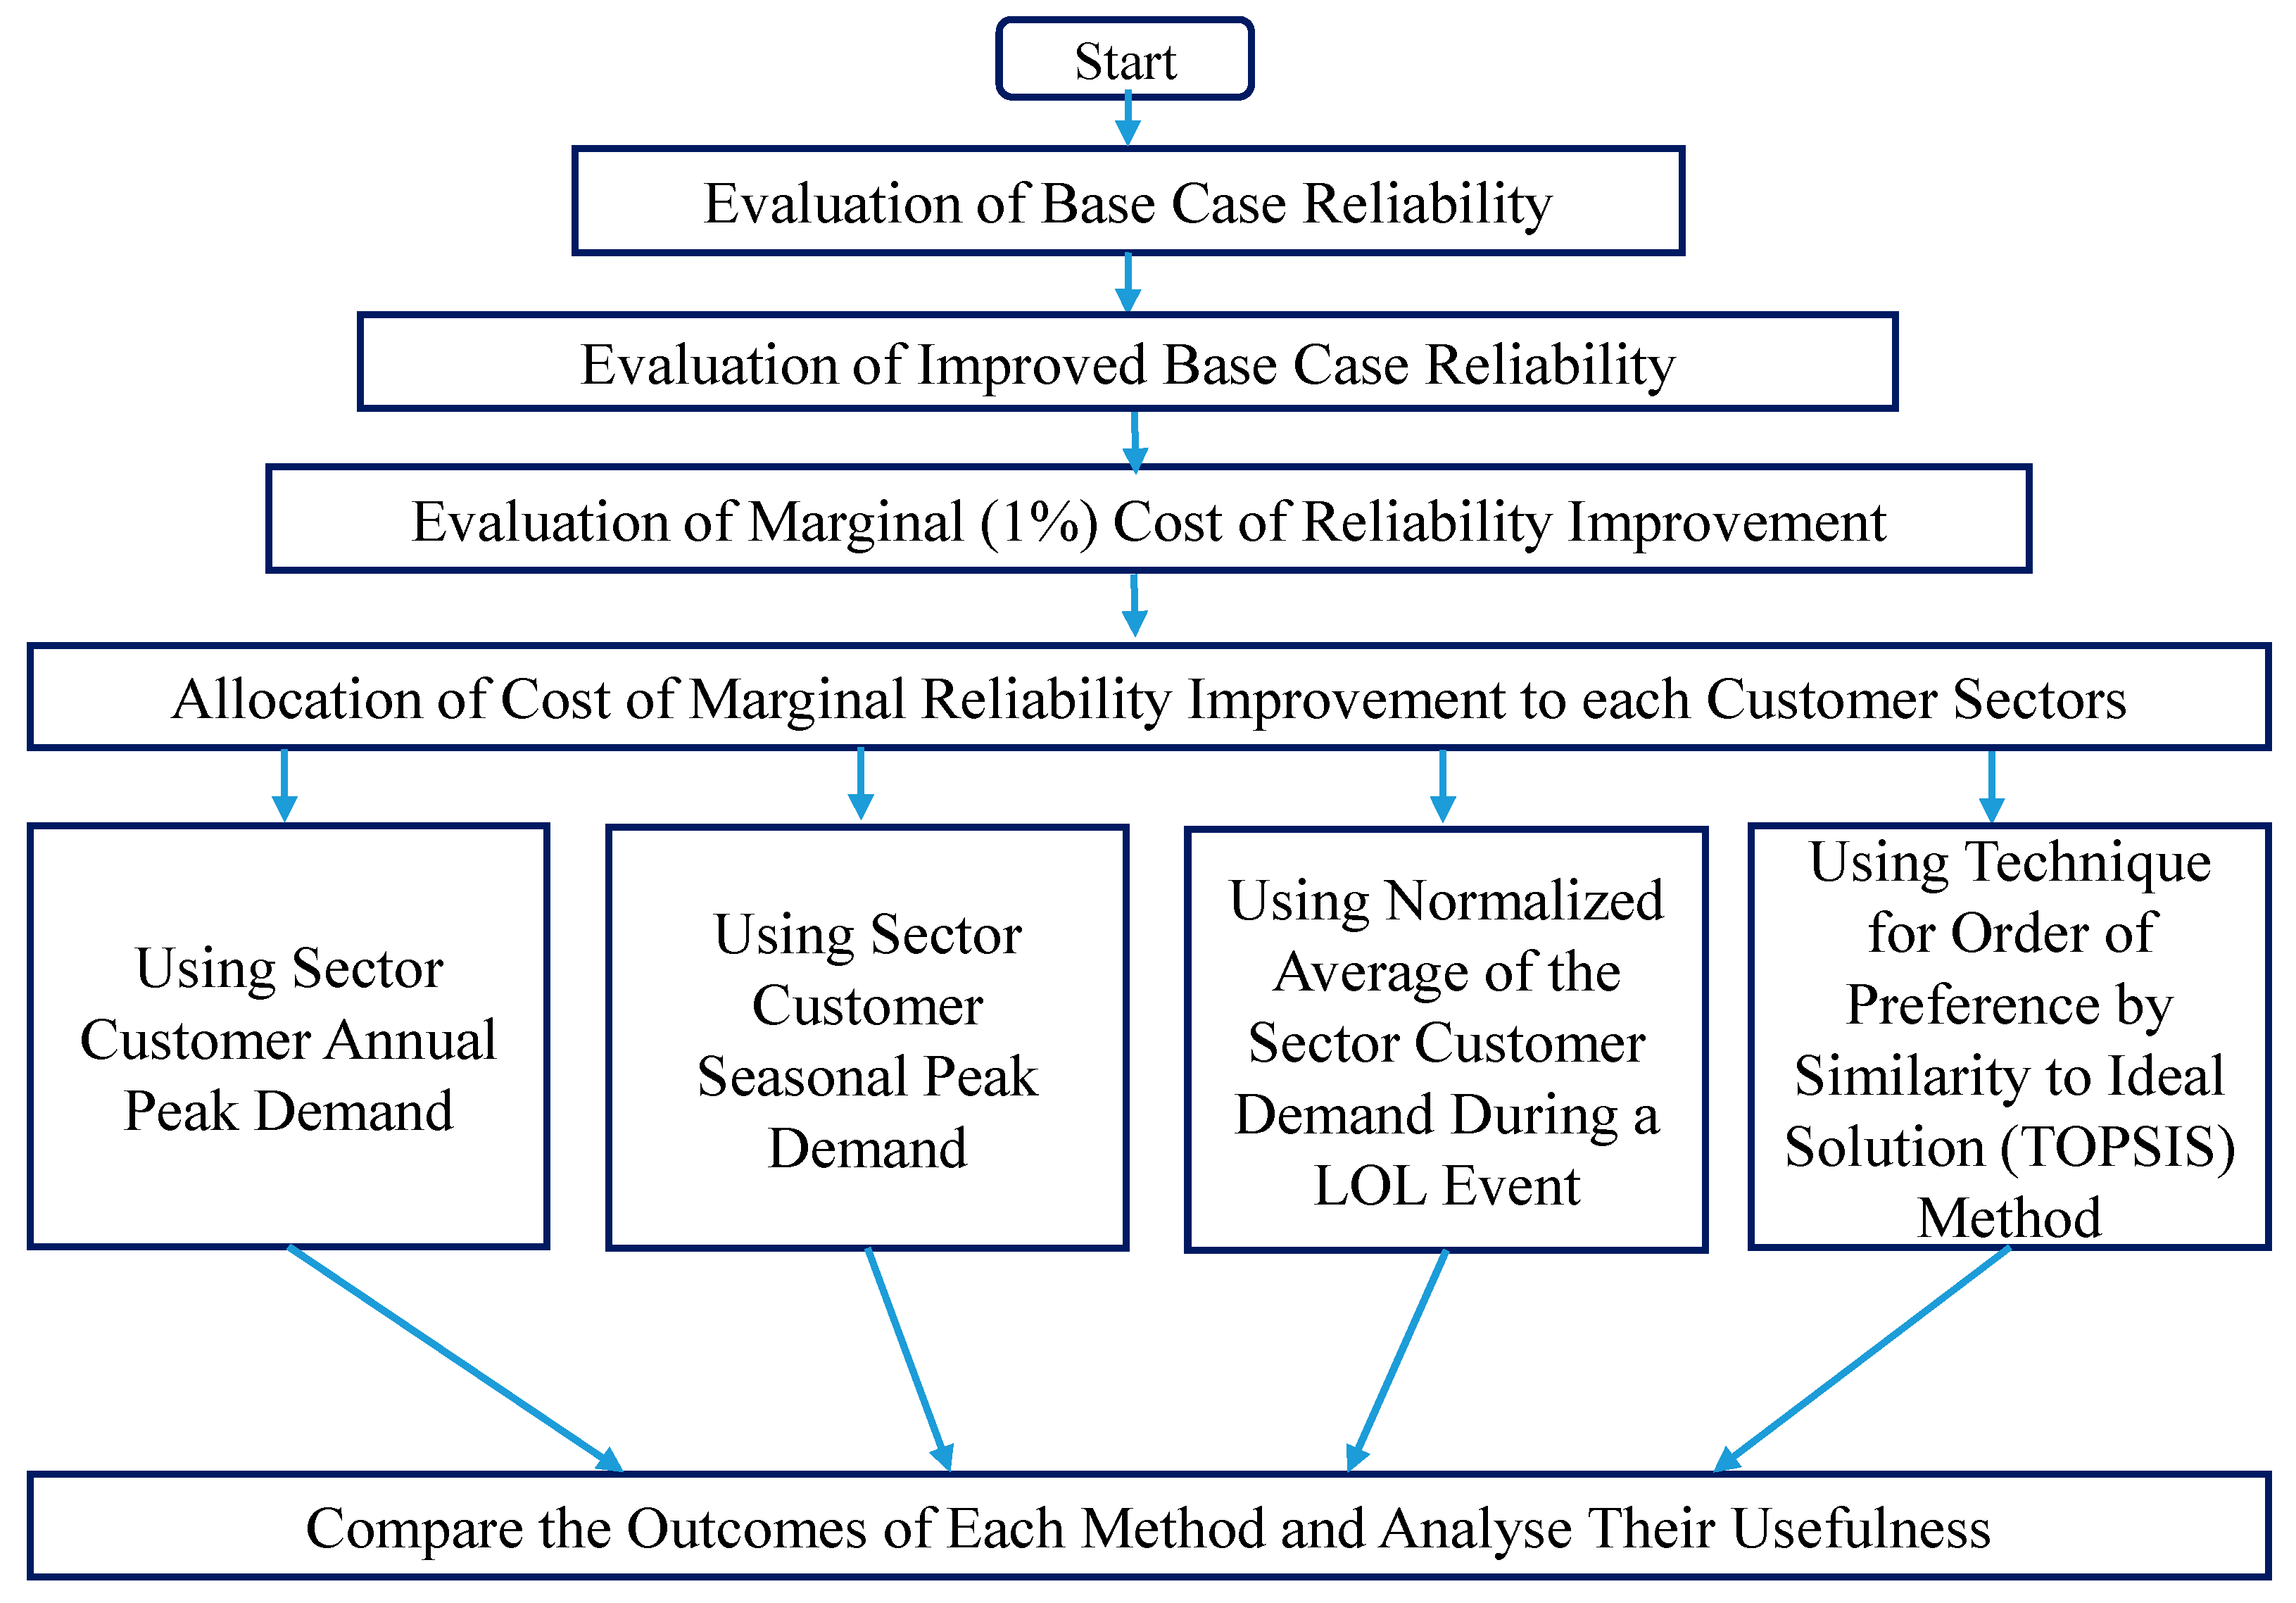
In this study, four approaches to the reliability cost allocation problem are discussed and examined, as shown in
Figure 1. Nine different normalised hourly load profiles of consumer industries, including commercial offices, communications and transportation, education, government, health, hotel and catering, retail, sports and leisure, and warehousing, are taken into consideration in this study. The hourly demand data is obtained from the DeMontfort University database, London [
23] and the hourly power generation is modeled using weather data taken from the Renewable.Ninja webpage [
24]. There are five distinct seasons that are taken into consideration: spring, summer, scorching summer, autumn, and winter. The reliability improvement (cost allocation is carried out in four distinct approaches, such as using sector customer annual peak demand, sector customer seasonal peak demand, normalized average of the sector customer demand during a loss of load (LOL) event and using the TOPSIS method [
25].
The SMG system’s reliability is influenced by the following factors: maximum capacity of demand response (DR) initiatives; installed capacity of renewable energy resources such as solar PV and wind turbines; installed capacity of Battery Energy Storage System (BESS); failure rate of renewable energy equipment such as solar panels and wind turbines; failure rate of batteries; and failure rate of distribution network components. To assess the cost of reliability of an SMG system, the costs related to these factors must be modeled. Because of the extensive and in-depth nature of this research, the measurement of reliability in microgrids rich in renewable resources is presented in [
26] and is not repeated in this work.
Figure 1 outlines the problem Statement of this research study. The first three steps, Evaluation of Base Case Reliability, Evaluation of Improved Base Case Reliability, and Evaluation of Marginal Cost of Reliability, were performed in a previous research study [
27,
28], and they are not reproduced here due to the length of the publication. The objective of this research is to allocate the additional investment cost required to achieve marginal improvements in system reliability across all customer sectors fairly and systematically.
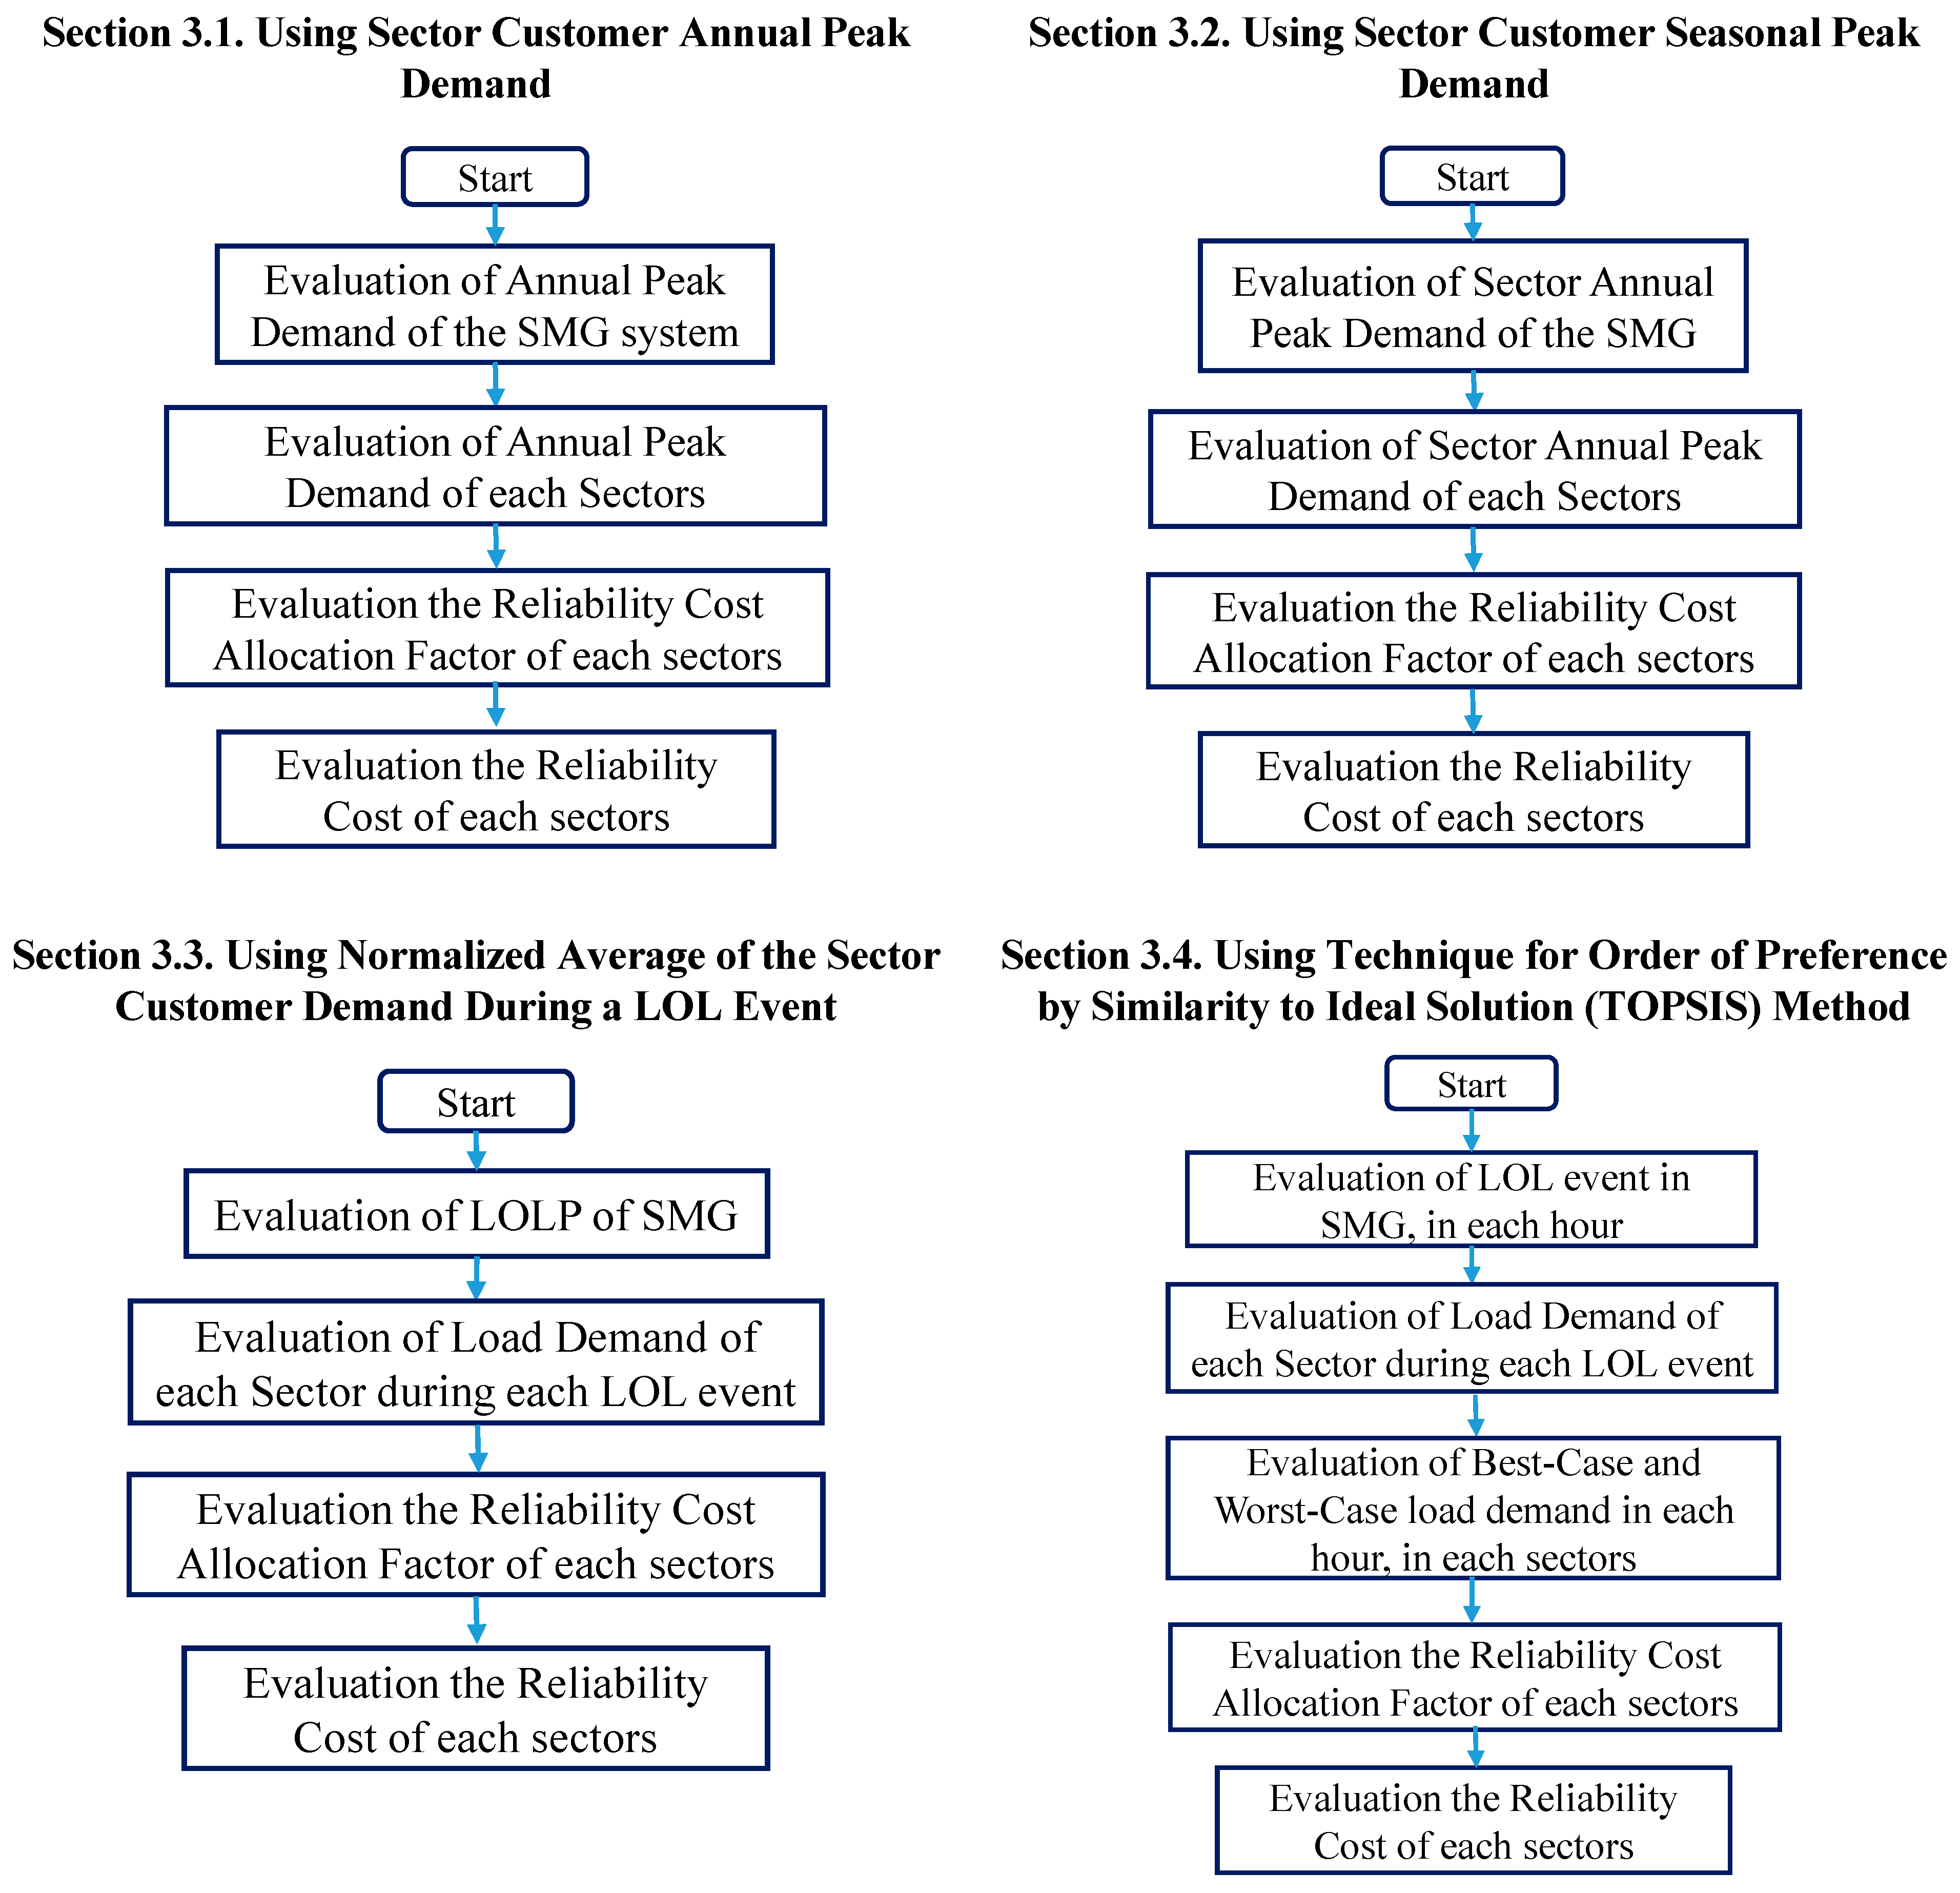
Figure 2 outlines each of the proposed approaches for allocating the additional investment cost required to achieve marginal improvements in system reliability across all customer sectors. These approaches are explained in detail in the following section.
3.1. Using Sector Customer Annual Peak Demand
In creating mathematical models to address problems with the electricity system, many academics consider the annual peak demand to be crucial.
where
is the total cost of reliability improvement (CRI) that should be allocated to the
ith customer sector per year.
is the fraction of CRI that should be allocated to
ith customer sector per year. Equation (1) represents the total value of CRI that should be allocated to the
ith customer, which is equal to the fraction of CRI should be allocated to
ith customer multiplied by the CRI.
where
is the annual peak demand of the
ith customer sector. Equation (2) depicts that the fraction of CRI allocation to the
ith customer is equal to the annual peak demand of
ith customer divided by the sum of the annual peak demand of all nine customer sectors.
Figure 2 presents four key components of the proposed methodology; detail of these four methodologies is outlined as follows:
Section 3.1 introduces the reliability cost evaluation approach based on Sector Customer Annual Peak Demand.
Section 3.2 refines this analysis by employing Sector Customer Seasonal Peak Demand, which captures variability in customer demand across different seasons, thereby providing a more context-sensitive reliability cost assessment.
Section 3.3 further advances the methodology by using the Normalized Average Demand of Sector Customers During a Loss of Load (LOL) Event, allowing for a dynamic and event-specific evaluation of reliability cost based on actual demand levels during system stress.
Section 3.4 introduces the Technique for Order Preference by Similarity to Ideal Solution (TOPSIS), a multi-criteria decision-making method used to prioritize or rank different scenarios or investment alternatives based on the reliability cost outcomes derived from the previous sections.
These four components are interconnected as sequential steps in the methodology. Each subsequent approach builds on the limitations of the previous one, aiming to improve the accuracy and decision-making capability of reliability cost evaluation. The final integration of the TOPSIS method ensures that the analysis not only quantifies cost impacts but also supports informed and objective decision-making based on multiple reliability performance indicators.
3.2. Using Sector Customer Seasonal Peak Demand
In this approach, Using the seasonal peak demand for every customer sector, the proportion of the cost allocation is estimated for each season using this method, which divides the sector CRI allocation problem into five seasons. Equation (3) explains that the total CRI allocation from the
ith customer in the
jth seasons is equal to the CRI allocation factor of the
ith customer sector in the
jth season multiplied by the CRI and multiplied by the seasonal CRI allocation factor of the
jth season.
where CRI is the cost of reliability improvement;
is the total value of CRI that needs to be allocated to the
ith customer sector for the
jth season;
is the fraction of CRI that needs to be allocated to the
ith customer sector for the
jth season;
is the seasonal cost allocation factor for the
jth season. Equation (4) illustrates that the fraction of the total CRI that needs to be allocated to the
ith customer sector for the
jth season is equal to the peak demand of the customer sector for the
jth season divided by the sum of the peak demand of all customer sectors in the
jth season.
Equation (5) explains how the seasonal cost allocation factor is calculated.
3.3. Using the Normalized Average of the Sector Customer Demand During a LOL Event
Each LOL event is evaluated using non-sequential MCS, and the associated sector demand from customers is identified. As part of this investigation, 1000 MCSs are performed. This approach gives a detailed evaluation by examining the customer demand sector during a LOL event. As a result, this strategy outperforms the previous ones. The essential notion behind this technique is that if a customer sector uses the most energy during the LOL event (failure event), it should pay a greater share of the CRI than other customer sectors.
Equation (6) illustrates that the CRI allocation factor of the
ith sector is equal to the sum of the
ith sector demand during the
rth loss of load event (adding sector demand during each LOL events), divided by the sum of all the sector demands (nine sectors) corresponds to all
n number of LOL events.
where
t represents the simulation hours (ranging from 0 to 219,000),
n represents the total number of LOL events, and
r represents a specific LOL event (ranging from 0 to
n). The hourly power generation should be modeled with the uncertainty of the resources and equipment to identify LOL events.
3.4. Using Technique for Order Performance by Similarity to Ideal Solution (TOPSIS) Method
The TOPSIS approach is commonly used for rating choices. The procedure establishes the best and worst ideal values. It is based on the notion that the negative ideal alternative has the lowest values for all criteria, whereas the ideal alternative has the highest values for all criteria [
16]. When using the multi-criteria decision-making (MCDM) procedure, TOPSIS is frequently used. This study uses the TOPSIS technique but in a distinctive way. In this study, TOPSIS assists in determining which customer sectors should have the lowest share of the cost of reliability and which should bear the highest share. Further, the objective of this study is not to identify the most important variable influencing SMG reliability. This study’s objective is to identify which customer sector’s electricity consumption patterns have the biggest effects on the SMG system’s reliability. In general, the most important variables that affect reliability are the failure rates of individual components of equipment, solar radiation patterns, wind speeds, battery energy storage failure rates, and the failure rates of demand response programs. The objective of this paper is to establish which customer sector’s load demand pattern has the greatest adverse effects on the SMG system’s reliability, not to rank the factors that have the greatest reliability-impacting effects.
In this research problem, certain customer sectors consume more electricity than others during an LOL event. As a result, it makes sense to penalize them by giving them a bigger share of the CRI. Following the identification of LOL events using hourly power generation and aggregated demand, this approach assigns best-case and worst-case demands from the associated individual sector hourly demands. If a sector used an average of the total power generated during an LOL event, that would be a best-case scenario, and it is thus referred to as best-case demand. Addressing a worst-case demand is tough since the worst-case individual consumer demand is unknown. As a result, three worst-case scenarios are considered: a sector customer demand equivalent to one-fourth of total power generation (25% of ), half of the total power generation (50% of ), and three-quarters of the total power generation (75% of ). The philosophy is that if a single sector consumes 25% or 50% or 75% of the total generated power at rth hour, all other eight sectors must share the remaining 75%, 50% or 25% power, respectively, which is most probably the root cause of the LOL event. With this concept, the three worst-case values are evaluated separately using TOPSIS theory, and the normalized average is taken and considered as a final solution. The following steps will be performed in the TOPSIS analysis.
3.4.1. Step 1: Identifying Best and Worst Values
where
is the total load demand when the
rth LOL event occurs at the
tth hour;
represents the best value, and
i denotes the number of customer sectors. In other words,
V+ represents the average demand across all customer sectors and serves as a reference point in the cost allocation process. In the context of reliability improvement cost allocation, if all nine customer sectors consume equal amounts of electricity during a Loss of Load (LOL) event, it is assumed that each sector contributes equally to system stress. Consequently, they would each be allocated an equal share of the reliability improvement cost. This situation is considered the best-case scenario in the TOPSIS-based decision-making framework, as it represents a state of balanced responsibility among sectors and simplifies the cost-sharing model. It serves as the positive ideal solution, against which other, more unequal demand distributions are compared to assess fairness and efficiency in cost allocation.
where
,
,
represents three different worst-case demands assumed in this approach.
3.4.2. Step 2: Identifying the Euclidean Distance from the Positive and Negative Ideal Solutions
where
is the load demand of the
ith customer sector when the
rth LOL event occurs at the
tth hour.
3.4.3. Step 3: Identifying the Relative Closeness Degree
The best alternative is the one that has the maximum closeness degree and has the shortest distance to the ideal solution. These three steps are repeated for the other two worst-case values and .
4. Reliability Evaluation
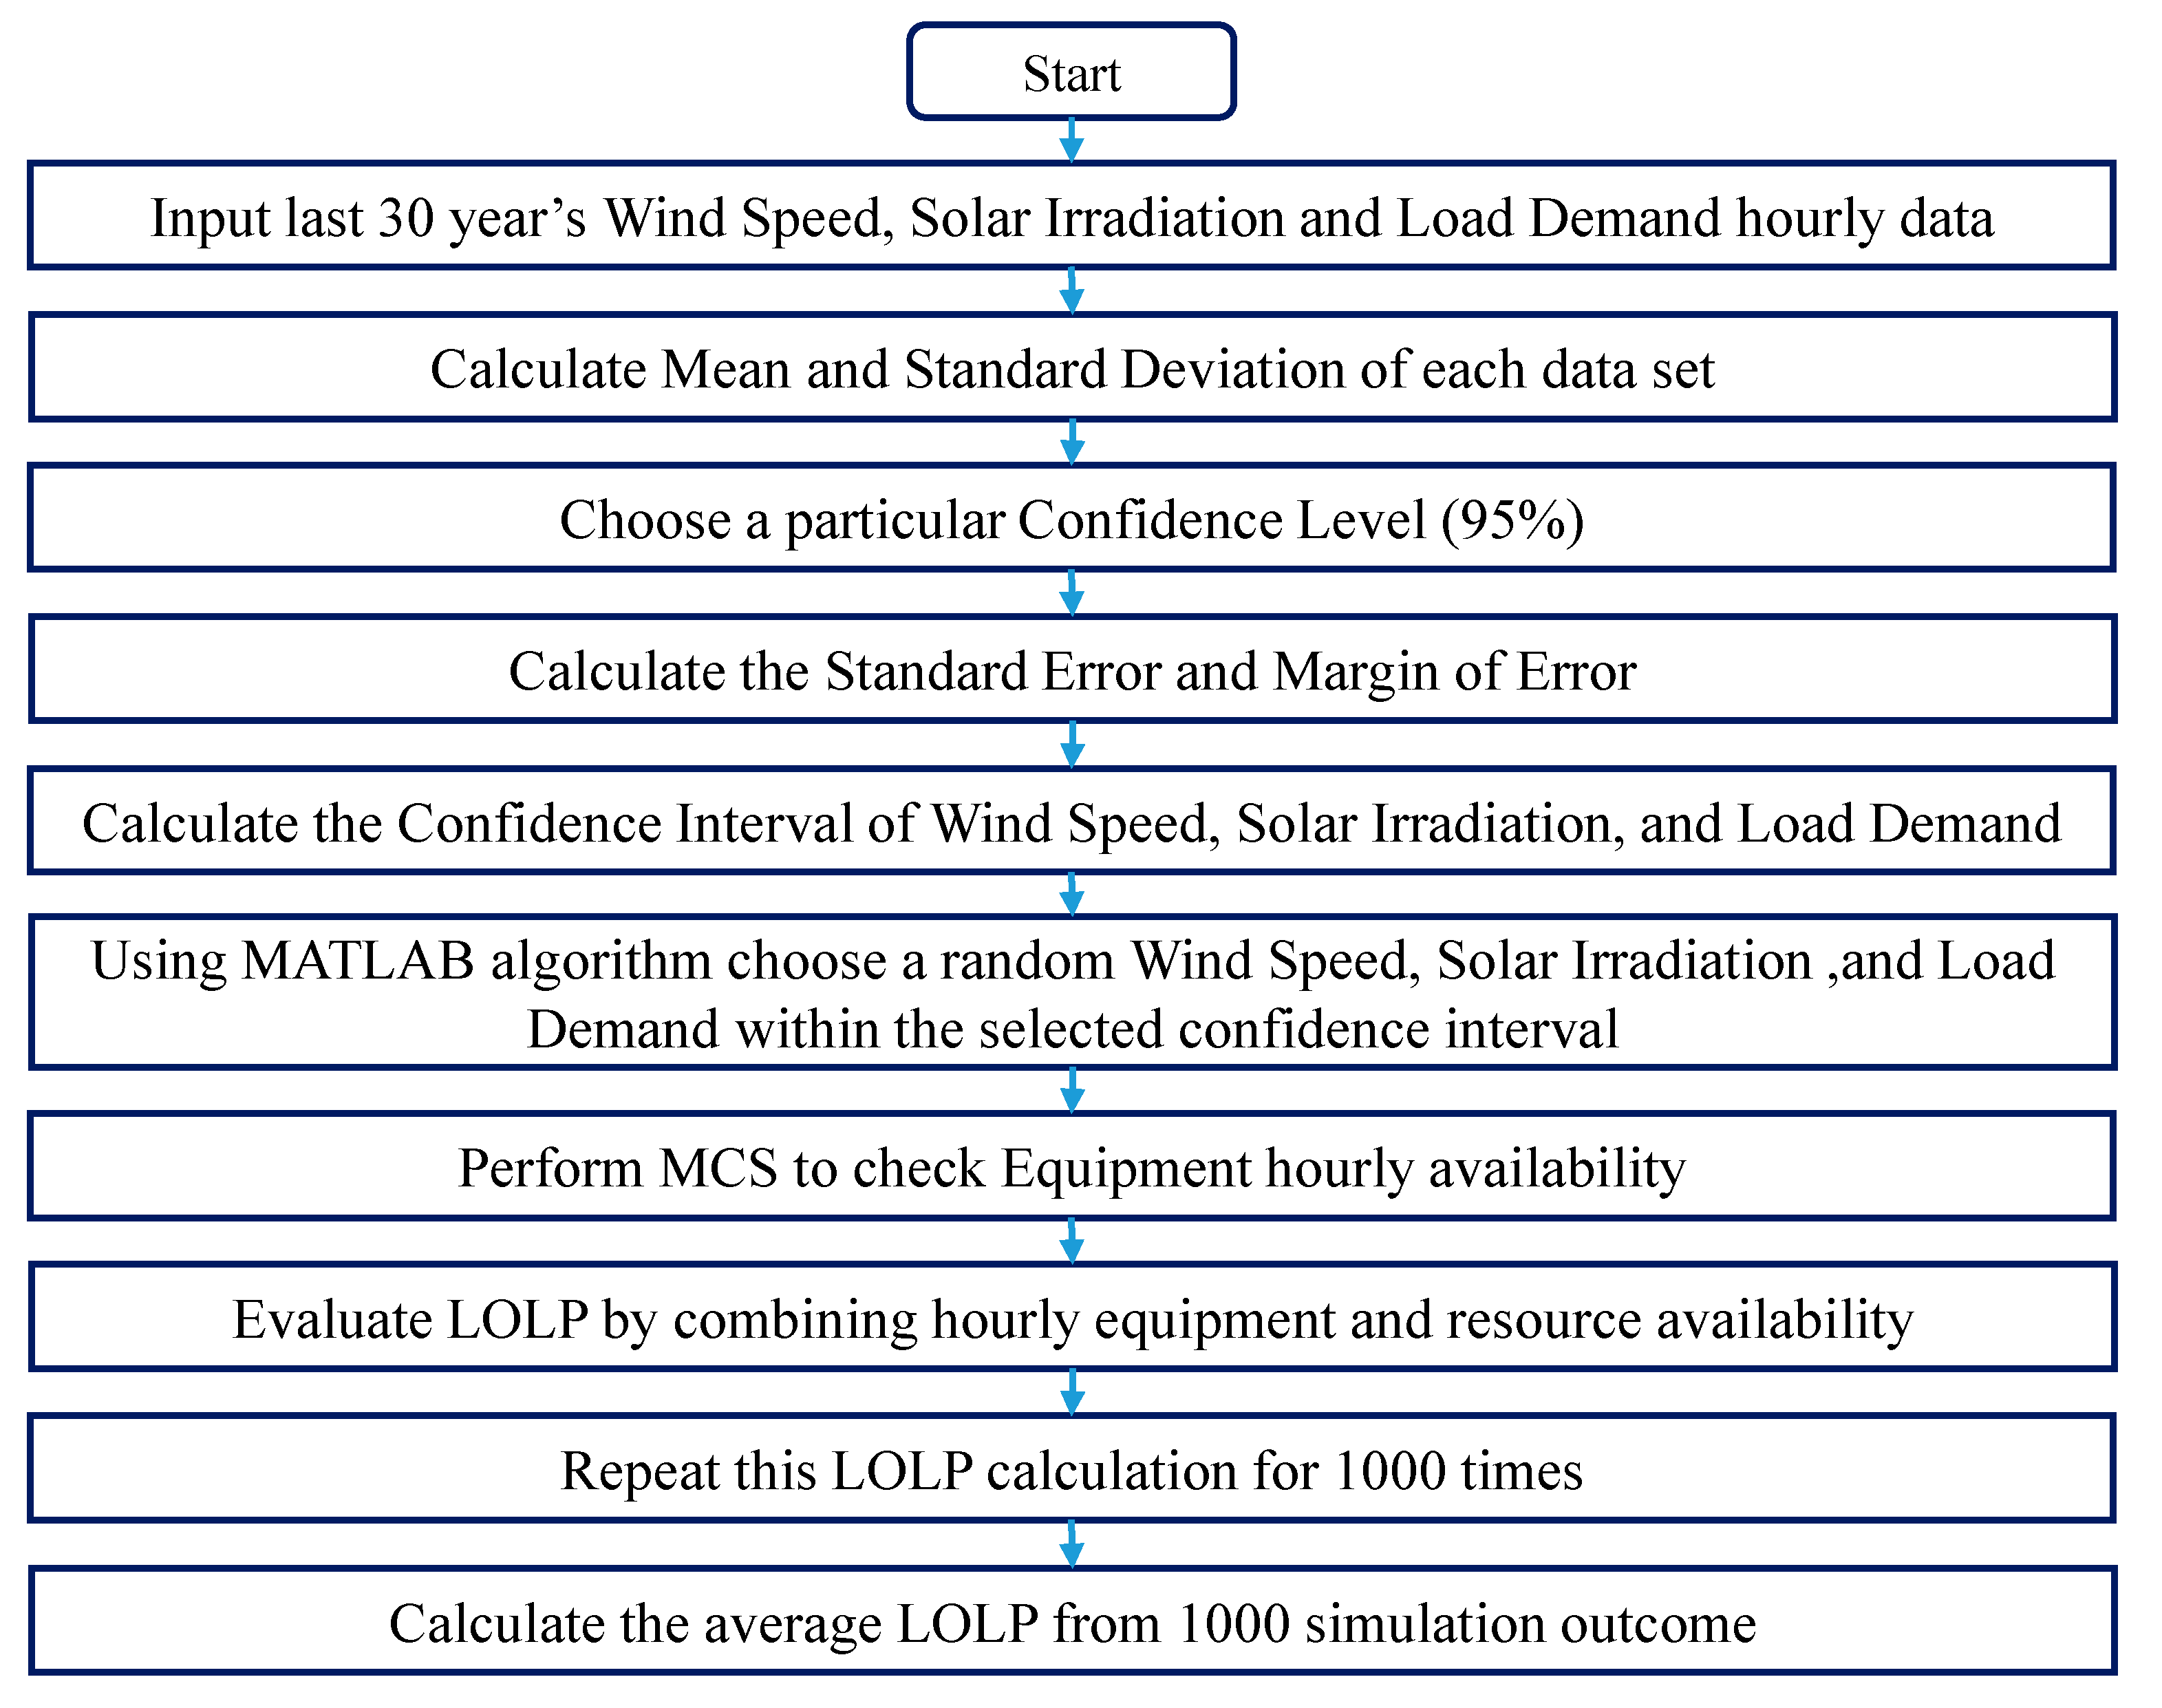
The availability of equipment and the availability of renewable energy sources are the two elements that impact the system’s reliability. The SMG system’s reliability level needs to be evaluated using a comprehensive reliability evaluation approach in order to increase reliability. Using a comprehensive reliability evaluation approach, the availability of generation resources, generating equipment, and distribution components is assessed every hour. A full mathematical model that incorporates resource and equipment availability in each hour has previously been proposed in [
26,
28], and therefore, it is not repeated here. This model uses non-sequential Monte Carlo simulation (MCS) to foresee failure situations. The reliability models for PV, wind turbine (WT), BESS, and MGDN were created using the state duration sampling methodology. The hourly power generation from renewable energy resources is modeled using weather variables including solar irradiation, ambient temperature, and wind speed. The reliability evaluation approach proposed in [
28] is illustrated in
Figure 3, and it is employed in this research work. The number of Monte Carlo Simulation (MCS) iterations significantly affects the accuracy of the results. However, Billinton and Allan [
29], in their seminal work, state that performing 1000 MCS iterations is acceptable for power system reliability analysis, especially in preliminary studies or when computational efficiency is a priority. Therefore, in this research, 1000 MCS iterations have been conducted to reduce computational burden while still maintaining acceptable standards for reliability evaluation.
The majority of published research incorporates weather information from the prior year into account and assumes that the weather pattern will remain the same in subsequent years. Some people use the mean figure that was calculated using data from the prior few years. Neither approach fully addresses the weather parameter’s uncertainty. In this study, the mean and standard deviation of hourly weather data for the previous 30 years are calculated. After calculating the standard error, the margin of error with a 95% confidence level is calculated. The lower and upper limits of weather parameters, such as solar irradiation, ambient temperature, and wind speed, are calculated in the final stage.
where
is the standard error of the mean;
s is the standard deviation,
n is the number of samples, which is thirty because the last 30 years of hourly data are considered.
where
ME is the margin of error of the mean,
is the t-score at the given degree of freedom and the level of significance α level. The level of significance can be calculated for whatever specific confidence level we choose. For instance, if we choose a confidence interval of 95%, then the level of significance becomes 0.05 (equal to (1 − 0.95)). Usually, the confidence interval is taken as 95%, because the 5% risk of not including any data which represents the true population is commonly accepted by researchers.
Using the chosen confidence interval of 95%, the upper and lower bound hourly values of weather parameters such as solar irradiation, temperature, and wind speed are calculated. Then, a MATLAB algorithm, as shown in Equation (16), is written to randomly select a value from the given range specified by upper and lower bounds.
where
r is the value of the variable that is being chosen by MATLAB R2020b,
a is the lower bound,
b is the upper bound,
rand is the MATLAB function for generating a random value between 0 and 1.
5. Evaluation of Marginal Cost of Reliability
In this study, LOLP is used to test the system’s reliability. As a result, the LOLP value influences an investment decision for reliability improvement. The purpose of this optimization task is to lower the total investment cost of the reliability improvement project to increase the reliability by 1% from the base case reliability. The marginal cost of reliability is not assessed in this study. However, for the purposes of comprehending this paper, this section from [
29] is included here.
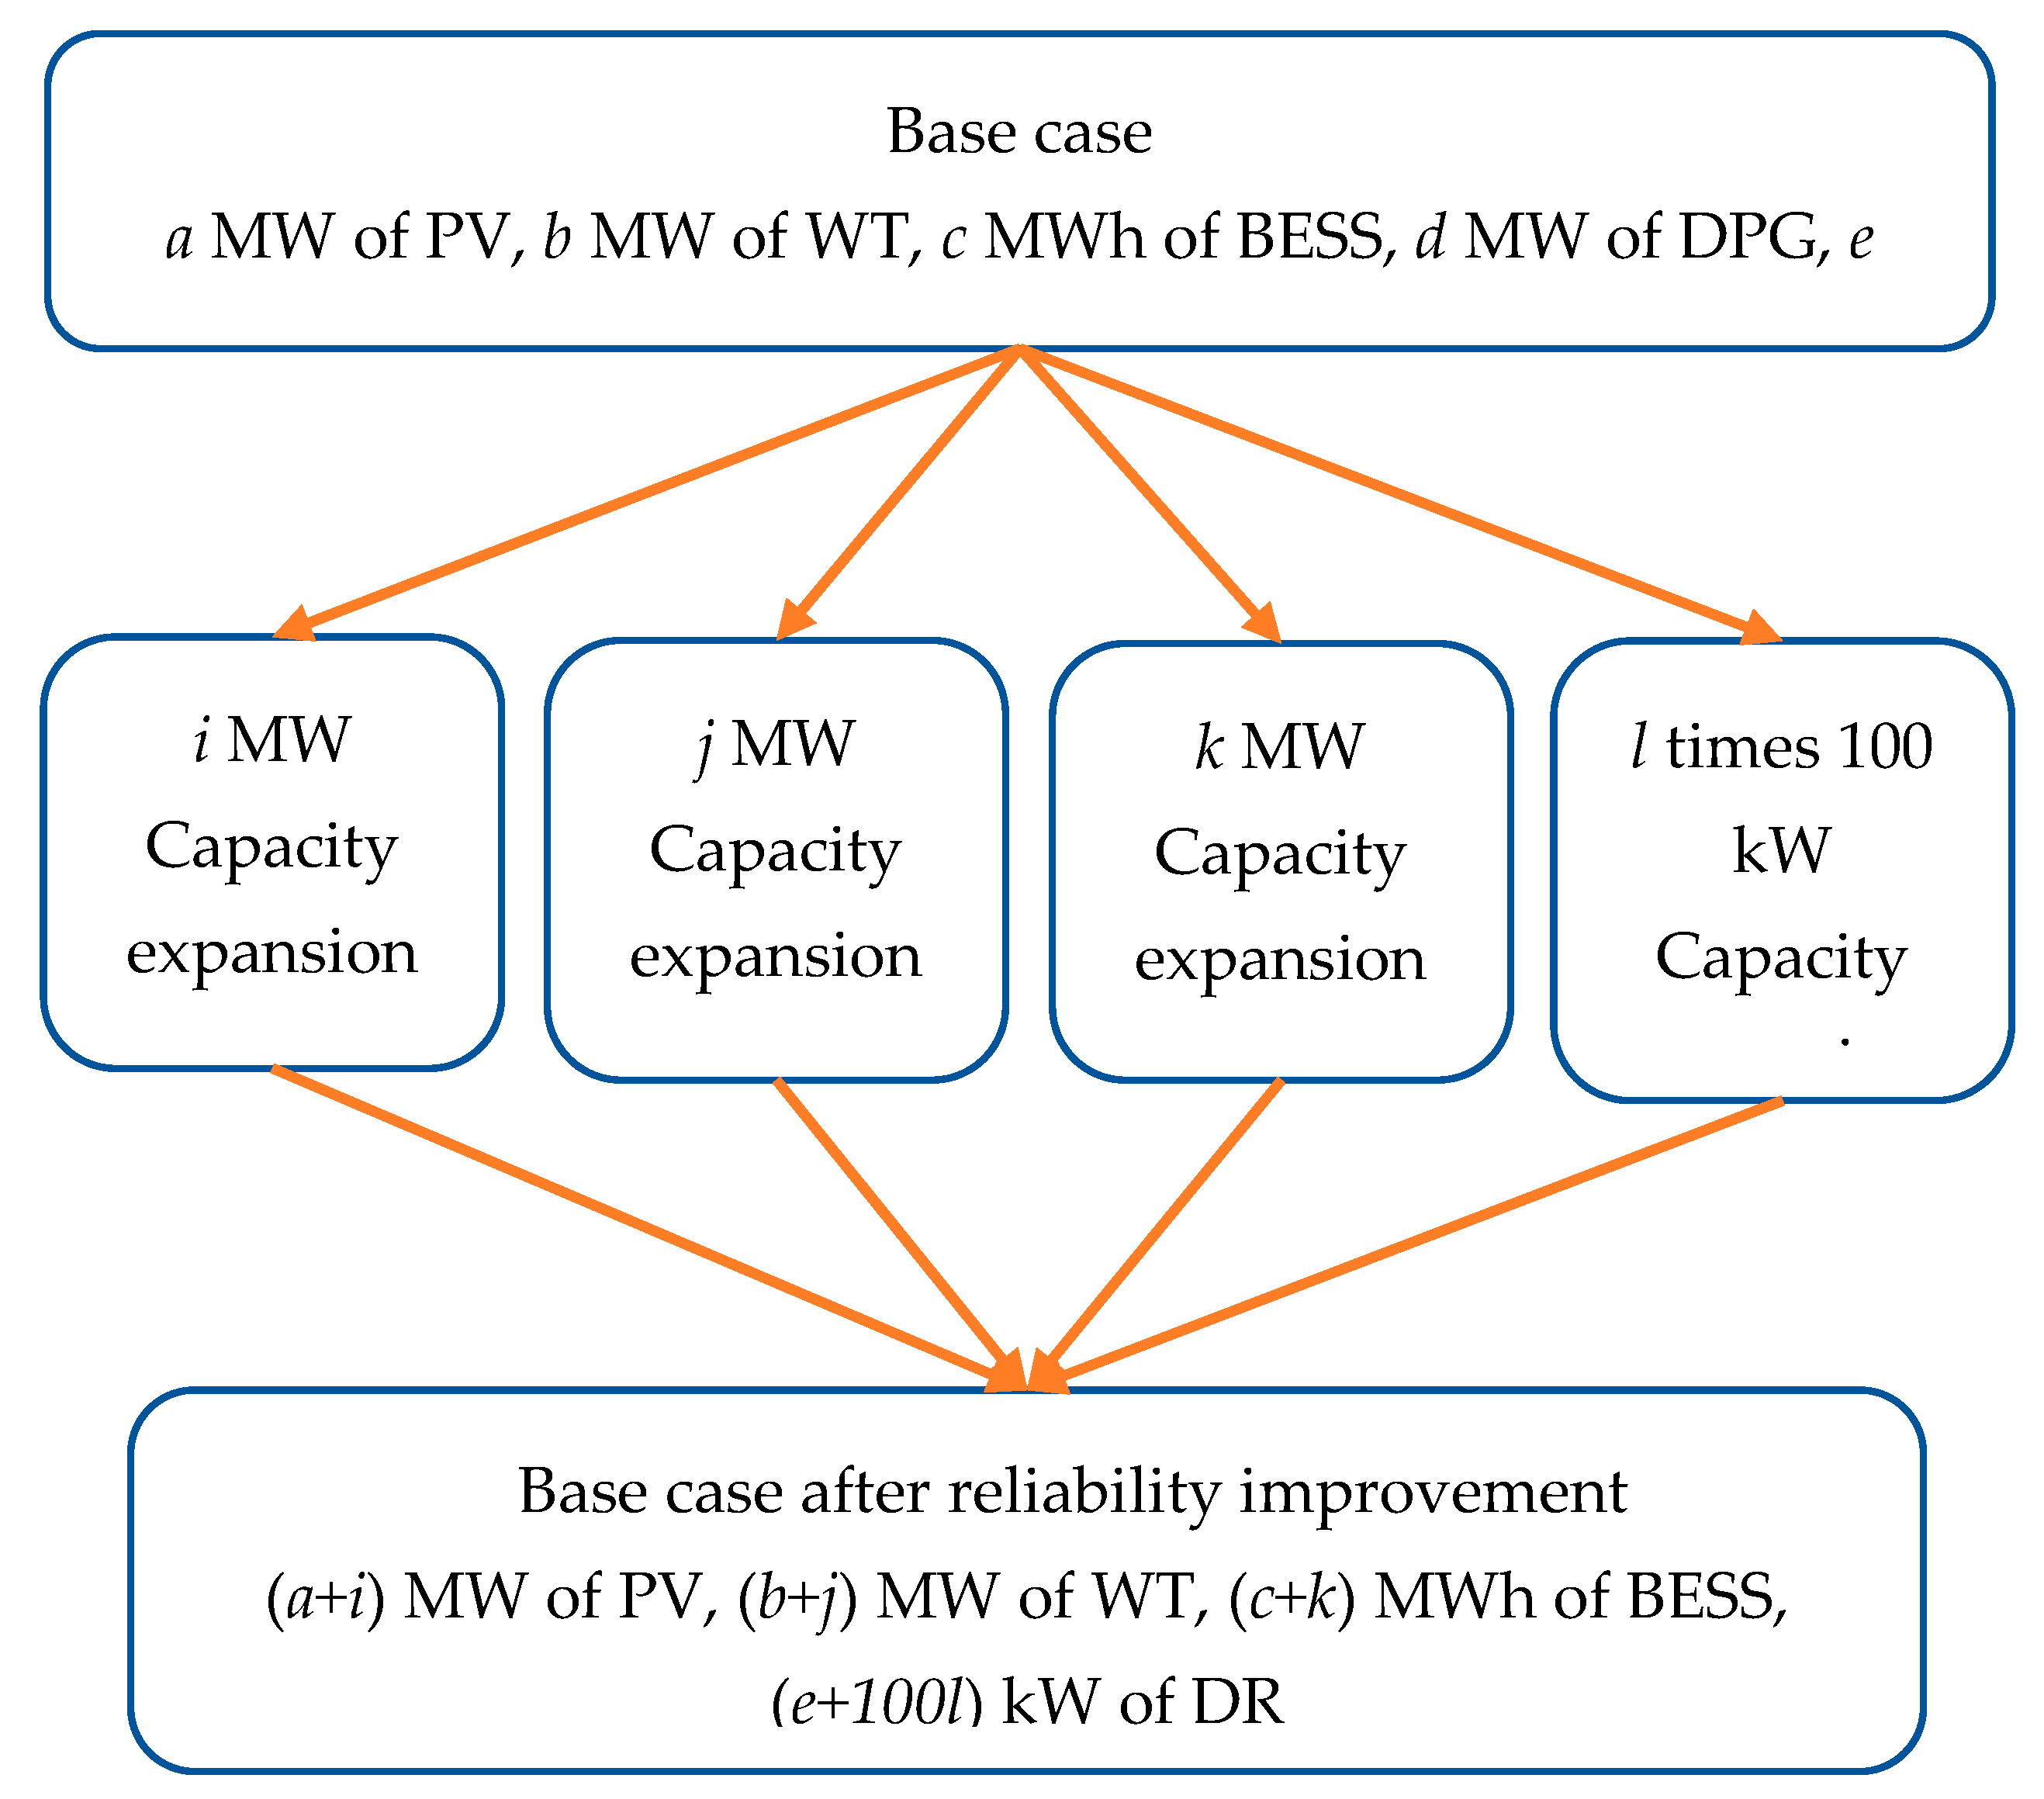
Figure 4 shows how the algorithm evaluates marginal reliability improvement and then calculates the cost of obtaining it. If SMG needs to increase reliability even further, the algorithm can help estimate the cost.
Figure 4 indicates that the base case of the MG system, which includes a MW of PV, b MW of WT, c MWh of BESS, d MW of DPG, and e kW of DR, has a LOLP of Rbase%. The research topic is to determine how much extra energy resources, storage, and DR capacity must be installed to reduce LOLP from the base case (Rbase%) to a given target value while minimizing the total investment cost of reliability improvement (TICRI). A net present value (NPV) calculation is used to determine the overall investment cost. To address this issue, PV capacity increased from a MW to a + 9 MW, WT capacity increased from b MW to b + 9 MW, BESS capacity increased from c MWh to c + 9 MWh, and DR capacity increased from 0 to 900 kW. As a result, each reliability improvement option contains ten decision variables ranging from 0 to 9.
Equation (17) represents the TICRI. Where i, j, k, represents the numerical values of capacity expansion decisions on PV, WT, BESS, and DR. As explained earlier, i, j, k, can take any value from 0 to 9. To illustrate, if i = 3, j = 2, k = 1, = 0 then the decision is to expand PV by 3 MW, WT by 2 MW, BESS by 1 MWh and then, the corresponding IC will be 3 times the cost of 1 MW of PV plus 2 times cost of 1 MW of WT plus the cost of 1 MWh of BESS.
The step sizes presented in
Figure 4, 1 MW increments for photovoltaic (PV) and wind turbine (WT) capacity, 1 MWh for battery energy storage system (BESS) capacity, and 100 kW for demand response (DR) capacity, are not universally defined standards. Rather, they are assumed for the purposes of this research to balance model accuracy with computational efficiency. The choice of a 1 MW increment for PV and WT capacity expansions is based on a practical consideration: smaller increments (e.g., below 1 MW) may not lead to a noticeable improvement in system reliability metrics, yet would significantly increase the number of simulations required. This added computational burden would be disproportionate to the marginal gains in reliability, particularly in a large-scale simulation environment such as Monte Carlo analysis. On the other hand, a 100 kW load reduction through a DR program can have a more direct and substantial impact on reliability, especially during peak demand periods or in constrained network segments. Therefore, a finer resolution (100 kW) is chosen for DR capacity to better capture its reliability benefits without overcomplicating the simulation. In summary, these step sizes are context-specific and were selected to achieve a reasonable trade-off between model granularity and computational feasibility for this study.
6. Case Study
In this study, an SMG with nine different customer sectors is modeled, with an aggregated peak demand of 171.44 kW and a minimum demand of 68.91 kW. The simulation considers the SMG’s life span of 25 years (219,000 h). The base case power generation resources were modeled conceptually by assuming PV and WT installed capacities are equal to the peak demand of SMG, and the DPG and BESS installed capacities are equal to half of the peak demand of the DPG. Therefore, the base case has 171.44 kW of PV, 171.44 kW of WT, 85.72 kW of DPG, and 85.72 kW of BESS. In this base case, the installed capacities are chosen by numerous trial and error approaches to achieve more than 95% of reliability. Keeping the size of renewables equal to peak demand and the size of BESS and DPG at half of peak demand has also been proven to be a reasonable starting point for this research project.
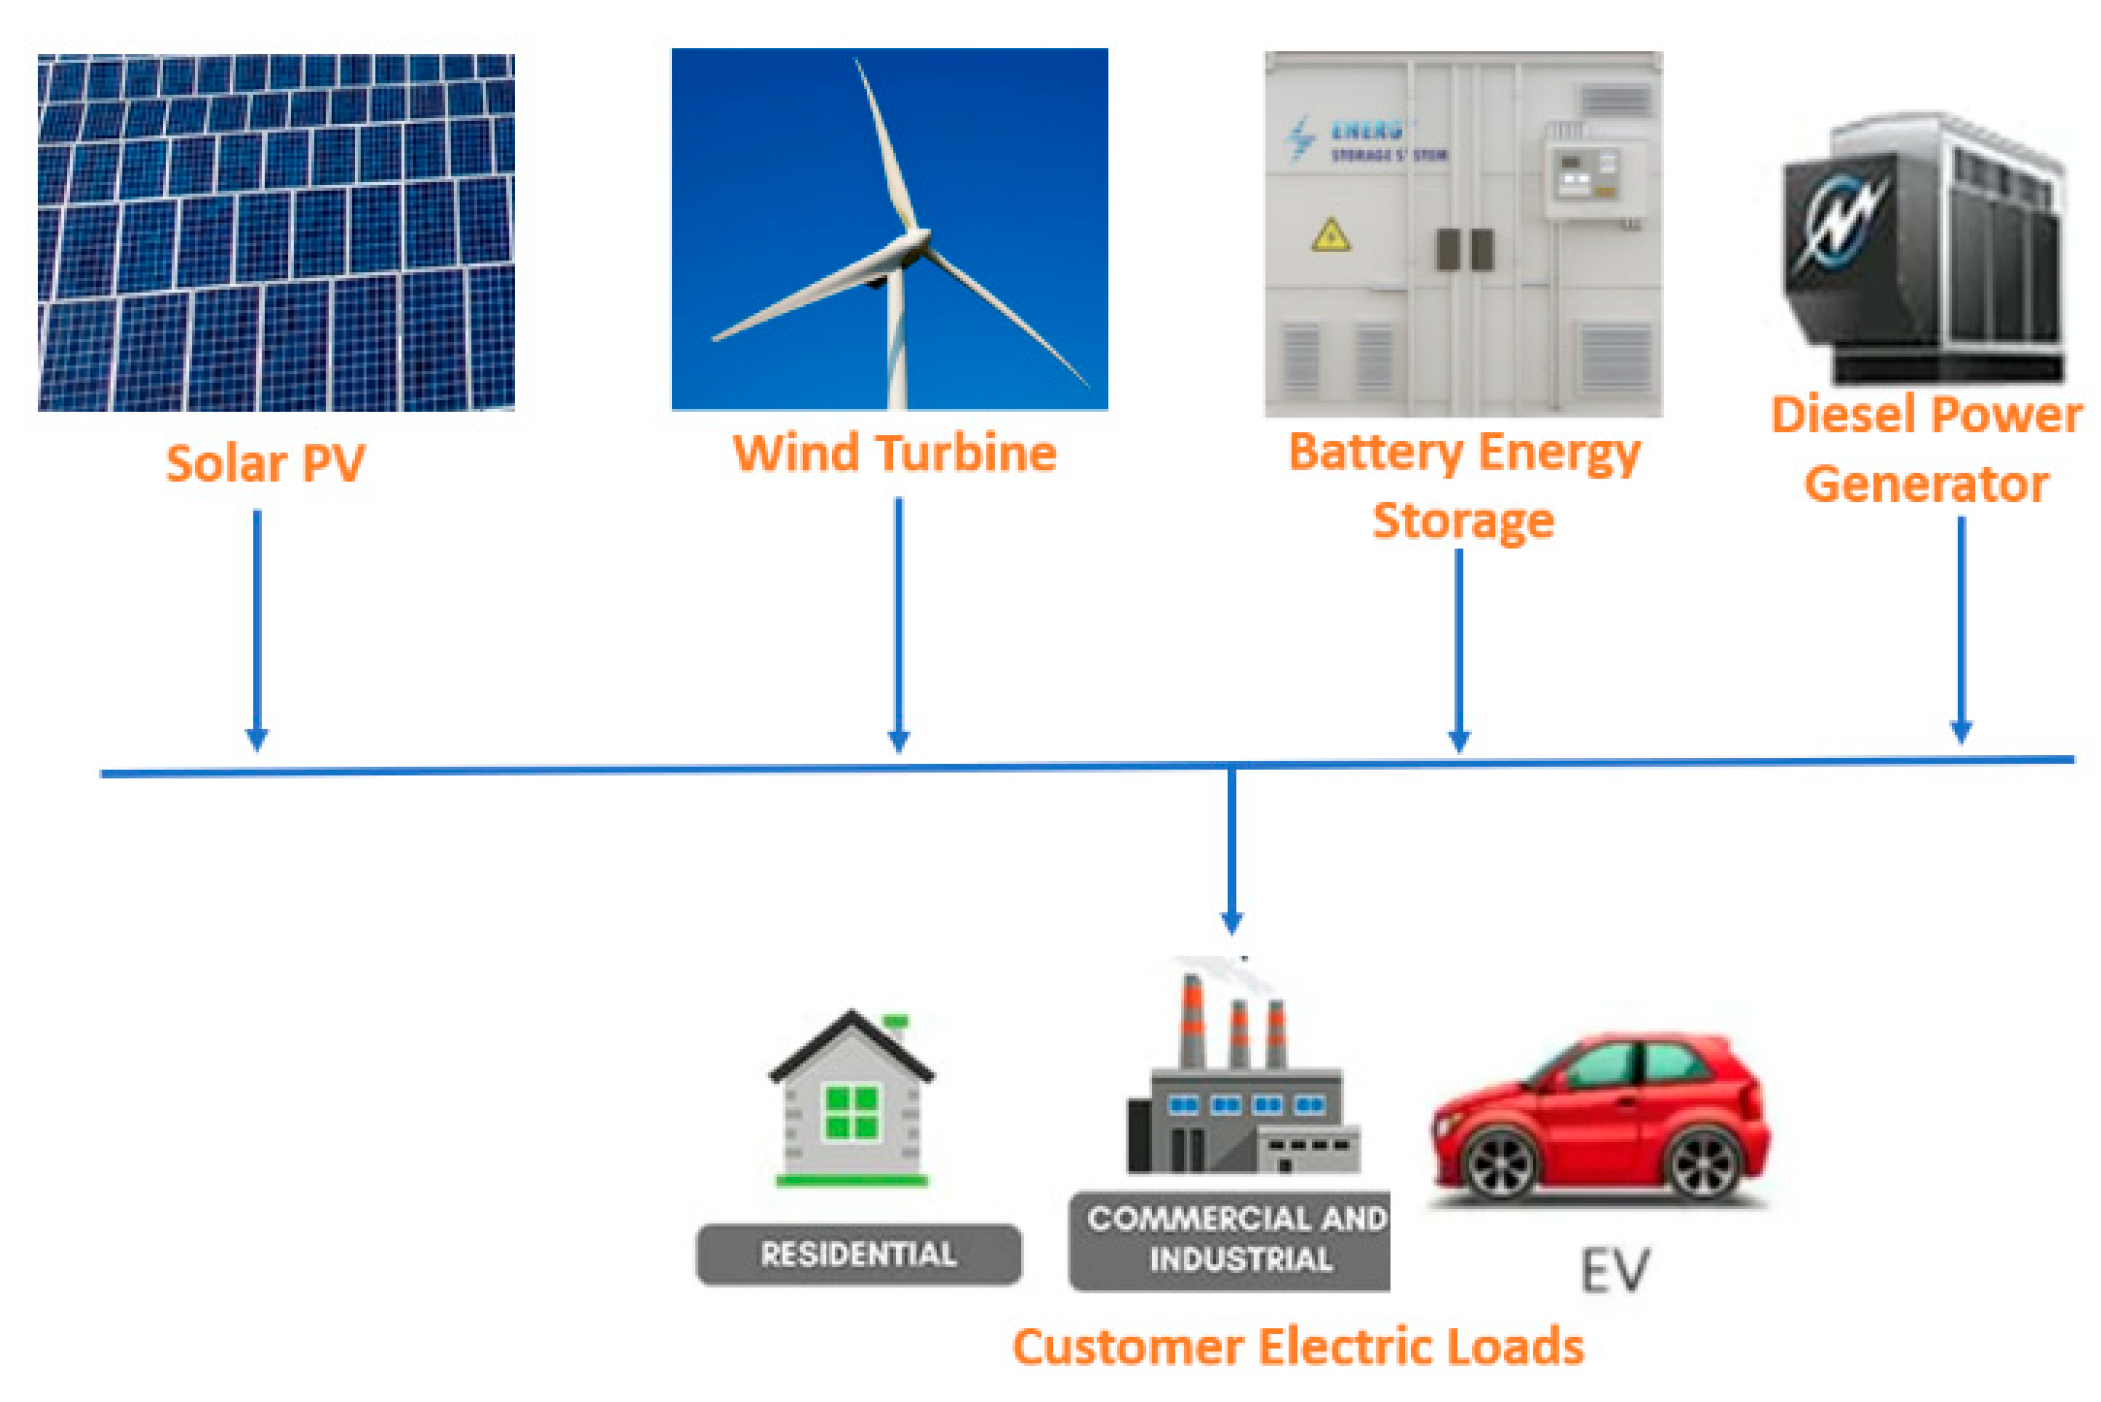
Figure 5 depicts a hypothetical SMG that supplies electricity to multiple customer sectors and includes renewable energy resources such as PV and WT, battery energy storage, and a diesel-powered engine.
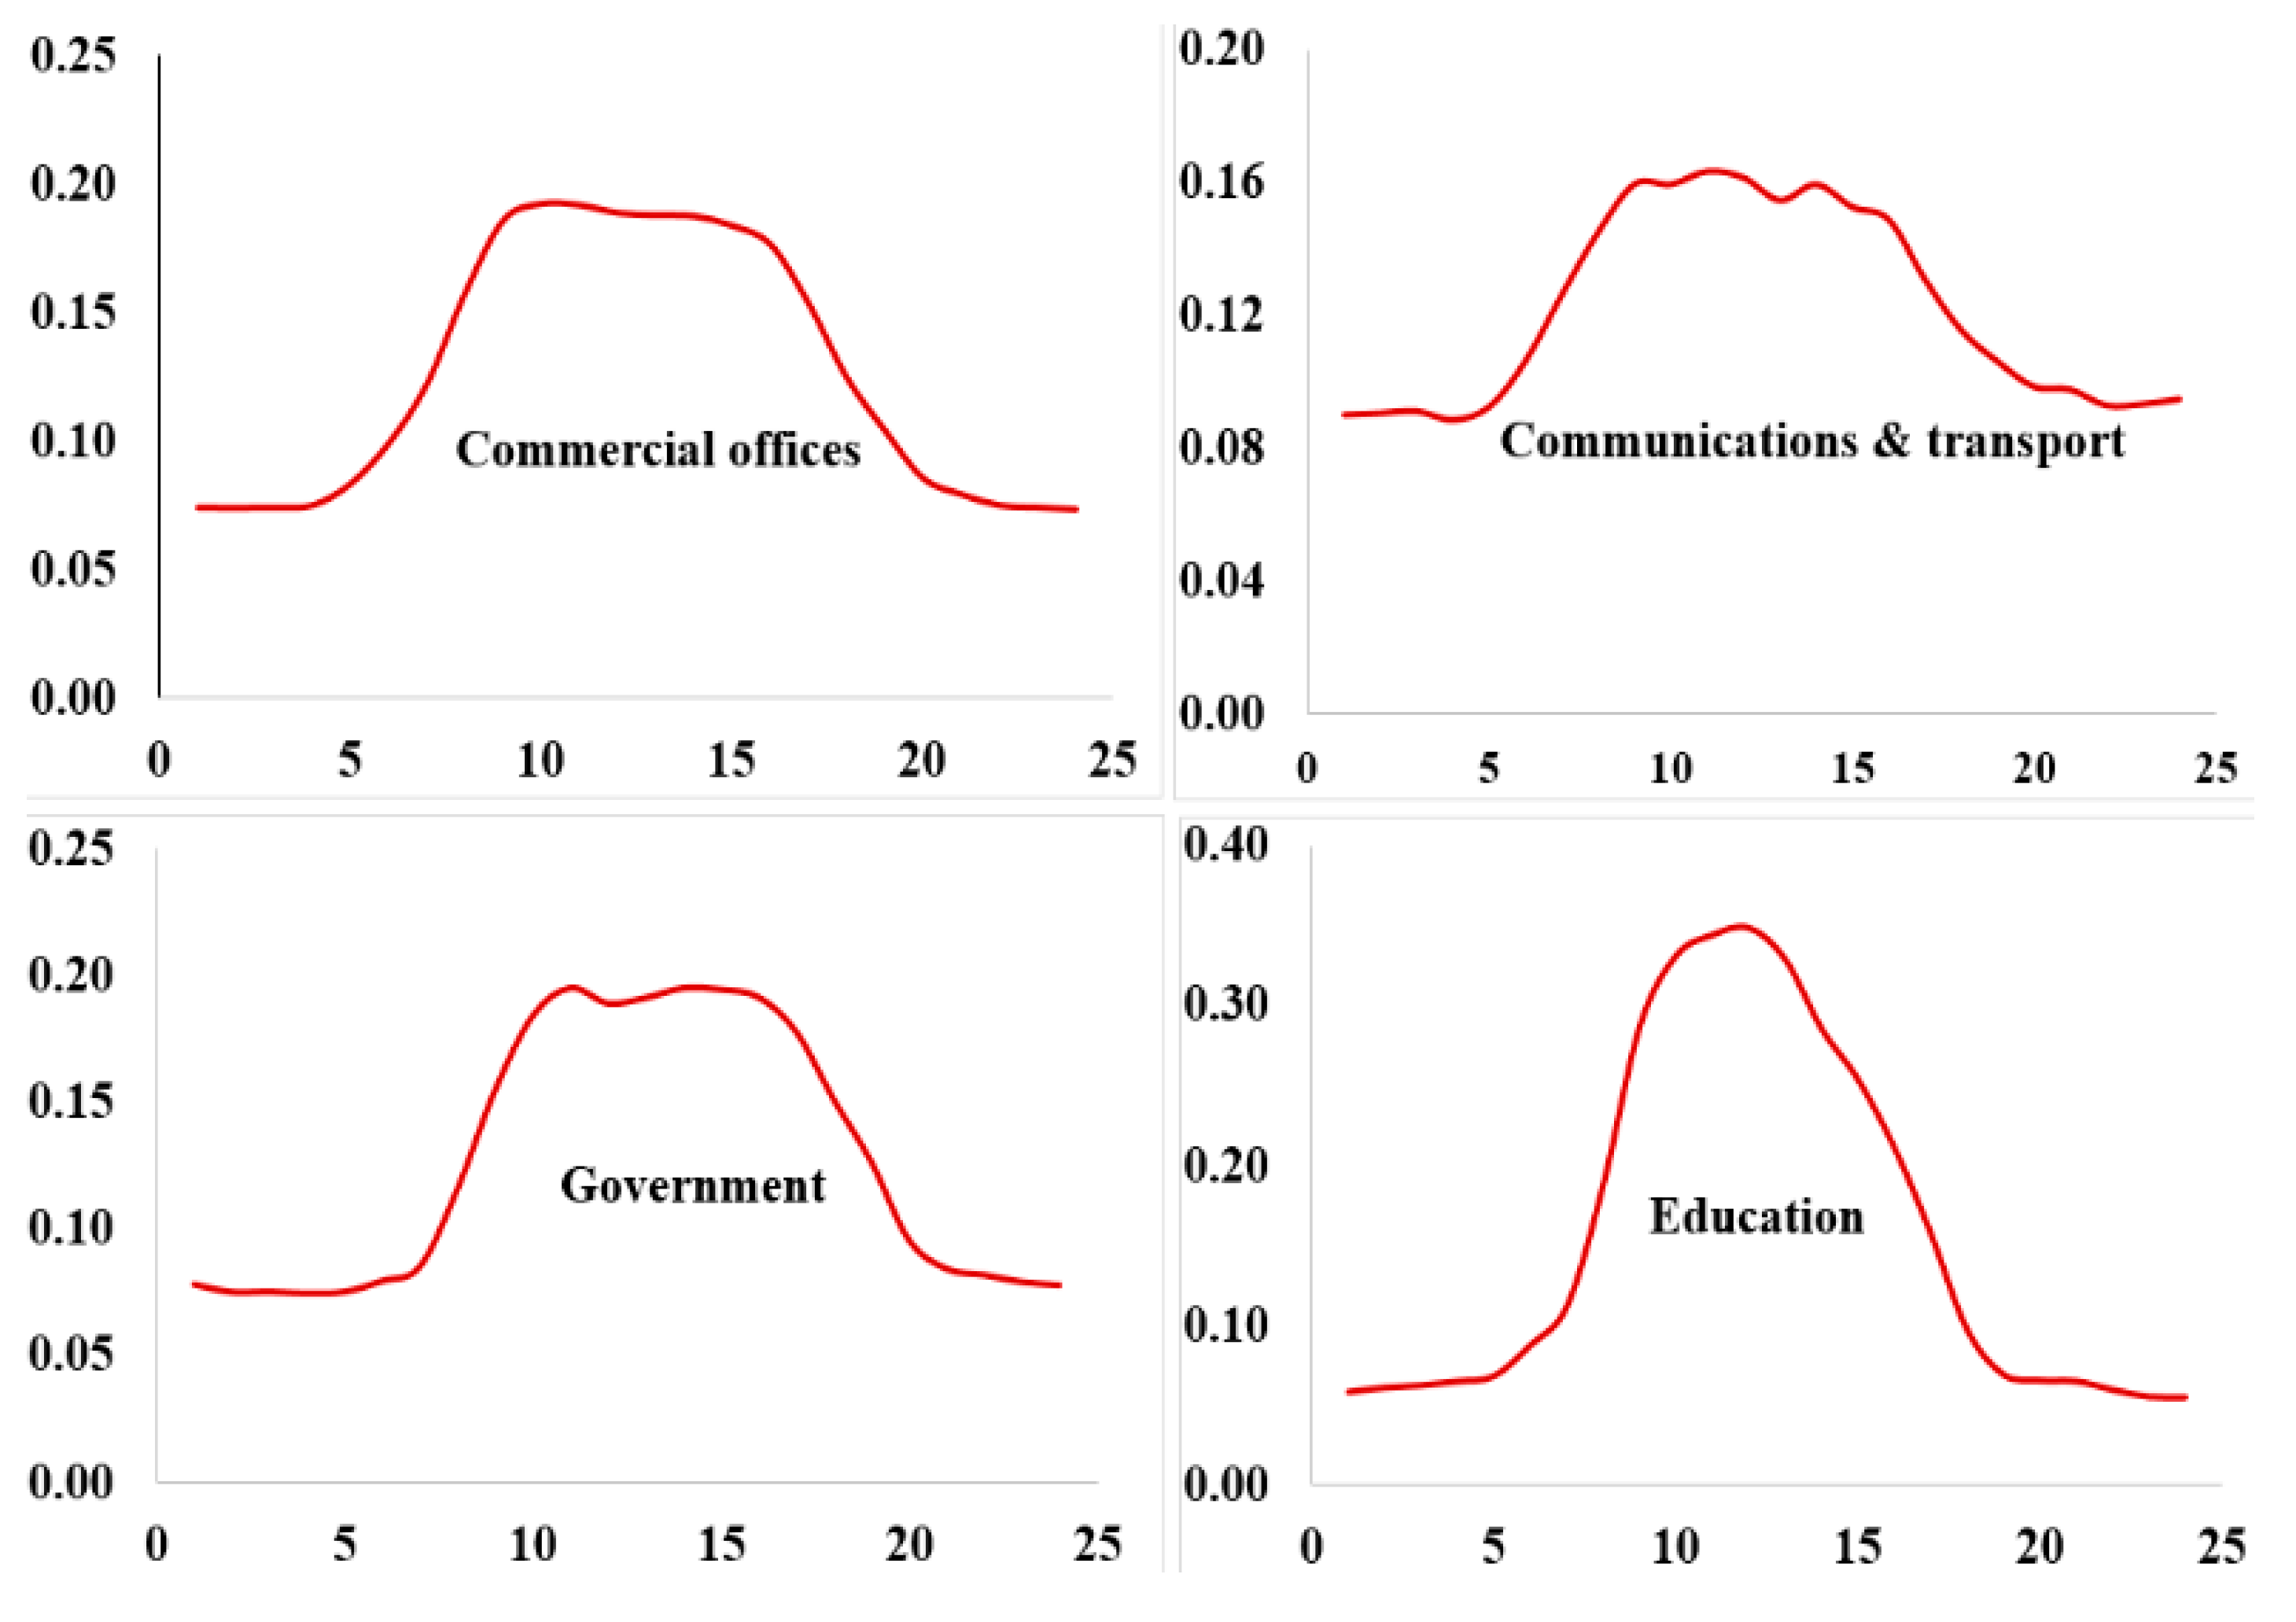
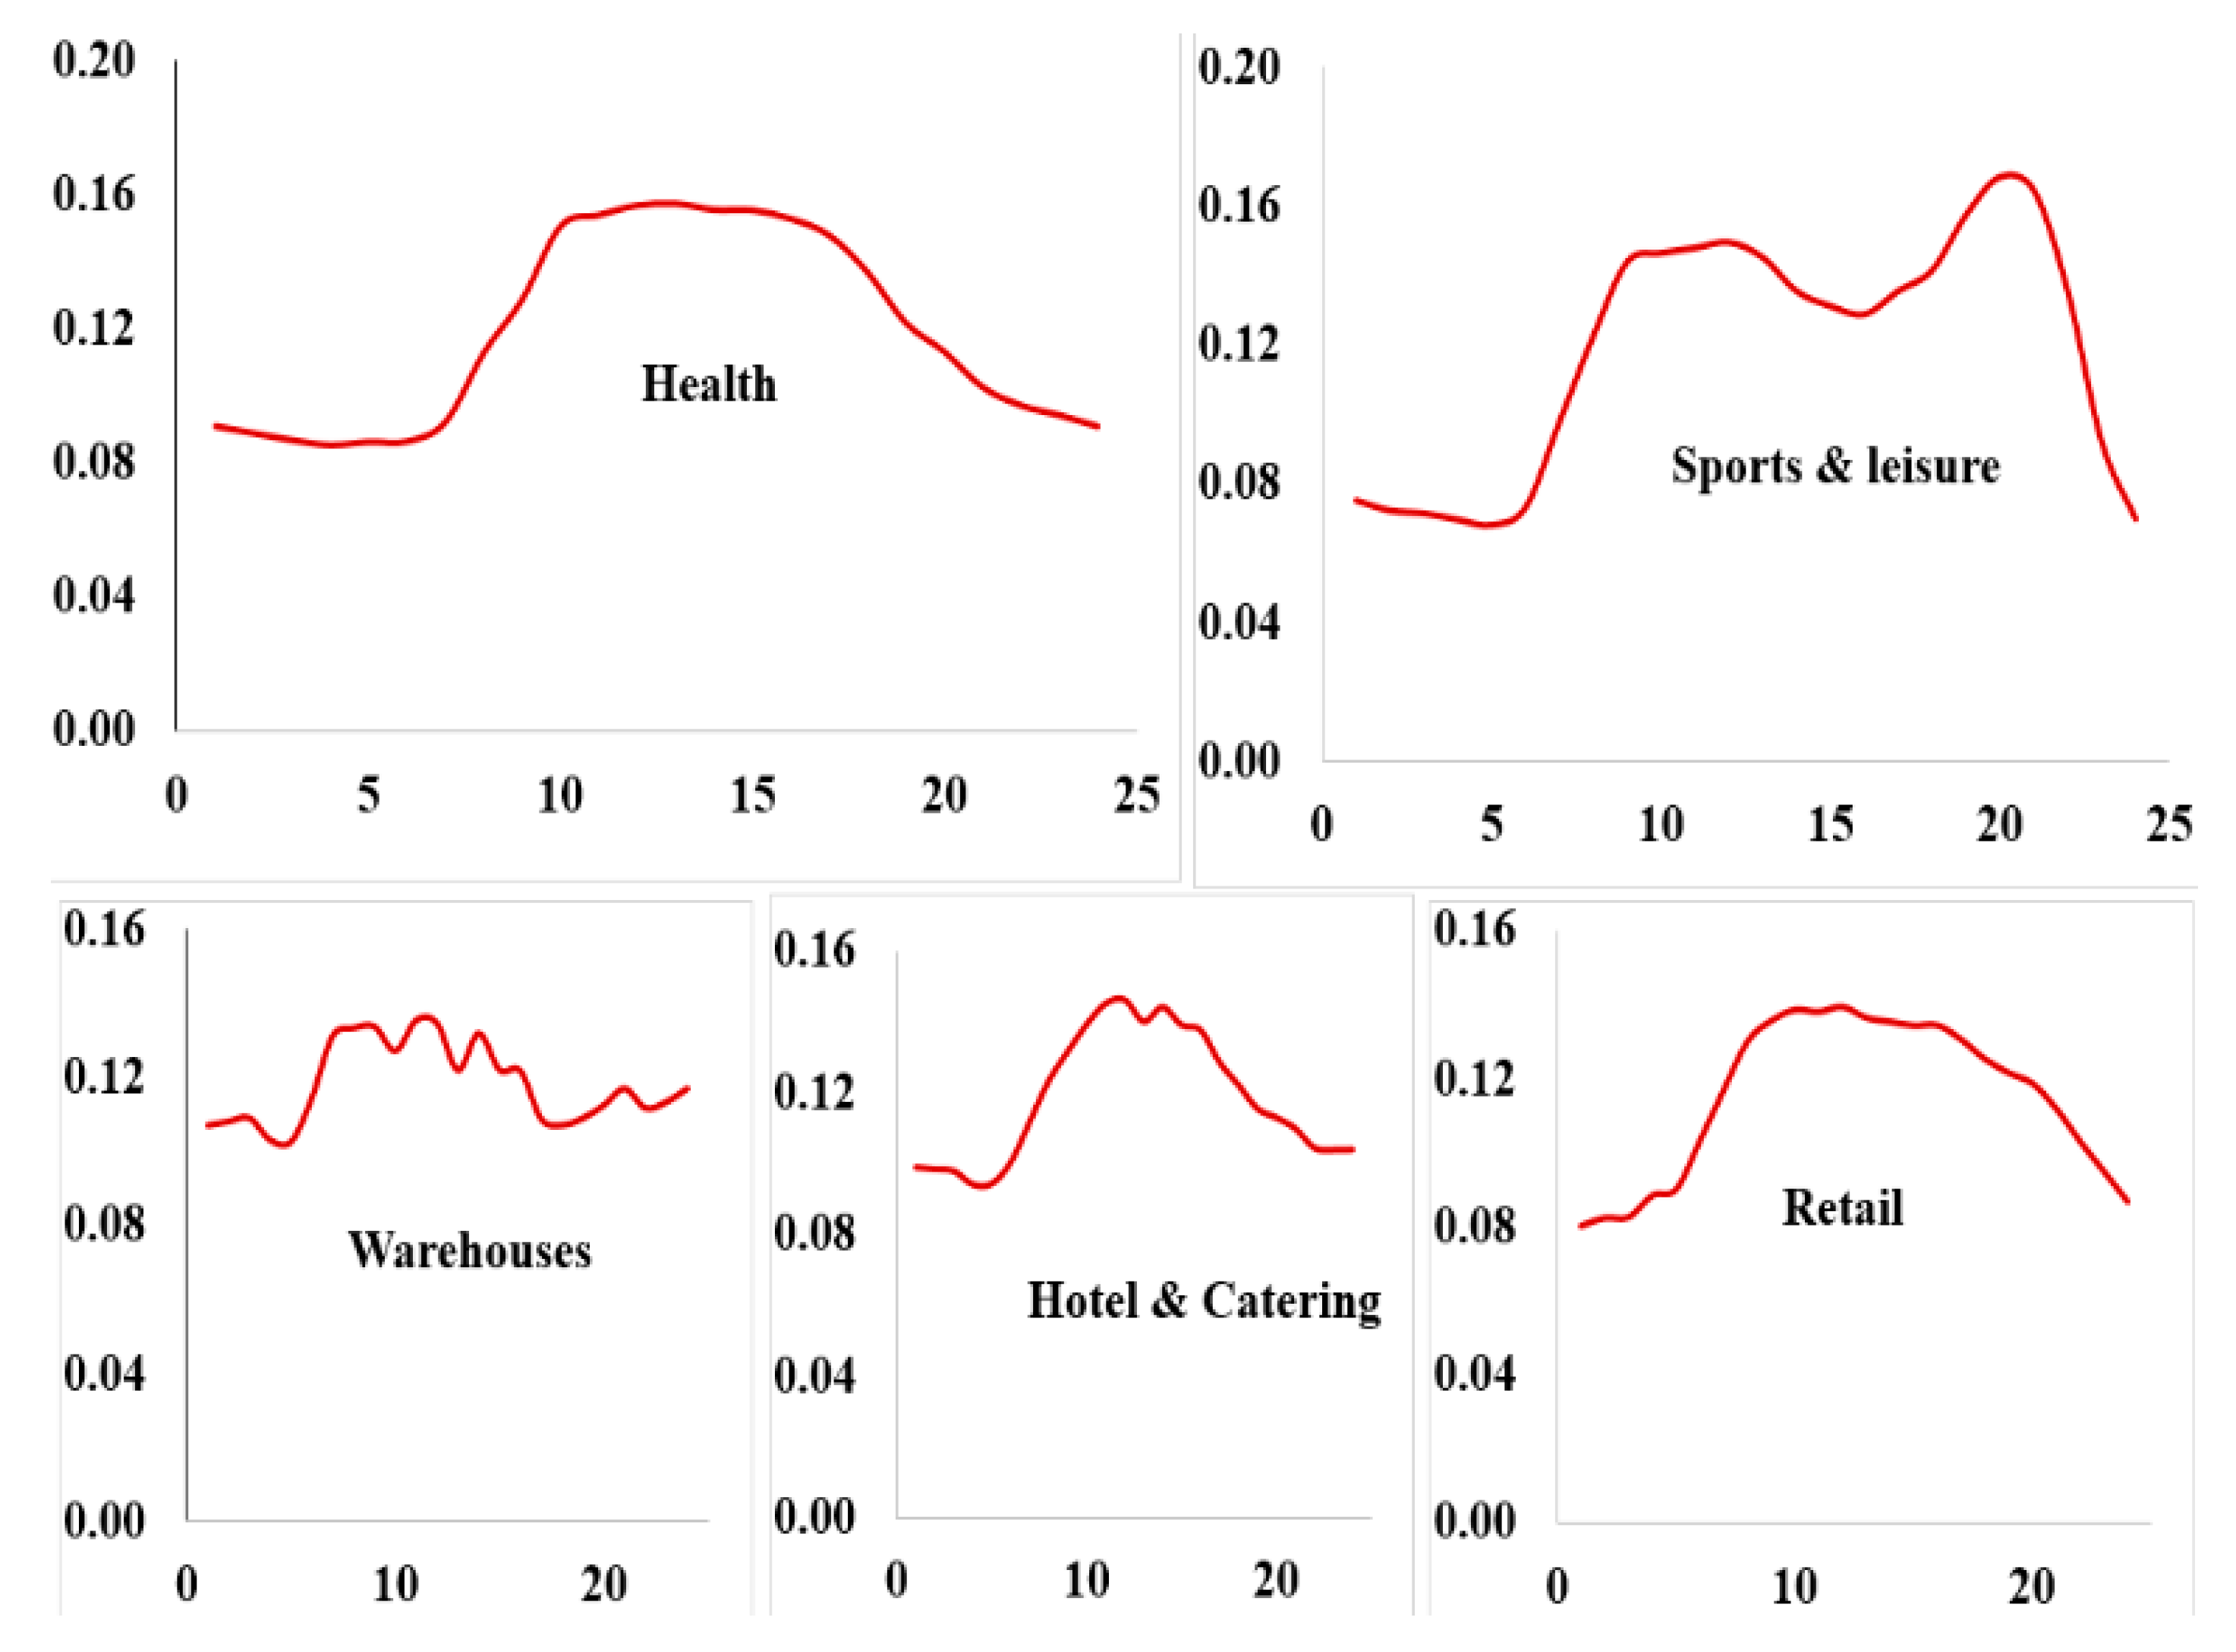
Figure 6 shows the normalized weekday load profile of nine various customer sectors during the spring season. The load profiles depict significant variations in the hourly demand of each customer sector.
Figure 6 presents the demand profiles of all customer sectors in a single consolidated view. The X-axis represents the time of day, and since the research methodology is based on hourly demand data, the figure clearly illustrates an hourly load profile for each sector. This visualization effectively conveys the temporal variations in electricity consumption across different sectors and highlights the basis for sector-specific reliability cost evaluation used in this study. In this research, weekday and weekend load profiles for each season for nine various customer sectors are used to model the hourly total load demand of a year. However, only the weekday load profile of the spring season is displayed here.
The separation of customers into nine sectors in
Figure 6 is not a mandatory requirement of this research but rather a modeling choice based on data availability. The primary objective of this part of the study is to obtain representative hourly load profiles for different customer categories in order to conduct a realistic reliability analysis. During the data collection phase, it was found that hourly demand profiles for nine distinct customer sectors were readily available from the De Montfort University database (London) [
23]. As a result, these nine sectors were adopted in the model. It is important to note that residential and industrial customers are included within these nine sectors, either as dedicated categories or as part of broader groupings. This segmentation approach does not restrict the generalizability of the research. The methodology is flexible and can be adapted to accommodate a smaller or larger number of customer sectors, depending on the availability of load profile data. The use of nine sectors in this study is therefore driven by practical considerations and data accessibility rather than by any theoretical or methodological limitation.
7. Simulation Result
In this section, the simulation results obtained from each approach are presented.
The LOLF of the SMG system for the Base case is shown in
Table 1. To increase reliability by 1%, 2%, or 3% (to increase LOLP to 2.9%, 1.9%, or 0.9%), the SMG system must invest in increased generation capacity and component replacement with more reliable components. As a result, the cost of reliability improvement (CRI) is the additional investment needed to improve the reliability of the SMG to a required reliability value. A method for calculating the Marginal Cost of Reliability Improvement (MCRI) has previously been provided [
17], which describes how to calculate the overall investment cost for a marginal (1%) reliability improvement. As a result, the purpose of this research is not to analyse MCRI but rather to evaluate how this MCRI will be assigned to distinct customer sectors. This is calculated by determining what fraction of the increased investment cost each customer sector should bear based on their demand pattern.
7.1. Using Sector Customer Annual Peak Demand
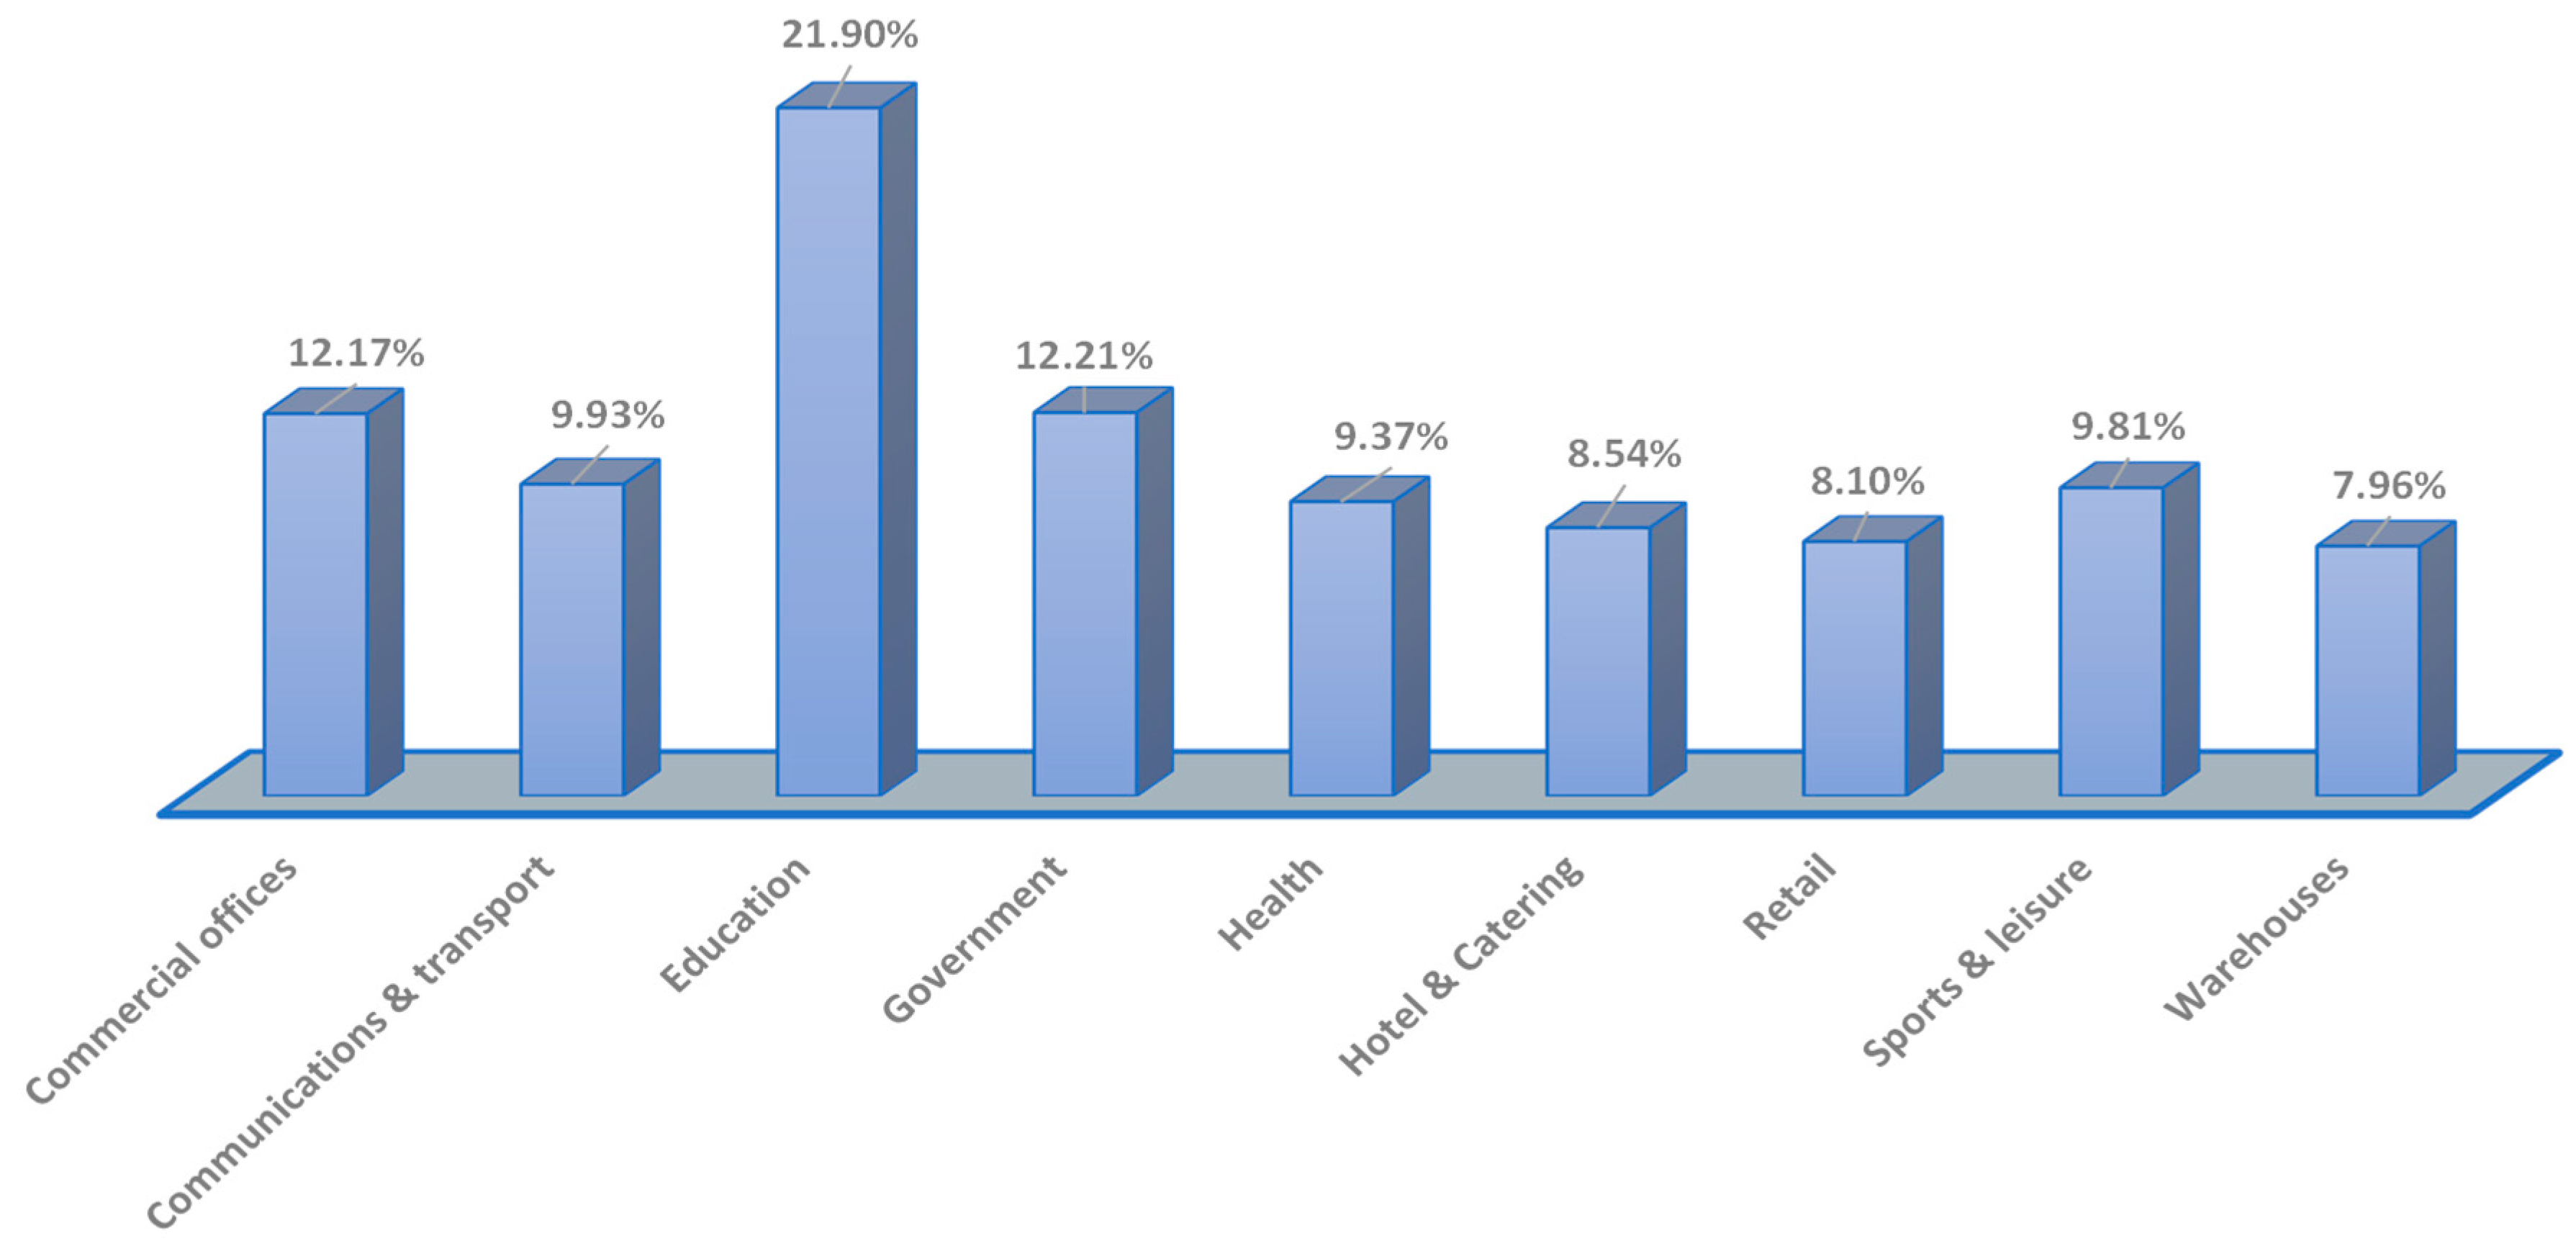
In this section, the reliability cost allocation to nine different customer sectors is decided using the annual peak demand of each of the customer sector.
Figure 7 shows how much of the CRI should be assigned to each customer category on a scale of 1 to 9. The educational sector must pay the highest share of the CRI, 21.90%, while the warehouse industry must pay the lowest share, 7.96%.
7.2. Using Sector Customer Seasonal Peak Demand
In this section, the reliability cost allocation is determined using the seasonal peak demand of each customer sectors.
Figure 8 shows that the educational sector should pay a higher portion of the CRI, 15.44%, while the warehouse industry should pay the lowest share, 9.53%.
7.3. Using Normalized Average of the Sector Customer Demand During LOL Events
In this section, the reliability cost accumulation is determined by calculating the normalized average of individual sector demand during each of the LOL events.
Figure 9 shows that the educational sector should pay a higher part of the CRI, which is 22.39%, while the warehouse industry should pay the bare minimum of 12.34%.
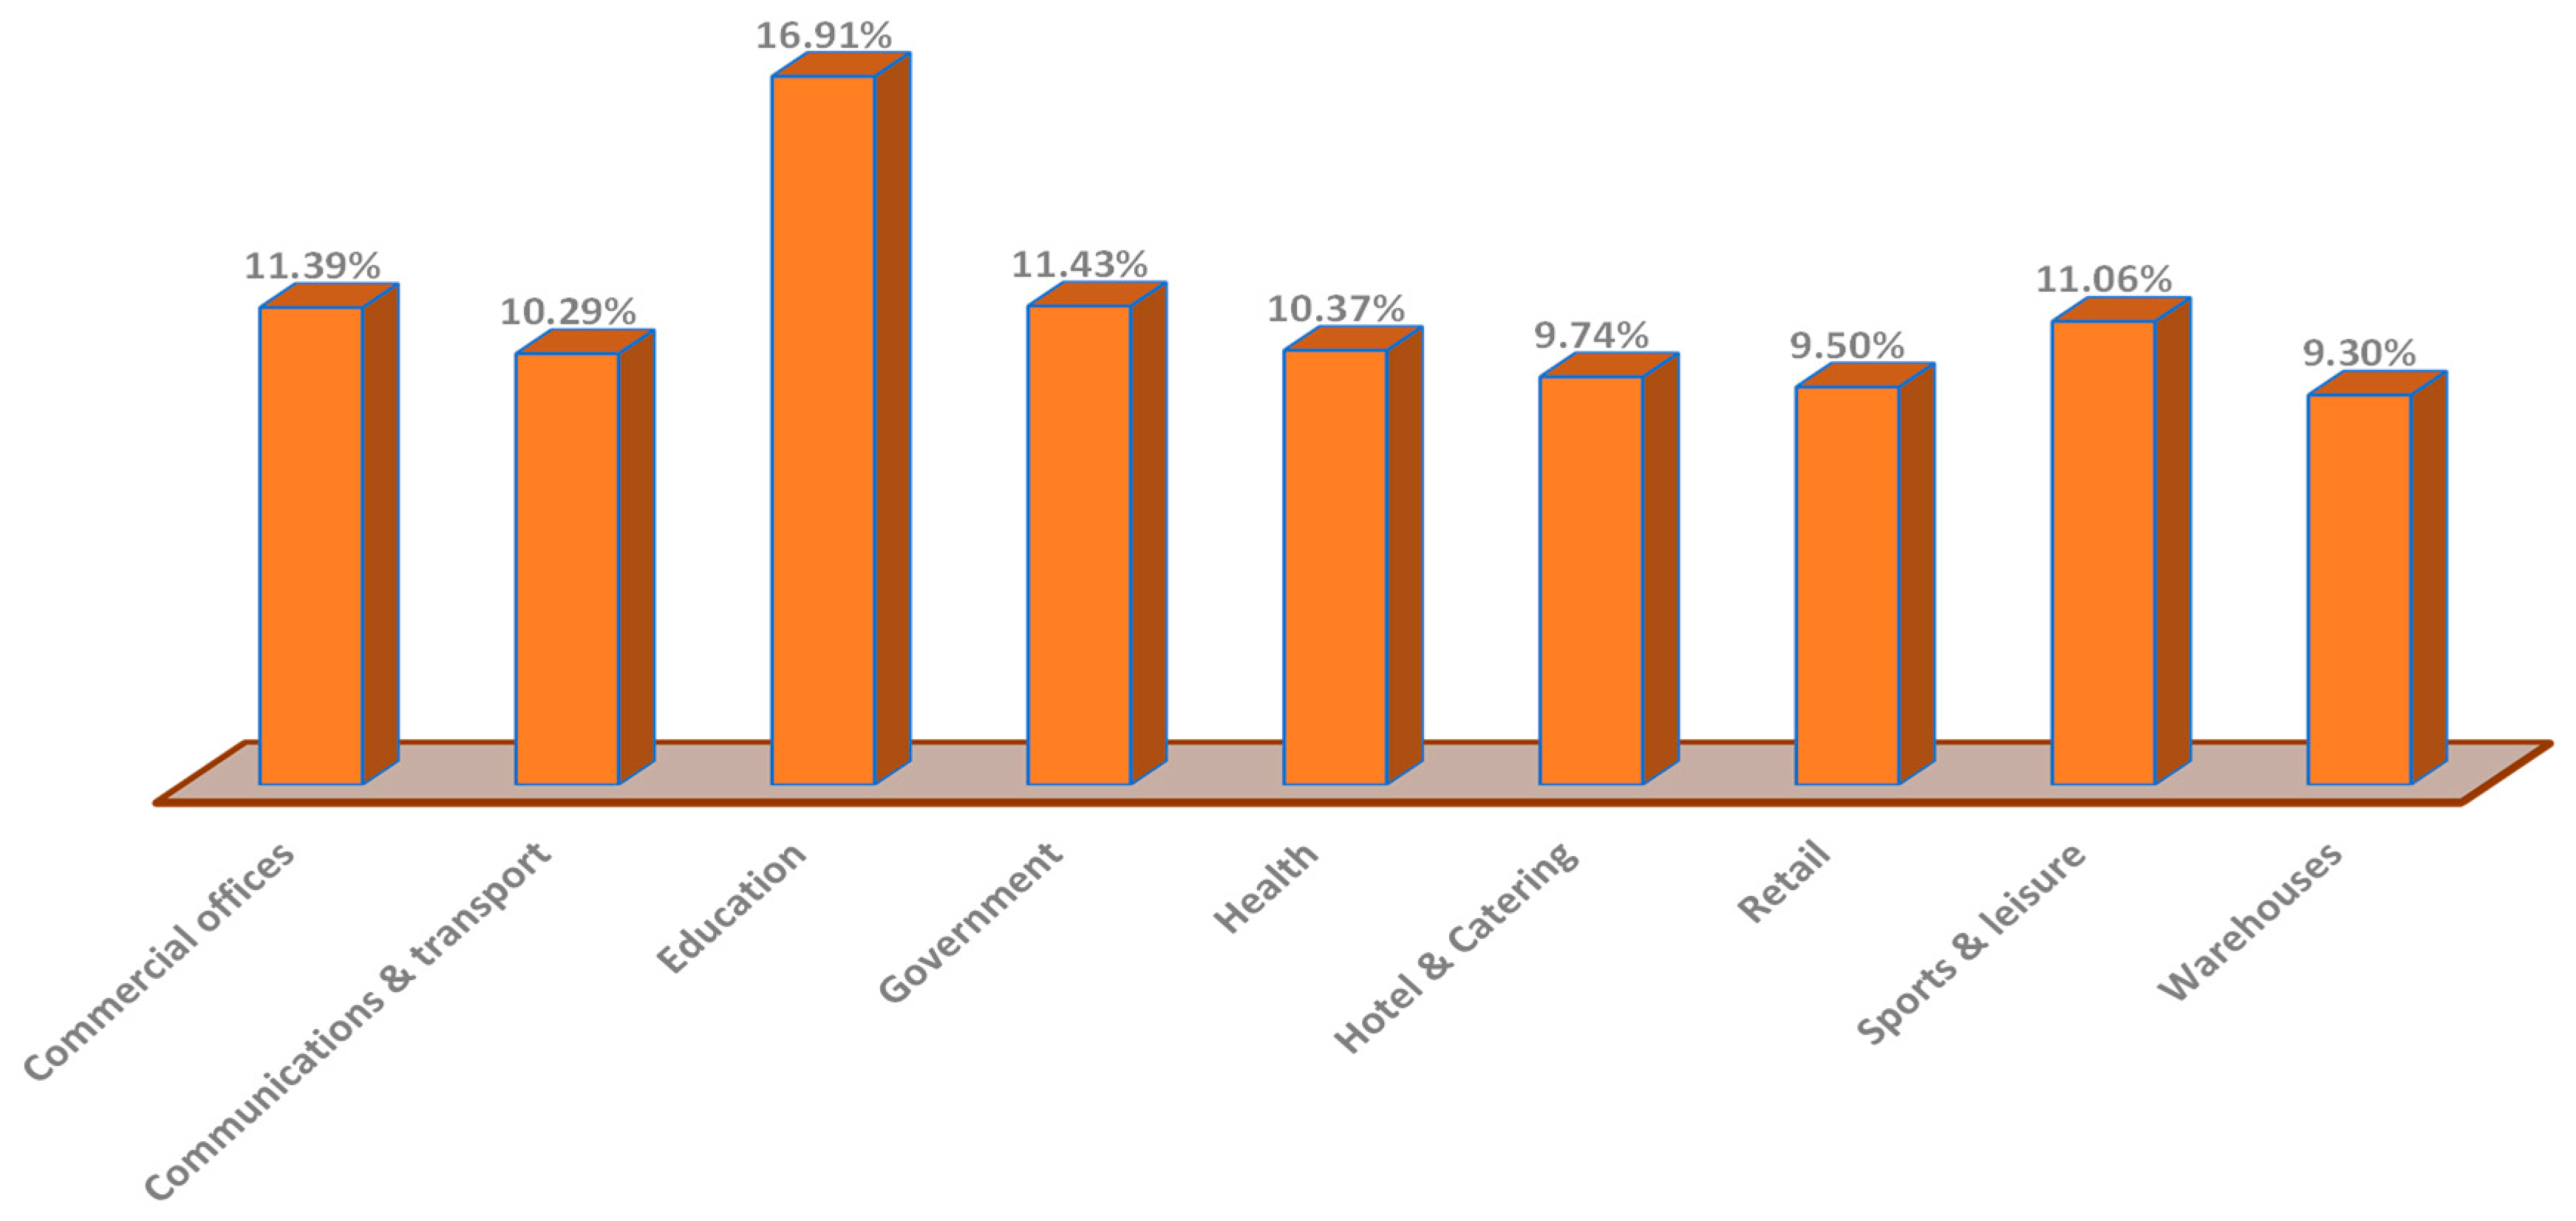
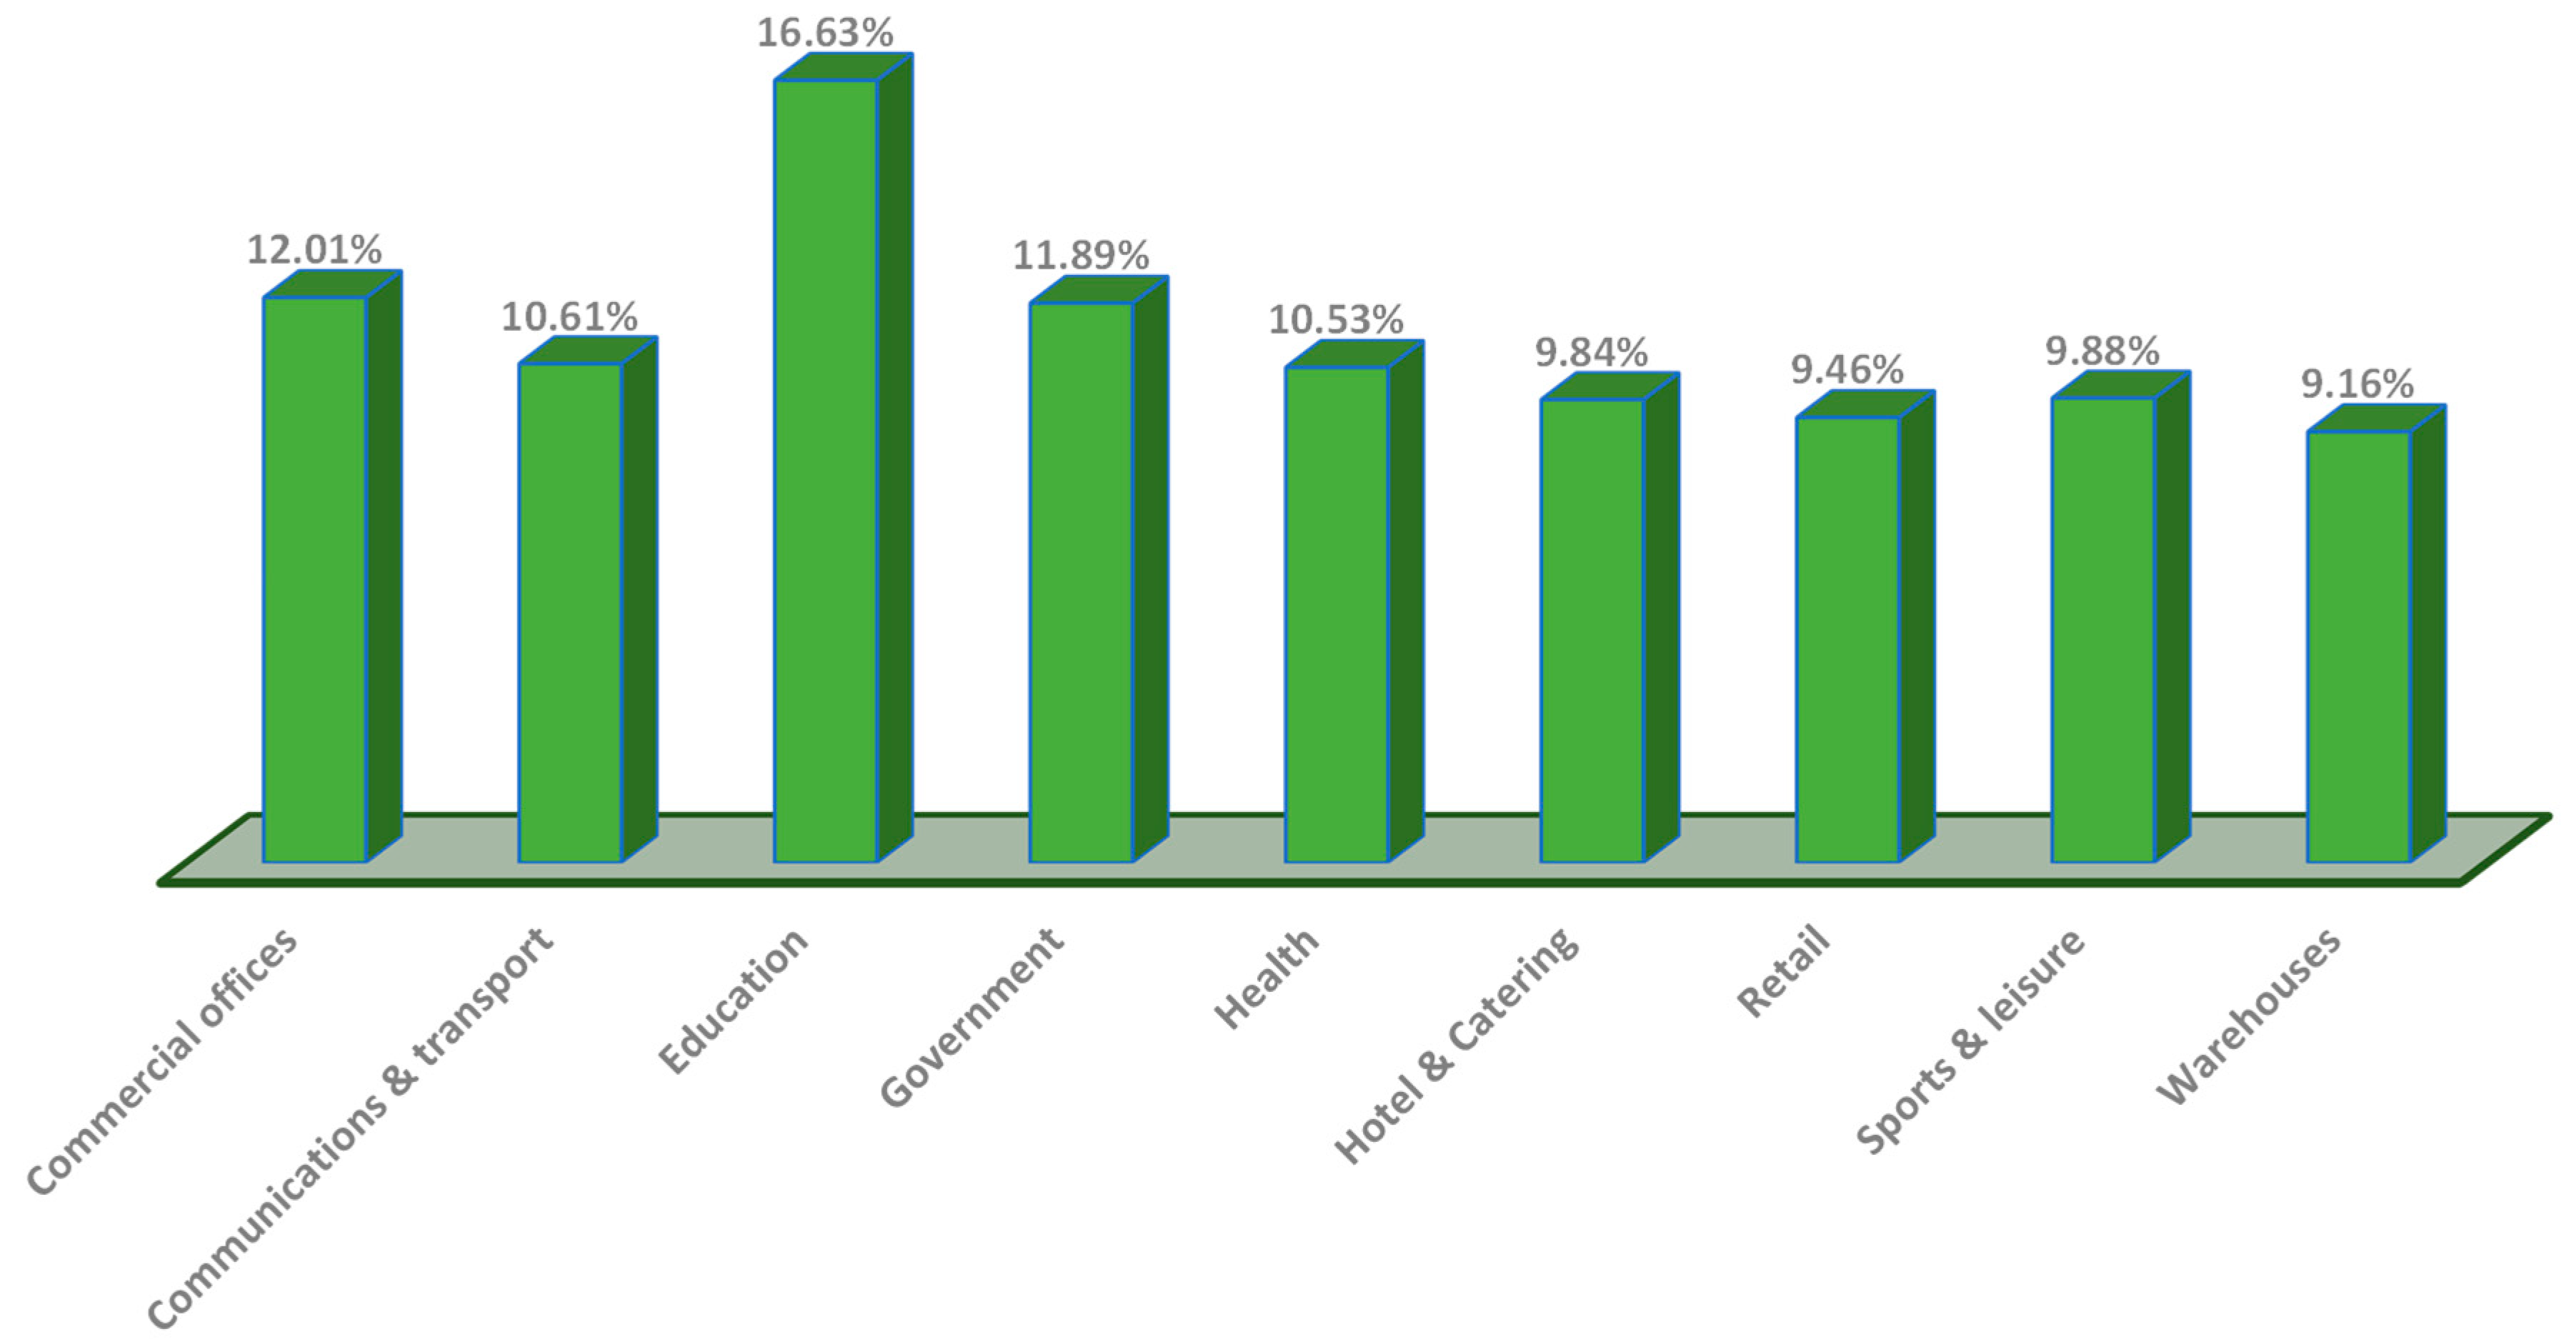
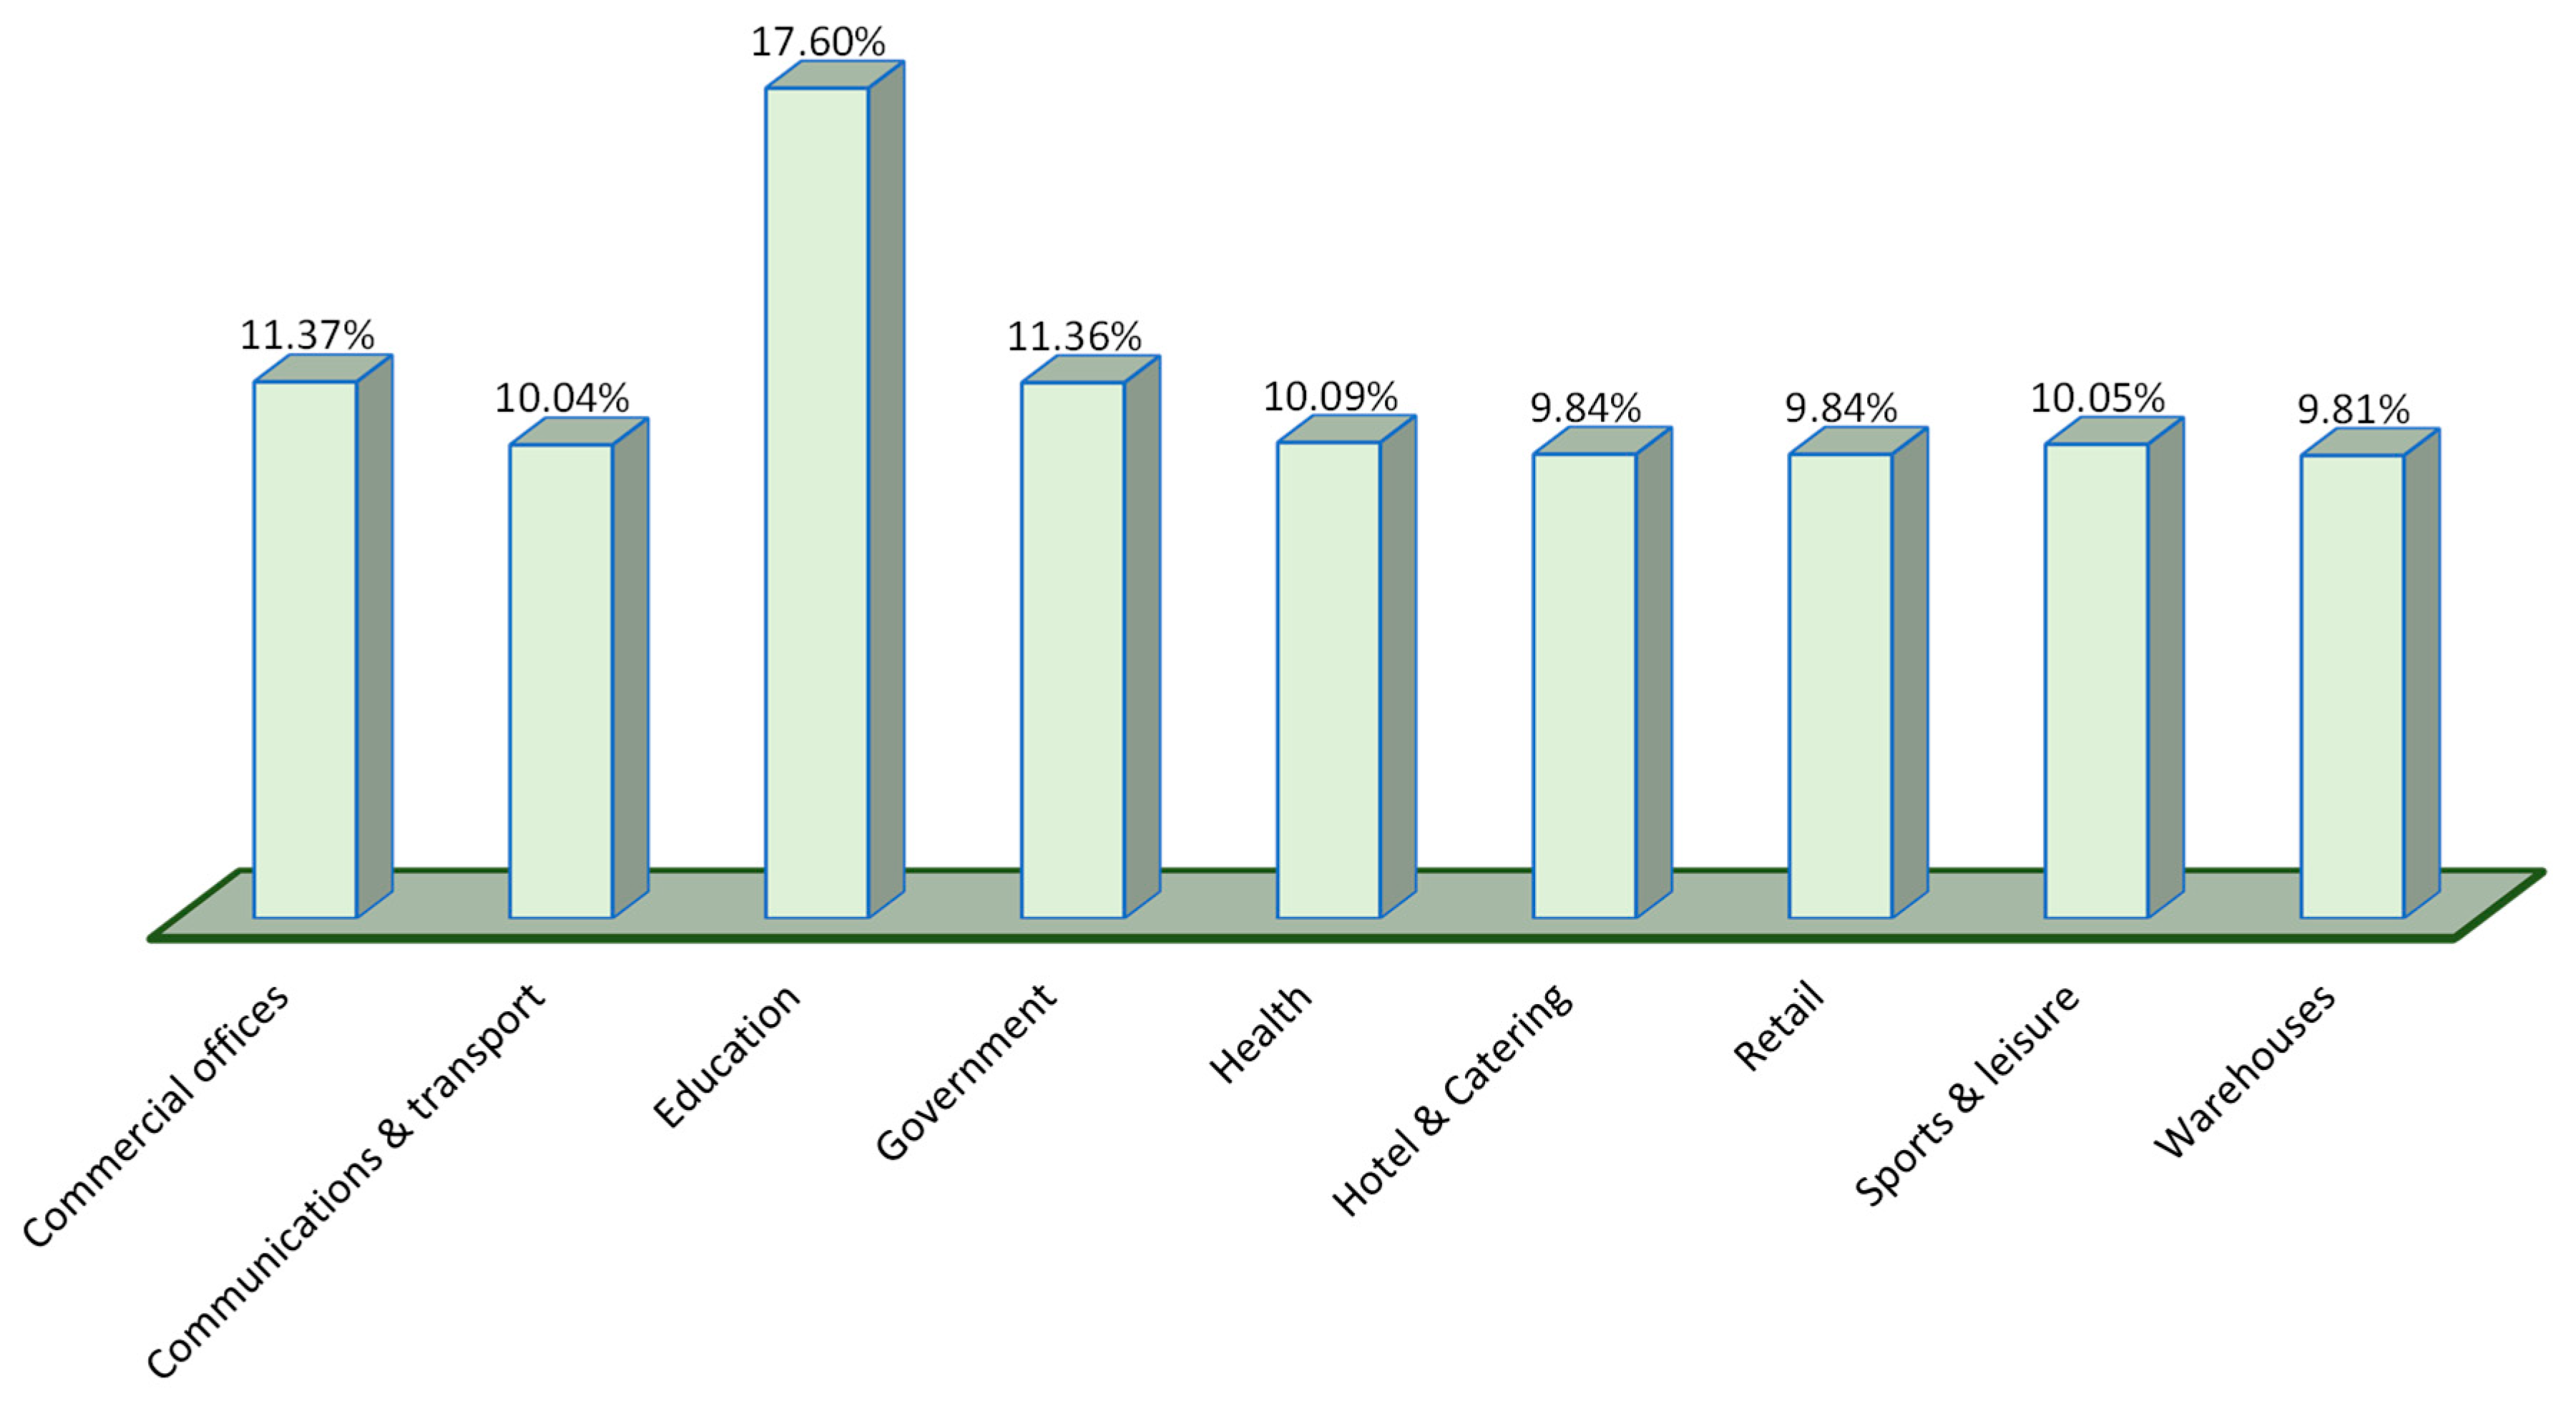
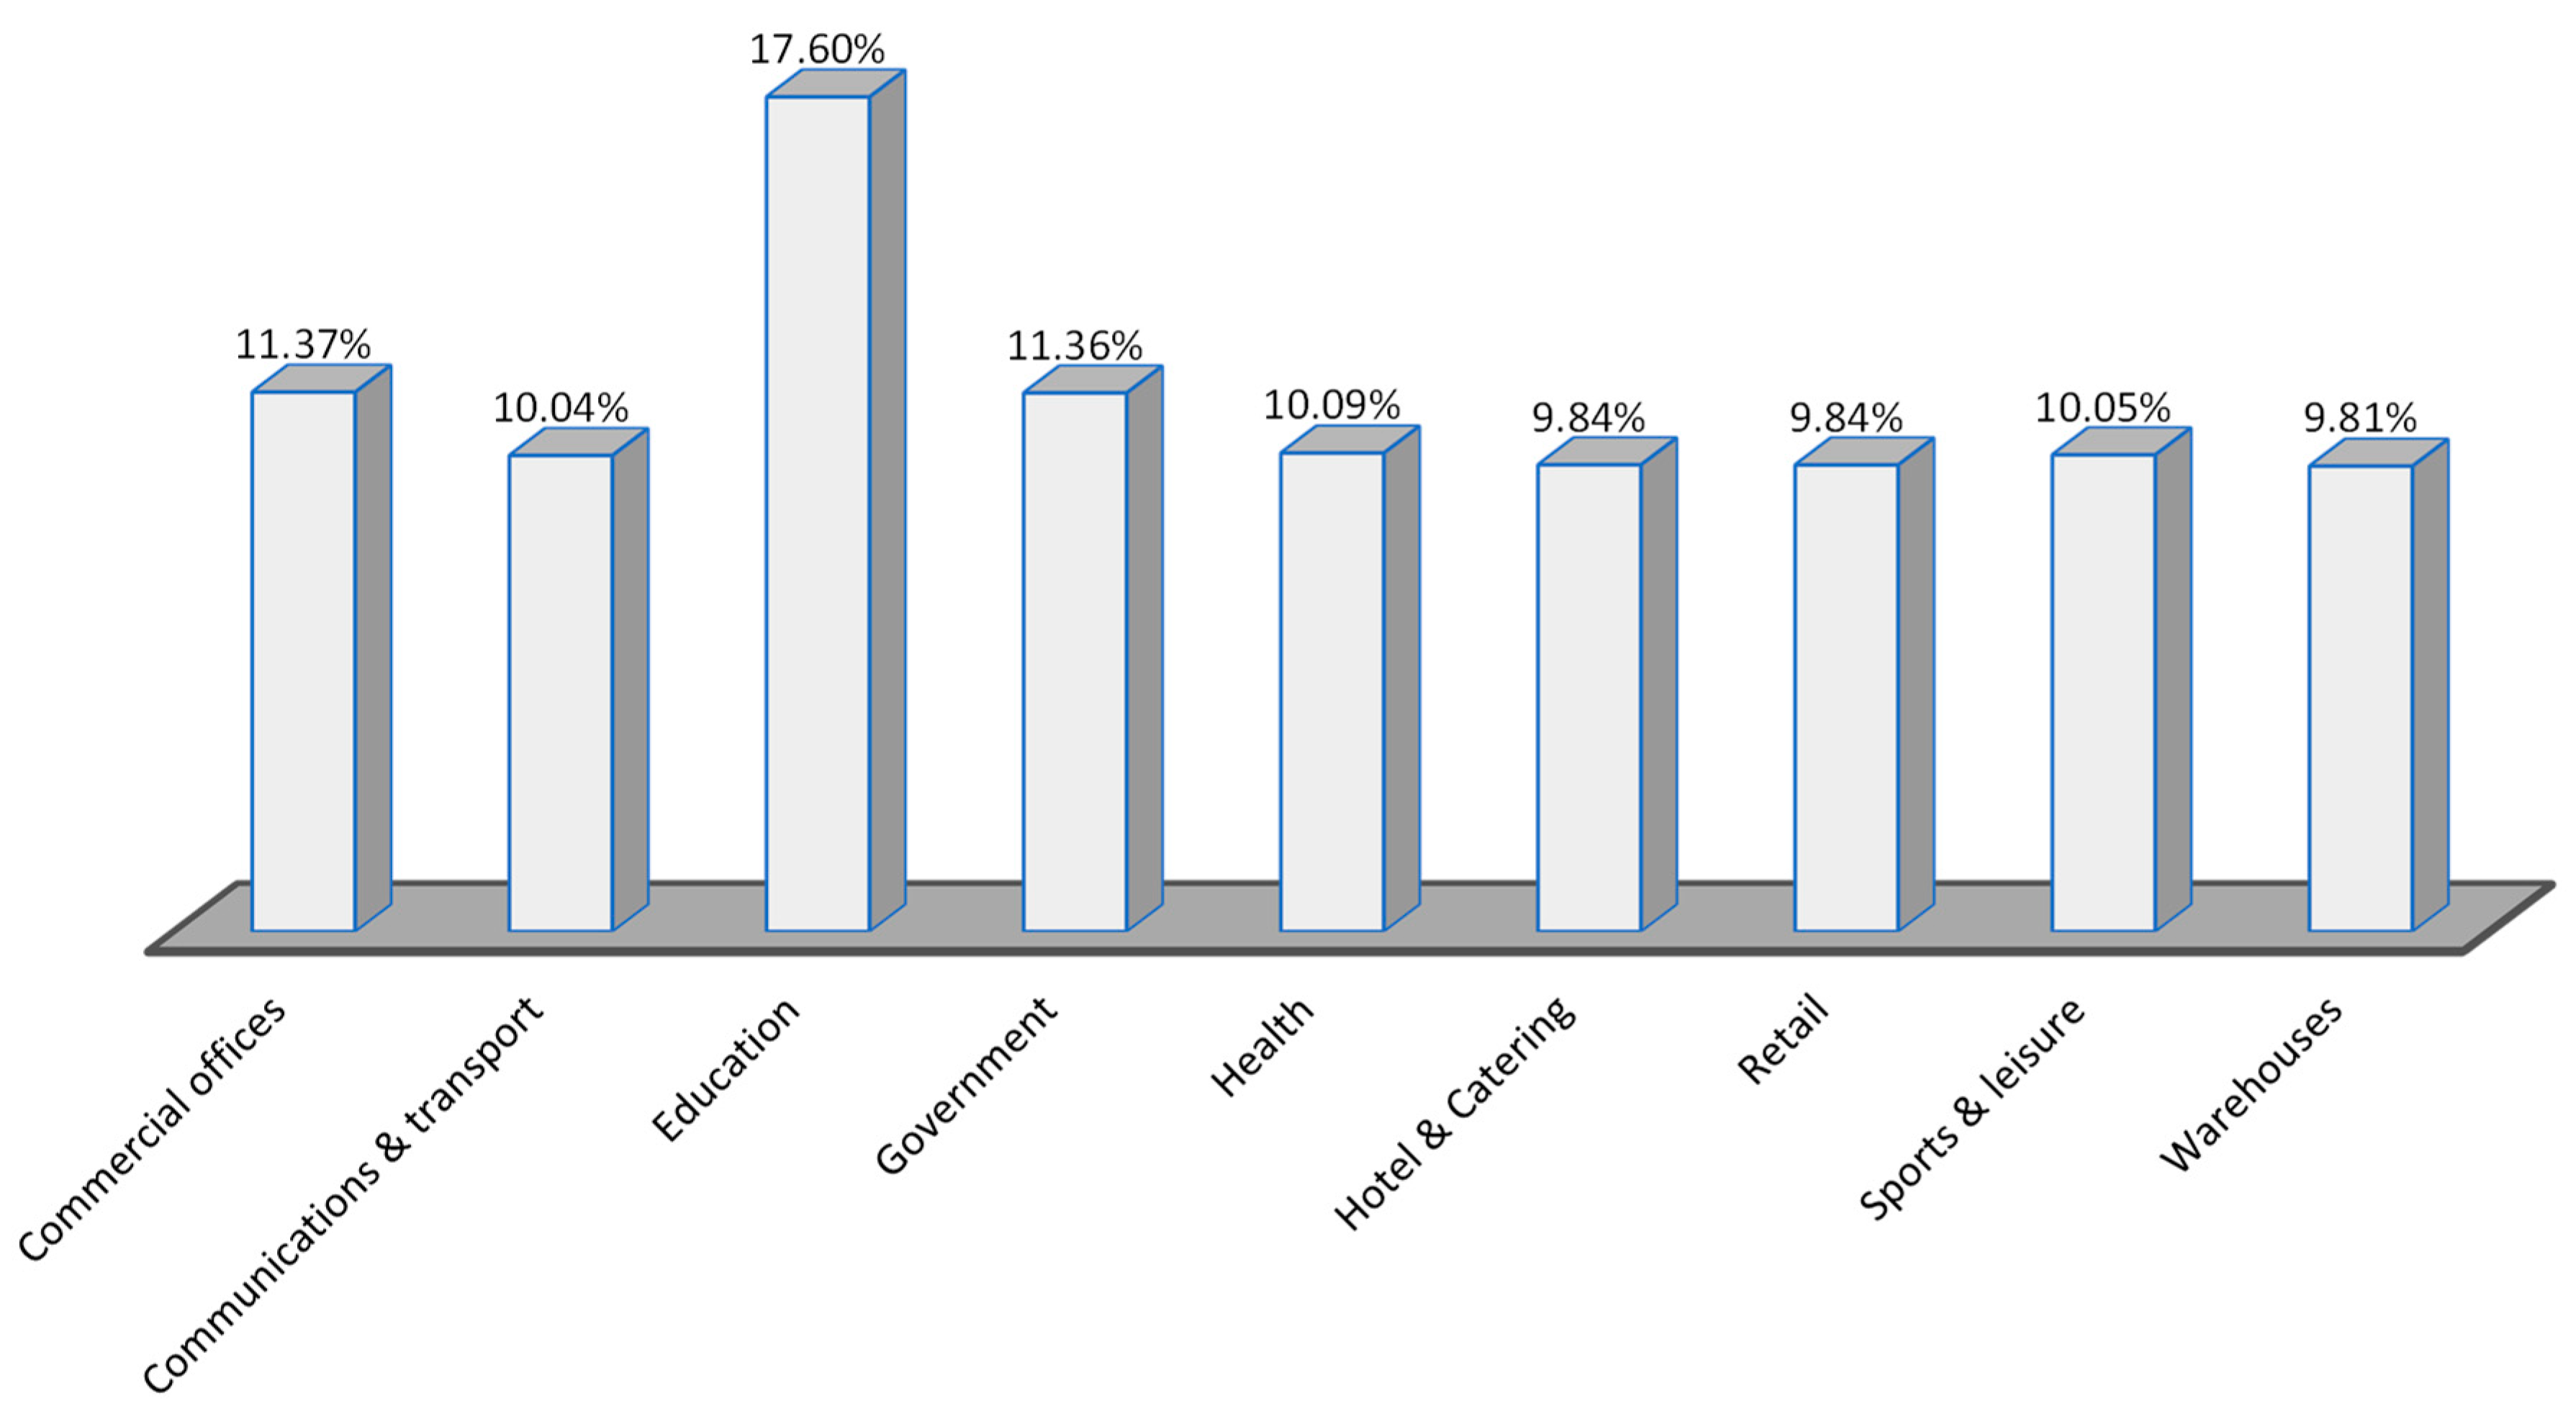
7.4. Using the TOPSIS Method
In this section, the reliability cost allocation is determined using the TOPSIS approach after identifying the demands of each specific sector, which generates the LOL event. Because the worst-case load demand of each customer sector is unknown, we theoretically assume the worst-case occurs when any sector consumes 25%, 50%, or 75% of total power generation at a given hour.
7.4.1. Considering Worst-Case Demand Is Equal to 25% of Total Power Generation
Figure 10 demonstrates that the education sector has the highest level of responsibility (17.60% of CRI), but the hotel and catering sector has the lowest level of accountability (9.81%).
7.4.2. Considering Worst-Case Demand Is Equal to 50% of Total Power Generation
Figure 11 demonstrates that the education sector has the highest level of accountability (13% of CRI), whereas the hotel and catering sector has the lowest level of accountability (10.7%).
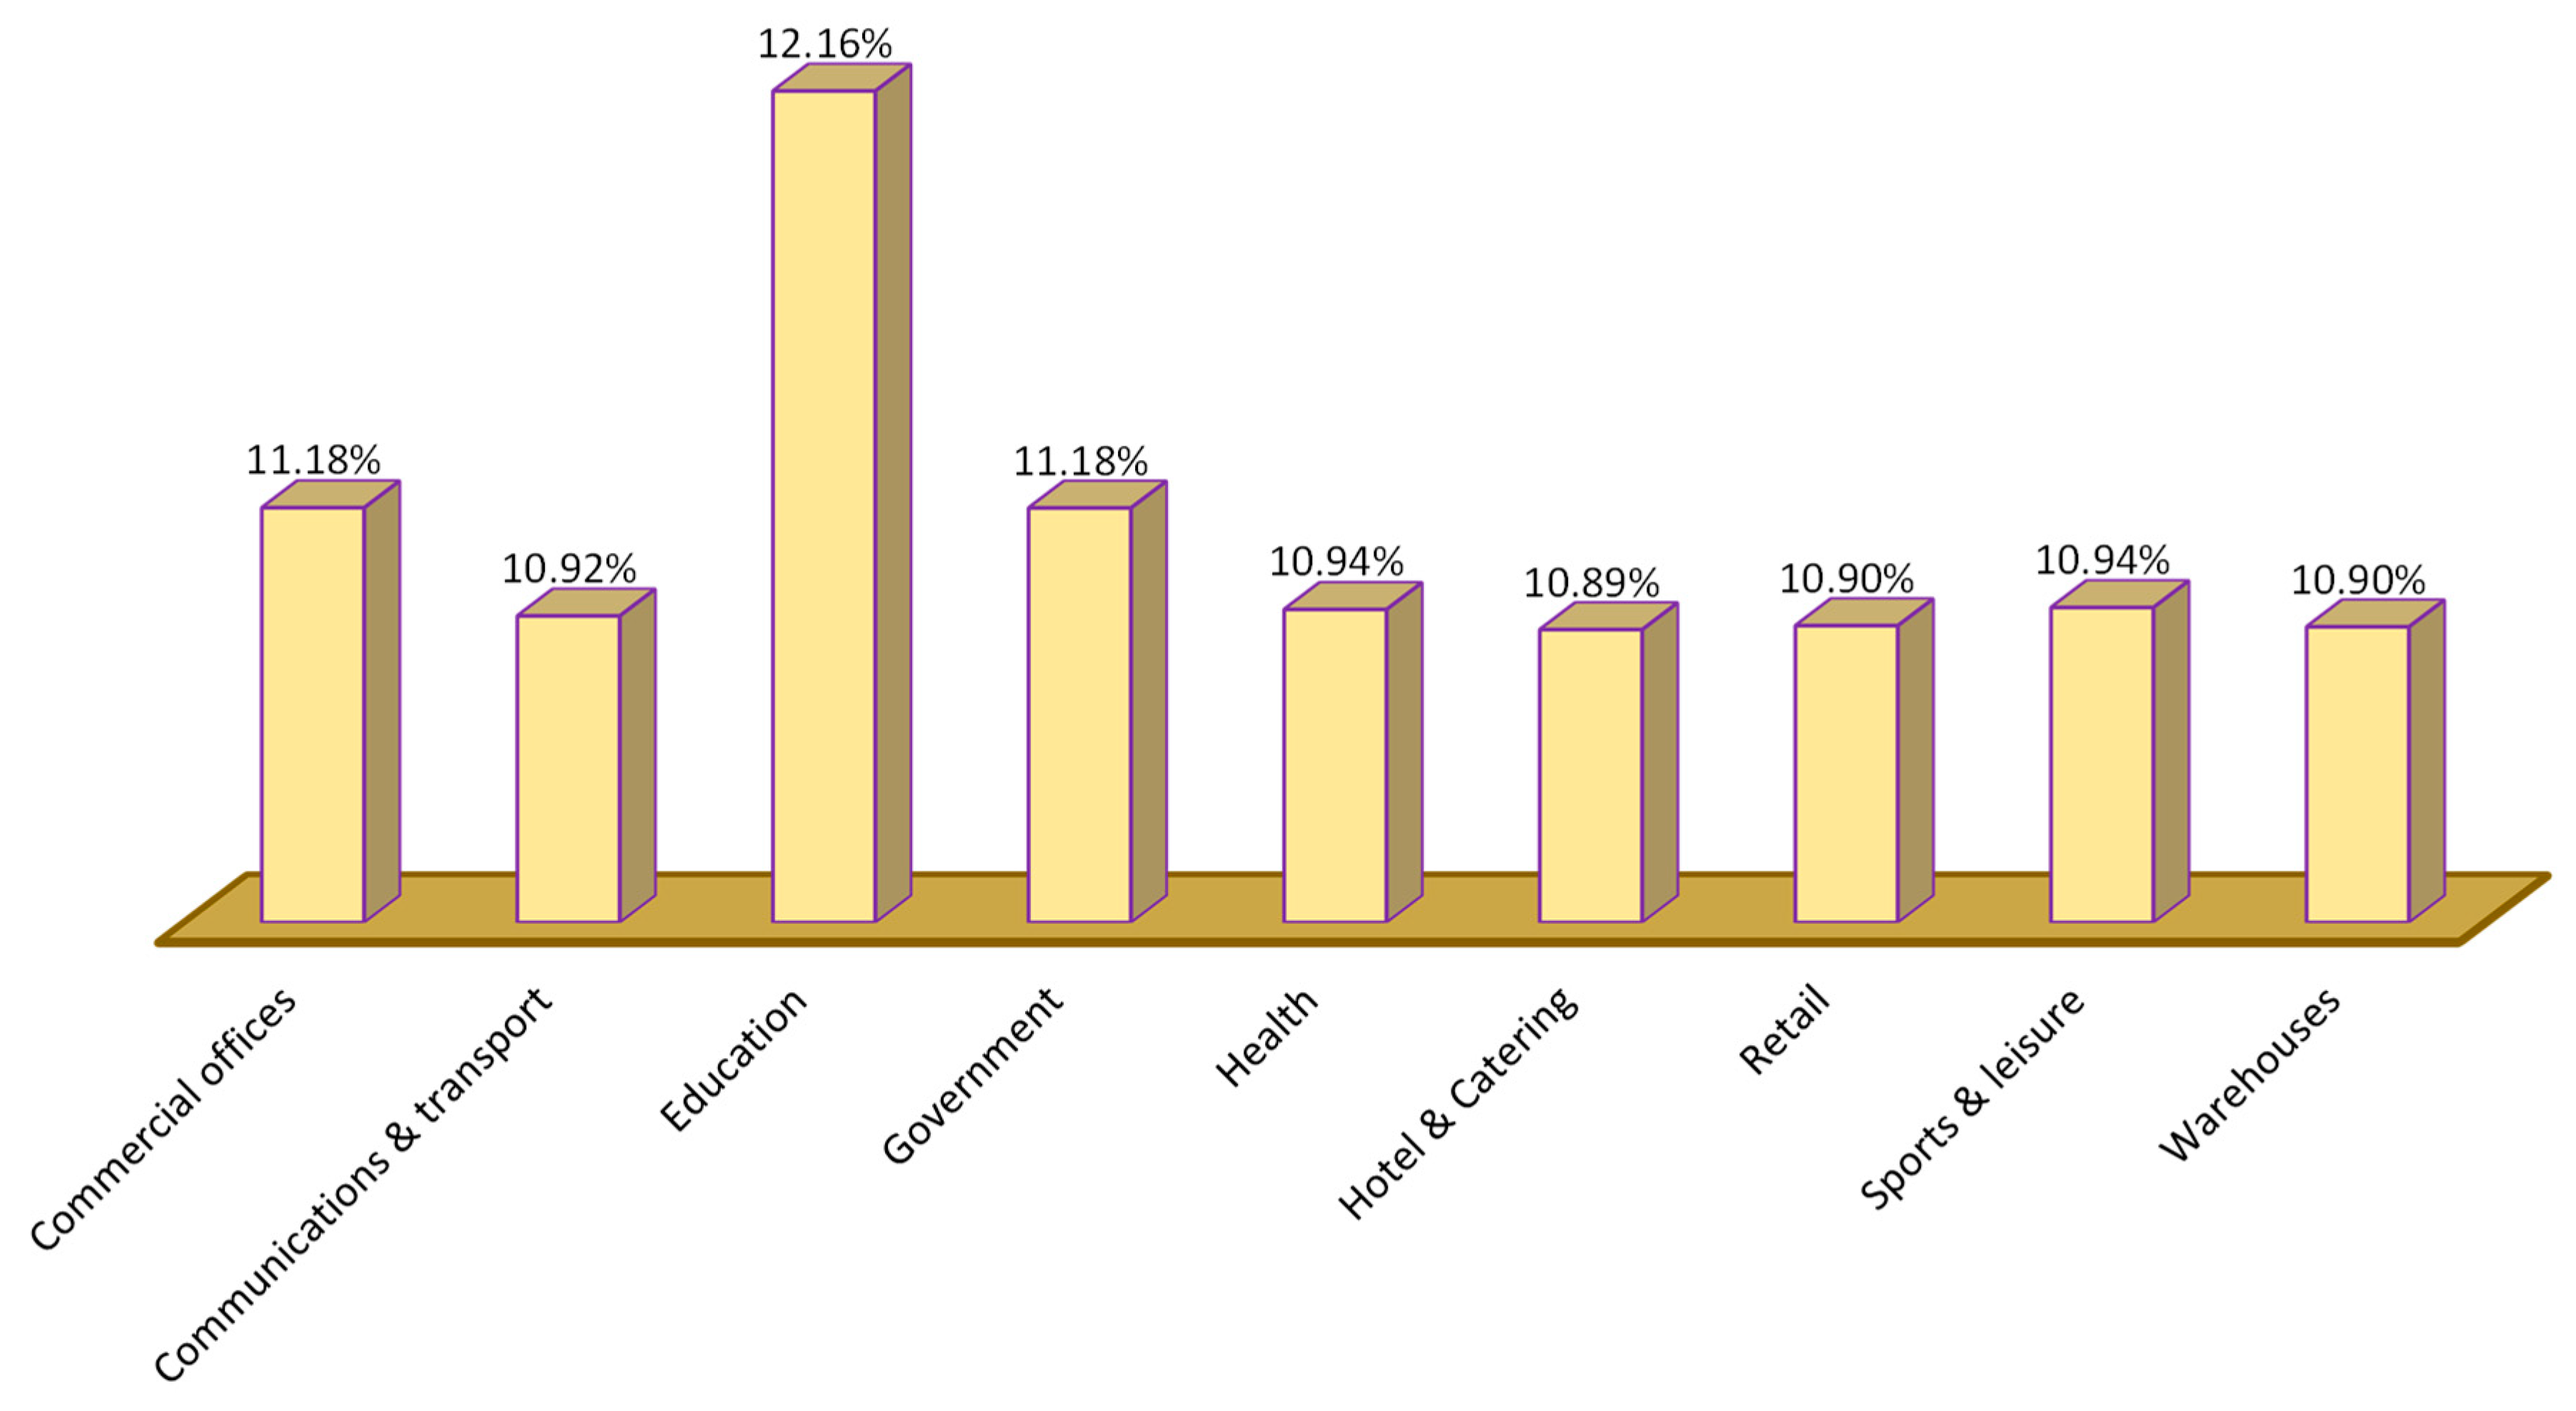
7.4.3. Using Worst-Case Demand Is Equal to 75% of Total Power Generation
Figure 12 demonstrates that the education sector is the most accountable, accounting for 12.16% of the CRI, while the hotel and catering industry is the least accountable, accounting for 10.89%. However, with this strategy, the difference between the highest and lowest is significantly smaller.
Figure 10,
Figure 11 and
Figure 12 show that changing the worst-case assumption reduces reliability cost allocation to the educational sector. The worst-case scenario of 25% of total demand resulted in 17.60% of reliability cost allocation, 50% of total demand resulted in 13% of reliability cost allocation, and 75% of total demand resulted in 12.16% of reliability cost allocation. The TOPSIS theory conceptually analyses each alternative based on how distant it is from the negative ideal value. This can be used by any independent SMG supplier based on their requirements or agreements with customer sectors. To illustrate, if the utility wishes to significantly penalize customer segments that contributed the most to the LOL event, they can use a 25% assumption; however, if they do not want to heavily penalize individual consumers, they can use a 75% assumption as a worst case.
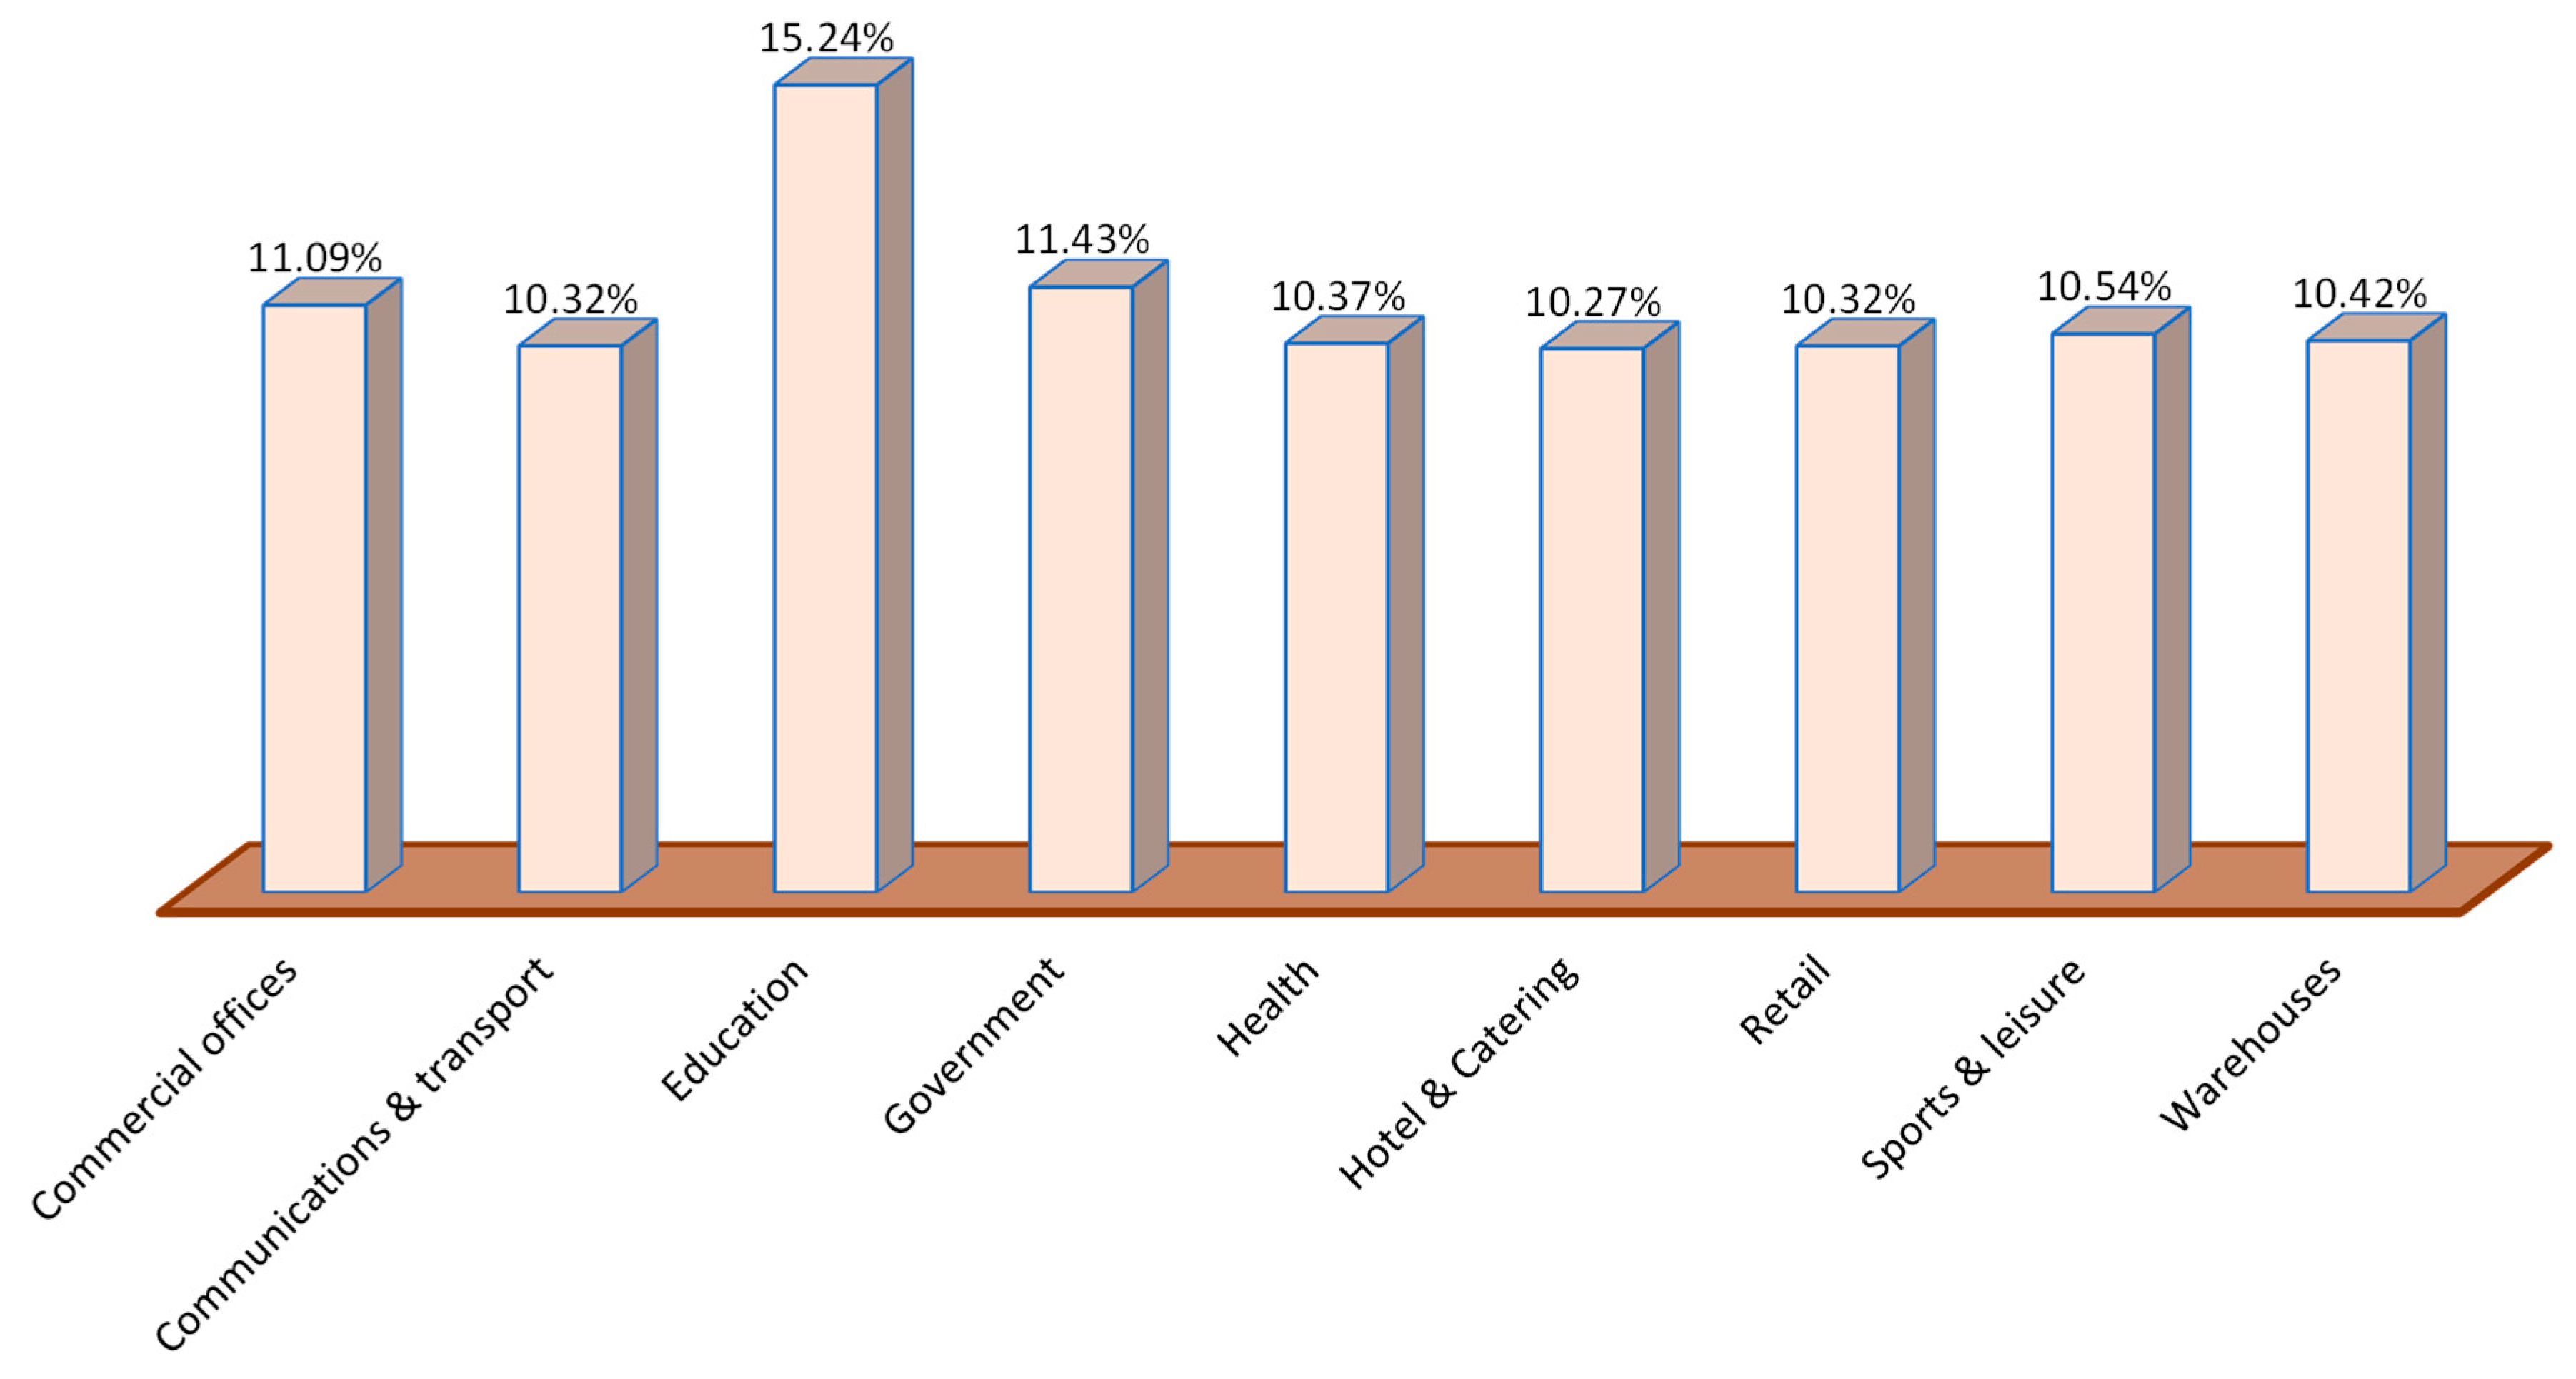
7.4.4. Average of TOPSIS Result
In this section, the average of all three TOPSIS cases calculated is extracted based on three different worst-case demands.
Figure 13 depicts how much of the CRI should be allocated to each sector based on the average of the three TOPSIS evaluations. The education sector has the largest share (15.24%), while the hotel and catering sector has the lowest (10.27%).
7.5. Comparison of Four Different Approaches
In this section, a comparison between all four proposed methodologies is discussed.
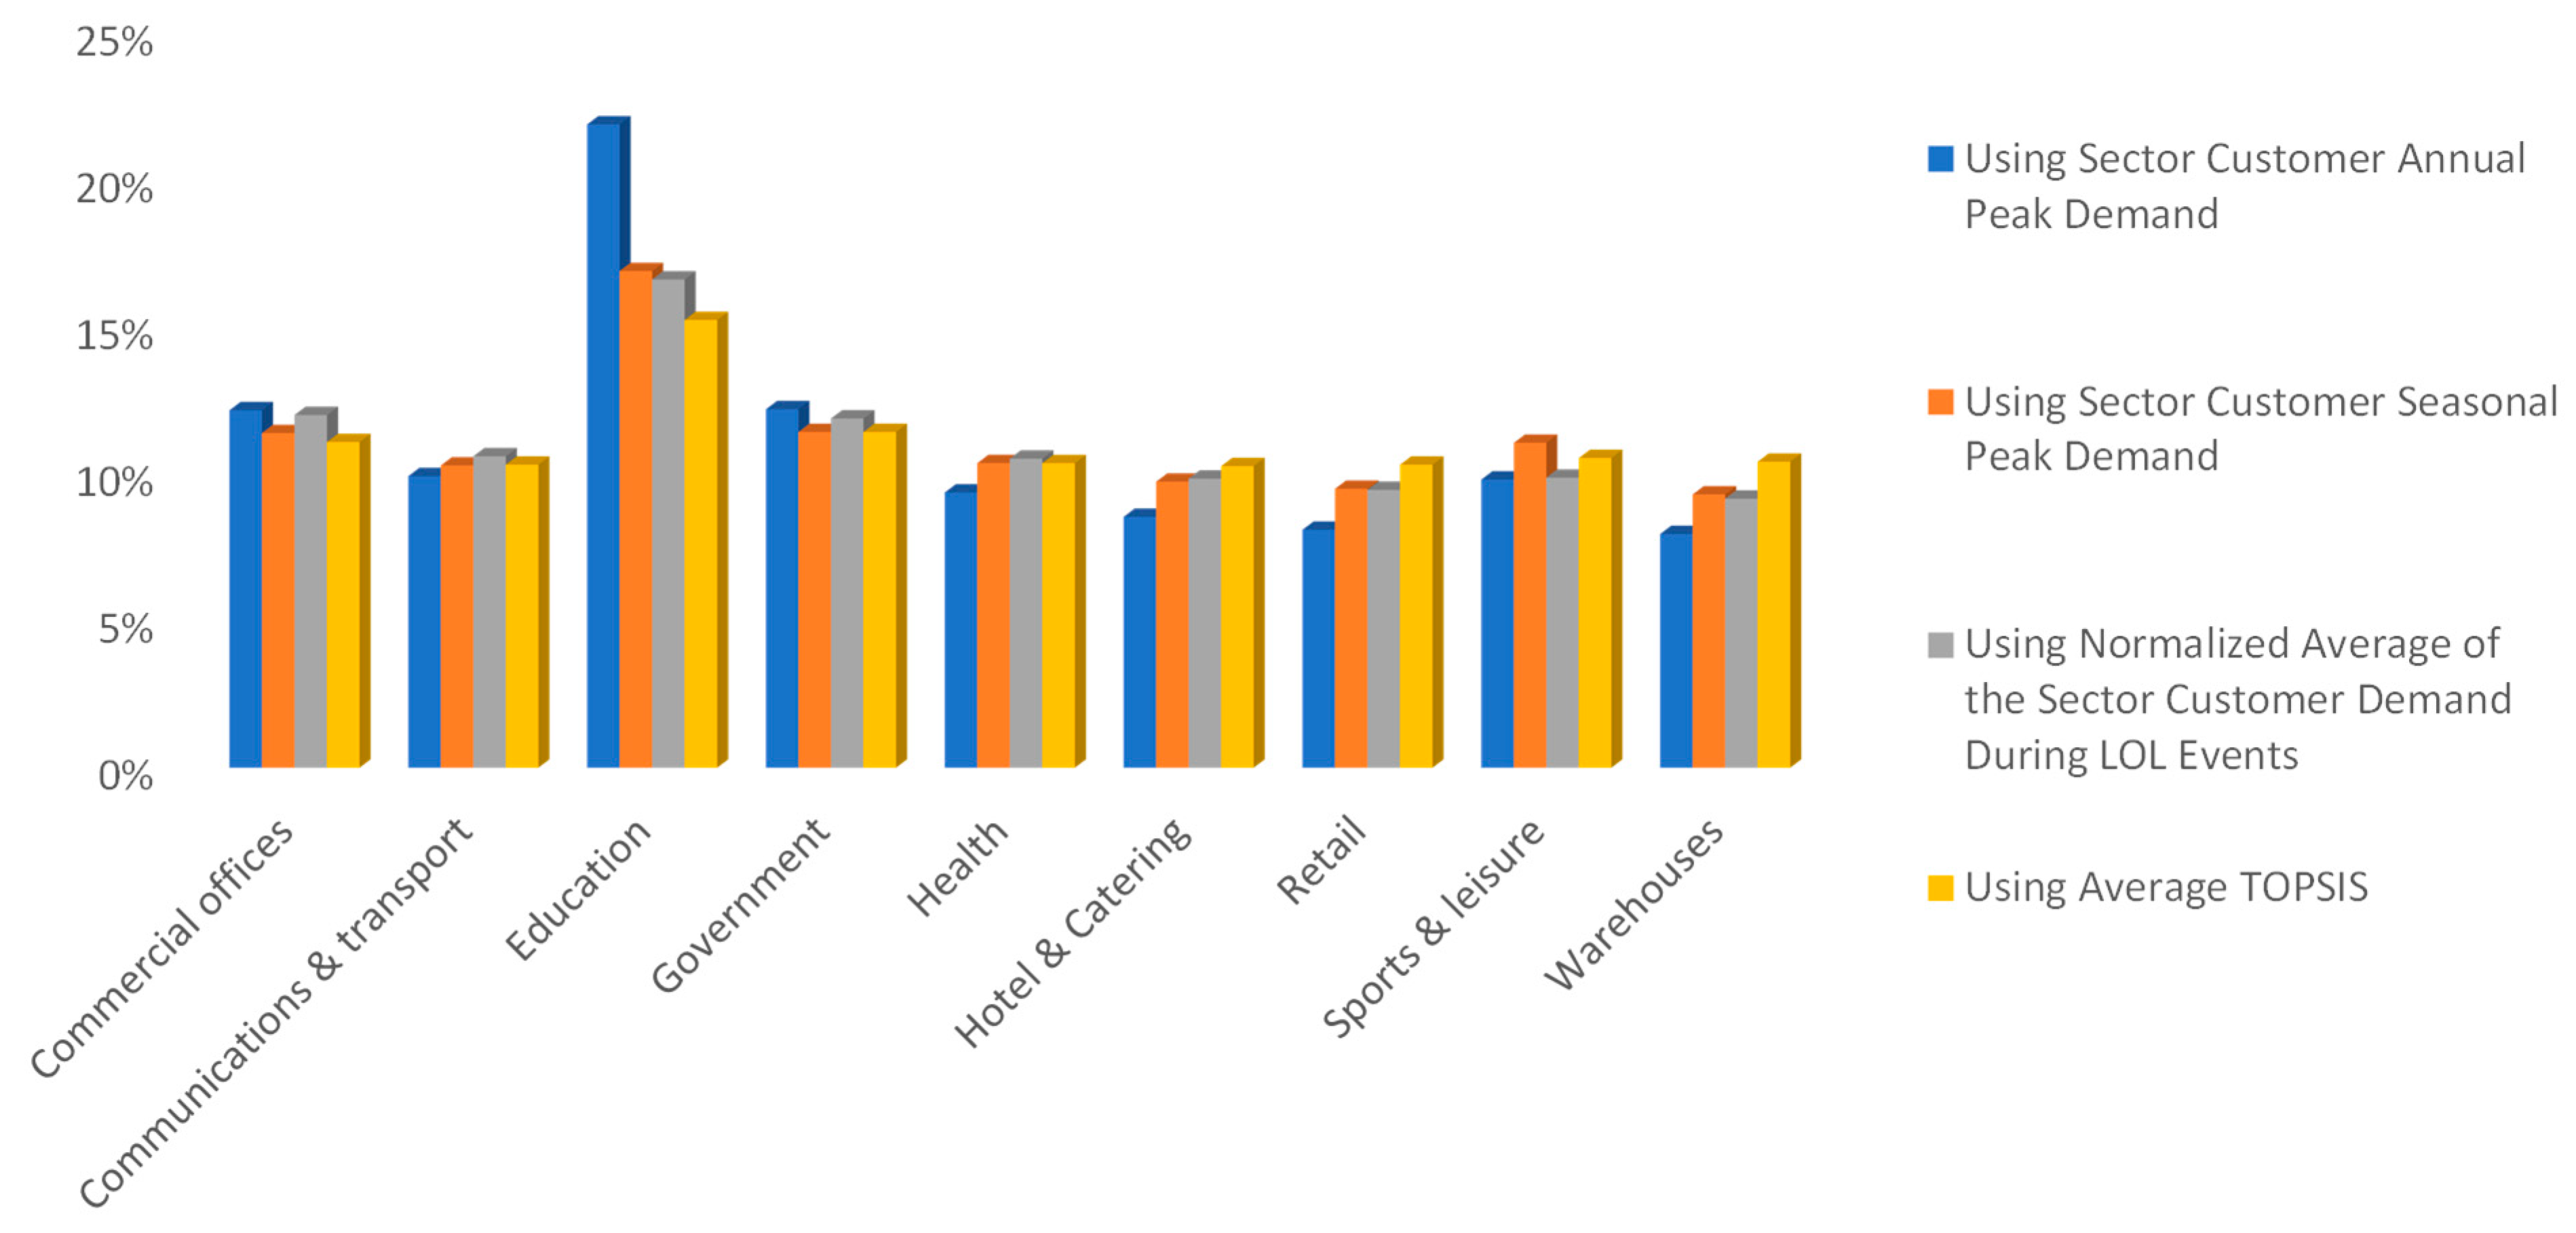
Figure 14 compares all four techniques used to calculate the proportion of CRI accountability for each customer segment.
As seen, the education sector would be responsible for more allocation of reliability improvement calculated by all four methods. This is mainly because in this case study, the peak demand for this sector is higher than other sectors. The normalized average demand tends to distribute the cost of reliability more evenly amongst different customer sectors, which is mainly because of using average values of demand for different sectors in this method, as seen in
Figure 14. The main difference between the allocation amongst different sectors will be observed in the method using the annual peak demand. This is because the peak demand would be different for different sectors over a year.
Choosing a method for distributing reliability costs amongst customers would be the decision of the utility and electricity providers. However, among different methods of reliability cost allocation, it appears that the average TOPSIS approach would give a fairer cost allocation compared to others because the average TOPSIS method considers a more detailed analysis of loads and the reliability aspects of standalone microgrids.
8. Conclusions
The allocation of CRI from various customer sectors in SMG systems was explored in this study utilizing four alternative methodologies. This is the first study to investigate CRI allocation and provide potential solutions to this research problem based on a thorough literature assessment. The peak demand-based technique used in traditional economic dispatch problems is utilized for this research problem in the first two recommended strategies. Furthermore, a novel method of assessing LOL occurrences and identifying the load requirement of each sector that occurs during each LOL event has been successfully implemented. Furthermore, the TOPSIS approach is successfully employed to answer this research problem, using assumptions of three alternative worst-case load demand values. Furthermore, the outcomes of all four approaches have been contrasted and disputed. According to the TOPSIS method results, the education sector should be held accountable for paying more (15.24% of CRI) of the fixed rates to the SMG operator. Furthermore, a detailed comparison of the data produced from all four recommended methodologies was carried out. In addition, the application of these four alternative approaches was examined in this research.
With nine different client sectors, this study effectively tested and explored the concept of penalizing the customer based on a mismatch of generation profile with load demand profile in the presence of renewable energy resources. The research is carried out by simulating a conceptual SMG using data from the DeMontfort University database. This research makes use of hourly weather data; hence, the research outcome is dependent on the hourly load profile of each customer sector. As a result, it is advised that a similar research effort be carried out in the future using real-time data from an existing SMG system. It is also suggested to employ a higher sample rate of data, such as half-hourly, every 10 min, or every 5 min. It is feasible to obtain data from each customer load on an hourly, half-hourly, or five-minute basis using smart meter technology in smart grids. One potential direction for this research in the future would be to run a simulation study using the data that has been gathered.
The responsibility of determining how to distribute reliability expenses among customers lies with utility companies and electricity providers. Nevertheless, when it comes to various approaches for allocating these costs, it appears that the average TOPSIS methodology stands out as a more equitable option compared to others. This preference arises from the comprehensive analysis it offers concerning load patterns and the reliability factors associated with standalone microgrids.


