Article

A Simulation and a Computational Study on the Reliability Verification of Epoxy Resin Paper-Impregnated Bushings in Power Transformers

1
China Yangtze Power Co., Ltd., Beijing 100032, China
2
Nanjing Electric High Voltage Bushing Co., Ltd., Nanjing 210046, China
3
Shenzhen International Graduate School, Tsinghua University, Shenzhen 518055, China
*
Authors to whom correspondence should be addressed.
Energies 2025, 18(13), 3239; https://doi.org/10.3390/en18133239
Submission received: 15 May 2025 / Revised: 16 June 2025 / Accepted: 18 June 2025 / Published: 20 June 2025

Abstract

:
Epoxy resin paper-impregnated bushings, as critical insulating components in power transformers, are subjected to complex electric fields, thermal fields, and mechanical stresses over extended periods. Their performance stability is directly linked to the safe operation of transformers. Given the significant costs associated with their production, reliability verification is a crucial aspect of their design and manufacturing process. This study employs the finite element simulation technology to systematically investigate the electric field distribution characteristics, thermal field distribution characteristics, and seismic performance reliability verification methods of epoxy resin paper-impregnated bushings. The simulation and calculation results indicate that for bushings with rated voltages of 40.5 kV, 72.5 kV, and 126 kV, the maximum radial electric field strengths are 1.38 kV/mm, 2.74 kV/mm, and 3.0 kV/mm, respectively, with axial electric field strengths all below allowable values. The insulation margin meets the 1.5 standard requirements. Under short-circuit conditions, the thermal stability analysis of the bushings reveals that the final conductor temperatures are all below 180 °C, indicating sufficient safety margins. All three types of bushings comply with the design requirements for an 8-degree earthquake intensity and are capable of effectively withstanding seismic loads. This research provides a theoretical foundation for the development and application of epoxy resin paper-impregnated bushings, offering a significant engineering application value in enhancing the safety and stability of transformers and power systems.

1. Introduction

As core insulating components in power transformers, the bushings primarily serve insulation and support functions and play a significant role in power systems [1,2,3]. With the continuous increase in voltage levels in power systems and the development of power equipment toward high capacity and high reliability, the performance stability of epoxy resin paper-impregnated bushings directly impacts the safe operation of transformers and the entire power system [4,5]. However, the research and production costs of epoxy resin paper-impregnated bushings are high, and during long-term operation, they are subjected to the combined effects of electric field, thermal field, and mechanical stresses. Therefore, conducting scientific reliability verification is of great significance [6,7].
In recent years, epoxy resin paper-impregnated bushings have gained prominence as replacements for traditional oil-paper bushings in power systems, owing to their superior electrical and mechanical properties [7,8]. However, due to the complex physical characteristics of epoxy resin materials, these bushings may encounter challenges such as uneven electric field distribution, thermal accumulation, and mechanical damage under extreme operating conditions like earthquakes [6,7,9,10]. The non-uniform electric field distribution is the core risk factor that causes various physical and chemical deterioration processes and significantly reduces the operational reliability of epoxy resin-impregnated gaskets during actual operation. The non-uniform electric field will cause the electric field in certain areas to be excessively high and prone to inducing spatial charge accumulation, local discharge, and aging of electrical tree branches [1]. The heat generated by local discharge and active particles will further damage the epoxy material, and through multi-stress coupling effects such as thermal–electrical–mechanical–chemical effects, accelerate the insulation aging process [2,3]. The strong shock and vibration brought by earthquakes will cause the gasket to bear mechanical loads far exceeding those during normal operation. In high-humidity and hot regions, the epoxy resin and corrugated paper will absorb moisture, which increases their conductivity and dielectric loss, making them more prone to loss of heat and breakdown problems.
Consequently, the scientific verification of their reliability, the optimization of design parameters, and the enhancement of their overall performance have become focal points in the current research landscape of power equipment development. Existing studies have demonstrated that the finite element simulation technology can effectively analyze the electric field distribution characteristics of bushings and optimize their insulation structure design [11,12]. Based on the actual geometric shape, material properties, and operating conditions of the power transformer, detailed models of the gasket and its surrounding components are established. By setting accurate mathematical models and boundary conditions, finite element simulation can accurately predict the temperature and mechanical stress distribution of the equipment during actual operation [13]. Comparing the actual working environment of the high-voltage direct current bushing with the temperature and mechanical stress tolerance capabilities of the material, the thermal stability and mechanical stability of the bushing can be predicted.
Currently, researchers worldwide have achieved certain accomplishments in the performance study of epoxy resin paper-impregnated bushings. Xu and others established an electric field simulation model for epoxy resin paper-impregnated bushings after faults, analyzing the electric field distribution under normal operation, insulation breakdown, and internal bubble conditions. Simulation results revealed that bushing explosion faults are caused by the combined effects of bubbles, moisture penetration, bushing head deformation, and short-circuit current impacts [14]. Thermal field analysis methods have also been widely applied to assess the thermal stability of bushings. Yadav and others improved the thermal resistance of bushings by modifying epoxy resin with nano hexagonal boron nitride and adding nanocellulose fibers, achieving a thermal performance improvement of approximately 4.19%. The proposed neural network model effectively predicts temperature distribution with minimal deviation (<2%) compared to experimental values, providing a reliable method for optimizing high-voltage bushing heat dissipation management [15]. Seismic performance studies have also provided theoretical support for the application of bushings in earthquake-prone regions [15,16]. However, existing research primarily focuses on the performance variation patterns of bushing equipment under different defects, while the integrated reliability verification methods for electric field, thermal field, and seismic performance designs remain incomplete. Systematic reliability verification techniques for epoxy resin paper-impregnated bushings under high voltage levels and complex operating conditions still require further exploration.
This study is based on the finite element simulation technology and theoretical calculation methods, systematically investigating the reliability verification methods for epoxy resin paper-impregnated bushings in terms of their electric field distribution characteristics, thermal field distribution characteristics, and seismic performance. The research aims to provide a theoretical foundation for the development and engineering application of high-voltage bushings. The study encompasses a comprehensive analysis of the bushings’ electric field distribution, thermal field distribution, and seismic performance, as well as an in-depth exploration of their reliability verification methods. This research will offer scientific guidance for enhancing the design level and reliability of epoxy resin paper-impregnated bushings, contributing to the safety and stability of transformers and power systems, and holds significant engineering application value.

2. Simulation and Test Methods

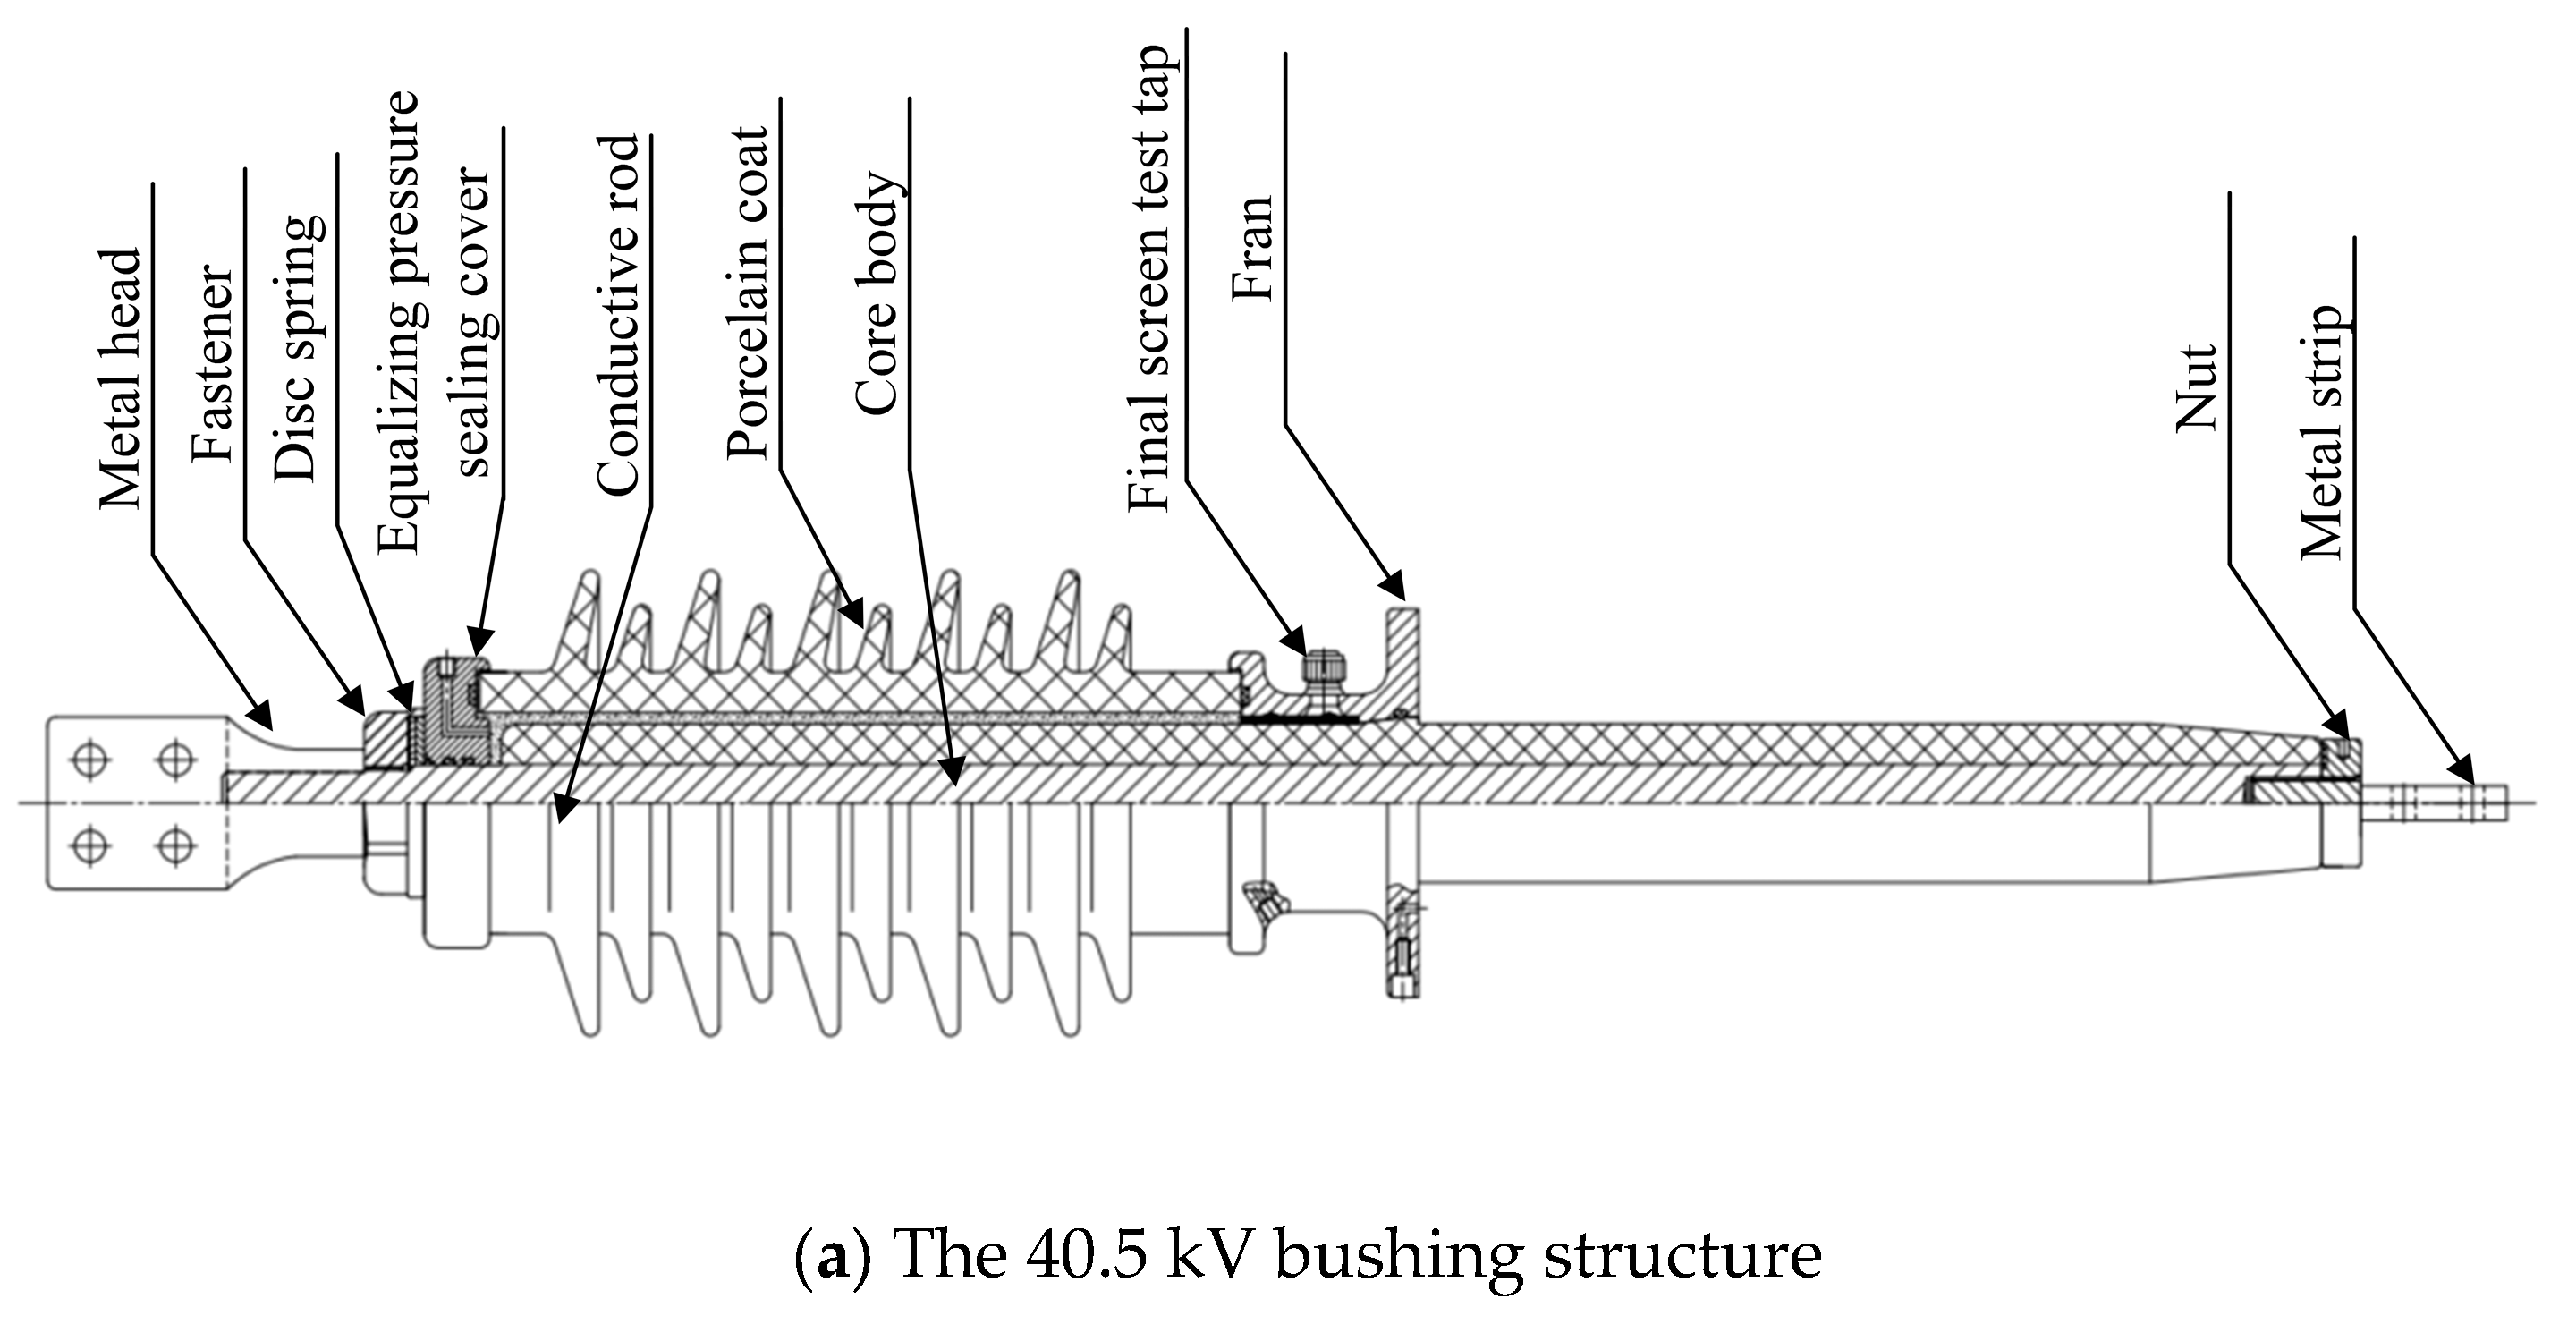
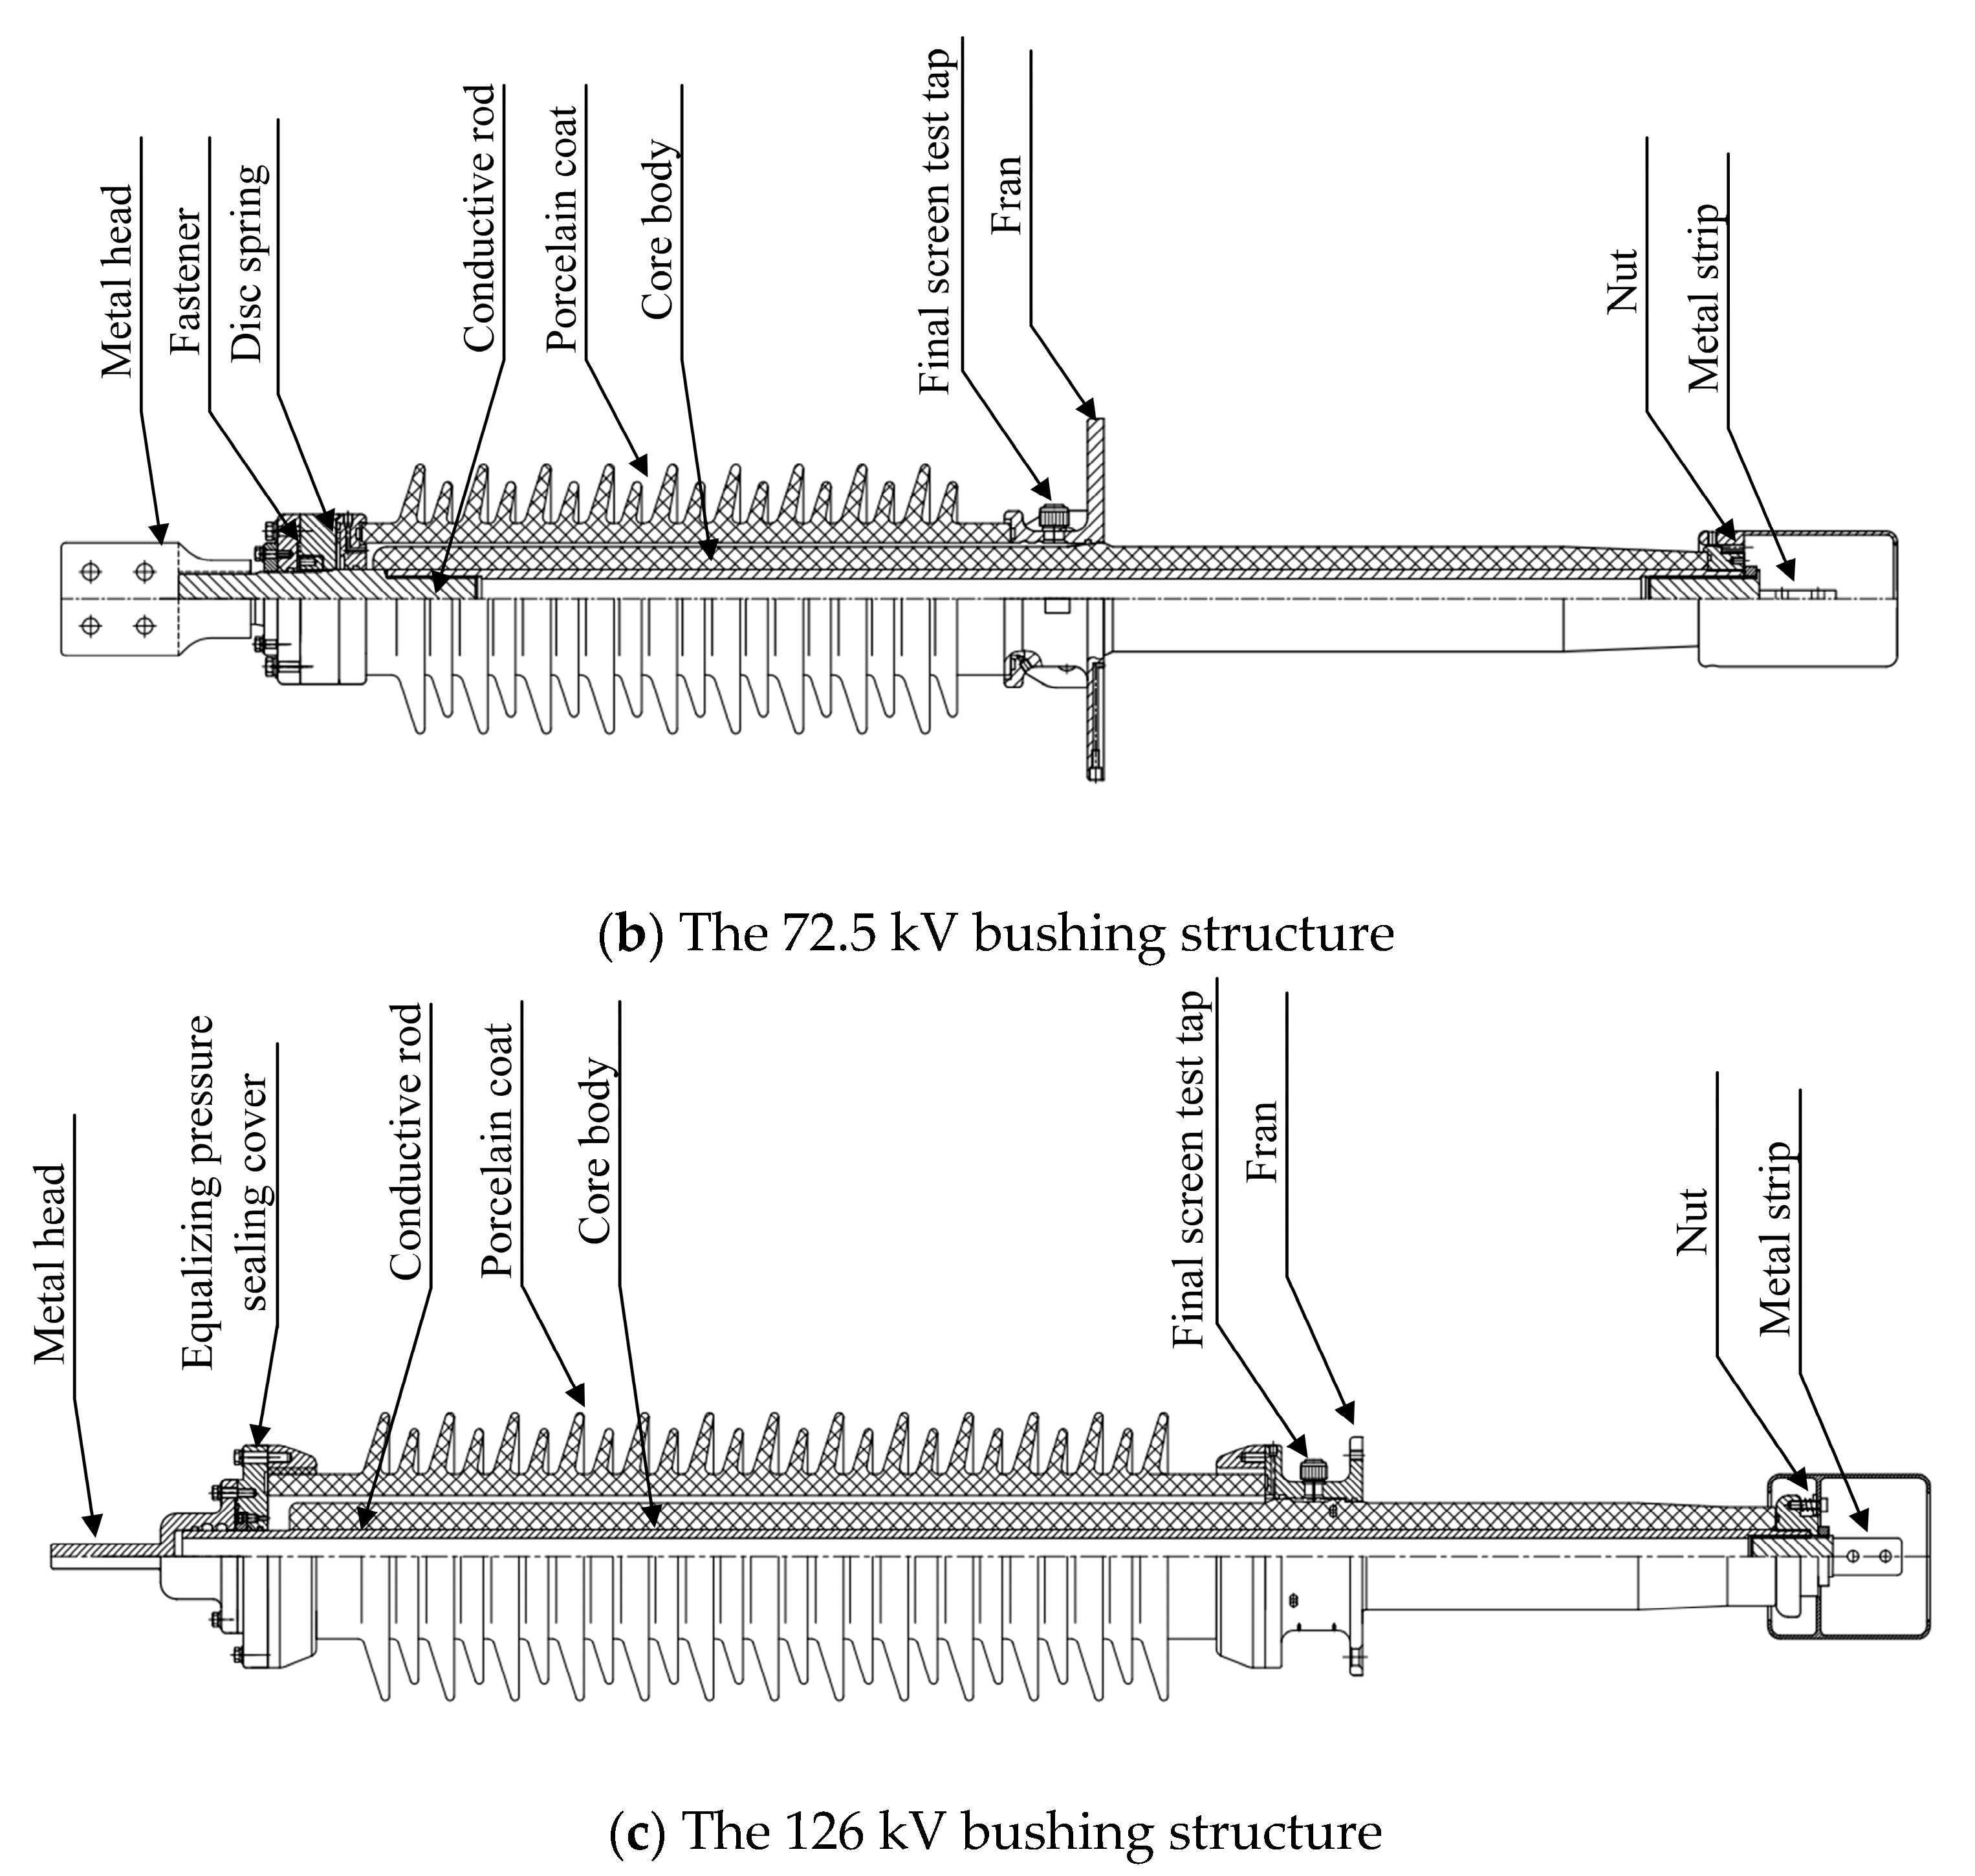
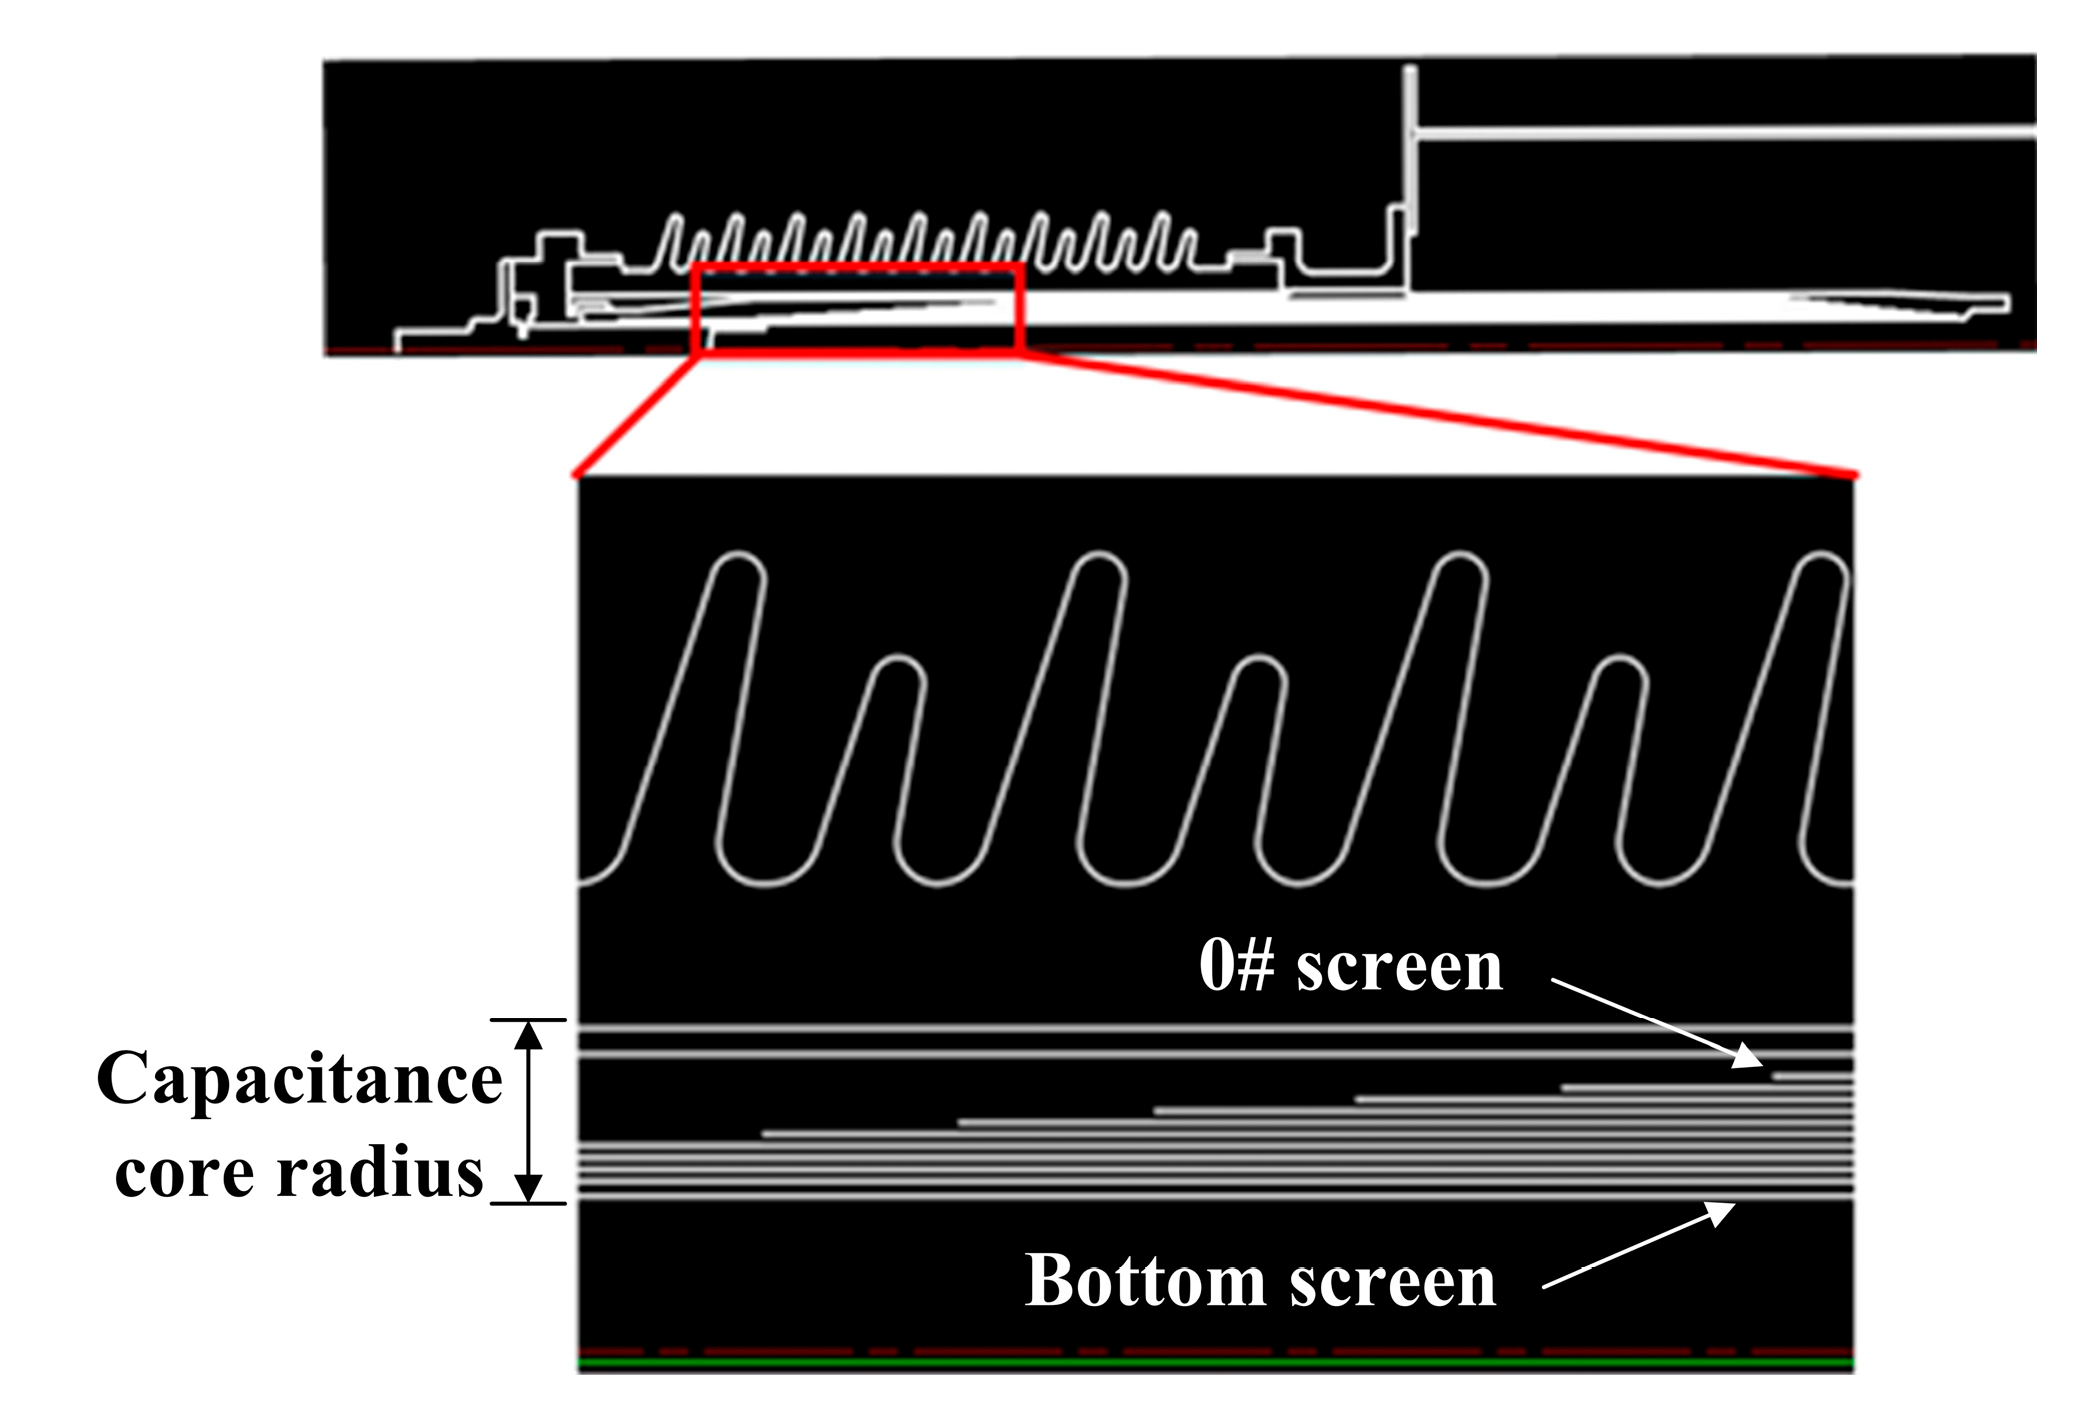
2.1. Geometric Model

The structures of the three bushings with different voltage ratings are illustrated in Figure 1. The 40.5 kV, 72.5 kV, and 126 kV bushings all adopt an integral current-carrying structure where the winding rod serves as the current-carrying rod. The primary components include the air-side terminal plate, porcelain housing, main flange, epoxy resin-impregnated paper core, and oil-side terminal plate. The main flange of the bushing is bonded to the core, and the porcelain housing is securely fastened using a Belleville spring clamp. The space between the porcelain housing and the core is filled with insulating paste, forming the outer insulation. The oil-side terminal plate is threaded onto the conductive rod and secured with a locking nut. The 72.5 kV bushing incorporates additional components such as a metallic washer, a connector assembly, and a voltage balancing sphere, with a clamping force of approximately 16 kN. For the 126 kV bushing, additional elements include a conductive head, a voltage balancing seal cover, and a conductive rod. Current flow is achieved at the head through two spring contact fingers between the conductive tube and the conductive head.
Under the dual requirements of addressing field strength safety and process suitability, the inter-screen voltage distribution is coordinated with the partial discharge inception voltage to ensure that the bushing’s insulation structure and material properties align with operational conditions. A design methodology employing uniform thickness with graded steps is implemented, where axial field strength is maintained below permissible limits by regulating umbrella-step and tail-step differentials to control step dimensions, thereby achieving sufficient insulation design margins. The 40.5 kV, 72.5 kV, and 126 kV bushings incorporate 7, 8, and 10 capacitive grading screens, respectively. The simulation model of the 126 kV bushing, as illustrated in Figure 2, serves as a representative example. The dimensions of bushing screens for three different voltage levels of bushings are shown in Table 1.

2.2. Mathematical Models

2.2.1. A Mathematical Model for Electric Field Simulation

The bushings studied in this paper are subjected to the combined effects of AC and DC voltages, resulting in electric field distributions in the epoxy resin capacitor core that are influenced by both conductivity and permittivity [14,17]. The simulation frequency of the electric field of the bushing is 50 Hz. At this time, the electromagnetic wave length is much larger than the size of the bushing, and the displacement current is much smaller than the conducted current, meeting the quasi-static condition. At this point, the time-varying effect of the magnetic field can be ignored, and the electric field can be solved independently. The fundamental equations governing electric field distribution can be derived and solved using Maxwell’s equations.
D = ρ e
× E O
× H = J + D t
D = ε E
J = γ E
E = φ
where D is the electric displacement vector, C/m2; E is the electric field intensity, V/m; ρ e is the charge density, C/m3; H is magnetic field strength, A/m; J is current density, A/m2; ε is permittivity, F/m; γ represents the electrical conductivity of the material, indicating the ability of the material to conduct electric current, S/m; φ is electric potential, V.
By combining Equations (1), (2), and (4), we can obtain:
ε φ = ρ e
2 φ = ρ e ε
Epoxy resin-impregnated paper can be regarded as an ideal medium without free charge at power frequency. Therefore, in Equation (8), it is directly assumed that ρe = 0. When free charge effects are neglected in the computational domain, the governing equation is reduced to:
2 φ = 0
Under operational conditions, bushings are subjected to combined AC/DC voltages, leading to time-varying electric fields. To calculate the electric field under such conditions, the displacement-induced electric field and steady-state conduction field must be superimposed, yielding the following governing equation:
J = ρ e t
Then, we can obtain:
r E + ε E t = 0
Substituting Equation (6) into Equation (11) yields:
γ + ε t 2 φ = 0
Equation (12) accounts for the effects of conduction current and displacement current on the electric field, enabling the determination of the electric field distribution. This study incorporates temperature dependence, where the conductivity γ is defined as a function of T:
γ = 2.21 × 10 7 e 4.826 T
where γ is the electrical conductivity of the material used in the simulation, indicating the material’s ability to conduct current, S/m; T is temperature, °C.

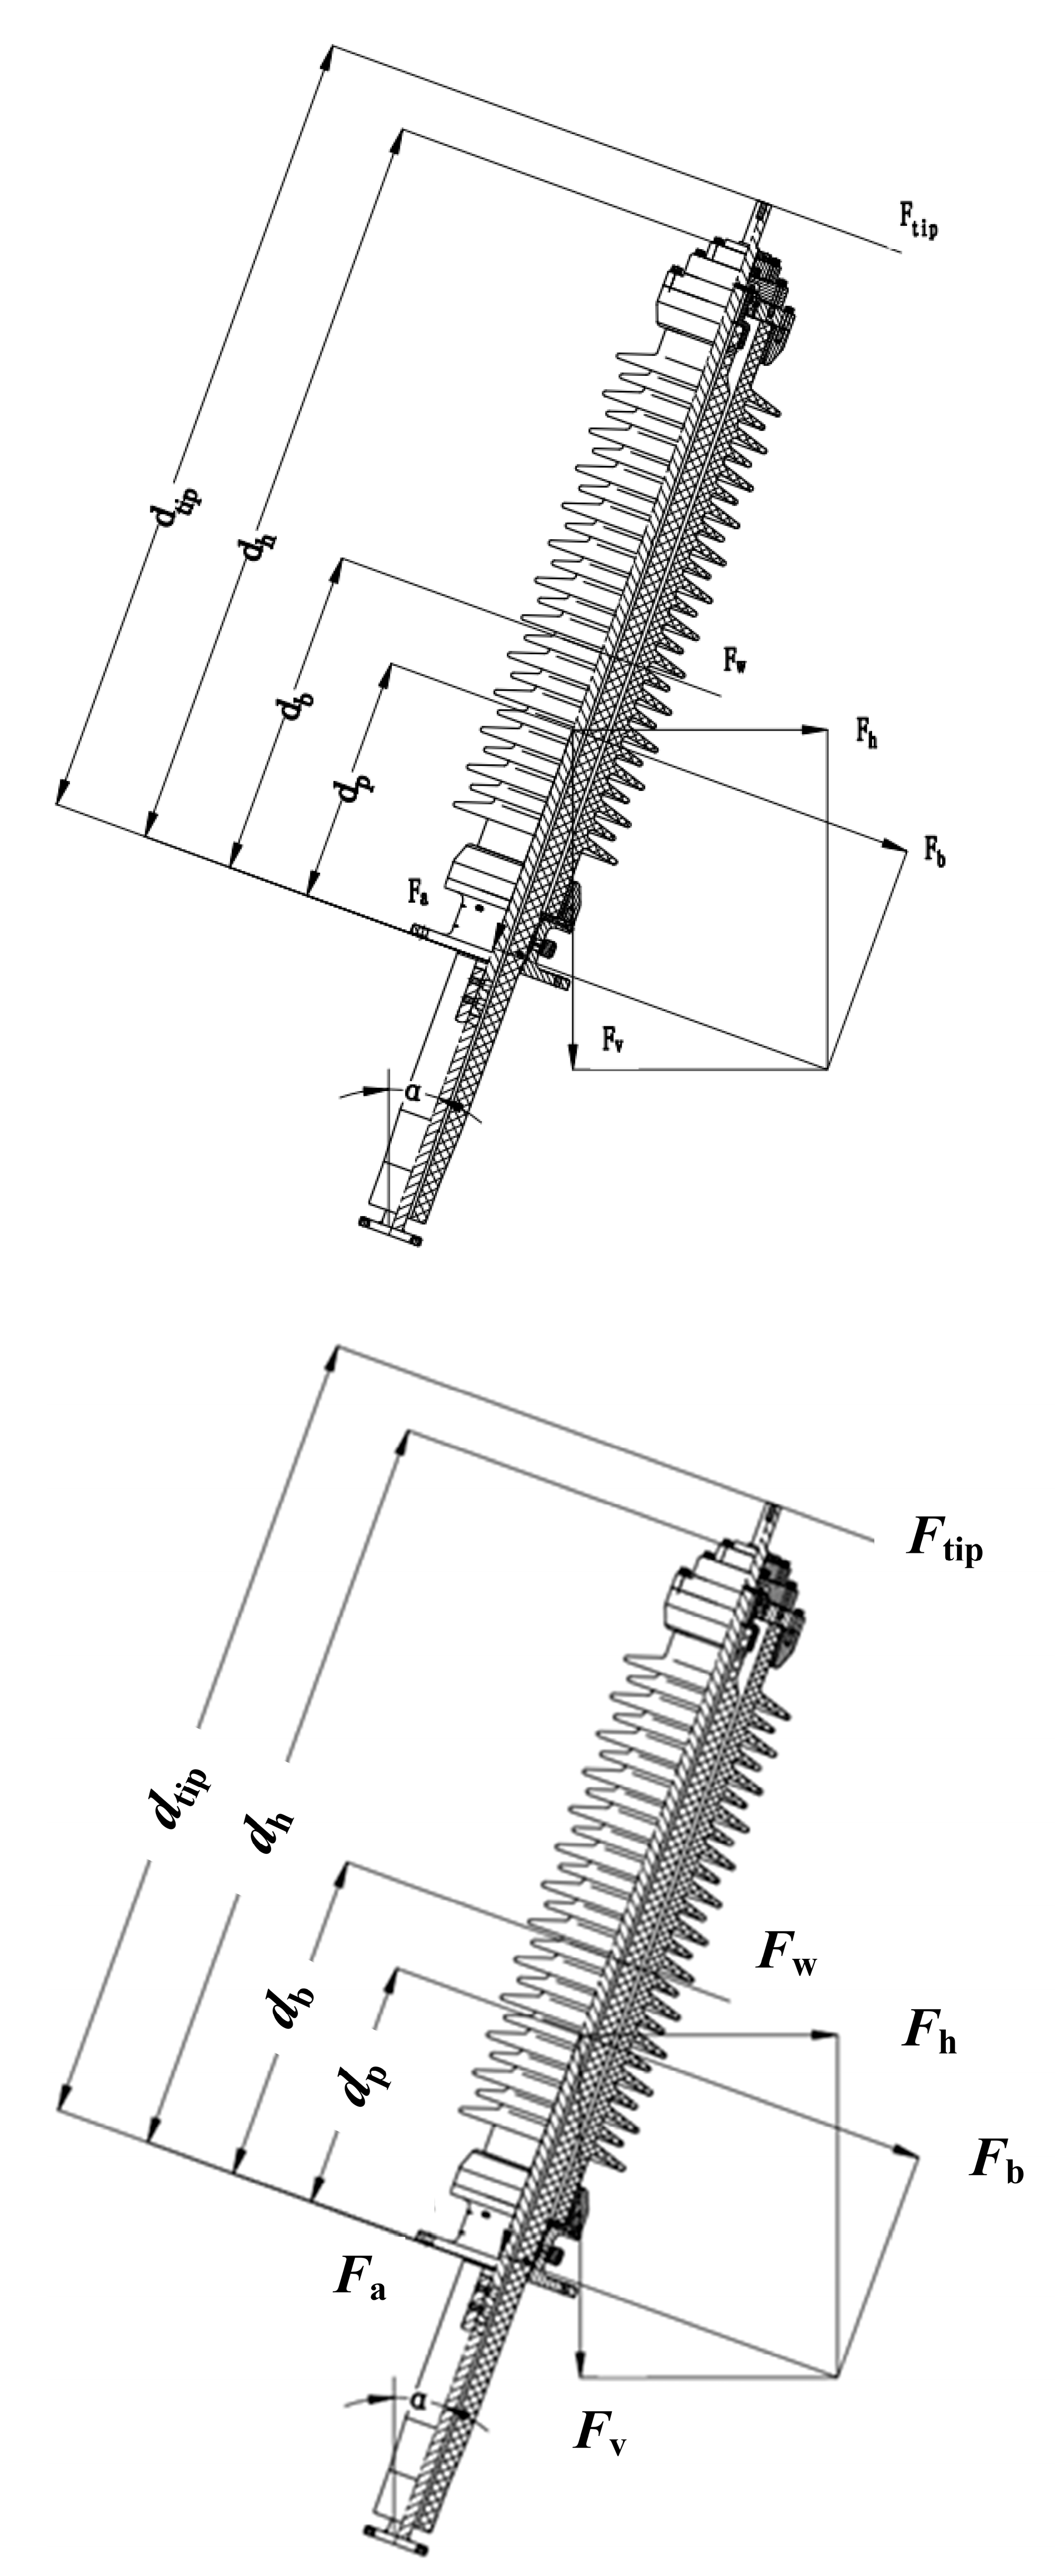
2.2.2. A Mathematical Model for Seismic Performance

According to IEC TS 61463 [18], the seismic capability of bushings is verified by primarily assessing whether the failure torque of the fiberglass tube at its critical section can meet (exceed) the total bending moment occurring during an earthquake (which includes bending moments caused by seismic loads, wind loads, and terminal loads). The seismic calculation diagrams for bushings of different voltage levels are illustrated in Figure 3.
The horizontal forces, vertical forces, pressure, and bending moments induced by seismic loads can be calculated using Equations (14)–(17).
F h = m p × K × a g h × R × S c
F v = m p × K × a g v × R × S c + m p g
F a = F h × sin α + F v × cos α
F b = F h × cos α + F v × sin α
where agh is the horizontal ground acceleration, m/s2; agv is the vertical ground acceleration, m/s2; the horizontal acceleration of the transformer tank is K × agh, and the vertical acceleration of the transformer tank is K × agv, where K is an amplification factor, taken as 2; mp is the mass of the bushing, kg; α is the installation angle in the vertical plane; R is the response coefficient, taken as 2.5; Sc is the coefficient considering multi-frequency excitation and multi-mode response, taken as 1.5.
Then, the seismic- and gravitation-induced bending moments can be calculated using Equation (18), where Fb is the bending force, N; dp is the distance between the centroid of the bushing and the critical cross-section, mm.
M b s = F b × d p
The wind load calculation is given by Equation (19), and the bending load caused by wind load can be calculated using Equation (20).
F w = P × ( D e + D i ) × d h ÷ 2
M b w = F w × d b
Here, P represents wind pressure, Pa; De is the maximum outer diameter of the umbrella skirt, mm; Di is the outer diameter of the umbrella core, mm; dh is the distance from the critical cross-section to the top of the bushing, mm; Fw is wind force, N; and db is the centroid at the gas end, mm.
The equation for the bending moment caused by terminal load is provided by Equation (21), where dtip denotes the distance from the critical cross-section to the terminal, mm; Fop is the cantilever working load, N.
M b t i p = 0.7 F o p × d t i p
The total bending moment occurring during an earthquake can be calculated using Equation (22).
M = M b s + M b w + M b t i p
Next, the bending moment failure value of the critical section of the hollow composite insulator used with the bushing is calculated using Equations (23) and (24).
M D = Z × σ
Z = π ( D 4 d 4 ) / ( 32 D )
In the equations, Z represents the flexural modulus of the porcelain outer sleeve, Mpa; D is the outer diameter at the root of the porcelain outer sleeve, m; d is the inner diameter at the root of the porcelain outer sleeve, m; σ denotes the flexural failure stress of the porcelain material, Mpa. If the calculated bending moment M < MD, it is concluded that the bushing can withstand the seismic intensity corresponding to the given earthquake magnitude.

2.2.3. A Mathematical Model for Thermal Short-Circuit Current

According to GB/T 4109-2022 Clause 8.9.3, if the θf does not exceed 180 °C, the bushing is considered capable of withstanding the standard thermal short-circuit current Ith [19]. If θf is less than 180 °C, the thermal short-circuit current withstand test may be exempt. The capability of the bushing to withstand the Ith standard is calculated using Equation (25):
θ f = θ 0 + α I t h 2 S t × S e × t t h
where θf is the final temperature of the conductor, °C; θ0 is the conductor temperature under continuous operation at the current Ir with an ambient temperature of 40 °C,°C; α is a coefficient, equal to 0.8(k/s)/(kA/cm2)2 for copper and 1.8(k/s)/(kA/cm2)2 for aluminum; tth is the specified rated duration, s; Ith is the standard value specified above, kA; St is the total cross-sectional area corresponding to Ir, cm2; Se is the equivalent cross-sectional area considering the skin effect, cm2, and is calculated using Equation (26):
S e = π d ( D d )
where D is the diameter of the circular cross-section conductor, cm; d is the penetration depth of the current, cm, and is calculated using Equation (27):
d = 1 2 π ρ × 10 3 f
where ρ is the resistivity, μΩ·cm; f is the frequency, set to 50 Hz. If the calculated θf is less than 180 °C, the bushing is considered capable of withstanding the standard value, Ith.

2.2.4. A Mathematical Model for Thermal Field Simulation

The heat transfer in the bushings usually occurs in three forms: heat conduction, heat convection, and heat radiation. Since the heat transferred through radiation in the bushing is relatively small, radiation heat transfer is ignored in the simulation study. The solid-side heat conduction equation is as follows [20]:
k r r r T c r + k 2 T c Z 2 + Q c = 0
where Tc represents the temperature of the core material, °C; k is the thermal conductivity; Qc is the heat flux of the core material, J/(m2·s). The heat transfer equation for convective heat transfer on the gas side is as follows:
Q g = h A T c T g
where Qg represents the convective heat transfer flux between the bushing surface and the gas, W; h is the convective heat transfer coefficient; A is the effective area of the gas–solid interface, m2; Tg is the gas temperature at the solid surface, °C. The governing equations considering both heat conduction and heat convection are as follows:
ρ c p u T g = k T g + Q g ρ u = 0
where ρ represents the density of the gas, kg/m3; cp is the specific heat capacity of the gas at constant pressure, J/(kg·K); u represents the velocity of the gas molecules, m/s.

2.3. Model Parameters and Boundary Conditions

The physical fields set in the valve side bushing include alternating current field, solid heat transfer field, and laminar flow field. The boundary conditions of the bushing simulation model are shown in Table 2, and the parameter settings are shown in Table 3.

2.4. Bushing Performance Test Methods

Based on the bushing structure described herein, bushings of different voltage levels were manufactured. Testing was conducted in accordance with IEC 60137-2017 [21] for power frequency withstand-voltage test, power-frequency wet withstand-voltage test, lightning impulse full-wave test, partial discharge test, and temperature rise test. A seismic test was performed in compliance with GB/T 50260 [22]. Testing encompassed destructive and type tests. The power frequency withstand test was destructive, with voltage applied continuously until breakdown occurred. The power frequency wet withstand test required 42.5/72.5/126 kV bushings to withstand 95/141/230 kV voltages for 60 s to qualify as compliant. The temperature rise test required 42.5/72.5/126 kV bushings to withstand 1250 A current for 5 h with a 1 h stabilization period. Oil temperature was measured post-testing completion. All tests were conducted at the Testing Center of Nanjing Electrical Science and Technology Group Co., Ltd. (Nanjing, China).

3. Results and Discussion

3.1. Simulation of Electric Field Strength in the Epoxy Core

Epoxy resin paper-impregnated bushings operate under high-voltage conditions, with concentrated electric fields at the high-voltage terminals, which can lead to insulation issues over long-term operation. Increasing the outer diameter of the capacitor core and the number of capacitor layers are common methods to optimize electric field distribution and enhance insulation performance. However, increasing the capacitor core size can lead to higher stress concentrations during curing, reduced heat dissipation performance, and increased manufacturing costs [23,24]. In this study, a design method with equal thickness and unequal steps is adopted to optimize the electric field distribution of the bushing. By adjusting the umbrella-step difference and tail-step difference to control the length of the steps, the radial and axial electric field strengths of the bushing are regulated, aiming to make the radial field strength as uniform as possible. Simultaneously, the axial field strength is controlled to be below the allowable axial field strength, ensuring sufficient insulation design margin. The threshold of radial and axial electric field strength is 10 kV/mm, which is determined by the breakdown strength of the epoxy resin.
In this study’s design of the epoxy core, the outer diameter of the 40.5 kV bushing core is selected as 92 mm with 7 layers of capacitor screens; the outer diameter of the 72.5 kV bushing core is 116 mm with 8 layers of capacitor screens; and the outer diameter of the 126 kV bushing core is 130 mm with 10 layers of capacitor screens. The radial and axial electric field strengths of the epoxy core in the three different bushings were simulated and calculated, with the simulation results shown in Figure 4.
The epoxy cores of the 40.5 kV, 72.5 kV, and 126 kV bushings exhibit excellent distribution characteristics in terms of electric field strength and insulation performance, meeting design and operational requirements. Bushings of higher voltage levels have more layers of capacitor cores. The radial electric field strength of the epoxy cores in the 40.5 kV and 126 kV bushings first decreases and then increases, while that of the 72.5 kV bushing gradually rises. Specifically, the maximum radial electric field strength of the 40.5 kV bushing’s epoxy core is 1.38 kV/mm, with a minimum of 1.24 kV/mm; for the 72.5 kV bushing, these values are 2.74 kV/mm and 2.21 kV/mm, respectively; and for the 126 kV bushing, they are 3.0 kV/mm and 2.5 kV/mm. In terms of axial electric field strength, the maximum values at the oil end and air end of the 40.5 kV bushing’s epoxy core are 0.15 kV/mm and 0.07 kV/mm, respectively; for the 72.5 kV bushing, these are 0.19 kV/mm and 0.11 kV/mm; and for the 126 kV bushing, they are 0.3 kV/mm and 0.12 kV/mm. All these values are below the allowable thresholds, indicating uniform and stable electric field distribution. Overall, the epoxy cores of these bushings demonstrate outstanding performance in electric field strength control and insulation properties, effectively satisfying the operational demands of different voltage levels and ensuring the safety and stability of the equipment.

3.2. Bushing Electric Field Simulation

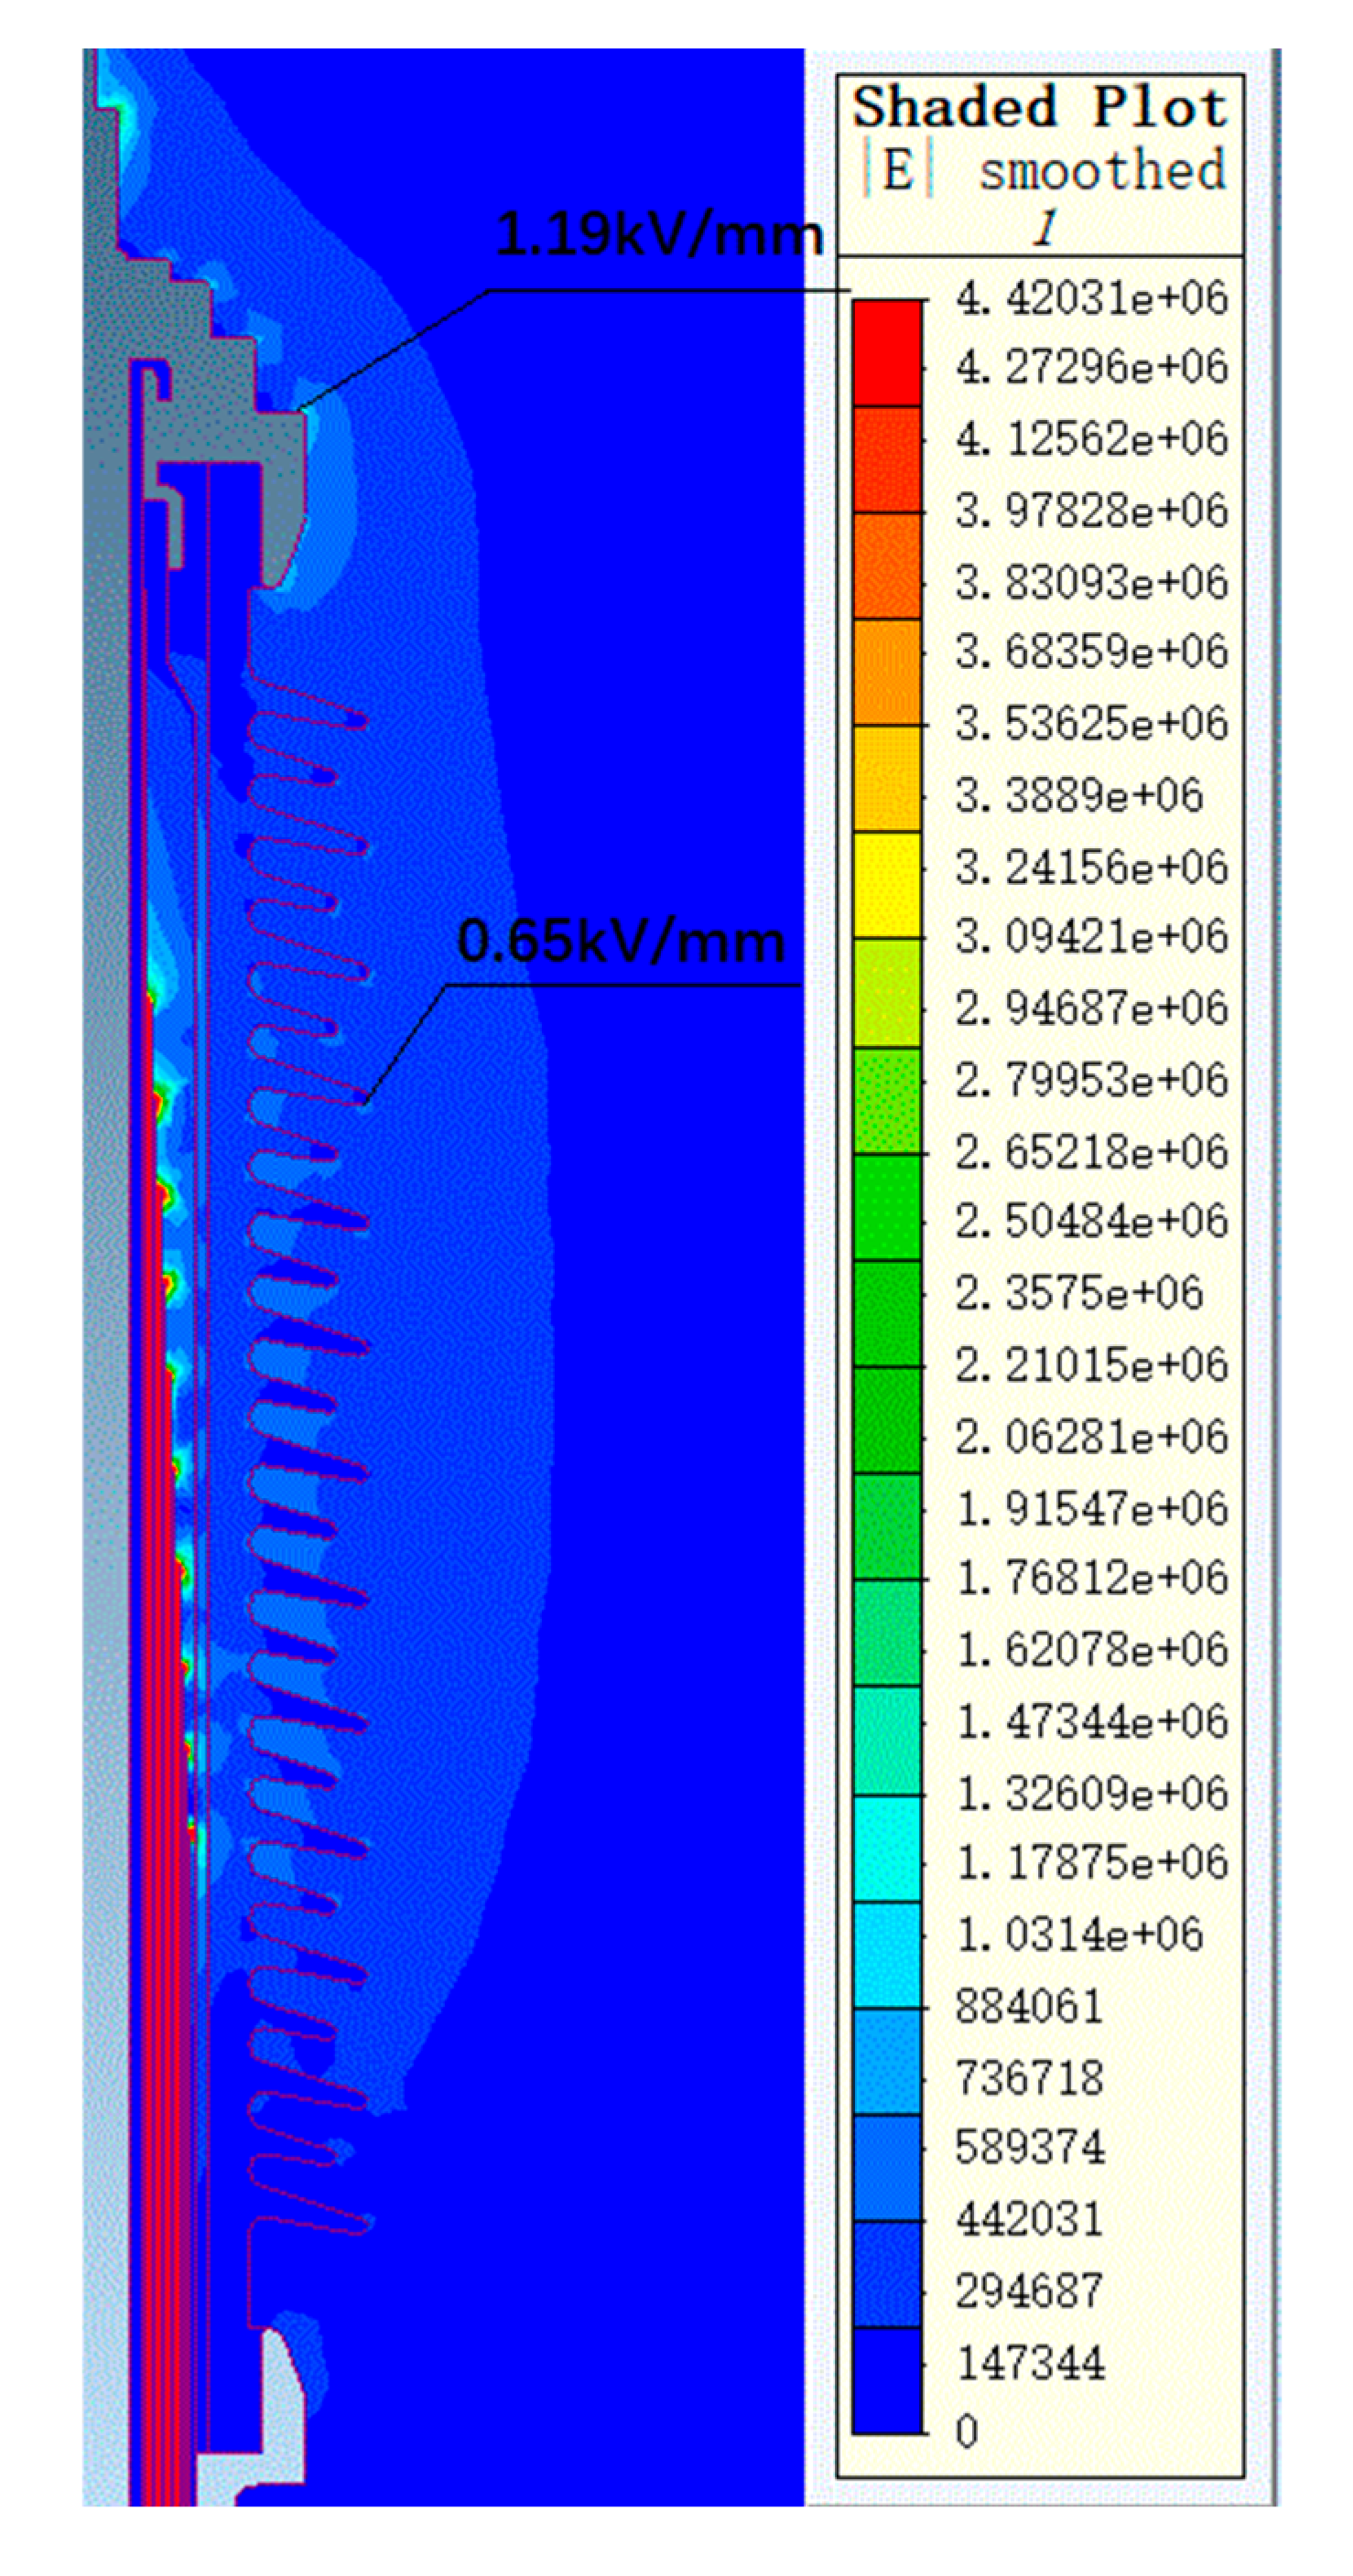
3.2.1. Simulation of the Bushing Electric Field Under Phase Voltage

In high-voltage bushings, due to the presence of capacitor screen structures between the core and the porcelain housing, the electric field distribution may not be uniform. Areas such as the edges of capacitor screens or the surface of the porcelain housing are prone to localized high field strengths. Before actual production, simulation calculations can be used to verify the rationality of the design, avoiding test failures or equipment damage caused by design flaws, thereby reducing development costs and time. The overall electric field distribution characteristics of 72.5 kV and 126 kV bushings under phase voltage were calculated.
Figure 5 shows the overall potential and radial electric field strength distribution of the 72.5 kV bushing under a phase voltage of 41.86 kV. Figure 6 shows the overall potential and radial electric field strength distribution of the 126 kV bushing under a phase voltage of 72.75 kV. It can be observed that, under a phase voltage of 41.86 kV, the highest electric field strength occurs at the first capacitor screen, reaching 2.76 kV/mm, while the lowest electric field strength occurs at the last screen, at 2.32 kV/mm. Under a phase voltage of 72.75 kV, the highest electric field strength at the first capacitor screen is 3.02 kV/mm, while the electric field strength at the last screen is 2.77 kV/mm, with the lowest electric field strength at the intermediate screens being 2.43 kV/mm. The trend of electric field strength distribution across the entire capacitor screen matches the calculated distribution curve.

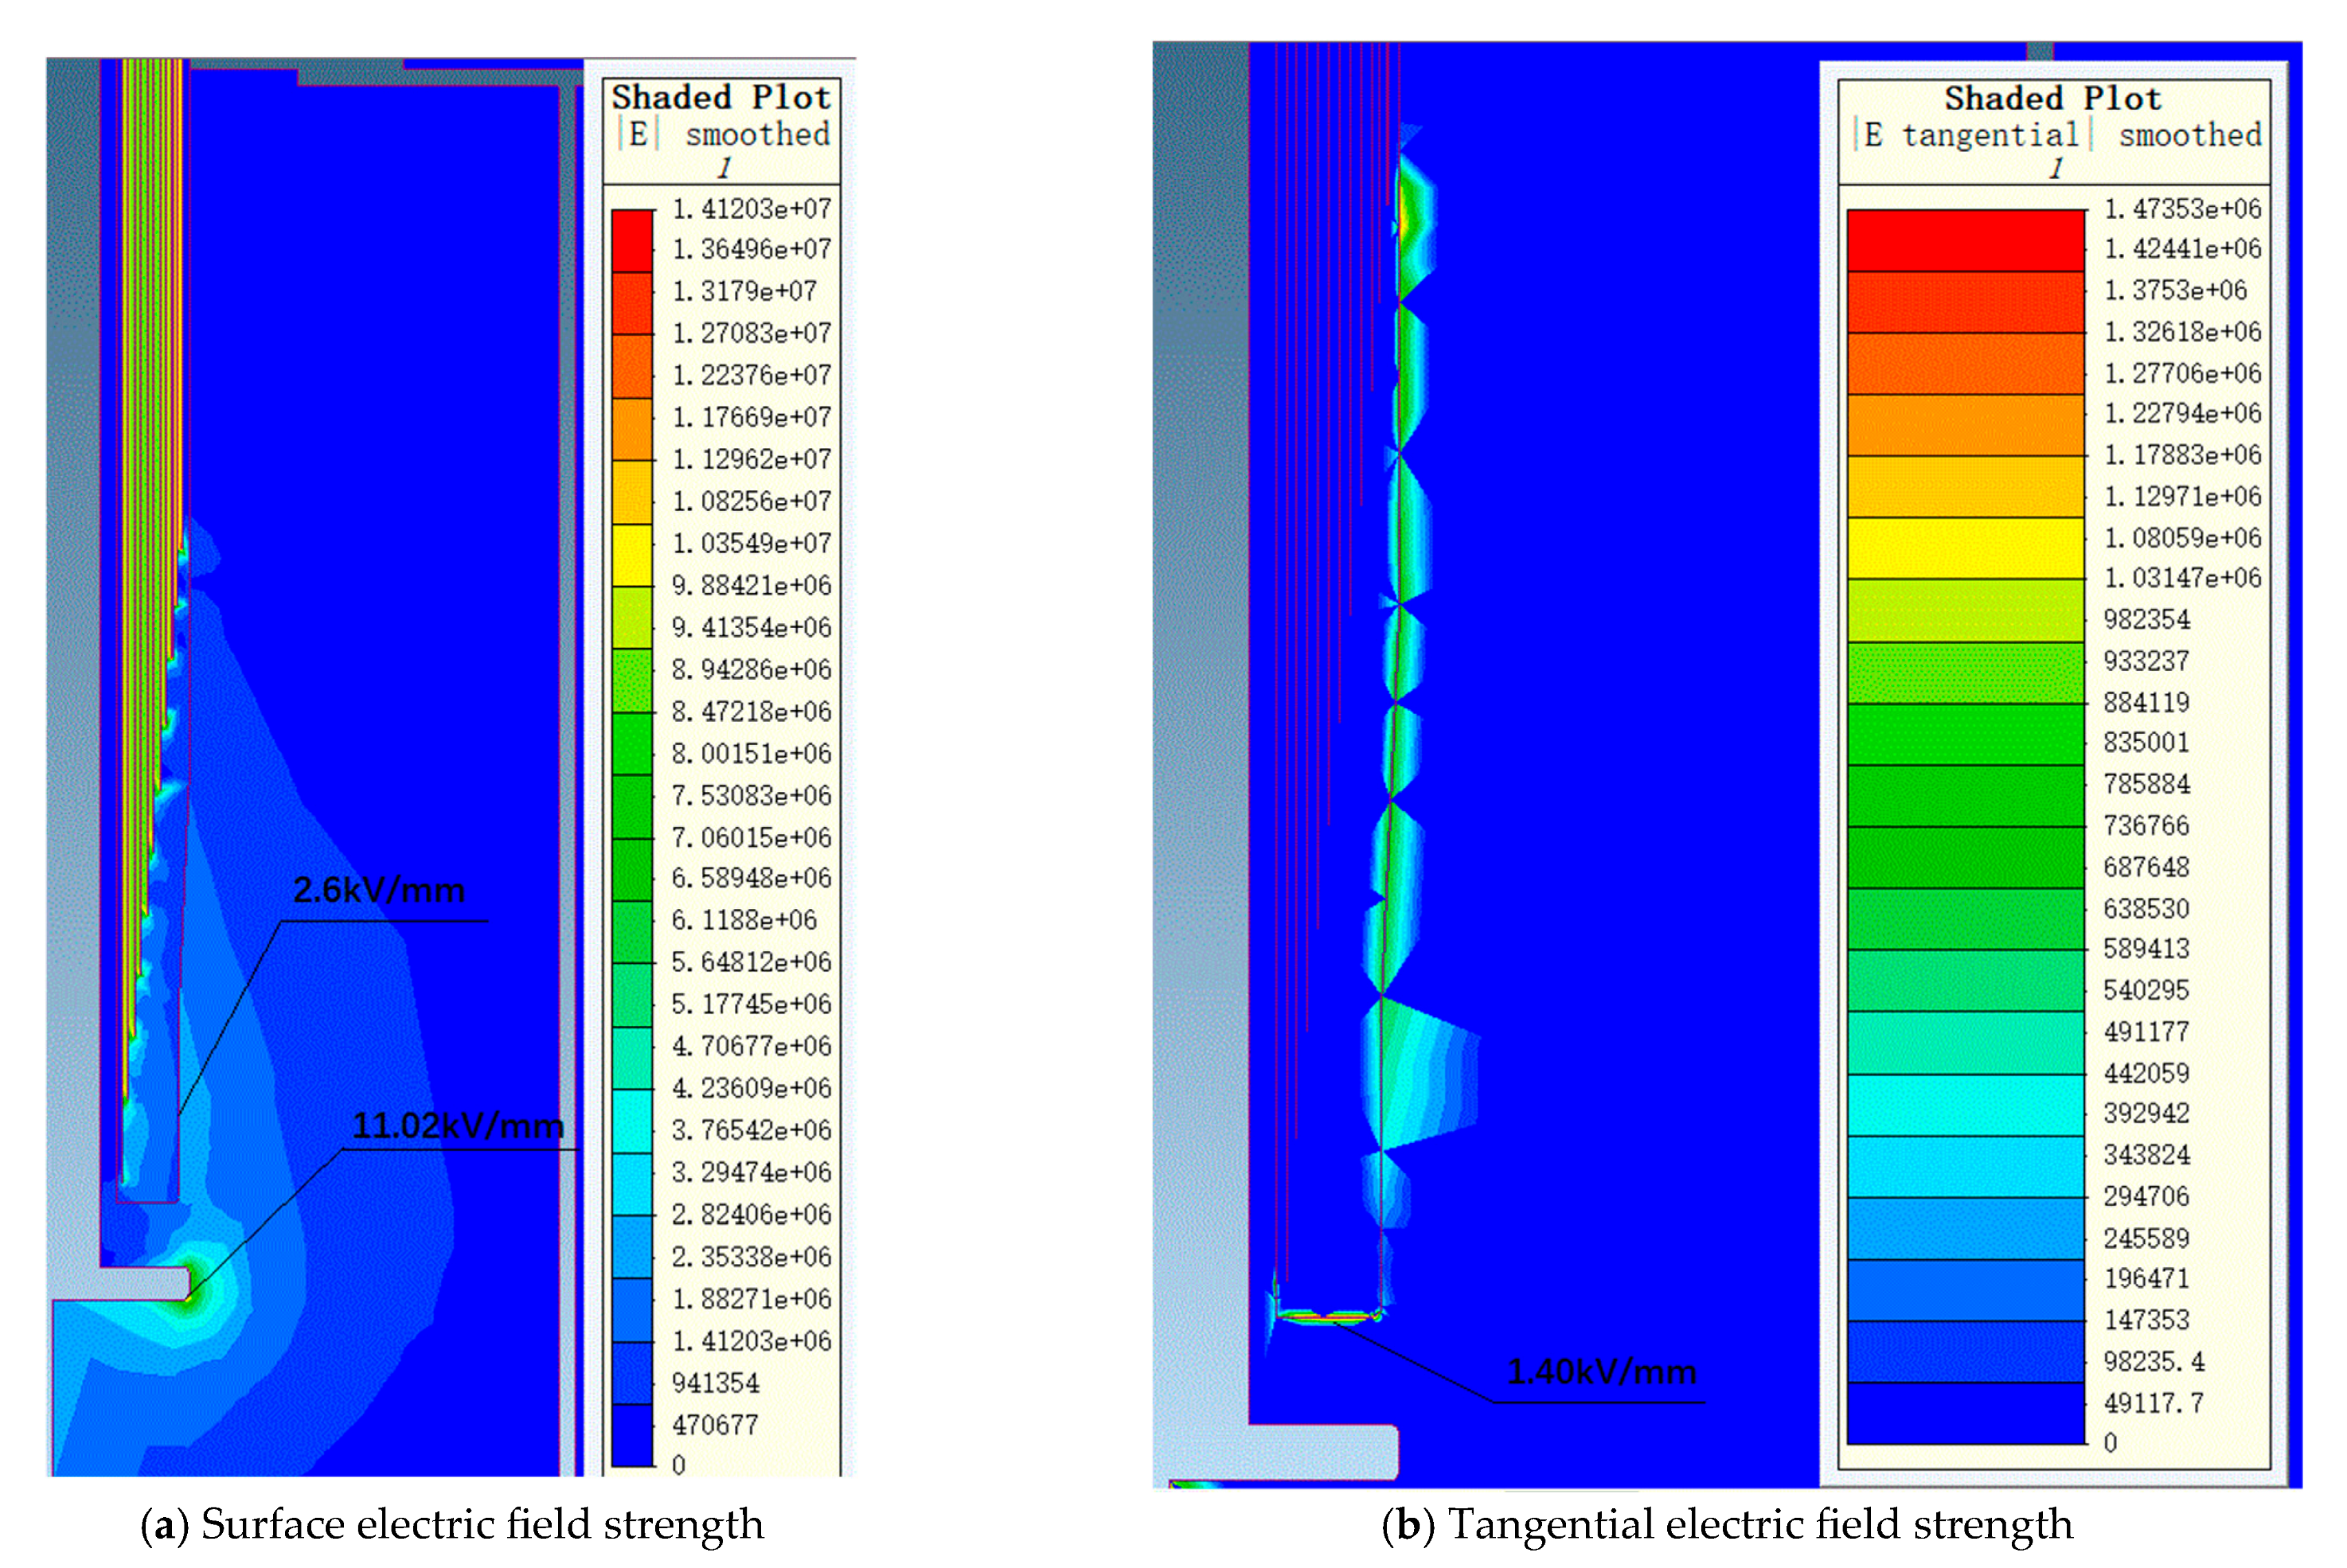
3.2.2. Simulation of the Bushing Terminal Electric Field Under Power Frequency Voltage

Using the finite element simulation method, the terminal electric field simulation of 72.5 kV and 126 kV bushings under power frequency voltage was conducted. For the 72.5 kV and 126 kV bushings, we applied 155 kV and 255 kV power frequency voltages, respectively, to calculate their electric field distributions. These voltage levels were selected in accordance with IEC 60137:2017.
Figure 7 and Figure 8 show the electric field distribution diagrams of the air end and transformer end of the 72.5 kV bushing under a power frequency voltage of 155 kV. Figure 9 and Figure 10, respectively, display the electric field distribution diagrams of the air end and transformer end of the 126 kV bushing under a power frequency voltage of 255 kV.
Under 155 kV power frequency voltage, the maximum electric field strength on the metal components at the air end of the bushing is 1.08 kV/mm, while the maximum electric field strength on the porcelain housing surface is 0.70 kV/mm. The electric field distribution at the air end is relatively uniform, with all field strength values within a reasonable range. At the transformer end of the bushing, the maximum electric field strength in oil is 5.14 kV/mm, located at the lower arc of the voltage balancing sphere. This area experiences a higher local field strength due to the radius of a curvature effect at the oil–sphere interface, yet it remains within the allowable limits. The maximum electric field strength on the core surface is 1.47 kV/mm, with the maximum tangential electric field strength on the core surface being 1.22 kV/mm, both below the allowable field strength thresholds. Simulation results indicate that the field distribution within the core is uniform, with all field strength values below the allowable standards. In conclusion, the electric field distribution of the 72.5 kV bushing designed in this study under 155 kV power frequency voltage is reasonable, with all local field strength values meeting relevant standard requirements.
Under 255 kV power frequency voltage, the maximum electric field strength on the metal components at the air end of the bushing is 1.19 kV/mm, while the maximum electric field strength on the porcelain housing surface is 0.65 kV/mm. At the transformer end of the bushing, the maximum electric field strength in oil is 11.02 kV/mm, located on the surface of the oil-immersed metal components. This area experiences a higher local field strength due to the field concentration effect at the metal surface, yet it remains within the allowable limits specified by relevant standards. The maximum electric field strength on the core surface is 2.6 kV/mm, with the maximum tangential electric field strength on the core surface being 1.40 kV/mm. Simulation results indicate that the electric field distribution within the core is uniform, with all field strength values below the allowable field strength standards.
Simulation results demonstrate that the field strengths at critical locations meet design requirements under power frequency voltage. This ensures the bushing’s insulation performance and reliability during operation. Through finite element simulation analysis, the law of internal electric field distribution within the bushing has been revealed, providing a theoretical basis for optimizing the bushing design and enhancing its insulation performance.

3.3. Seismic Performance Calculation

In actual operation, bushings serve as critical support equipment in power systems and may be influenced by various external factors, including earthquakes. Earthquakes, as unpredictable natural disasters, are characterized by their suddenness and destructive power, potentially causing structural damage, insulation failure, and even severe safety incidents. Therefore, evaluating the seismic performance of critical equipment such as high-voltage bushings is a crucial aspect of ensuring the safe operation of power systems.
According to the product design specifications, bushings with voltage ratings of 40.5 kV, 72.5 kV, and 126 kV must withstand an 8-degree seismic intensity. The selection of calculation parameters for different products is presented in Table 4.
The results obtained based on the above parameters are shown in Table 5.
The 40.5 kV bushing, due to its relatively low voltage rating, has a smaller size and lighter mass, resulting in a simpler center of gravity position and force distribution. Under seismic loading, the total bending moment is 1.96 kN·m, which is significantly lower than the bending moment failure value (13.5 kN·m) at the critical section of the porcelain housing. This indicates that bushings with lower voltage ratings have a high safety margin in their design. As the voltage level of the bushing increases, its size and weight also increase, which makes the force distribution more complex. The total bending moments for the 72.5 kV and 126 kV bushings are 2.86 kN·m and 7.63 kN·m, respectively, which are still far below the bending moment failure values at the critical sections of their respective porcelain housings. Based on the calculation results, the total bending moments of the bushings under seismic loading are all significantly lower than the bending moment failure values at the critical sections of their porcelain housings, effectively satisfying the seismic intensity requirements of the design.

3.4. Thermal Short-Circuit Current Calculation of Bushings

In power systems, short-circuit faults are a common form of electrical failure, characterized by a sudden and significant increase in current, which may lead to equipment overheating or even damage. Therefore, the calculation of thermal short-circuit current (TSCC) is an essential task in the design and verification of power equipment, primarily used to evaluate the thermal withstand capability of the equipment under short-circuit fault conditions.
The selection of calculation parameters for different products is shown in Table 6. The results obtained based on the above parameters are shown in Table 7.
For the 40.5 kV bushing, the cross-sectional area of the conductor corresponding to its designed rated current is 15.9 cm2. Under the action of short-circuit current, due to the relatively small cross-sectional area, the current density carried per unit area is relatively high. This led to a rapid increase in the temperature of the conductor, eventually reaching 126 °C, but it was still lower than the 180 °C safety threshold stipulated by the national standard. With the voltage level increasing to 72.5 kV and 126 kV, in order to meet the demand for higher rated current transmission, the cross-sectional area of the conductor correspondingly increased to 22.96 cm2 and 17.27 cm2. The larger cross-sectional area effectively reduced the current density during short circuits, enabling the 72.5 kV and 126 kV bushings to significantly reduce the temperature rise of the conductors when subjected to greater short-circuit currents. Eventually, the temperatures were stabilized at 130 °C and 131 °C, respectively. Through systematic calculation and verification, the final conductor temperatures of the bushings of each voltage level under the thermal short-circuit condition are all lower than the limit values stipulated by the national standards. They can effectively withstand the standard short-time withstand current Ith and fully comply with the requirements of the safety operation specifications for power equipment.

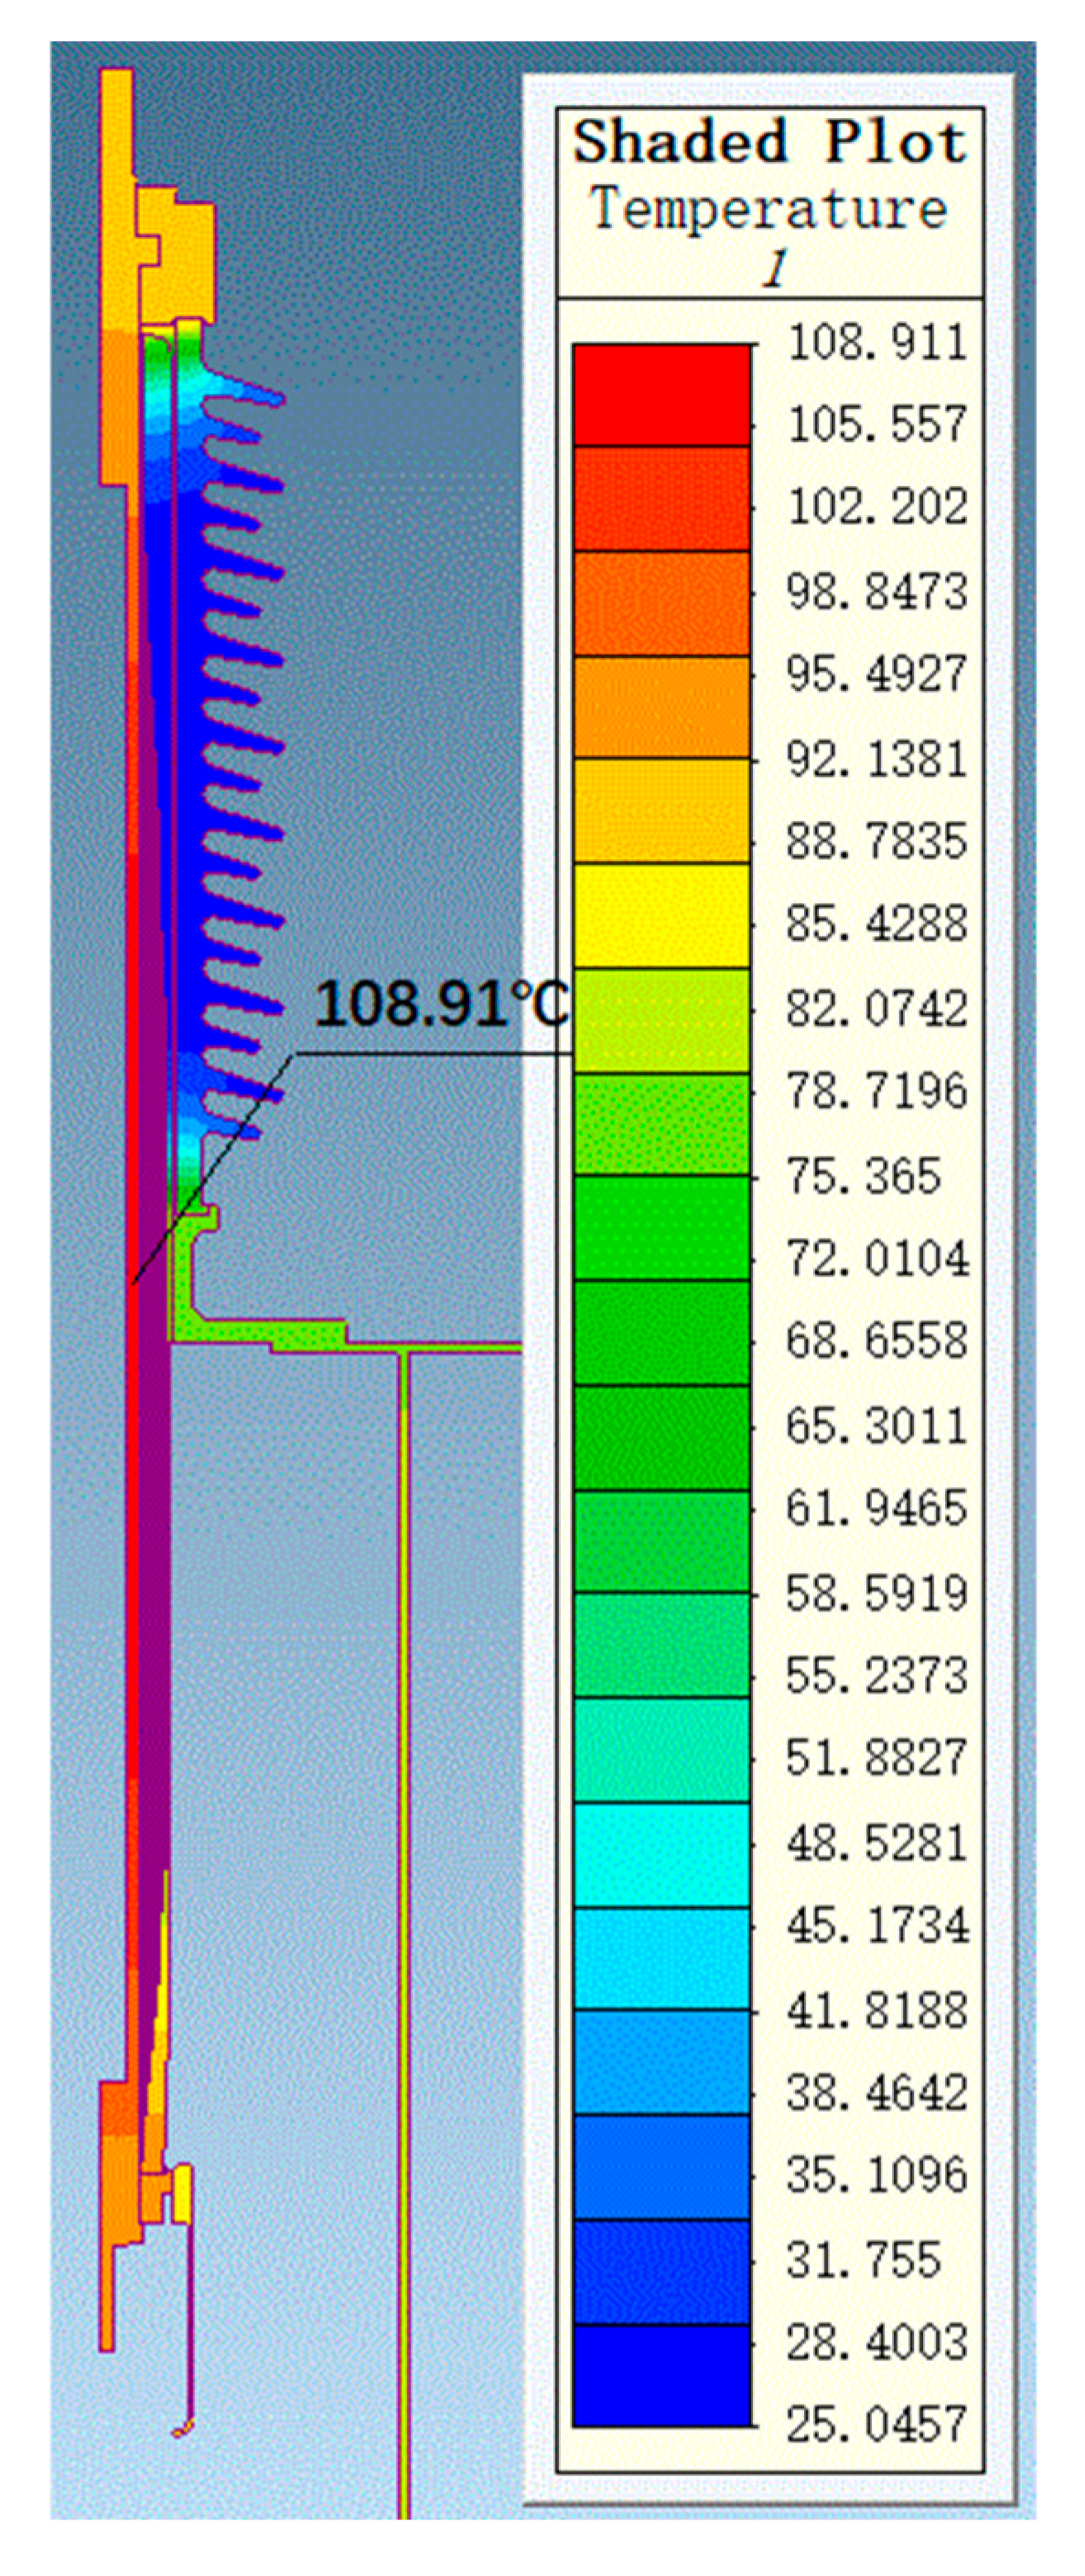
3.5. Bushing Thermal Field Simulation Calculation

Through thermal field simulation, the current-carrying designs of bushings at different voltage levels were verified. Simulation parameters were set based on the actual operating conditions of bushings at different voltage levels. For the 72.5 kV bushing, the oil temperature was set to 85 °C, the air end to 25 °C, and the current was set to 2000 A for the simulation. For the 126 kV bushing, the oil temperature was set to 85 °C, the air end to 25 °C, and the current was set to 1250 A for the simulation. The maximum temperature of the conductor was 120 °C, which is stipulated by the standard GB/T 4109-2022 [19]. The overall temperature distributions for the 72.5 kV and 126 kV bushings are shown in Figure 11 and Figure 12, respectively.
The uniformity of the electric field distribution directly affects the electrothermal conversion efficiency within the bushing. In regions with higher electric field strength, the electrothermal conversion efficiency is higher, potentially leading to localized temperature increases. The maximum radial electric field strengths for the 72.5 kV and 126 kV bushings are 2.74 kV/mm and 3.0 kV/mm, respectively, both within permissible limits. The corresponding thermal field simulation results indicate that the maximum temperature for the 72.5 kV bushing is 109 °C, located in the middle of the conductor, while the maximum temperature for the 126 kV bushing is 98 °C, located in the middle-lower part of the conductor. The calculation results demonstrate that bushings at higher voltage levels exhibit excellent heat dissipation performance in their designs, with uniform temperature distributions, ensuring thermal stability under high voltage and high current conditions. The temperature distribution of the bushing under actual operating conditions also supports the results of thermal short-circuit current calculations.
The uniformity of the electric field distribution, structural integrity, and mechanical stability collectively ensure the thermal stability of the bushing. Uniform electric field distribution reduces the risk of localized overheating, structural integrity ensures the uniformity of the thermal field distribution, and mechanical stability guarantees the reliability of the bushing under extreme operating conditions.

3.6. Bushing Performance Testing

We conducted the necessary tests for the operation of bushings of different voltage levels. Testing results are presented in Table 8. Test results indicate that bushings of different voltage classes, manufactured based on the structure described herein, meet standard requirements for insulation, heat resistance, and seismic performance. The 42.5/72.5/125 kV bushings can withstand 105/165/305 kV power frequency voltages, significantly exceeding their maximum operating voltages. Moreover, their power frequency wet withstand and lightning impulse full-wave tests were fully compliant, indicating excellent outdoor performance, effectively withstanding inevitable rain and lightning impacts. Results of temperature rise and seismic tests show that bushings possess superior heat resistance and seismic performance. These findings provide a reliable theoretical basis for the development and application of epoxy resin paper-insulated bushings, ensuring reliability under high voltage classes and complex conditions. This research holds a significant engineering value for enhancing the safety and stability of transformers and power systems.

4. Conclusions

As a critical component of transformer systems, epoxy resin paper-impregnated bushings play a vital role in ensuring the system’s reliable operation. Their electric field distribution, seismic resistance, and thermal stability are key factors determining the reliable operation of the transformer system. This study employs finite element simulation to analyze the electric field distribution characteristics of 40.5 kV, 72.5 kV, and 126 kV bushings. The mathematical model of the bushing is constructed to calculate and predict the seismic resistance and thermal stability of the bushing under working conditions. The research provides a reliable method for the development and design of high-reliability high-voltage direct current bushings. The relevant results are as follows:
1
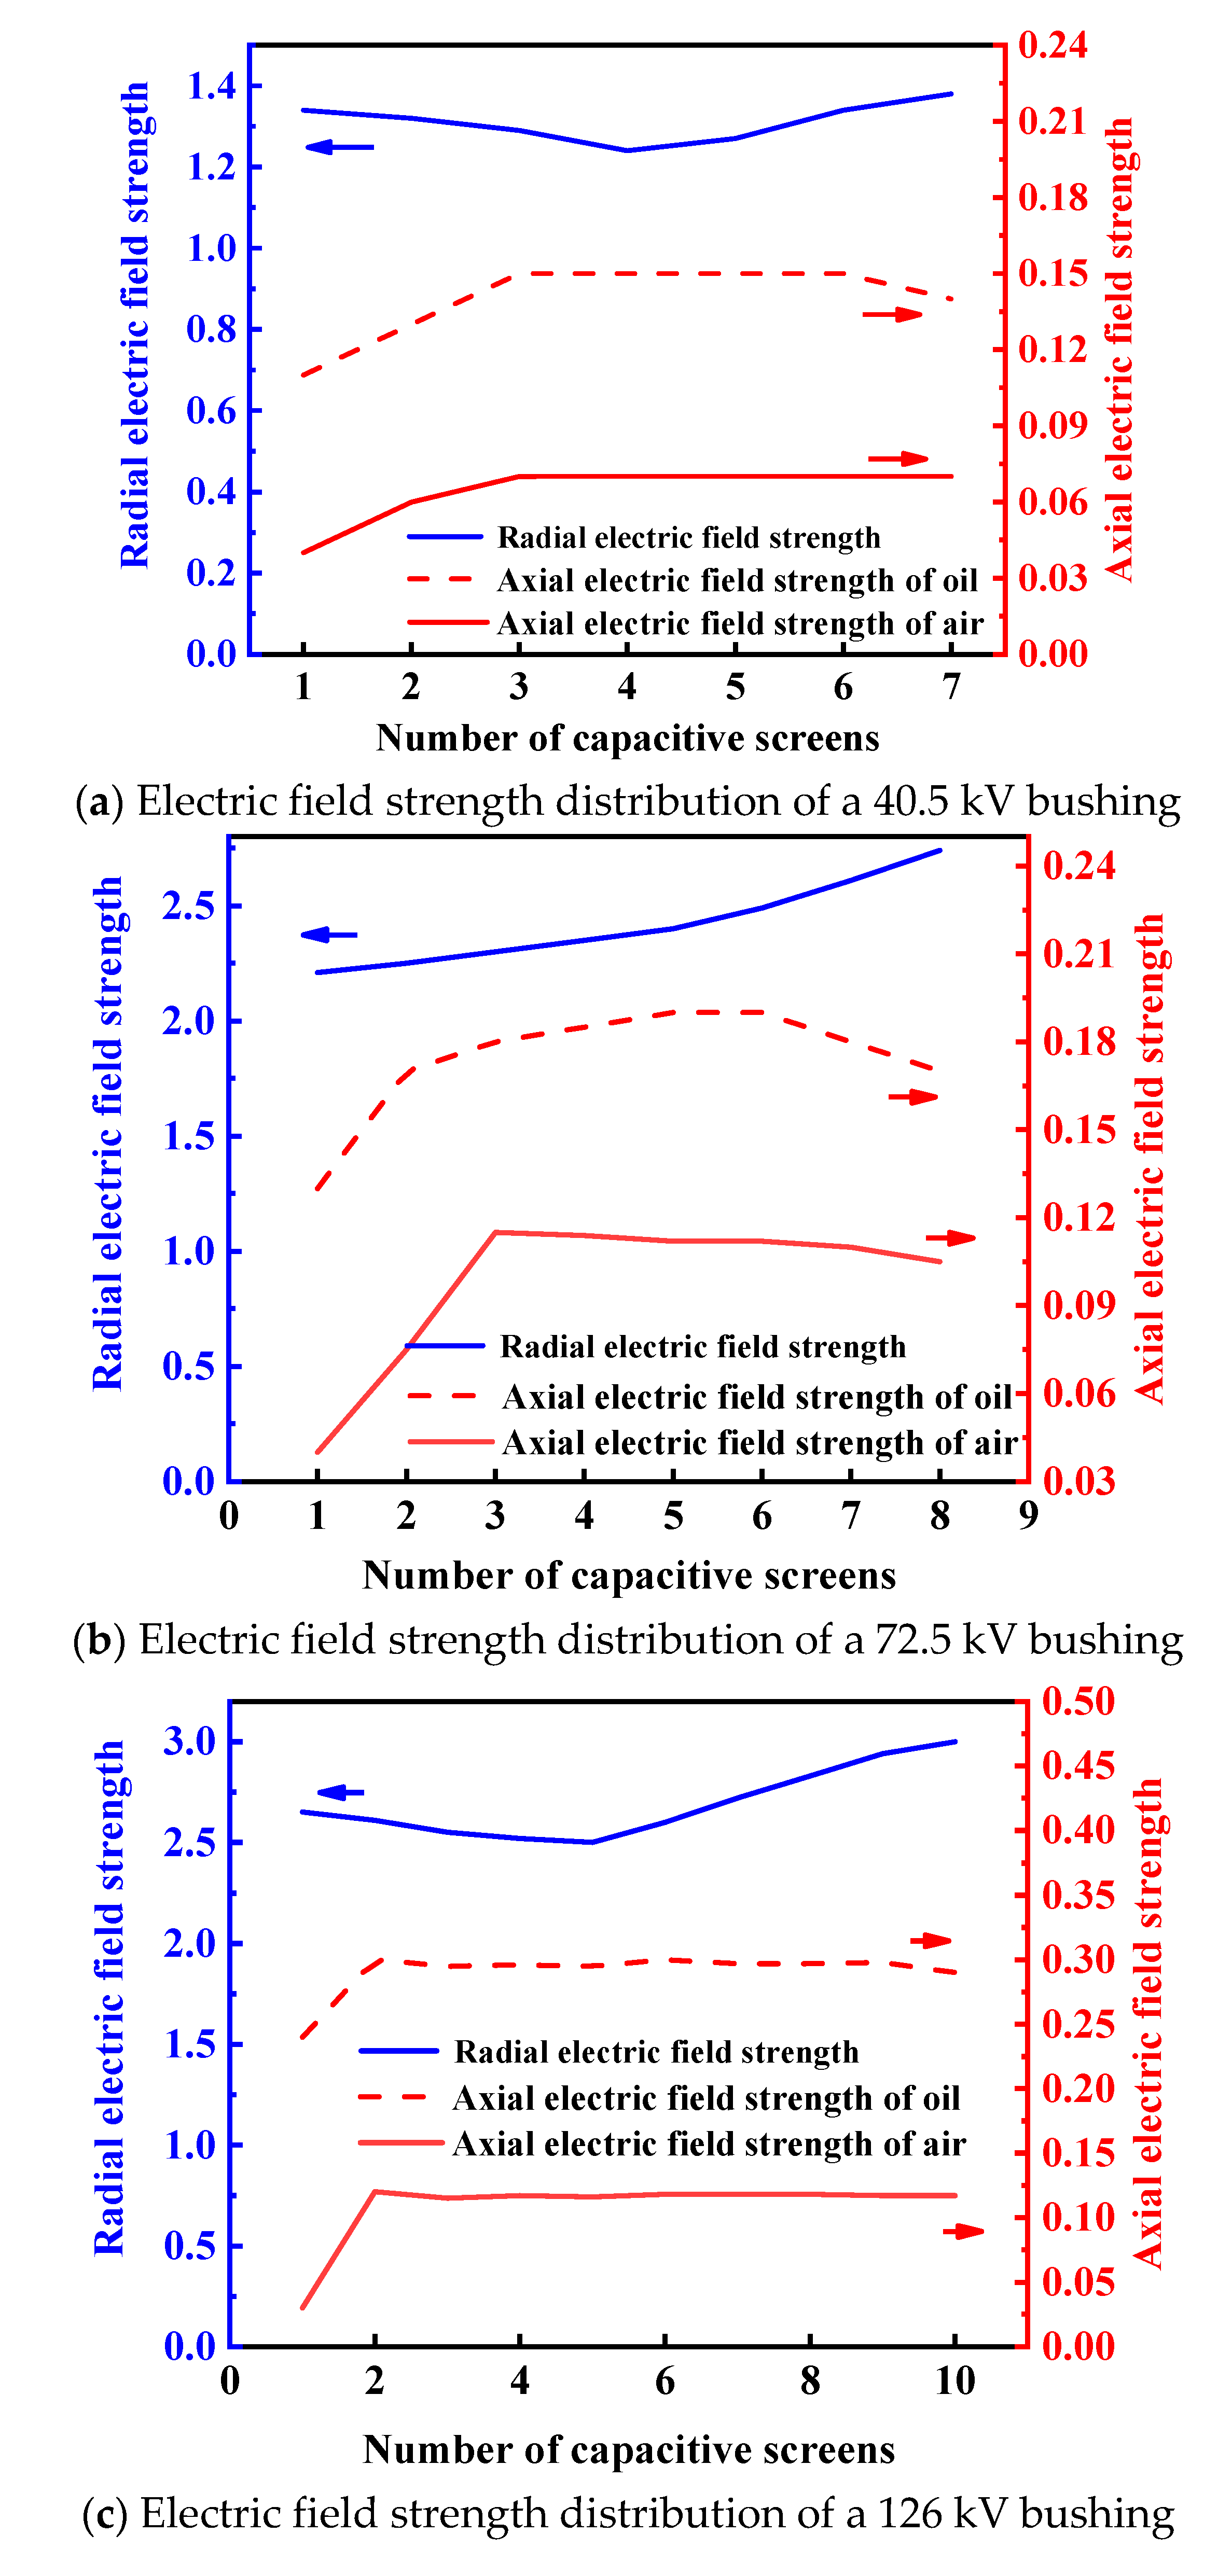
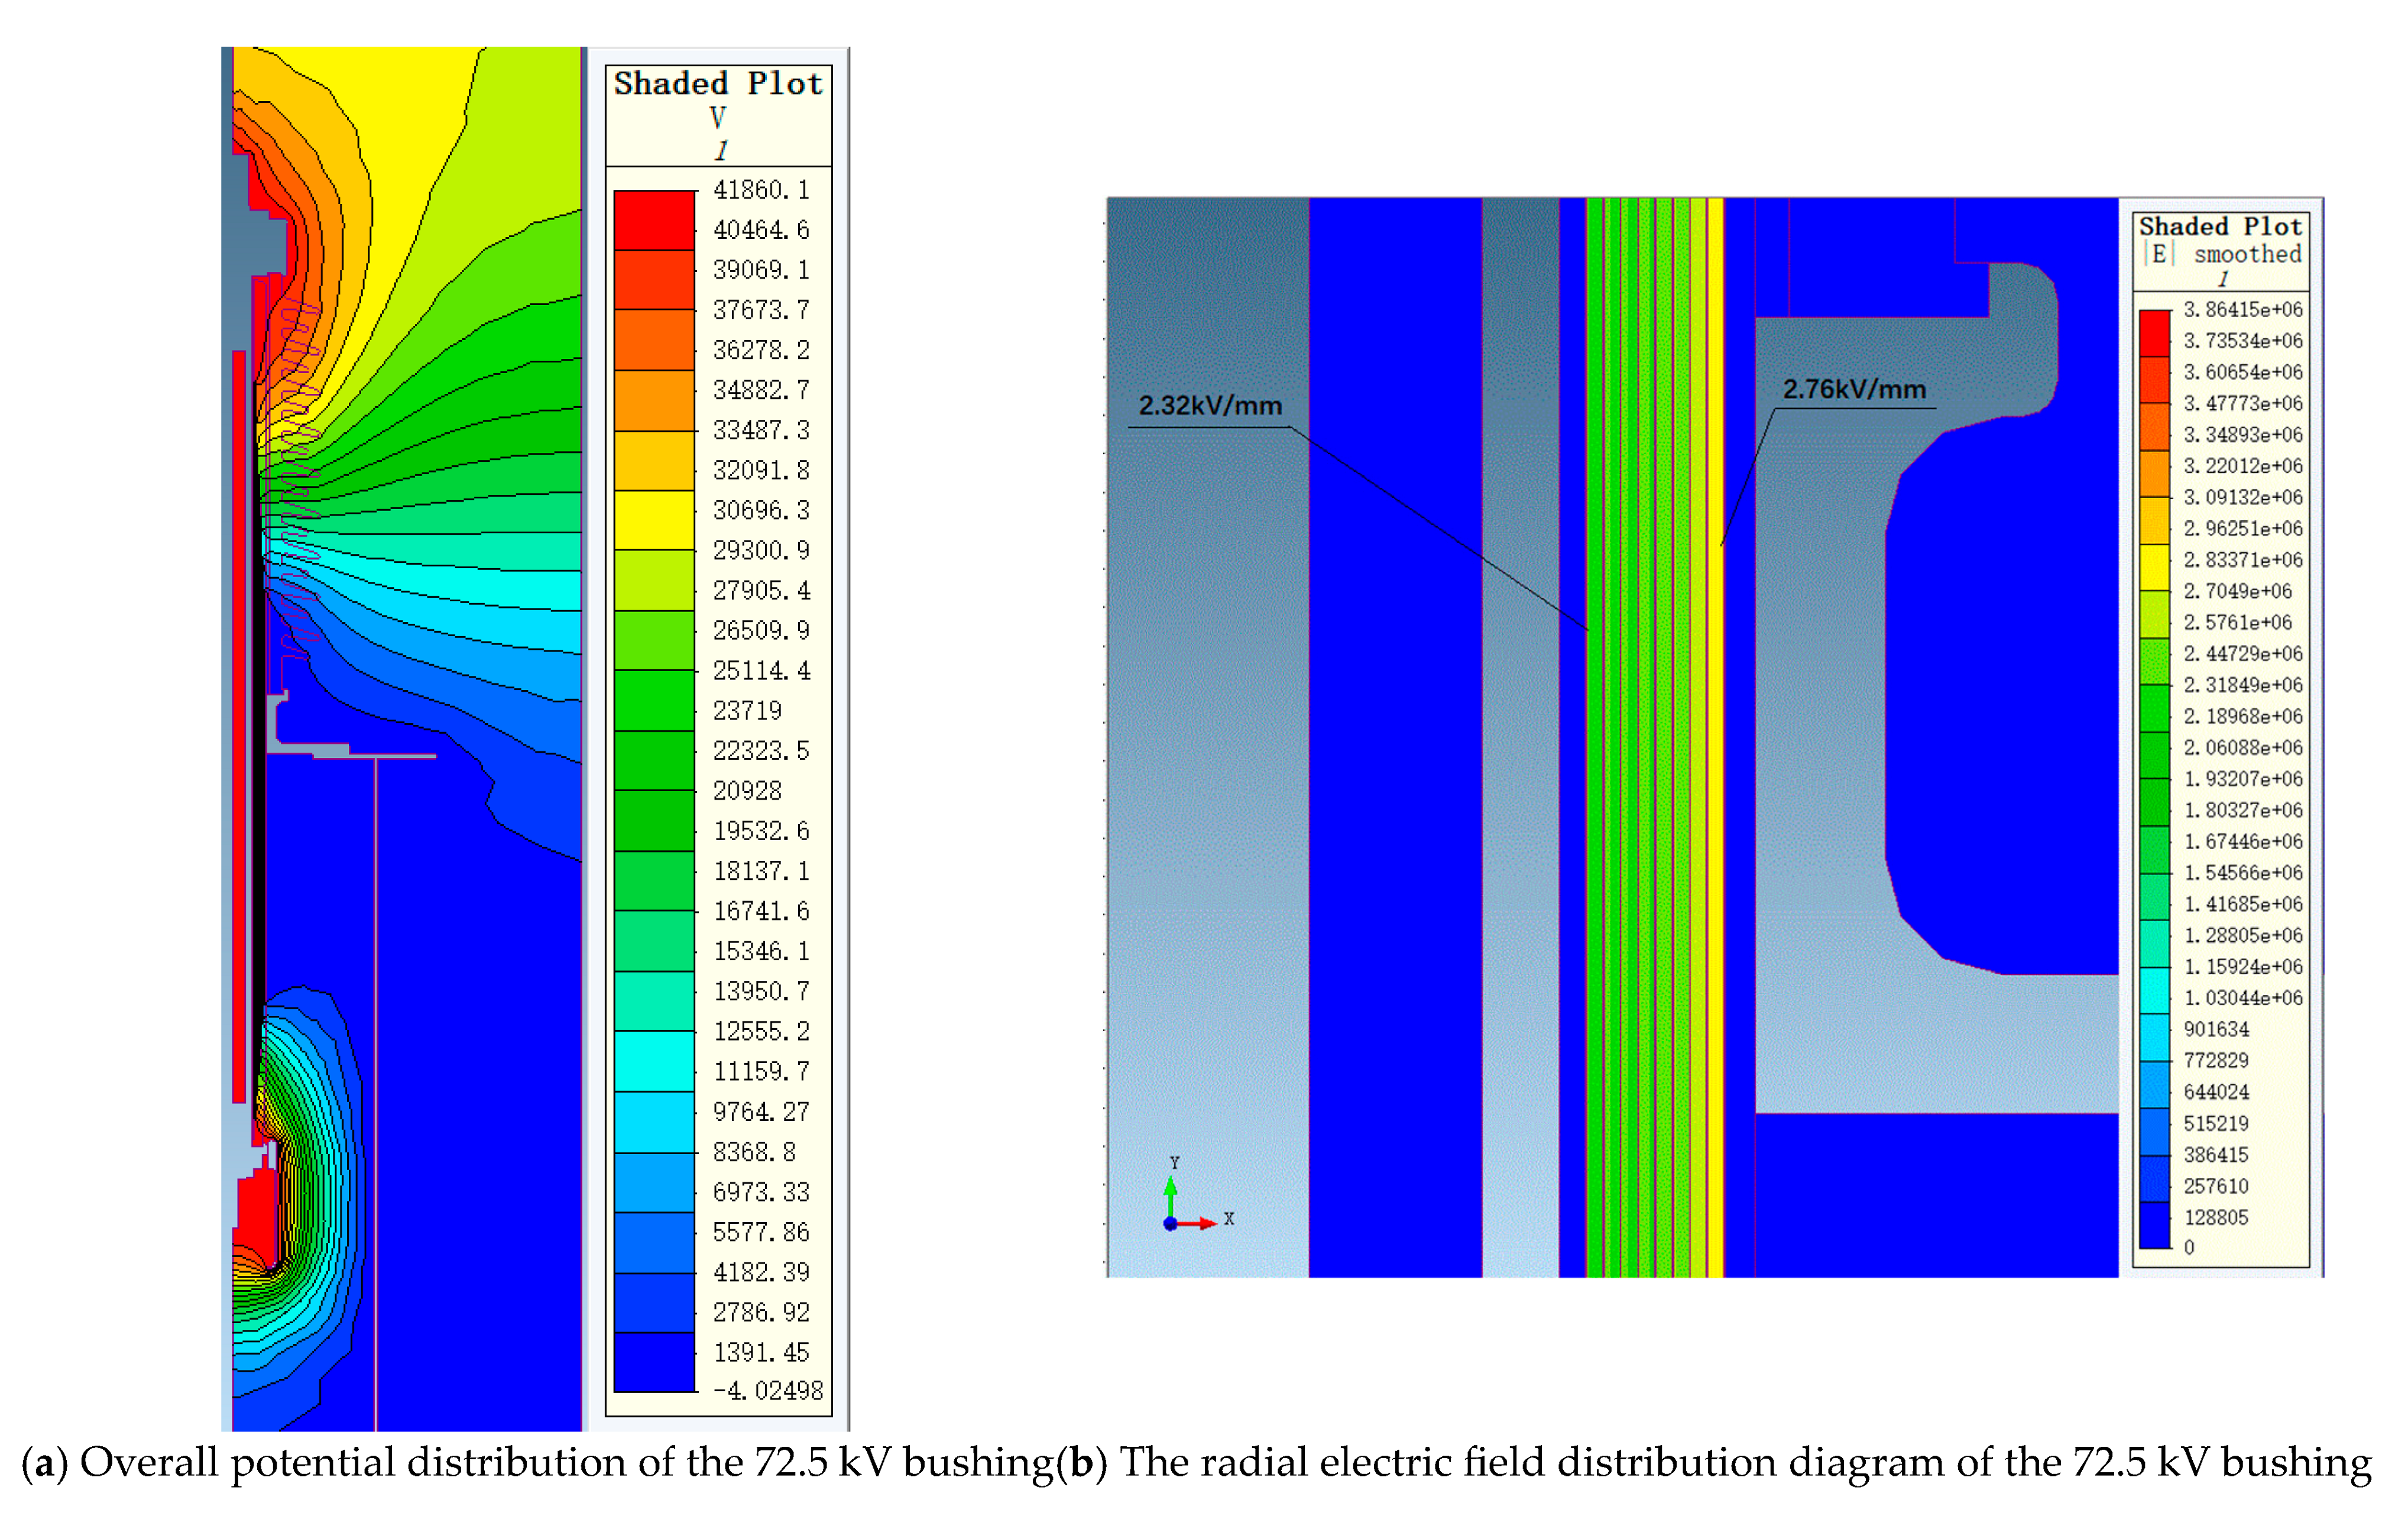
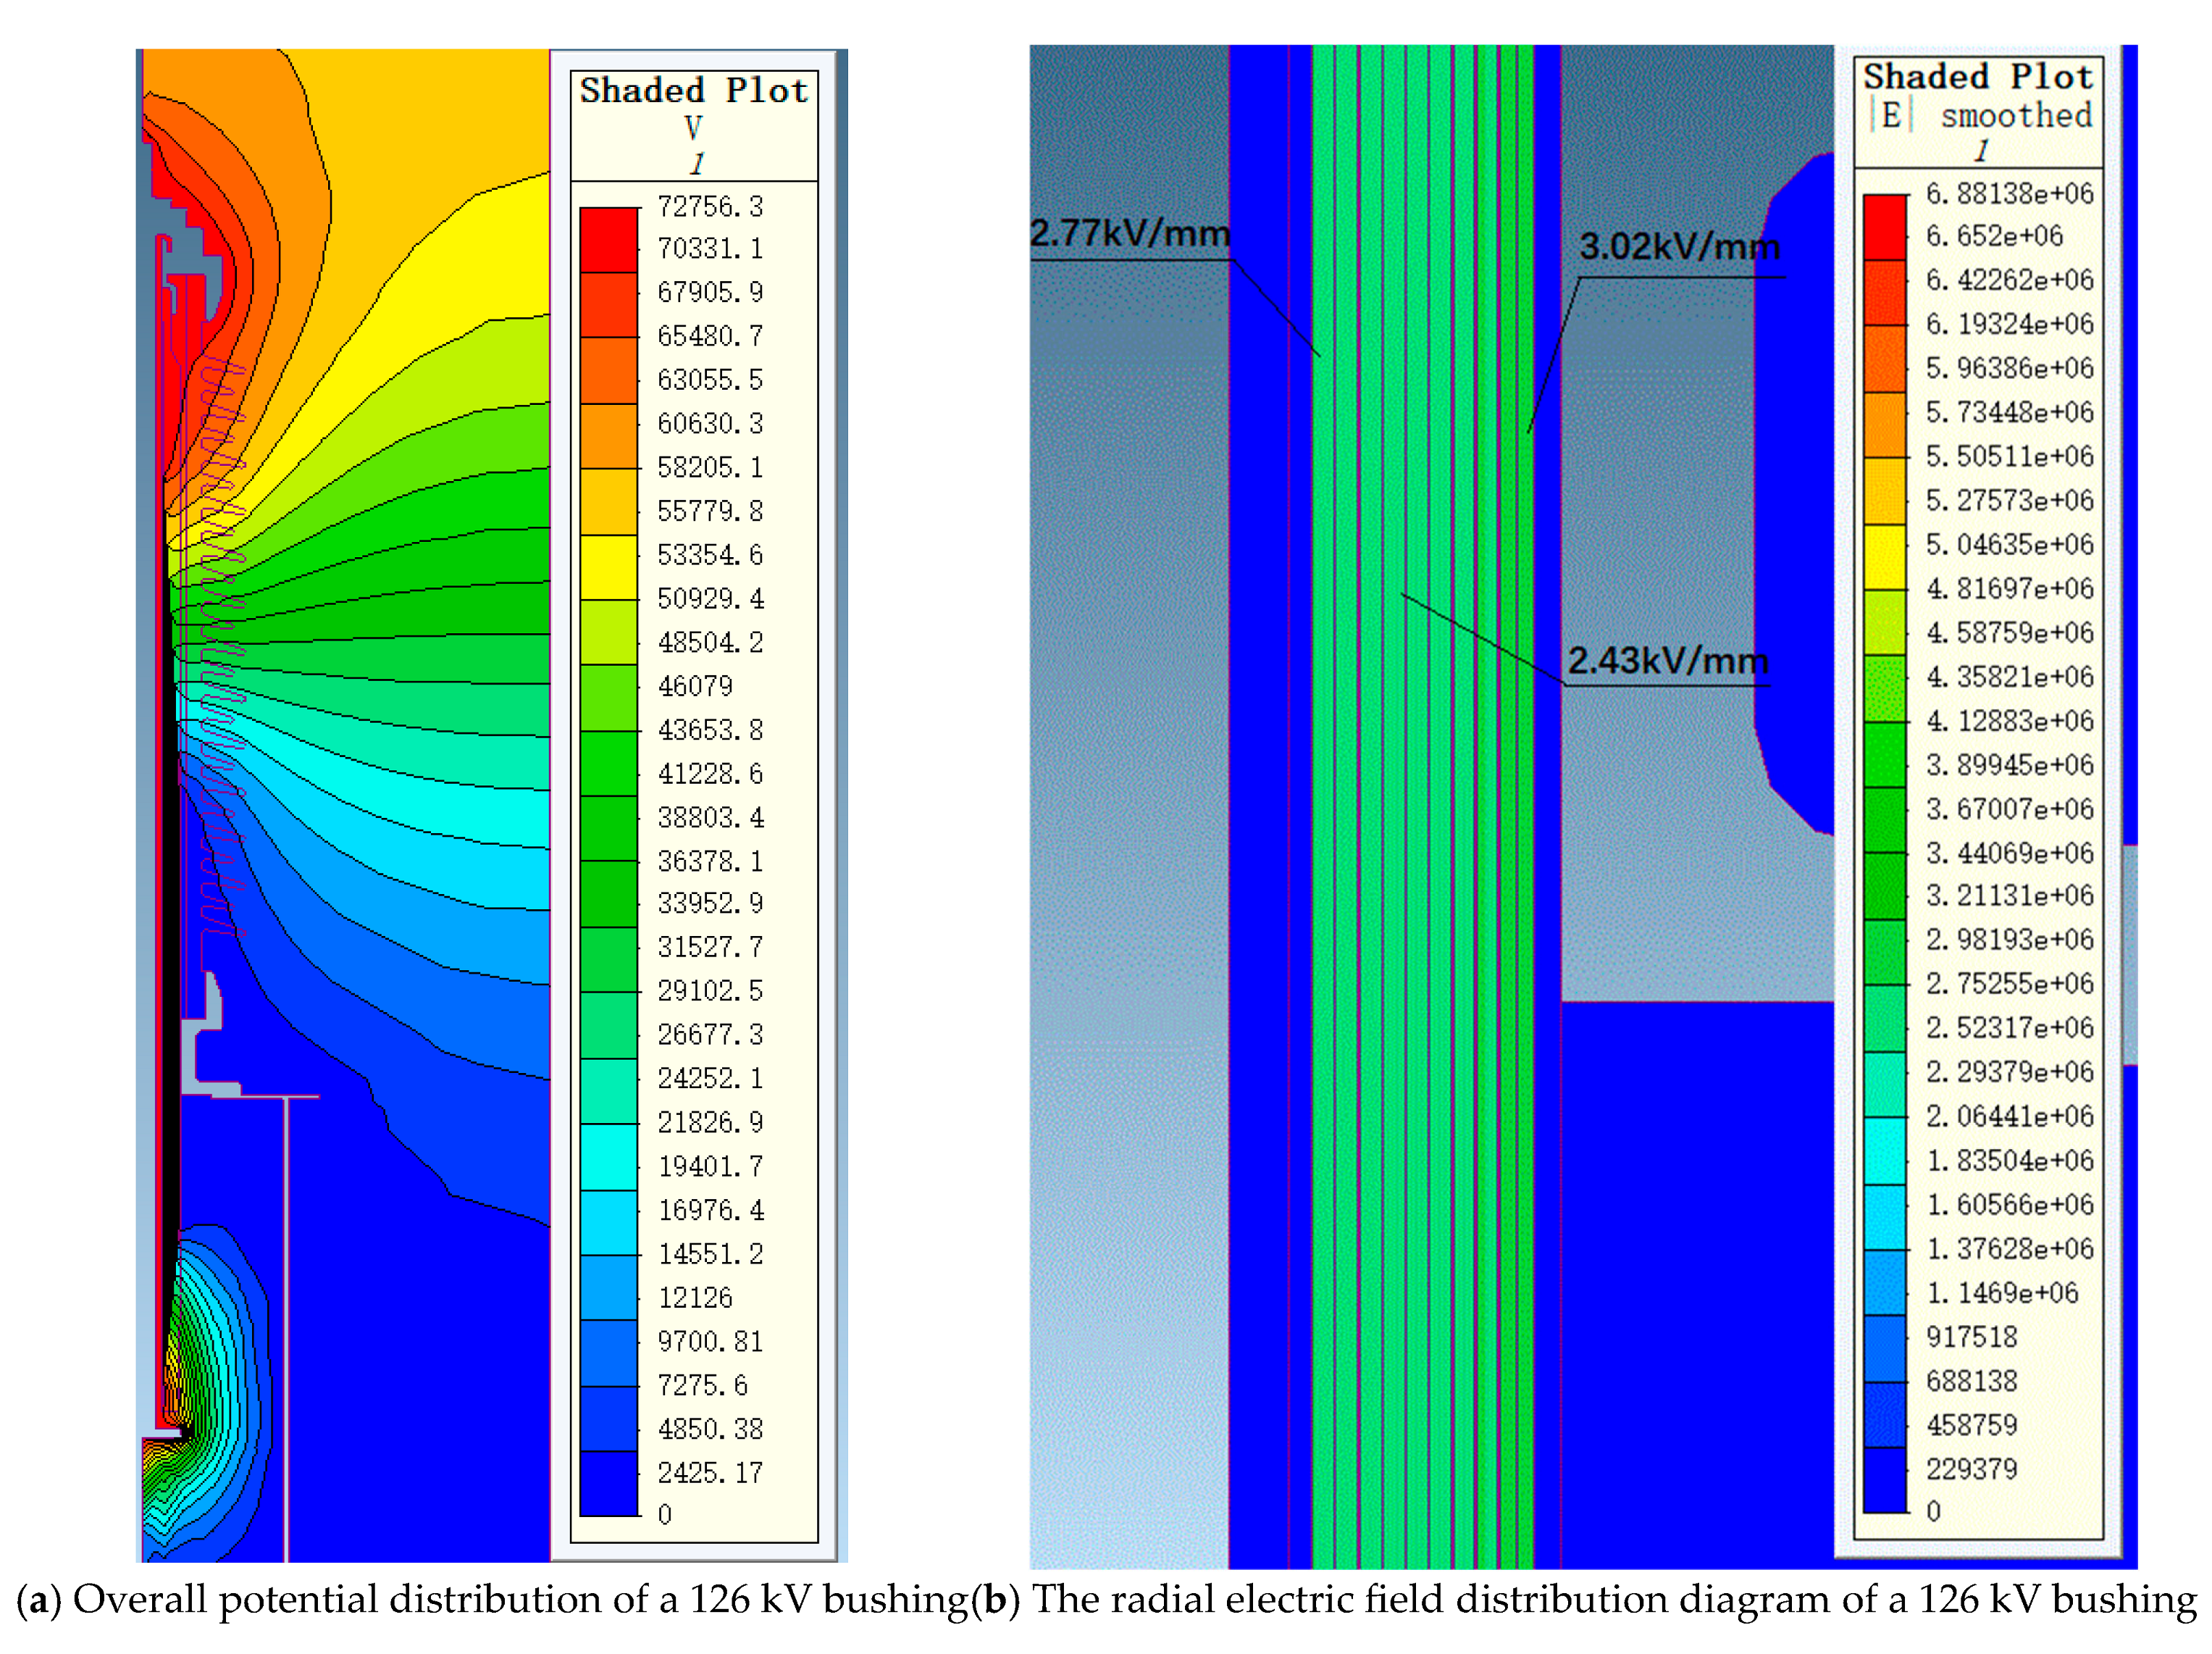
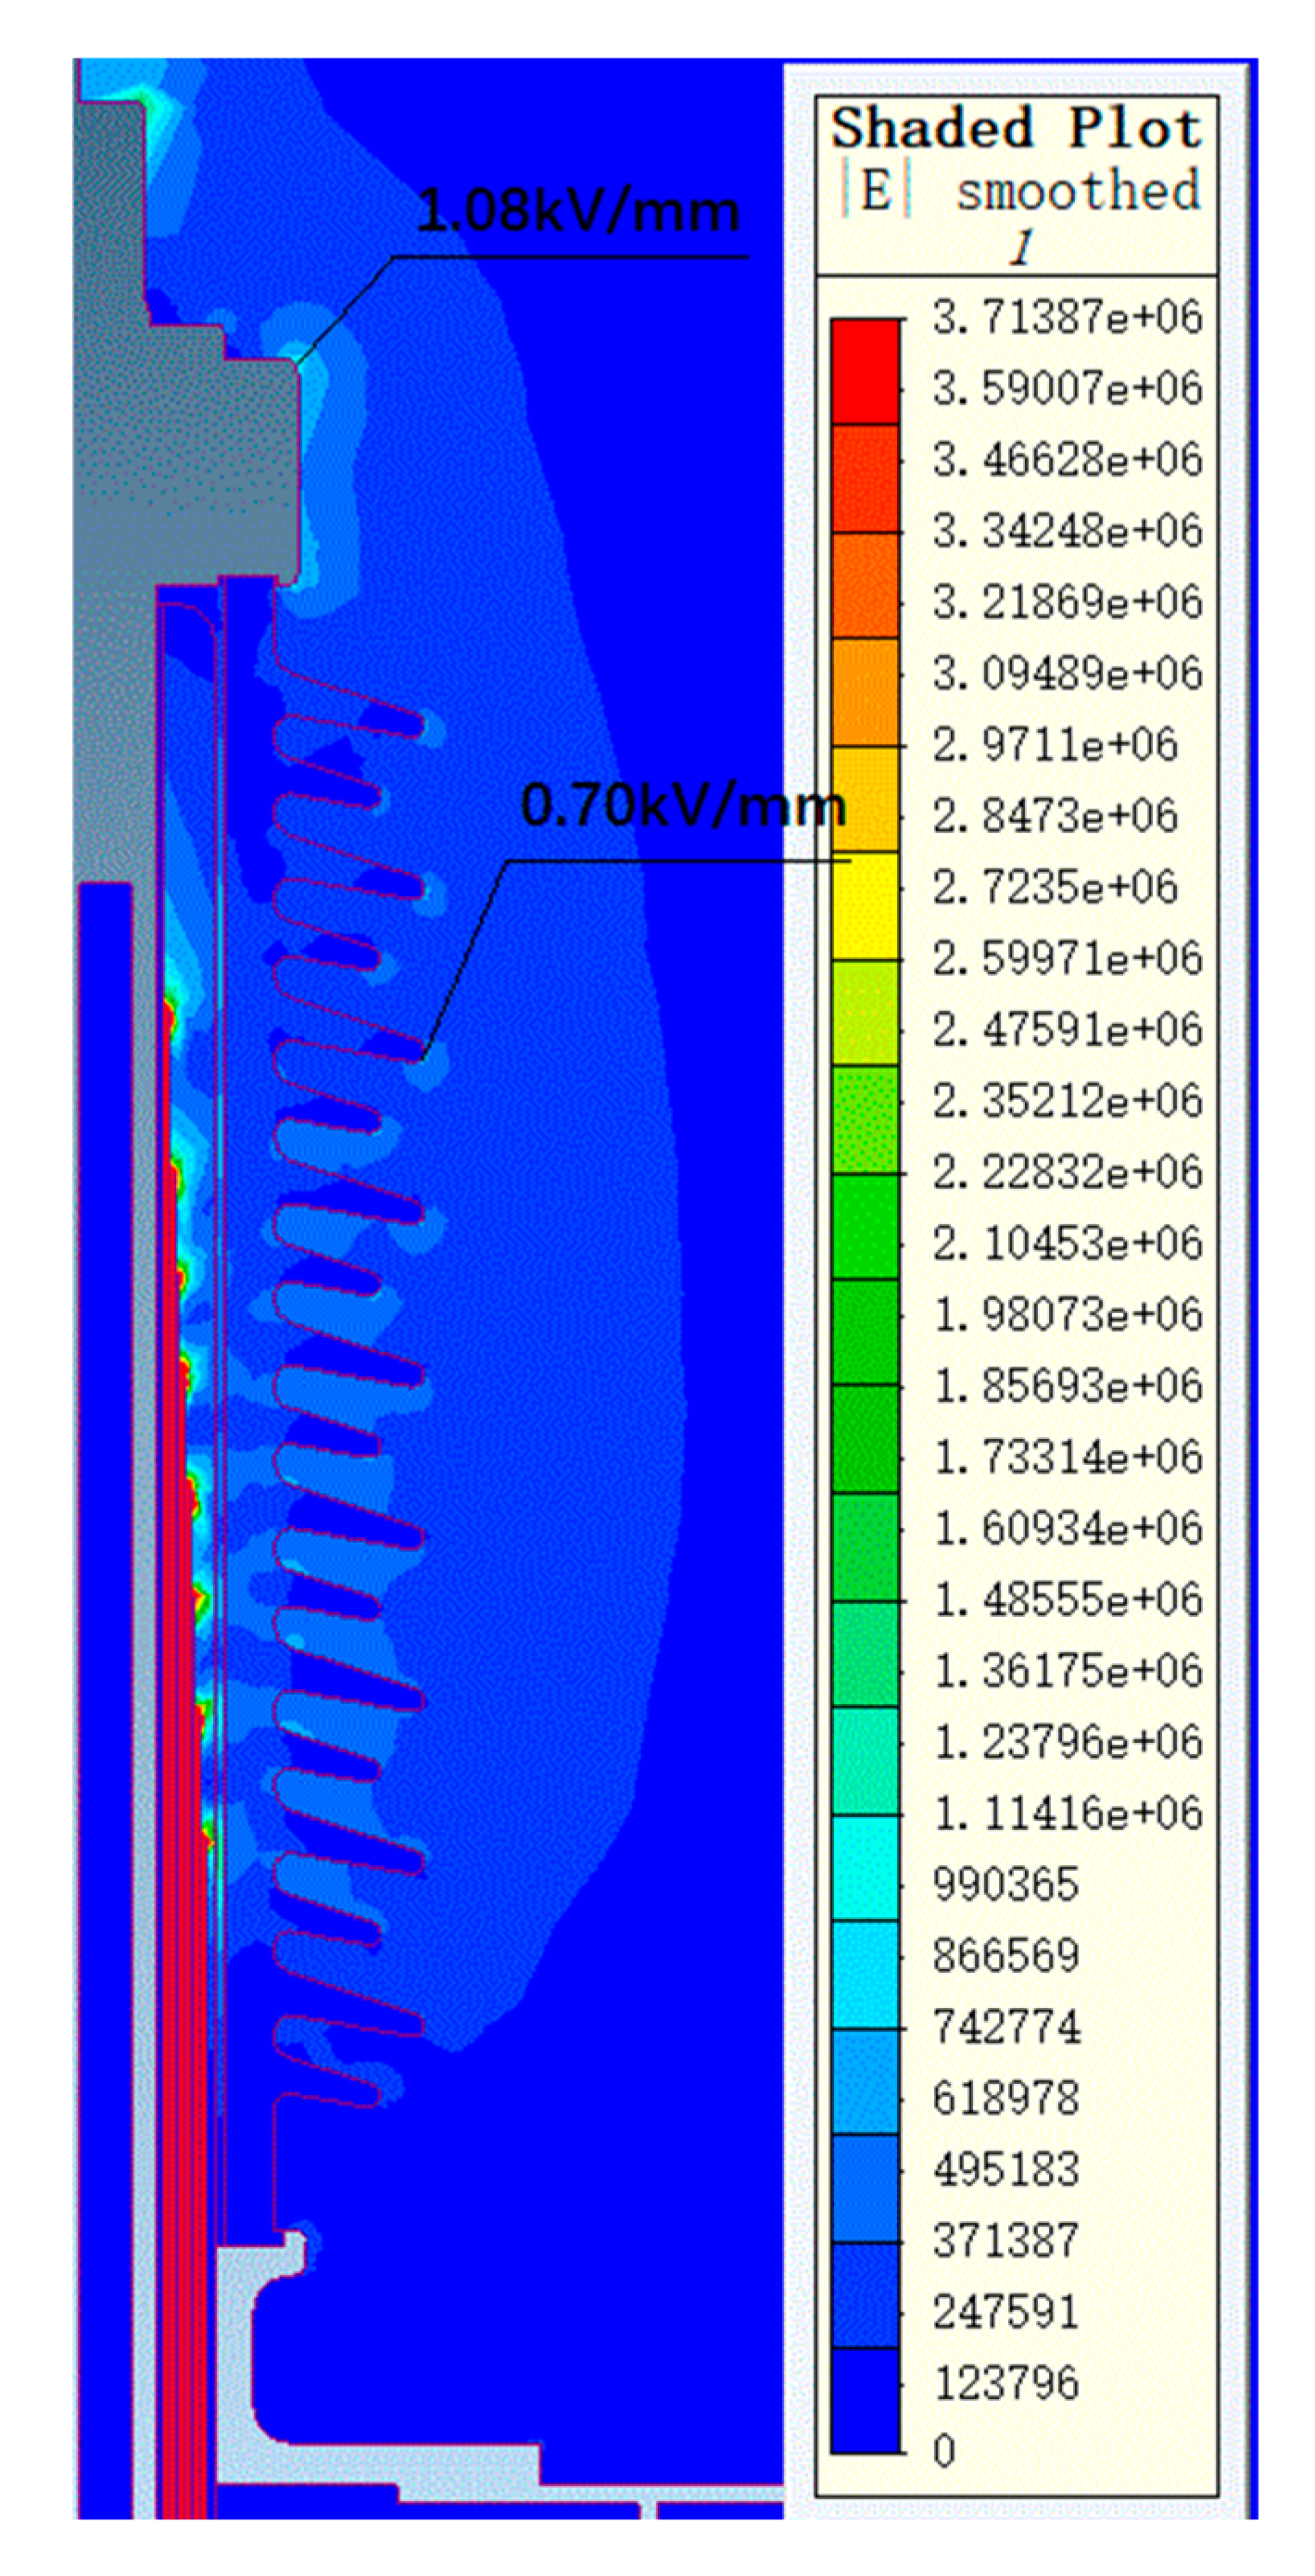
The electric field strength distribution varies among bushings with different structures. The maximum radial electric field strengths for the 40.5 kV, 72.5 kV, and 126 kV bushings are 1.39 kV/mm, 2.86 kV/mm, and 3.0 kV/mm, respectively, all meeting the usage requirements. The maximum axial electric field strengths at both the oil end and air end of the bushing are below the allowable axial electric field strength, satisfying the usage requirements.
2
The bushings with rated voltages of 40.5 kV, 72.5 kV, and 126 kV meet the 8-degree seismic resistance requirements and can effectively withstand the standard seismic intensity value Ith. They are also capable of withstanding the electromagnetic forces caused by dynamic stability currents, in compliance with standard specifications. The bushings demonstrate reliable operational capabilities under extreme scenarios.
3
The thermal stability of the bushings under short-circuit conditions complies with national standards. The final conductor temperature in all cases is below 180 °C, providing sufficient safety margins. The thermal field simulation results indicate that the maximum temperature of the 72.5 kV bushing under a current of 2000 A is 109 °C, and the maximum temperature of the 126 kV bushing under a current of 1250 A is 98 °C, both satisfying engineering usage requirements.

Author Contributions

Conceptualization, D.L. and L.W.; data curation, D.L., X.D., T.Y. and Z.L.; formal analysis, X.T. and T.Y.; funding acquisition, L.W.; investigation, L.L. and W.T.; methodology, B.C. and Z.L.; project administration, W.T. and L.W.; resources, D.L. and X.T.; supervision, L.L. and B.C.; validation, X.D.; writing—original draft, Z.L.; writing—review and editing, B.C. All authors have read and agreed to the published version of the manuscript.

Funding

This work was funded by the China Yangtze Power Co., Ltd. Scientific Research Project Grant No. 2322020029, entitled “Research on independent and controllable technology of large-scale main transformer bushing”.

Institutional Review Board Statement

Not applicable.

Data Availability Statement

The original contributions presented in this study are included in the article. Further inquiries can be directed to the corresponding authors.

Conflicts of Interest

Authors Daijun Liu, Xiaoying Dong, and Tianming Yan were employed by China Yangtze Power Co., Ltd. Authors Xiaobang Tong, Libao Liu, and Wenkai Tang were employed by Nanjing Electric High Voltage Bushing Co., Ltd. The remaining authors declare that the research was conducted in the absence of any commercial or financial relationships that could be construed as a potential conflict of interest.

References

  1. Zheng, H.; Li, Y.; Luo, X.; Zhang, E.; Jing, J. Investigation on Hot Spot Temperature of Resin-Impregnated Paper High-Voltage Bushing Based Upon Dielectric Loss. IEEE Trans. Dielectr. Electr. Insul. 2023, 30, 1884–1892. [Google Scholar] [CrossRef]
  2. Shi, S.; Tian, H.; Xie, G.; Wang, Q.; Xie, T.; Pang, X.; Yang, G.; Liu, P.; Peng, Z. Insulation Degradation of Epoxy Resin Impregnated Paper Bushing Under Discharge Arc Ablation. IEEE Trans. Dielectr. Electr. Insul. 2024, 31, 2776–2784. [Google Scholar] [CrossRef]
  3. Shang, G.; Liu, X.; Shao, Y.; Chen, M.; Sun, Y.; Zhang, Q.; Tang, H.; Li, X. Insulation Degradation Characteristics and Phase-Field Simulation of Epoxy Resin for Valve-Side Bushing Under Strongly Coupled Electrothermal Field. IEEE Trans. Dielectr. Electr. Insul. 2024, 31, 615–624. [Google Scholar] [CrossRef]
  4. Li, L.; Li, Q.; Xu, S.; Liu, R.; Dong, M.; Ying, S.; Tian, J.; Xin, W.; Haddad, M.; Jiang, X. Electric Field Improvement for High-Voltage Bushings. Polymers 2023, 15, 40. [Google Scholar] [CrossRef]
  5. Zhang, H.; Jin, S.; Jin, H.; Zhang, Z.; Wang, C.; Liu, P. A novel simulation of space charge decay dynamics after removing the voltage in epoxy resin composites. J. Phys. D Appl. Phys. 2025, 58, 035303. [Google Scholar] [CrossRef]
  6. Shang, G.; Sun, Y.; Tang, H.; Li, X.; Zhang, S.; Li, J.; Liu, X. Degradation mechanism for epoxy resins under combined electric, thermal and compressive stresses. Polym. Degrad. Stab. 2024, 230, 111038. [Google Scholar] [CrossRef]
  7. Lin, M.; Wu, G.; Liu, K.; Yan, X.; Tang, H. Review of Detection Methods for Typical Faults in Transformer Bushings. IEEE Electr. Insul. Mag. 2024, 40, 33–44. [Google Scholar] [CrossRef]
  8. Chen, M.; Liu, X.; Shao, Y.; Shang, G.; Zhang, Q.; Tang, H.; Liu, L. Degradation characteristics of insulation near aluminium foil edges inside dry-type bushing cores under electrothermal compound stress. High Volt. 2022, 7, 1153–1164. [Google Scholar] [CrossRef]
  9. Sun, H.; Yang, D.; Shi, W.; Sun, Y.; Liu, X. Influence of Multi-Order Harmonic Voltage on Degradation in Epoxy Resin Layer of High Voltage Valve Side Bushing. IEEE Trans. Dielectr. Electr. Insul. 2025, 3542002. [Google Scholar] [CrossRef]
  10. Elsadd, M.A.; Elsad, R.A.; Huwayz, M.A.; Mansour, S.A.; Zaky, M.S.; Elkalashy, N.I.; Izzularab, M.A. Improving the distribution system capability by incorporating ZnO nanoparticles into high-density polyethylene cable materials. Sci. Rep. 2024, 14, 25834. [Google Scholar] [CrossRef] [PubMed]
  11. Wang, Q.; Liao, J.; Tian, H.; Liu, P.; Peng, Z. Regularity analysis of the temperature distribution of epoxy impregnated paper converter transformer bushings. IEEE Trans. Dielectr. Electr. Insul. 2017, 24, 3254–3264. [Google Scholar] [CrossRef]
  12. Wang, Q.; Wang, H.; Peng, Z.; Liu, P.; Zhang, T.; Hu, W. 3-D coupled electromagnetic-fluid-thermal analysis of epoxy impregnated paper converter transformer bushings. IEEE Trans. Dielectr. Electr. Insul. 2017, 24, 630–638. [Google Scholar] [CrossRef]
  13. Yadav, S.; Chamorro, H.R.; Flores, W.C.; Mehta, R.K. Investigation of Improved Thermal Dissipation of ±800 kV Converter Transformer Bushing Employing Nano-Hexagonal Boron Nitride Paper Using FEM. IEEE Access 2021, 9, 149196–149217. [Google Scholar] [CrossRef]
  14. Xu, S.; Liu, J.; Li, K.; Ma, H.; Chen, P.; Huang, K. Analysis of Transformer GSB Bushing Fault Causes Based on Finite Element Simulation. J. Phys. Conf. Ser. 2024, 2800, 012002. [Google Scholar] [CrossRef]
  15. Zhu, W.; Xie, Q.; Lu, J. Seismic testing and fragility analysis considering material strength uncertainty of 1100 kV GFRP composite power transformer bushing. Case Stud. Constr. Mater. 2024, 21, e03564. [Google Scholar] [CrossRef]
  16. He, C.; Xie, Q.; Zhou, Y. Influence of flange on seismic performance of 1100-kV ultra-high voltage transformer bushing. Earthq. Spectra 2019, 35, 447–469. [Google Scholar] [CrossRef]
  17. Shi, Y.; Xie, G.; Wang, Q.; Li, X.; Yang, X.; Liu, P.; Peng, Z. Simulation analysis and calculation of electric field distribution characteristics of UHV wall bushing. Energy Rep. 2021, 7, 110–117. [Google Scholar] [CrossRef]
  18. IEC TS 61463; Bushings-Seismic Qualification. International Electrotechnical Commission: Geneva, Switzerland, 2016.
  19. GB/T 4109-2022; Insulated Bushings for Alternating Voltages Above 1000 V. Standards Press of China: Beijing, China, 2022.
  20. Lan, B.; Guo, N.; Li, J.; Tang, H.; Wang, X.; Ding, W. Multi-physical Field Coupling Simulation of DC Bushing Core Considering the Anisotropic Volume Conductivity of Resin Impregnated Paper. High Volt. Eng. 2025, 40, 900–912. [Google Scholar]
  21. IEC 60137:2017; Insulated Bushings for Alternating Voltages Above 1000 V. International Electrotechnical Commission: Geneva, Switzerland, 2017.
  22. GB/T 50260-2013; Code for Seismic Design of Electrical Installations. Standards Press of China: Beijing, China, 2013.
  23. Allahbakhshi, M.; Akbari, M. Heat analysis of the power transformer bushings using the finite element method. Appl. Therm. Eng. 2016, 100, 714–720. [Google Scholar] [CrossRef]
  24. Sitar, R.; Janic, Z.; Stih, Z. Improvement of thermal performance of generator step-up transformers. Appl. Therm. Eng. 2015, 78, 516–524. [Google Scholar] [CrossRef]
Figure 1. A schematic diagram of bushing structures with different voltage levels.
Energies 18 03239 g001aEnergies 18 03239 g001b
Figure 2. A structural representation of the 126 kV bushing simulation model.
Energies 18 03239 g002
Figure 3. A structure diagram of bushings for seismic calculation.
Energies 18 03239 g003
Figure 4. Simulation results of electric field strength in the bushing core for different voltage levels. (The blue arrow represents the ordinate of the blue curve, and the red arrow represents the ordinate of the red curve.)
Energies 18 03239 g004
Figure 5. The electric field distribution diagram of the 72.5 kV bushing under the 41.86 kV phase voltage.
Energies 18 03239 g005
Figure 6. The electric field distribution diagram of a 126 kV bushing under 72.75 kV phase voltage.
Energies 18 03239 g006
Figure 7. The electric field distribution diagram of a 72.5 kV bushing air end under 155 kV power frequency voltage.
Energies 18 03239 g007
Figure 8. The electric field distribution diagram of a 72.5 kV bushing transformer end under 155 kV power frequency voltage.
Energies 18 03239 g008
Figure 9. The electric field distribution diagram of a 126 kV bushing air end under 255 kV power frequency voltage.
Energies 18 03239 g009
Figure 10. The electric field distribution diagram of a 126 kV bushing transformer end under 255 kV power frequency voltage.
Energies 18 03239 g010
Figure 11. Temperature distribution of a 72.5 kV bushing under 2000 A current.
Energies 18 03239 g011
Figure 12. Temperature distribution of a 126 kV bushing under 1250 A current.
Energies 18 03239 g012
Table 1. Dimensions of bushing screens for three different voltage levels of bushings.
Voltage Level40.5 kV72.5 kV126 kV
Capacitance core radius (cm)4.611.613
Screen spacing (cm)0.250.2250.225
Length of screen (cm)0 #114.7147185
1 #98.7125.7154.5
2 #88.7116.1145.5
3 #80.3109.1136.7
4 #74101.9127.9
5 #67.694.6119.1
6 #60.987110.1
7 #53.779100.8
8 #/70.391.1
9 #//83.5
10 #//75.3
Table 2. Simulation boundary conditions for bushings of different voltage levels.
ModulesBoundary ConditionsUnit
Conductive rod, 0 # screenhigh voltageV
Other screensfloating potentialV
Bottom screen, flangegroundingV
Air25°C
Oil85°C
Heat transfer coefficient5W/(m2·K)
Current of conductive rod2000 (72.5 kV)A
1250 (126 kV)
Table 3. Material parameters of bushings for the simulation calculation.
MaterialsDensity/(kg/m3)Heat Conductivity/[W/(m·K)]Constant Pressure Heat Capacity/[J/(kg·K)]Conductivity/(S/m)Relative Permittivity
Copper8.964003855.998 × 1071
Epoxy resin-impregnated capacitor core2.210.107307 × 10−154.2
Aluminum foil screen3.902379001 × 1081
Silicone rubber2.200.207031 × 10−143.75
Air domain1.290.2510031 × 10−181
Table 4. Seismic calculation parameters for bushings of different voltage levels.
Voltage Level (kV)40.572.5126
Seismic intensity (degrees)888
agh0.3 g0.3 g0.3 g
agv0.15 g0.15 g0.15 g
mp (kg)78130220
dp (mm)386402585
A (°)000
P (Pa)707070
De (mm)270296350
Di (mm)230256310
dh (mm)6959311530
db (mm)498506666
Fop (N)200020004000
dtip (mm)88011561625
D (m)0.1520.1680.2
D (m)0.1050.1250.148
σ (MPa)505050
Table 5. Seismic calculation results for bushings of different voltage levels.
Voltage Level (kV)40.572.5126
Mbs (kN·m)0.661.152.84
Mbw (kN·m)0.060.090.24
Mbtip (kN·m)1.231.624.55
M (kN·m)1.962.867.63
MD (kN·m)13.51627.5
Table 6. Thermal short-circuit current calculation parameters for bushings of different voltage levels.
Voltage Level (kV)40.572.5126
θ0 (°C)120120120
Ith (kA)31.255031.25
tth (s)222
Ρ (μΩ·cm)7.11.852.83
D (cm)4.56.56.5
Table 7. Thermal short-circuit current calculation results for bushings of different voltage levels.
Voltage Level (kV)40.572.5126
St (cm2)15.922.9617.27
d (cm)1.8950.9691.198
Se (cm2)15.516.817.3
θf (°C)126130131
Table 8. Performance testing results of bushings at different voltage levels.
Voltage Level (kV)Power Frequency Withstand-Voltage Test (kV)Power Frequency Wet Withstand-Voltage Test (s)Lightning Impulse Full-Wave Test (kV)Partial Discharge Test (pC)Temperature Rise Test (°C)Seismic Test
40.510560250175.80.3 g
72.516560380174.50.3 g
12630560650172.40.3 g
Disclaimer/Publisher’s Note: The statements, opinions and data contained in all publications are solely those of the individual author(s) and contributor(s) and not of MDPI and/or the editor(s). MDPI and/or the editor(s) disclaim responsibility for any injury to people or property resulting from any ideas, methods, instructions or products referred to in the content.

