Abstract
This paper addresses the challenge of restoring electrical service in distribution systems (DS) under contingency scenarios using a genetic algorithm (GA) implemented in MATLAB. The proposed methodology seeks to maximize restored load, considering operational constraints such as line loadability, voltage limits, and radial topology preservation. It is evaluated with simulations on the IEEE 34-bus test system under four contingency scenarios that consider the disconnection of specific branches. The algorithm’s ability to restore service is demonstrated by identifying optimal auxiliary line reconnections. The method maximizes restored load, achieving between 97% and 99% load reconnection, with an average of 98.8% across the four cases analyzed. Bus voltages remain above 0.95 pu and below the upper limit. Furthermore, test feeder results demonstrate that line loadability is mostly below 60% of the post-reconfiguration loadability.
1. Introduction
1.1. Research Motivation and Graphical Framework
The growth in demand and supply creates the need to guarantee the reliability and continuity of the distribution network’s operation, especially in the face of contingency events. This has prompted the development of advanced reconfiguration strategies. These strategies seek to adapt network topologies, minimizing energy losses and complying with operational constraints, such as voltage limits and grid load capacity.
Figure 1 presents a graphical summary that synthesizes the methodology proposed in this work. It highlights, in the event of contingency events, the analysis of reconfiguration scenarios and the application of a GA to achieve optimal reconfiguration of the network topology to maximize the served load under key technical constraints, such as network loadability and voltage profile.
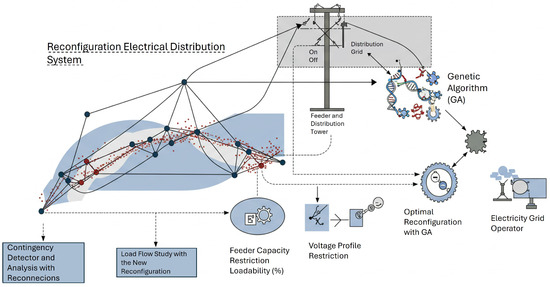
Figure 1.
Graphical abstract representing the reconfiguration strategy of DS under contingencies using GA.
1.2. Literature Review on Distribution Network Reconfiguration
Distribution systems are an essential component of the Electric Power System (EPS), whose purpose is to guarantee the supply of electrical energy to end users with high standards of quality and reliability [1]. The consolidation and strengthening of these networks is essential in the short and medium term in the face of sustained growth in demand, urban development, and the incorporation of new technologies in demand management and control [2,3,4].
The operation of an electrical grid must guarantee both security and reliability in the face of contingencies such as scheduled outages or unscheduled maintenance caused by equipment failures. This requires complex decisions to be made by system operators. In this context, the implementation of computational tools that allow real-time analysis and support automatic grid reconfiguration becomes a key strategy to minimize the impact of outages [5,6].
Merlín and Back introduced the concept of electrical grid reconfiguration in 1975, with the aim of reducing technical losses in distribution networks without considering operational constraints [7]. Several recent studies have focused their efforts on improving the efficiency of the reconfiguration process, considering criteria such as maximizing restored load, respecting voltage profiles, conductor loadability, and maintaining a radial topology [8,9]. In particular, models have been developed to optimize the operational sequence of switching devices, disconnectors, and breakers to accelerate service restoration, especially in small-scale networks.
Power supply quality is a fundamental responsibility for distribution companies, directly related to service reliability and the number of power outages. Grid reconfiguration is presented as a tool to improve this quality. Knowing detailed failure rates, obtained from real-world databases, is key to assessing the probability of failure in different configurations. One study [10] identified that underground cables and overhead lines are the main causes of grid failures, with estimated average annual failure rates of 0.1335 failures/km and 0.0514 failures/km, respectively, for cables and lines. These rates allow for better planning and operation, justifying the importance of reconfiguration in improving power supply quality.
In recent decades, this field has undergone significant evolution, particularly with the development of advanced heuristic techniques such as enhanced GA that incorporate adaptive operators [11] and hybrid metaheuristics, combining ant colony and fuzzy logic [1] for automatic restoration [1].
The authors in [12] proposed a methodology that prioritizes service restoration to the largest possible number of users, incorporating a sensitive analysis of three variables: voltage profile, conductor thermal capacity, and maintenance of the radial structure. For its part, study [8] introduces a conceptual framework for multifactor topology optimization, which simultaneously minimizes energy losses, balances demand, and improves operational performance. The authors highlight that for complex systems (urban grids or those with high renewable penetration), combined metaheuristics—particularly GA, ant colony optimization, and particle swarm optimization—offer the best balance between accuracy and computational time.
A particularly interesting contribution comes from [13], who designed a specialized two-phase GA for small-scale distribution networks. The first phase ensures radial configuration using an innovative crossover operator, while the second phase dynamically optimizes the states of protection devices (disconnectors and breakers), achieving reductions in energy losses of up to 25% compared to conventional methods. This scalable approach has proven to be especially effective in isolated microgrids.
The authors of [14] present a method for reconfiguring distribution networks to maximize the out-of-service load, taking into account sensitivity indicators such as voltage profiles and conductor load capacity, while maintaining a radial topology. In [15], the authors propose a reconfiguration phase for DS that aims to find the optimal topology of the system with respect to energy loss, demand, and operational performance. Furthermore, they mention that for complex models, heuristic and metaheuristic methods such as GA, ant colony algorithms, and particle swarm algorithms are applied.
The authors in [13] cite Watanabe and Nodu, who present a solution to the problem of restoring service in small DS, using a two-step GA to reduce energy loss. The first step involves creating networks with a radial topology, and the second step optimizes the operating sequence of open and/or closed devices to minimize energy loss.
The reconfiguration of primary feeders in distribution networks seeks to improve topology characteristics by using them to modify them. This is intended to reduce electrical losses and the number of customers affected by a power outage by opening or closing disconnectors and switches [16,17].
A recent relevant contribution to grid operational resilience is the work of [18], who introduced the concept of an assembly of robot-managed storage units that, when integrated with grid modernization, simultaneously improves stability, reliability, and distribution optimization in urban grids. Their study demonstrates that coordinated management of distributed storage can absorb and dispatch power in real time to mitigate contingencies and demand peaks, presenting a promising avenue for increasing the resilience of smart DS to complex contingencies.
To restructure primary feeders, it is necessary to verify the safety of transfer operations, contingency conditions, and the number of operations. This will reduce the value of undelivered energy and provide efficient electrical service to customers [8,19]. The operation of distribution networks requires maintaining the radial configuration, ensuring the proper functioning of protections, respecting voltage limits, and controlling conductor loadability. Furthermore, the goal is to protect feeders against failures, reduce the frequency and duration of interruptions, and quickly restore service, thereby improving the continuity of the power supply and optimizing network operating costs [8,20]. For this purpose, there are several methodologies, among which those described in Table 1 stand out.

Table 1.
Techniques and methods for feeder reconfiguration.
Additionally, a bibliometric study has been carried out with 569 scientific articles published between 2021 and 2025 related to the topic shown in Figure 2, where the results reveal that DS, grid reconfiguration, and electric power distribution represent the main research groups, reflecting the high relevance of these topics in the recent literature. It is worth noting that GA and heuristic methods are widely used to solve reconfiguration problems, often associated with objectives such as power loss reduction, voltage profile improvement, and power flow optimization.
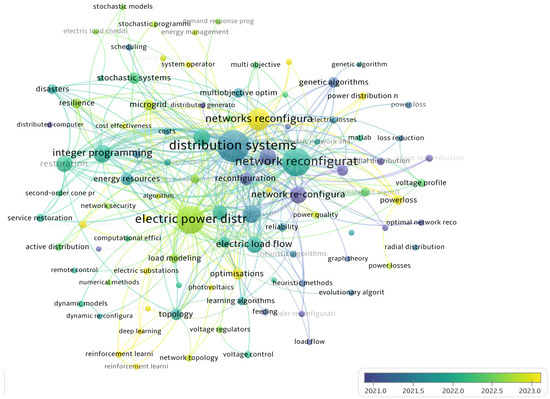
Figure 2.
Bibliometric map of research topics related to distribution system reconfiguration (2021–2025).
The trends identified in the bibliometric map in Figure 2 include dynamic reconfiguration and deep learning techniques, demonstrating a shift toward intelligent and adaptive approaches to improving system resilience. Furthermore, the analysis highlights the growing attention to operational constraints, such as load capacity and voltage stability, especially in contingency scenarios, highlighting the increasing complexity of modern distribution network management.
This article addresses the optimization problem associated with restoring electrical service in radial distribution networks under contingency conditions. The objective is to maximize the reconnected load, considering technical constraints such as conductor loadability, voltage limits, and the radial structure of the system. To this end, a methodology based on GA is proposed, the effectiveness of which is evaluated through simulations applied to the 34-node IEEE system.
The document is structured as follows: Section 2 presents the materials and methods, including the problem statement, the objective function, and the GA-based procedure; Section 3 presents the results obtained for the four contingency cases analyzed; Section 4 discusses these findings; and Section 5 presents the conclusions and future work directions.
2. Materials and Methods
The main challenge in restoring electrical service after a power outage due to unscheduled contingencies is finding the optimal reconfiguration of the distribution network that allows, as much as possible, the largest number of users to be powered. This will depend on the proper activation of the disconnection and sectioning devices, which allow load transfer within the permitted technical constraints of voltage limits at each node and the maximum load capacity of the feeders. Furthermore, it is necessary to maintain the radial topology, since most DS operate under this scheme [16]. The problem lies in properly identifying the optimal positions for the current and future states of the sectioning devices, represented as binary variables: “1” operating and “0” inoperative. The solution to this problem is combinatorial in nature and requires optimization methods that consider the technical constraints of the system [28]. There are several tools, as explained in the previous section. Among them, GAs stand out for their efficient exploration of all possible search spaces, their ability to generate multiple solutions simultaneously, their adaptability to nonlinear problems, and their widespread use in electrical system optimization [29,30]. In electrical grid reconfiguration, a simplified genetic representation is used by coding the radial topology, identifying only switches in an inoperative or open “0” condition, allowing the search space to be reduced [31]. The algorithm is guided by an objective function that evaluates performance. A nonlinear mixed integer mathematical model is formulated with the objective of minimizing the unserved load during a contingency, subject to improving voltage profiles with adequate grid loadability indicators [14,28].
2.1. Objective Function
The objective function, Equation (1), seeks to minimize the set of de-energized nodes, considering the following:
- Nodal loads;
- Binary breaker state variables;
This formulation ensures that the solutions found not only restore service, but also do so while meeting the technical requirements that ensure quality and reliability of supply [29].
Subject to
Here, the elements are represented as follows:
- Z—weighted restored load;
- —priority coefficient for critical users in node K;
- —node load K;
- —binary decision variable of the problem;
- R—de-energized load set;
- —current between nodes i and j;
- —maximum current supported by a conductor;
- —minimum allowed nodal voltage;
- —maximum allowed nodal voltage;
- —number of connected branches of the system;
- —total number of connected nodes of the system.
To reflect the importance of critical users, the objective function is weighted by a priority coefficient . The value is assigned to conventional loads, while is reserved for essential node facilities, such as hospitals. In this way, the algorithm restores these types of loads first.
The objective function minimizes the unsupplied energy, ensuring the immediate reconnection of the largest amount of load through existing auxiliary branches. This criterion seeks to keep the duration and magnitude of disconnection below the regulated thresholds: 24 continuous hours and 72 annual hours for residential consumers, thus avoiding financial penalties for the distribution company. Although the exact limits depend on each country’s regulatory framework, the adopted formulation generally ensures the minimum possible interruption.
2.2. Methodology
The methodology presented below is based on the application of a GA for the optimal reconfiguration of a DS in the event of contingencies, considering operational constraints, with the objective of restoring service and minimizing undelivered energy. Algorithm 1 details the complete flow of each step, from system initialization and parameter configuration to the genetic operators and the convergence criterion. It specifies the variables used and their values, providing a better understanding of the methodology followed.
The pseudocode shown in Algorithm 1 details the procedure for restoring distribution systems under contingency conditions developed in this study. It is based on a GA. Initially (Step 1), all the DS information is loaded, in this case, the 34-node IEEE test grid. A base-case load-flow analysis is performed, and a simulated fault is introduced to create a contingency scenario in the various sections of the network. Then (Step 2), the input parameters of the GA are configured, defining the initial population (), demand limits (, ), line parameters (X, R and ), voltage constraints (, ), and loadability margins () and a vector of priority coefficients (), where for conventional loads and for critical loads. Subsequently (Step 3), a population of candidate solutions is randomly generated. Each individual is evaluated (Step 4) through a load-flow calculation that yields the nodal voltages () and line loadabilities (); the fitness is then computed as the weighted restored load Z, so that the algorithm inherently prioritises the reconnection of critical users. Next (Step 5), it is verified that each solution complies with the technical operating constraints, ensuring its viability. Genetic operators (Step 6), such as crossover (80%) and mutation (10%), are applied to generate new populations. This process is repeated iteratively (Step 7) until convergence is reached. Finally (Step 8), the best-performing individual is selected, corresponding to the optimal reconfiguration that restores the greatest amount of load while respecting operational constraints and preserving the radial topology of the network.
| Algorithm 1 Distribution System Optimization Using Genetic Algorithm (GA). |
|
The proposed model focuses on radial systems without distributed energy resources (DER). The addition of photovoltaic, wind, and storage generation modifies the directionality of power flows and voltage profiles. Adapting the proposed methodology requires introducing generating nodes, bidirectional balances, and multi-criteria objective functions that consider both load restoration and local production coordination. These extensions are proposed as an immediate line of research.
It should be noted that the maneuvers analyzed are executed assuming the availability of the disconnectors and reserve lines currently in place in the test network (dotted lines in Figure 3, Figure 4, Figure 5 and Figure 6); therefore, the construction of new distribution sections is not considered. In real systems with low transfer capacity, the practical implementation of certain adjustments could require the installation of additional lines, which would entail capital investments that must be evaluated through specific cost–benefit studies.
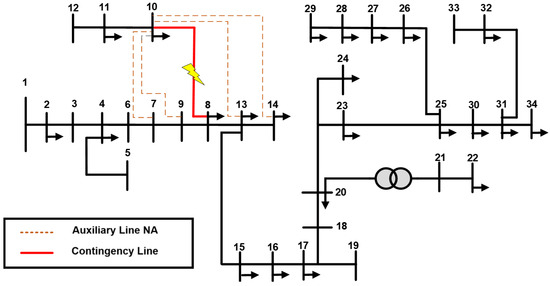
Figure 3.
Contingency in Line 8–10 and Reconnection Options, where yellow lightning represents distribution line under contingency state.
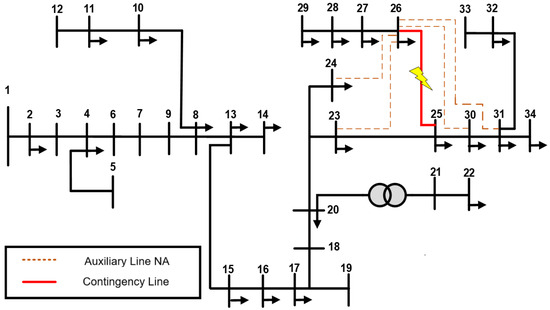
Figure 4.
Contingency in Line 25–26 and reconnection options, where yellow lightning represents distribution line under contingency state.
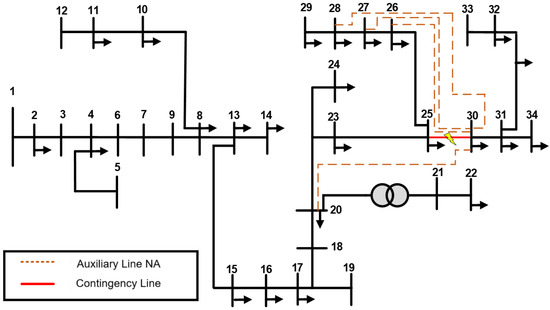
Figure 5.
Contingency in Line 25–30 and reconnection options, where yellow lightning represents distribution line under contingency state.
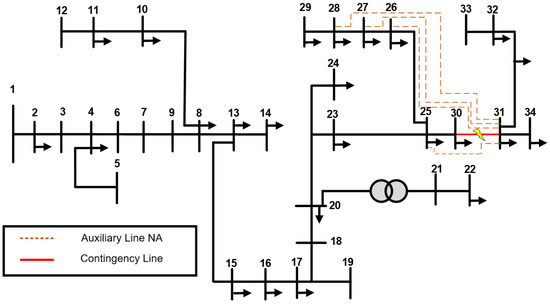
Figure 6.
Contingency in Line 30–31 and reconnection options, where yellow lightning represents distribution line under contingency state.
2.3. Case Studies
Algorithm 1 was implemented and evaluated in the IEEE’s 34-node DS. Simulations were developed in MATLAB Rb2024b, using the MATPOWER library to calculate power flow. This test system allows the analysis of the algorithm’s effectiveness under different contingencies. The algorithm validation considers four case studies, each associated with a different contingency; in each case, the contingency consists of the complete disconnection of the indicated distribution line, understood as the forced opening of the switches due to any electrical failure, which causes the loss of supply in all the bars associated with that section.
2.3.1. Case 1: Contingency on Line 8–10
Load shedding occurs due to a fault between nodes 8 and 10. After isolating the fault zone using protection devices, the out-of-service region is identified and the GA algorithm is applied to find the optimal reconfiguration to restore power with the 4 possible options (dashed line), as shown in Figure 3.
2.3.2. Case 2: Contingency on Line 25–26
The disconnection of the line between nodes 25 and 26 is simulated, causing the disconnection of the load associated with each branch. The GA algorithm is applied to find the optimal reconfiguration to restore power with the 4 possible options (dashed line), as shown in Figure 4.
2.3.3. Case 3: Contingency on Line 25–30
A contingency occurs on the line connecting nodes 25 and 30. The GA finds the best sequence of maneuvers to restore power supply in the affected area with the four possible options (dashed lines) as shown in Figure 5.
2.3.4. Case 4: Contingency on Line 30–31
Finally, a failure between nodes 30 and 31 is analyzed. The simulation confirms the GA’s ability to reconfigure the network while maintaining the radial topology and respecting operational constraints with the four possible options (dashed lines), as shown in Figure 6.
3. Results
This section presents a detailed analysis of the results obtained after applying the GA to the IEEE’s 34-node DS. It evaluates its effectiveness in each of the four contingency scenarios detailed in Section 2.
It compares the results obtained with an initial baseline case, where the voltage profile variables of each node and the load capacity of all lines in the system are within acceptable operating conditions. Figure 7 and Figure 8 show each variable of the baseline system, respectively.
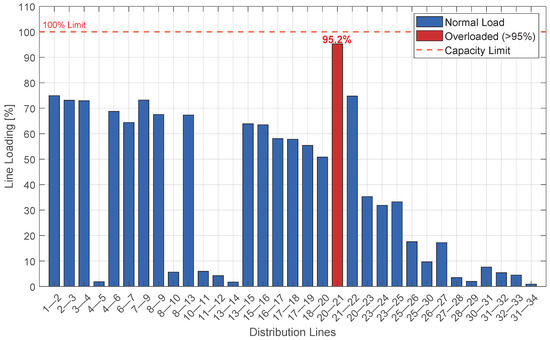
Figure 7.
Line loading profile of the base case for the IEEE 34-bus test system.
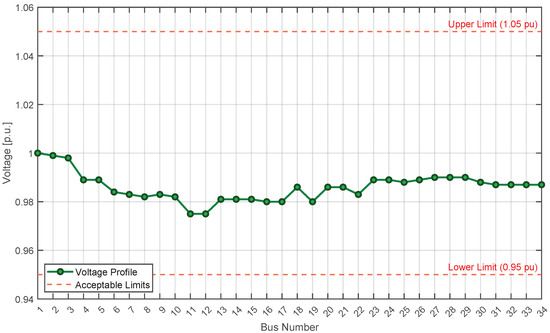
Figure 8.
Voltage profile of the base case for the IEEE 34-bus test system.
3.1. Case 1: Contingency on Line 8–10
A contingency on the line connected between nodes 8 and 10 is analyzed. The reconnection options evaluated are 7–10, 9–10, 10–13, and 10–14. The voltage profile results shown in Figure 9 show that line 9–10 offers the best voltages at the system nodes, and especially at the nodes closest to the contingency, compared to the three remaining options analyzed. This solution presents optimal performance in terms of voltage and load stability, ruling out the other alternatives due to exceeding operating limits or exhibiting lower quality of service.
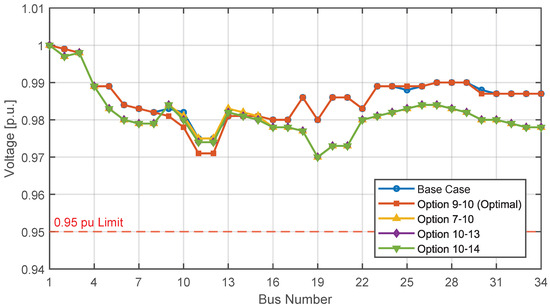
Figure 9.
Comparison of voltage profiles for base case and reconfiguration after contingency on line 8–10.
Figure 10 and Figure 11 compare the baseline configuration with the final reconfiguration, demonstrating improvements in operating performance. The voltage is close to 0.98 pu and the chargeability is 71.71%. Figure 12 illustrates the reconfigured system, with lines 9–10 active as the final solution for the case study.
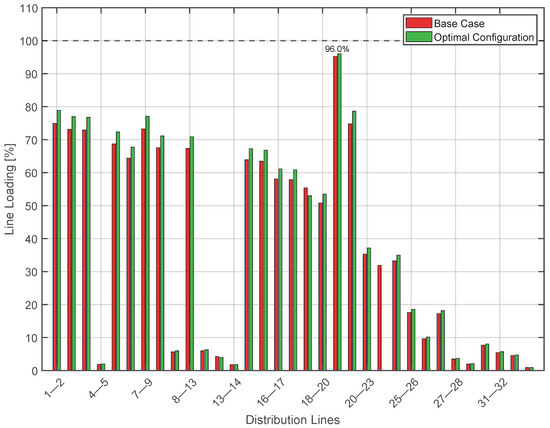
Figure 10.
Comparison of line loading profiles for base case and reconfiguration after contingency on line 8–10.
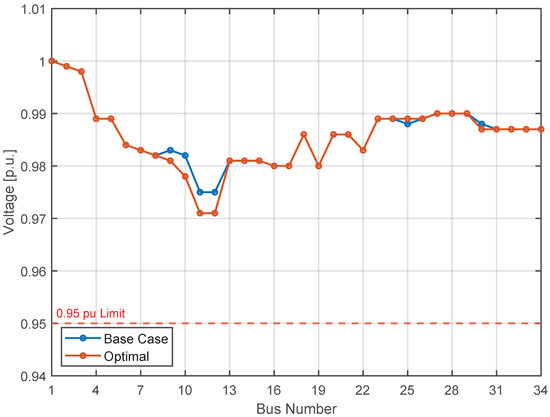
Figure 11.
Comparison of voltage profiles for base case and reconfiguration after contingency on line 8–10.
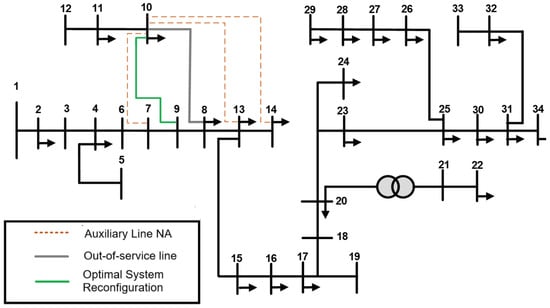
Figure 12.
Restoration strategy by reconnecting line 9–10 following contingency on line 8–10.
3.2. Case 2: Contingency on Line 25–26
The disconnection analyzed occurred on the line located between nodes 25 and 26, along with the candidate reconnections: 24–26, 23–26, 26–30, and 26–31. The algorithm determined that the best reconfiguration alternative is connection 24–26 because it presents the best operating characteristics. Figure 13 indicates that, although some lines have a higher load capacity than the base case, none exceed 100%, and the contingency zone is correctly energized.
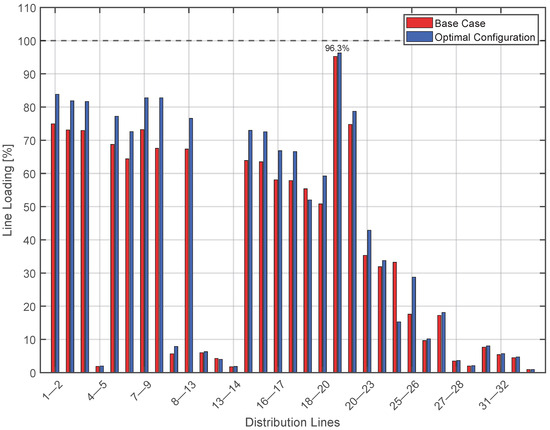
Figure 13.
Comparison of line loading profiles for base case and reconfiguration after contingency on line 25–26.
Regarding the voltage profile, shown in Figure 14, although lower values than the original ones are observed, these are within the allowed limits. Figure 15 shows the system topology after reconfiguration, with the optimal connection implemented.
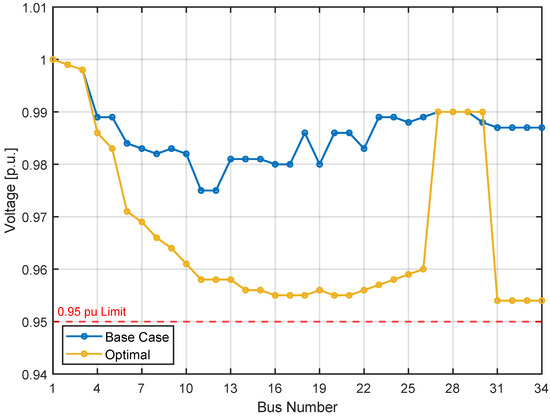
Figure 14.
Comparison of voltage profiles for base case and reconfiguration after contingency on line 25–26.
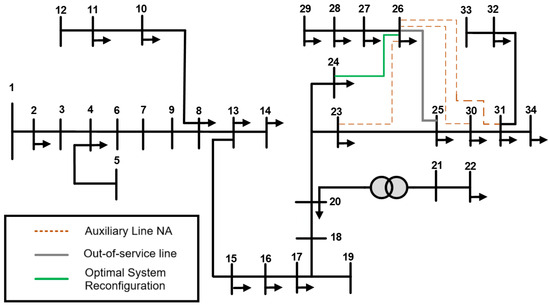
Figure 15.
Restoration strategy by reconnecting line 24–26 following contingency on line 25–26.
3.3. Case 3: Contingency on Line 25–30
In this case, a failure between nodes 25 and 30 is considered, and possible reconnections via lines 27–30, 28–30, 26–30, and 20–30 are analyzed. The optimal network reconfiguration selected by the algorithm was line 26–30.
Figure 16 shows that this reconfiguration maintains load capacity within safe limits. Although some lines, such as lines 25–26, register increases compared to the base case, these do not compromise network operation.
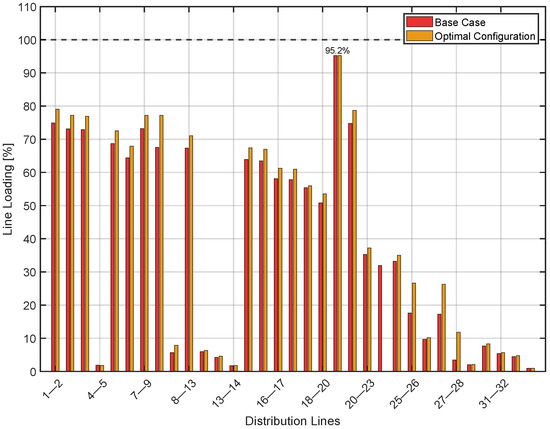
Figure 16.
Comparison of line loading profiles for base case and reconfiguration after contingency on line 25–30.
Figure 17 shows the comparative voltage profiles. Buses 30, 31, 32, and 34 show drops of around 0.8% compared to the base case, while the remaining nodes maintain their voltage levels, keeping the entire network within acceptable and operational limits. Figure 18 represents the reconfigured system with the new connection.
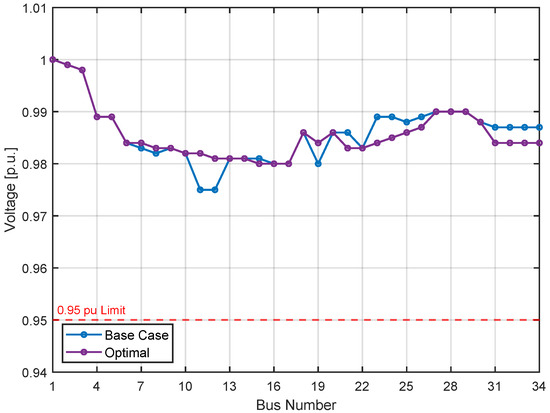
Figure 17.
Comparison of voltage profiles for base case and reconfiguration after contingency on line 25–30.
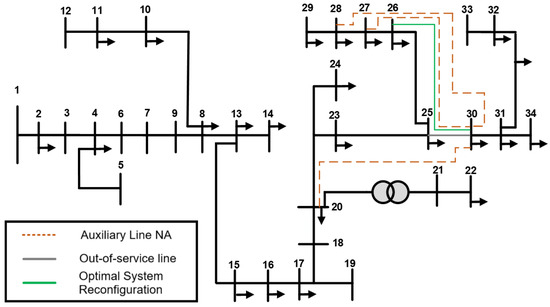
Figure 18.
Restoration strategy by reconnecting line 26–30 following contingency on line 25–30.
3.4. Case 4: Contingency on Line 30–31
The last proposed case study analyzes the contingency between nodes 30–31 and their reconnections through nodes 25–31, 26–31, 27–31, and 28–31, the latter being the most suitable connection according to the algorithm.
Figure 19 shows an overall load capacity below 80%, a technically acceptable solution. Despite slight increases on lines 25–26, 26–27, and 27–28, system stability is not compromised.
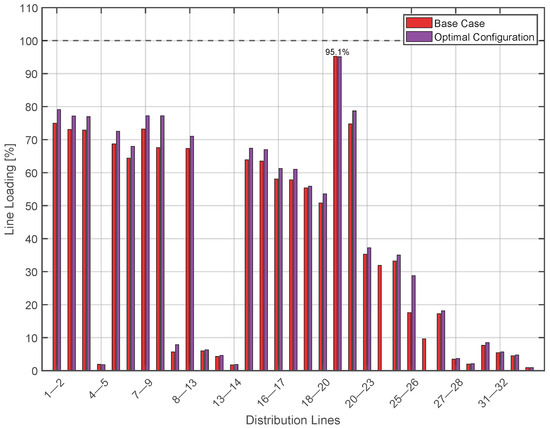
Figure 19.
Comparison of line loading profiles for base case and reconfiguration after contingency on line 25–30.
Figure 20 confirms that the voltage profiles remain within technical limits, with no significant deviations from the baseline system. Finally, Figure 21 shows the system topology with the new connection operational.
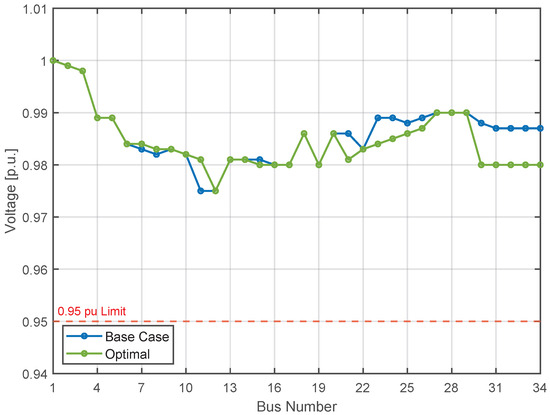
Figure 20.
Comparison of voltage profiles for base case and reconfiguration after contingency on line 30–31.
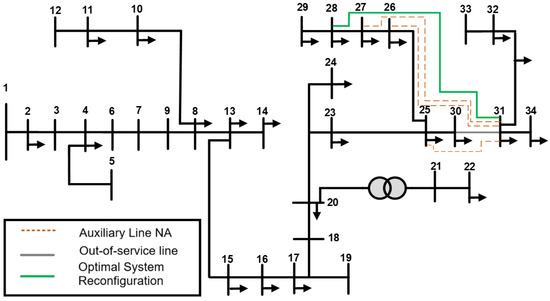
Figure 21.
Restoration strategy by reconnecting line 28–31 following contingency on line 30–31.
4. Discussion
The evaluation of reconfiguration strategies in DS considering load margins and contingencies demonstrates the effectiveness of the GA-based approach in improving operational resilience. In each case analyzed, specific auxiliary lines were selected: 9–10 in Case 1, 24–26 in Case 2, 26–30 in Case 3, and 28–31 in Case 4. These lines displayed behaviors consistent with their activation. For example, 9–10 in Case 1 operated with a moderate flow (5.97%), while 26–30 and 28–31, used in Cases 3 and 4, respectively, presented loadabilities of 26.64% and 26.85%, reflecting their central role in restoring flow after contingencies. In contrast, lines 24–26, connected in Case 2, showed no load, suggesting that the grid found more efficient alternative routes without compromising operation.
Regarding the voltage profile, the data confirm a clear improvement compared to the base case. Initially, the system exhibited minimum voltages as low as 0.960 pu on several buses, reflecting a critical proximity to the lower operating limit of 0.95 pu. After reconfiguration, the voltage profiles stabilized or improved in all cases. In Case 1, the critical buses rose to 0.971–0.978 pu; in Case 2, although the values remained close to 0.954–0.956 pu, they remained within the allowable range. Cases 3 and 4 offered the most robust profiles, maintaining voltages above 0.975pu on most buses, with minimums of 0.980pu observed on buses 16, 17, and 31–34. This evolution demonstrates that the solutions obtained not only optimize load distribution and prevent overloads but also reinforce the system’s voltage stability in the face of contingency events. Overall, the results validate that the proposed methodology increases both the load margin and operational safety, meeting the resilience criteria required in modern distribution networks.
The application of the GA allowed for the restoration of between 97% and 99% of the disconnected demand in the four contingency scenarios, with an average of 98.8%. In absolute terms, the unsupplied energy was reduced from 12.3% to 1.2%, with the worst-case scenario showing a maximum deficit of only 1.6%. These results demonstrate the method’s ability to virtually eliminate interrupted load, ensuring service continuity in line with reliability standards in medium-voltage distribution networks.
Table 2 summarizes six recent and representative works on distribution network reconfiguration, selected based on citation metrics, impact in Scopus/IEEE-indexed journals, and methodological relevance, published within the past five years. The reviewed approaches include GA, Binary Particle Swarm Optimization (BPSO), Mixed-Integer Linear Programming (MILP), and Improved Coyote Optimization Algorithms (ICOA), applied to test systems ranging from small synthetic feeders to large-scale balanced and unbalanced IEEE test networks. Most of these studies focus on minimizing power losses or total operational cost—particularly when considering distributed generation (DG), conductor sizing, and emerging technologies such as Plug-in Hybrid Electric Vehicles (PHEVs). Reported loss reductions range from 11% to 85.23%, with all proposed solutions maintaining or improving voltage profiles typically above 0.95 p.u.
Table 2.
Summary of methodologies and results for distribution network reconfiguration.
Compared to these benchmark results, the present work demonstrates highly competitive performance by addressing a complementary objective: maximizing load reconnection under contingency scenarios. The proposed GA-based methodology, tested on the IEEE 34-bus system across four critical contingencies, achieves 97–99% load restoration, a performance not directly targeted by the referenced works. Furthermore, the voltage profile is maintained strictly within operational limits [0.95, 1.05] p.u., and line loadability remains below 60% post-reconfiguration. These results validate the effectiveness of the proposed approach for real-time resilience enhancement and service restoration in modern distribution networks.
Weighting the objective function with allows the prioritization of the restoration of critical users without yet needing to know line-specific failure rates. These rates, as well as the spatial variability of failures in overhead lines and cables, will be incorporated into a probabilistic economic extension of the model.
The proposed model, by minimizing unsupplied energy by immediately reconnecting the load through available auxiliary branches, aims to ensure that the duration and magnitude of interruptions remain within regulated thresholds, thus preventing the distribution company from incurring penalties for lack of service continuity. Many regulatory frameworks allow disconnection of third-category consumers for up to 24 continuous hours and 72 cumulative hours per year without penalty; the results obtained show that optimal configurations restore the load in times well below these limits.
It should be noted that the study was conducted on a radial system that does not include DER and assumes only the disconnectors and distribution lines already installed in the grid. The integration of renewable sources of any type and storage would modify both the directionality of power flows and voltage profiles, requiring an extended model with additional generation nodes, bidirectional power balances, and new operating constraints.
Furthermore, on real feeders with limited transfer capacity, some of the reconfiguration alternatives analyzed here could require the construction of new interconnections, the capital expenditure of which must be weighed against the expected gains in reliability and loss reduction through detailed cost–benefit studies. Addressing these two aspects will be considered a key line of future research to complete this work.
Based on the results obtained, future research projects can be proposed, including additional economic and reliability criteria to the electrical variables analyzed, transforming them into a multi-objective optimization problem. Additionally, a predictive model for the optimal placement of connection and protection devices is developed, enabling a faster response to contingencies. Another interesting line of research is the integration of the algorithm with alternative methods to compare convergence efficiency and solution quality. Finally, it can be implemented in smart grid environments, considering the inclusion of DER and storage systems, considering bidirectional flows, renewable variability, and stochastic demand scenarios, in order to evaluate the robustness of the reconfiguration.
5. Conclusions
The proposed reconfiguration algorithm restored between 97% and 99% of the initially disconnected load, reaching an average of 98.8%; the unsupplied energy was reduced from 12.3% to 1.2%, and in the worst-case scenario, the maximum deficit was only 1.6%. This result confirms that the methodology identifies topologies capable of restoring service to users even when the damaged section is isolated.
Under the four scenarios analyzed, the reconfiguration maintained the voltages within the operating range of 0.95–1.05 pu. The system minimum value, recorded after activation of the 24–26 alternative (Case 2), was 0.954 pu, still above the regulatory threshold of 0.95 pu. For the 9–10 alternative (Case 1), the minimum was 0.971 pu, while in the 26–30 and 28–31 configurations (Cases 3 and 4), the lowest voltages were 0.980 pu. Conversely, the maximum values remained close to 1 pu on all buses. These results confirm that the algorithm eliminates critical voltage drops and stabilizes the profile throughout the network, ensuring safe operation after each contingency.
The reconfiguration redistributed flows and eliminated overloads; the most stressed line in the base case (20–21) was operating at 95% of its continuous capacity, and after applying alternatives 9–10, 24–26, 26–30, and 28–31, this maximum value remained in the same order, with no line exceeding 100% of its thermal limit. The average conductor occupancy dropped from 46% to 38%, and 27 of the 33 lines fell below 60% in all the resulting topologies, confirming a comfortable operating margin and the absence of thermal risks following the optimal maneuver.
The inclusion of the priority coefficient in the objective function ensured that critical loads were energized preferentially, without compromising the overall quality of the solution; this demonstrates the flexibility of the approach to adapt to different service continuity criteria. Furthermore, in all tests, the radial topology was maintained, the voltage and capacity limits of the conductors were respected, and operational maneuvers were minimized, demonstrating the robustness of the scheme in the face of contingencies.
The limitations identified regarding the lack of explicit inclusion of DER, economic costs, regulatory penalties, and branch failure rates are highlighted for future research; however, the results confirmed that, within the technical framework considered, the proposal constitutes an effective tool for increasing the resilience of medium voltage distribution networks.
Author Contributions
Methodology, J.M. and L.T.; Formal analysis, M.J.; Investigation, J.M.; Resources, C.C.; Data curation, L.T.; Writing—original draft, J.M.; Writing—review & editing, M.J.; Visualization, C.C. All authors have read and agreed to the published version of the manuscript.
Funding
This research and APC were funded by the Salesian Polytechnic University and the GIREI—Smart Grid Research Group.
Data Availability Statement
The original contributions presented in the study are included in the article, further inquiries can be directed to the corresponding author.
Conflicts of Interest
The authors declare no conflicts of interest.
Abbreviations
The following abbreviations are used in this manuscript:
| BPSO | Binary Particle Swarm Optimization |
| DER | Distributed Energy Resources |
| DS | Distribution System |
| GA | Genetic Algorithm |
| ICOA | Improved Coyote Optimization Algorithms |
| MILP | Mixed-Integer Linear Programming |
| current on branch i–j | |
| maximum conductor current capacity | |
| initial population | |
| load at node k | |
| minimum active power demand | |
| active power demand at a node | |
| power flow on branch i–j for individual i | |
| maximum power flow on a line | |
| maximum reactive power demand | |
| reactive power demand at a node | |
| voltage profile vector of individual i | |
| , | lower and upper voltage limits |
| priority coefficient for node k | |
| line loadability (relative to ) | |
| binary energization variable for node k (1 = energized) | |
| Z | weighted restored load. |
References
- Salau, A.O.; Gebru, Y.W.; Bitew, D. Optimal network reconfiguration for power loss minimization and voltage profile enhancement in distribution systems. Heliyon 2020, 6, e04233. [Google Scholar] [CrossRef] [PubMed]
- Choobdari, M.; Moghaddam, M.S.; Davarzani, R.; Azarfar, A.; Hoseinpour, H. Robust distribution networks reconfiguration considering the improvement of network resilience considering renewable energy resources. Sci. Rep. 2024, 14, 23041. [Google Scholar] [CrossRef] [PubMed]
- Musaruddin, M.; Tambi, T.; Zulkaidah, W.; Masikki, G.A.N.; Lolok, A.; Djohar, A.; Marwan, M. Optimizing network reconfiguration to reduce power loss and improve the voltage profile in the distribution system: A practical case study. e-Prime—Adv. Electr. Eng. Electron. Energy 2024, 8, 100599. [Google Scholar] [CrossRef]
- Jacob, R.A.; Zhang, J. Distribution Network Reconfiguration to Increase Photovoltaic Hosting Capacity. In Proceedings of the 2020 IEEE Power & Energy Society General Meeting (PESGM), Montreal, QC, Canada, 2–6 August 2020; Volume 2020. [Google Scholar] [CrossRef]
- Zhang, K.; Zhu, R.; Song, R.; Shi, F.; Shi, S.; Fang, C. A Mesh Analysis Model and the Coherent Evaluation Index System for Urban Distribution Network Planning. In Proceedings of the 2021 3rd Asia Energy and Electrical Engineering Symposium (AEEES), Chengdu, China, 26–29 March 2021; pp. 443–447. [Google Scholar] [CrossRef]
- Mahdavi, M.; Alhelou, H.H.; Hatziargyriou, N.D.; Jurado, F. Reconfiguration of Electric Power Distribution Systems: Comprehensive Review and Classification. IEEE Access 2021, 9, 118502–118527. [Google Scholar] [CrossRef]
- Liu, J.; Zhang, Q.; Li, J.; Wang, Y. An Iterative Heuristic Method to Determine Radial Topology for Distribution System Restoration. In Proceedings of the 2021 IEEE 4th International Electrical and Energy Conference (CIEEC), Wuhan, China, 28–30 May 2021. [Google Scholar] [CrossRef]
- Iftikhar, M.Z.; Imran, K. Network reconfiguration and integration of distributed energy resources in distribution network by novel optimization techniques. Energy Rep. 2024, 12, 3155–3179. [Google Scholar] [CrossRef]
- Vargas, G.A.D.; Mosquera, D.J.; Trujillo, E.R. Optimization of Topological Reconfiguration in Electric Power Systems Using Genetic Algorithm and Nonlinear Programming with Discontinuous Derivatives. Electronics 2024, 13, 616. [Google Scholar] [CrossRef]
- Clavijo-Blanco, J.; Rosendo-Macías, J. Failure rates in distribution networks: Estimation methodology and application. Electr. Power Syst. Res. 2020, 185, 106398. [Google Scholar] [CrossRef]
- Dehghany, N.; Asghari, R. Multi-objective optimal reconfiguration of distribution networks using a novel meta-heuristic algorithm. Int. J. Electr. Comput. Eng. 2024, 14, 3557–3569. [Google Scholar] [CrossRef]
- Lei, S.; Chen, C.; Song, Y.; Hou, Y. Radiality Constraints for Resilient Reconfiguration of Distribution Systems: Formulation and Application to Microgrid Formation. IEEE Trans. Smart Grid 2020, 11, 3944–3956. [Google Scholar] [CrossRef]
- Bassey, O.; Butler-Purry, K.L.; Chen, B. Dynamic Modeling of Sequential Service Restoration in Islanded Single Master Microgrids. IEEE Trans. Power Syst. 2020, 35, 202–214. [Google Scholar] [CrossRef]
- Guimarães, I.G.; Bernardon, D.P.; Garcia, V.J.; Schmitz, M.; Pfitscher, L.L. A decomposition heuristic algorithm for dynamic reconfiguration after contingency situations in distribution systems considering island operations. Electr. Power Syst. Res. 2021, 192, 106969. [Google Scholar] [CrossRef]
- Jayabarathi, T.; Raghunathan, T.; Mithulananthan, N.; Cherukuri, S.; Loknath Sai, G. Enhancement of distribution system performance with reconfiguration, distributed generation and capacitor bank deployment. Heliyon 2024, 10, e26343. [Google Scholar] [CrossRef] [PubMed]
- Olabode, O.E.; Akinyele, D.O.; Ajewole, T.O.; Omogoye, S.O.; Raji, A.A. Impact of integrating type-1 distributed generation on distribution network using modified genetic algorithm and voltage stability index: A technical and cost–benefit analysis approach. J. Eng. Appl. Sci. 2024, 71, 222. [Google Scholar] [CrossRef]
- Dukovska, I.; Morren, J.; Slootweg, H.J.G. Switching Sequence Optimization for Service Restoration in Distribution Networks. In Proceedings of the 2020 IEEE PES Innovative Smart Grid Technologies Europe (ISGT-Europe), The Hague, The Netherlands, 26–28 October 2020; Volume 2020, pp. 6–10. [Google Scholar] [CrossRef]
- Arun, M.; Samal, S.; Barik, D.; Chandran, S.S.; Tudu, K.; Praveenkumar, S. Integration of energy storage systems and grid modernization for reliable urban power management toward future energy sustainability. J. Energy Storage 2025, 114, 115830. [Google Scholar] [CrossRef]
- Mariño, W.; Muñoz, J.; Jaramillo, M.; Barrera-Singaña, C.; Pavón, W. Distribution System Reconfiguration for Voltage Profile Improvement Using Enhanced Particle Swarm Optimization. In Proceedings of the 2023 IEEE IAS Global Conference on Renewable Energy and Hydrogen Technologies (GlobConHT), Male, Maldives, 11–12 March 2023; pp. 1–6. [Google Scholar] [CrossRef]
- Di, H.; Bao, Y.; Wang, B. Research on Distribution Network Reconfiguration Based on Deep Q-Learning Network. In Proceedings of the 2020 IEEE 4th Conference on Energy Internet and Energy System Integration (EI2), Wuhan, China, 30 October–1 November 2020; pp. 2728–2732. [Google Scholar] [CrossRef]
- Jakus, D.; Čađenović, R.; Vasilj, J.; Sarajčev, P. Optimal Reconfiguration of Distribution Networks Using Hybrid Heuristic-Genetic Algorithm. Energy 2024, 13, 1544. [Google Scholar] [CrossRef]
- Xia, N.; Deng, J.; Zheng, T.; Zhang, H.; Wang, J.; Peng, S.; Cheng, L. Fuzzy Logic Based Network Reconfiguration Strategy During Power System Restoration. IEEE Syst. J. 2021, 16, 4735–4743. [Google Scholar] [CrossRef]
- Adewuyi, O.B.; Krishnamurthy, S. Performance Analysis for Predictive Voltage Stability Monitoring Using Enhanced Adaptive Neuro-Fuzzy Expert System. Mathematics 2024, 12, 3008. [Google Scholar] [CrossRef]
- Gautam, M.; Bhusal, N.; Benidris, M. Deep Q-Learning-based Distribution Network Reconfiguration for Reliability Improvement. In Proceedings of the 2022 IEEE/PES Transmission and Distribution Conference and Exposition (T&D), New Orleans, LA, USA, 25–28 April 2022; pp. 1–5. [Google Scholar] [CrossRef]
- Nakiganda, A.M.; Cheylan, C.; Chatzivasileiadis, S. Topology-Aware Neural Networks for Fast Contingency Analysis of Power Systems. arXiv 2023, arXiv:2310.04213. [Google Scholar] [CrossRef]
- Pratap, A.; Tiwari, P.; Maurya, R.; Maurya, P. Adaptive genetic-enhanced mountain gazelle optimization for integrated network reconfiguration, distributed generation, and capacitor bank planning in large-scale radial distribution systems. Electr. Eng. 2024. [Google Scholar] [CrossRef]
- Ntombela, M.; Musasa, K.; Leoaneka, M.C. Power Loss Minimization and Voltage Profile Improvement by System Reconfiguration, DG Sizing, and Placement. Computation 2022, 10, 180. [Google Scholar] [CrossRef]
- Ma, L.; Si, C.; Wang, K.; Luo, J.; Jiang, S.; Song, Y. Deep Reinforcement Learning-Based Distribution Network Planning Method Considering Renewable Energy. Energies 2025, 18, 1254. [Google Scholar] [CrossRef]
- Vukobratović, M.; Marić, P.; Horvat, G.; Balkić, Z.; Sučić, S. A Survey on Computational Intelligence Applications in Distribution Network Optimization. Electronics 2021, 10, 1247. [Google Scholar] [CrossRef]
- Nassef, A.M.; Abdelkareem, M.A.; Maghrabie, H.M.; Baroutaji, A. Review of Metaheuristic Optimization Algorithms for Power Systems Problems. Sustainability 2023, 15, 9434. [Google Scholar] [CrossRef]
- Masache, P.; Carrión, D.; Cárdenas, J. Optimal Transmission Line Switching to Improve the Reliability of the Power System Considering AC Power Flows. Energies 2021, 14, 3281. [Google Scholar] [CrossRef]
- Kerckhove, S.; D’hulst, R.; Van Hertem, D. Reconfiguration Method for Low Voltage Distribution Networks. In Proceedings of the 2023 IEEE PES Innovative Smart Grid Technologies Europe (ISGT EUROPE), Grenoble, France, 23–26 October 2023. [Google Scholar] [CrossRef]
- Nguyen, T.T.; Nguyen, Q.T.; Nguyen, T.T. Optimal radial topology of electric unbalanced and balanced distribution system using improved coyote optimization algorithm for power loss reduction. Neural Comput. Appl. 2021, 33, 12209–12236. [Google Scholar] [CrossRef]
- Jangdoost, A.; Keypour, R.; Golmohamadi, H. Optimization of distribution network reconfiguration by a novel RCA integrated with genetic algorithm. Energy Syst. 2021, 12, 801–833. [Google Scholar] [CrossRef]
- Gallego Pareja, L.A.; López-Lezama, J.M.; Gómez Carmona, O. Optimal Integration of Distribution Network Reconfiguration and Conductor Selection in Power Distribution Systems via MILP. Energies 2023, 16, 6998. [Google Scholar] [CrossRef]
- Hakim, M.N.; Fayumi, F.A.H.; Prakasa, M.A.; Putra, D.F.U.; Robandi, I.; Sidqi, F.Q.; Sirait, E.J.S. Optimal Reconfiguration of Distribution Network With Photovoltaic Using Binary Particle Swarm Optimization Considering Voltage Stability Index. In Proceedings of the International Seminar on Intelligent Technology and its Applications (ISITIA), Mataram, Indosesia, 10–12 July 2024; pp. 53–58. [Google Scholar] [CrossRef]
Disclaimer/Publisher’s Note: The statements, opinions and data contained in all publications are solely those of the individual author(s) and contributor(s) and not of MDPI and/or the editor(s). MDPI and/or the editor(s) disclaim responsibility for any injury to people or property resulting from any ideas, methods, instructions or products referred to in the content. |
© 2025 by the authors. Licensee MDPI, Basel, Switzerland. This article is an open access article distributed under the terms and conditions of the Creative Commons Attribution (CC BY) license (https://creativecommons.org/licenses/by/4.0/).