
Improvement of Power Quality of Grid-Connected EV Charging Station Using Grid-Component Based Harmonic Mitigation Technique †


Abstract
1. Introduction
1.1. Background
1.2. Literature Review
1.3. Research Gap and Motivation
1.4. Contributions
- A comprehensive theoretical modeling of a reliable and accurate distribution grid model using mathematical equations and data from equipment manufacturers and distribution network operators has been designed. These data are not readily available from distribution operators and/or equipment manufacturers.
- Through deep research, potential harmonic distortions and resonance issues have been identified early in the design process. Based upon these insights, the technical selection of the grid’s electrical components has been done, i.e., transformers, filters, converters, and capacitor banks. These are specifically tuned/optimized to effectively mitigate harmonics and enhance overall system performance. It proves that the selection of grid’s electrical components plays an important role in improving power losses in the form of harmonics arising with EV charging.
- Comprehensive simulation results to validate the proposed method and clearly demonstrate its merits.
2. Methodology
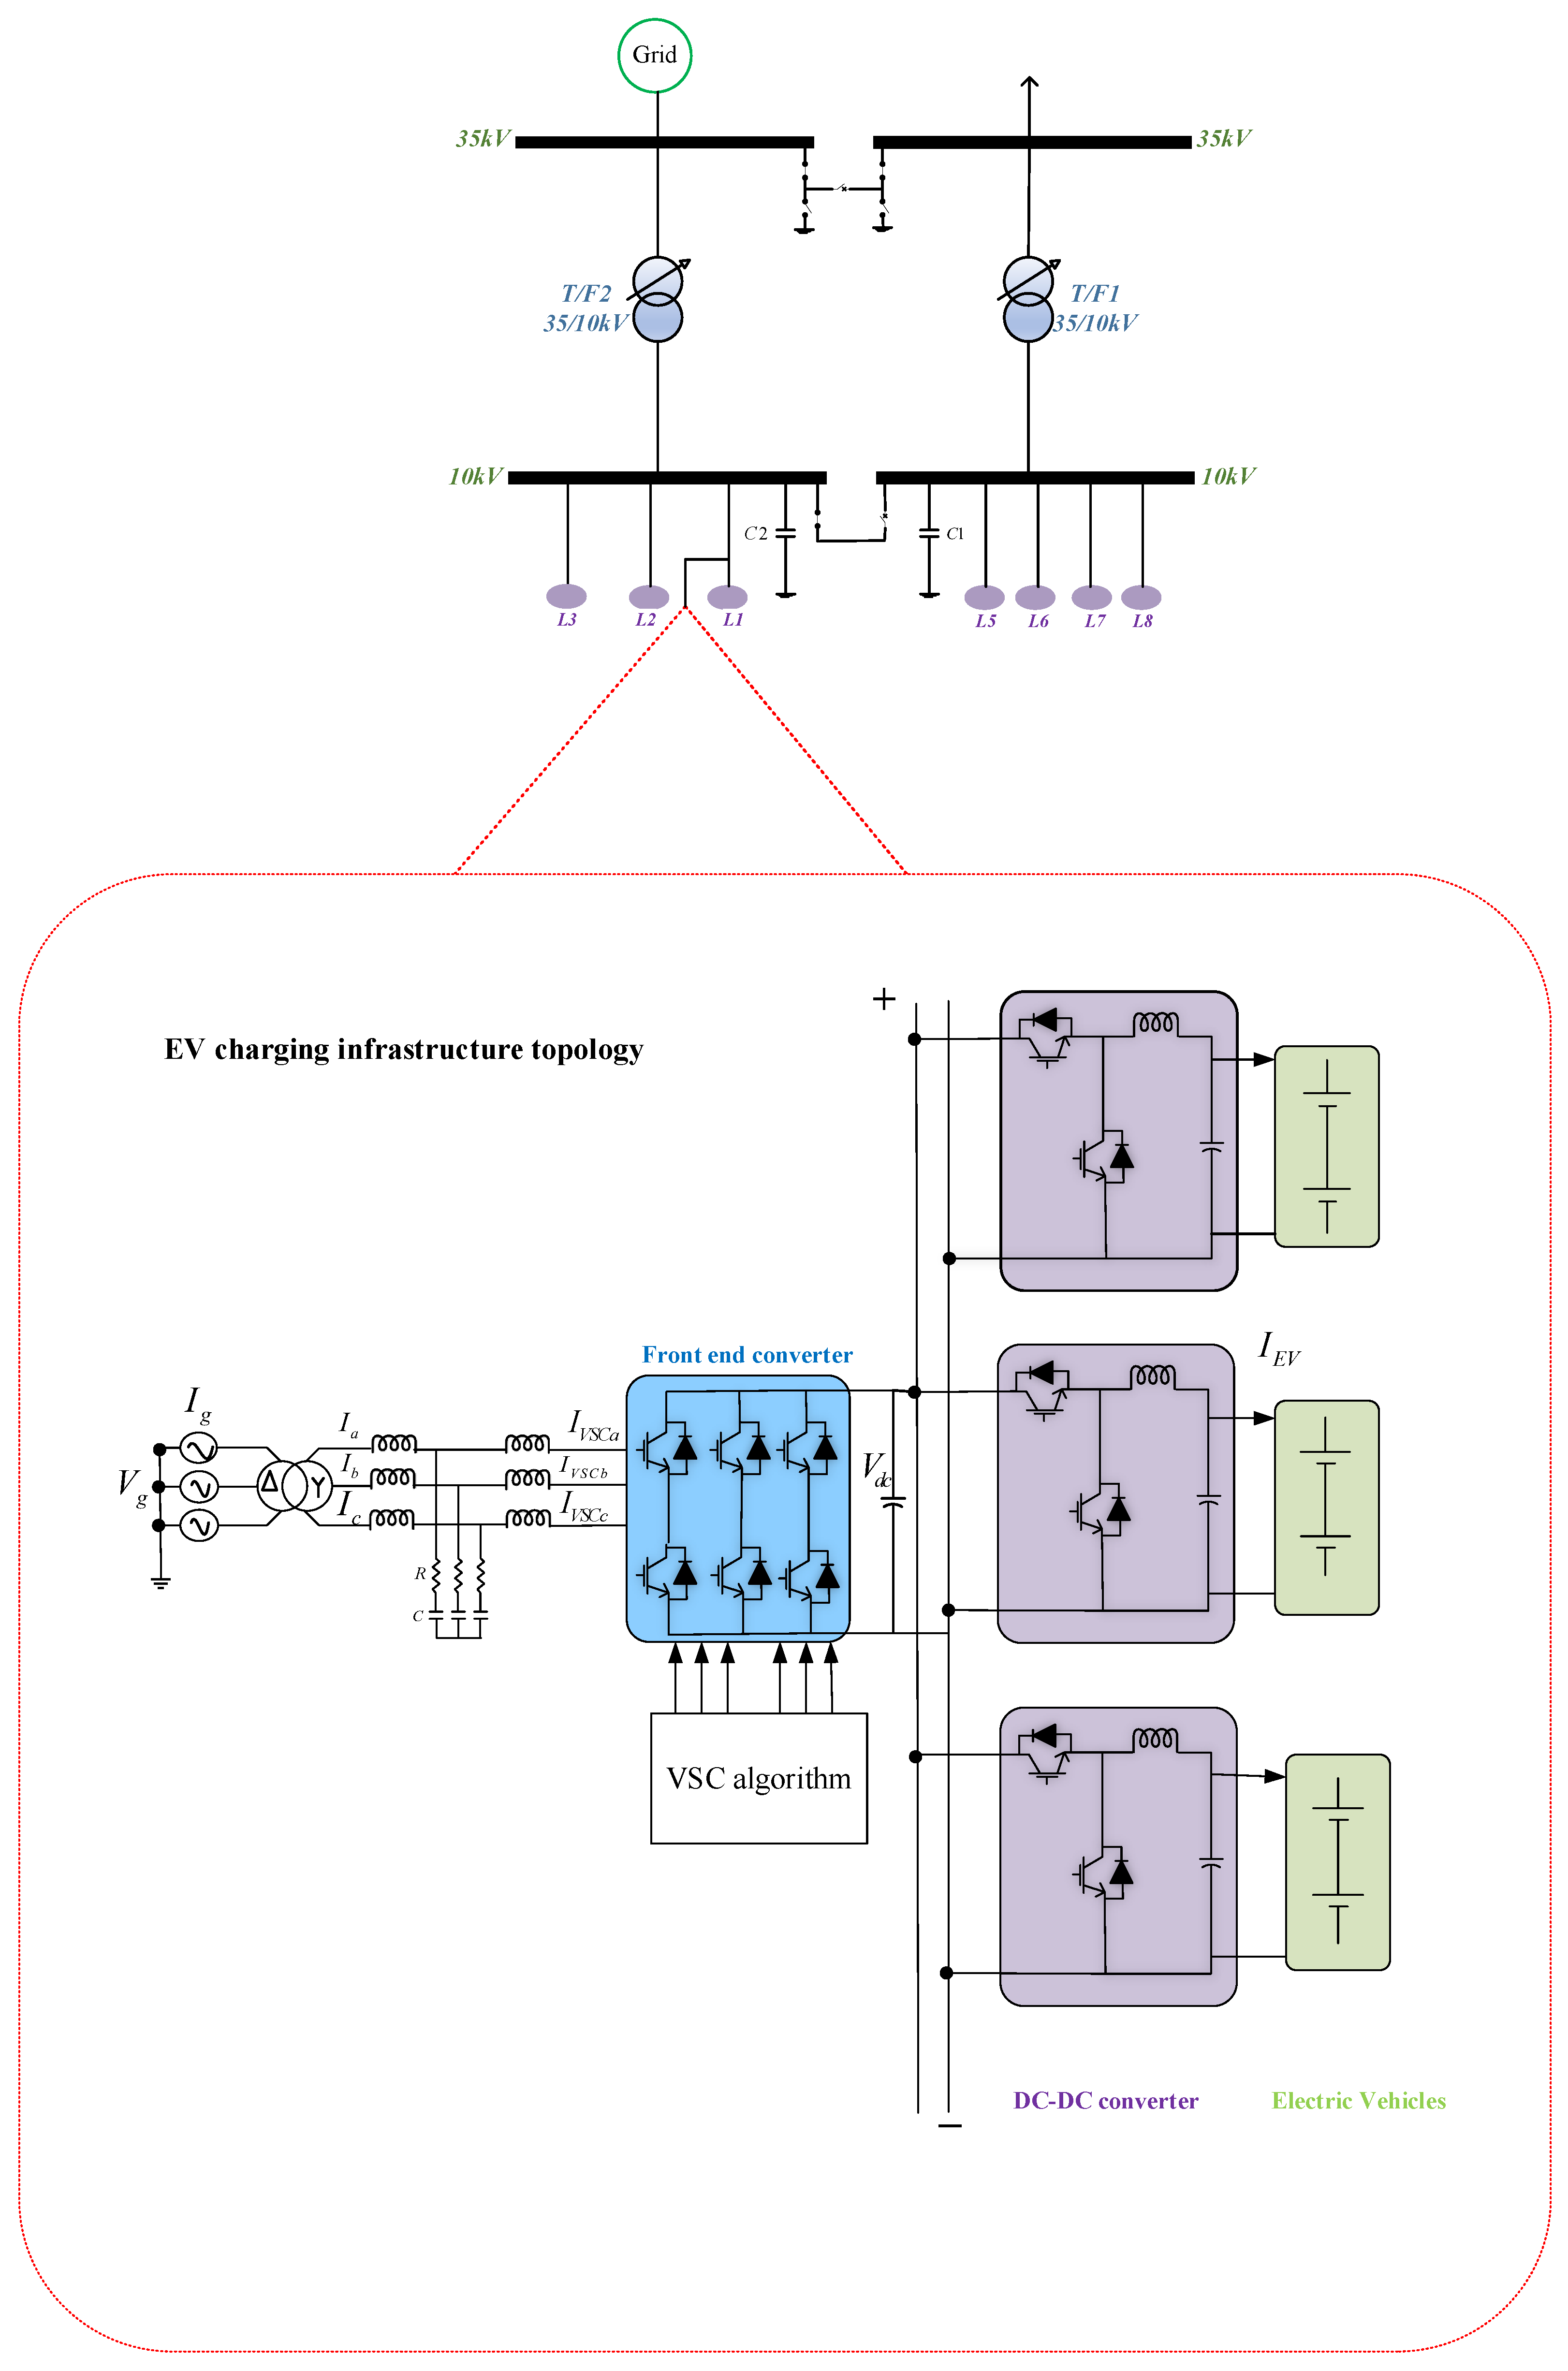
2.1. Modelling Distribution Grid
2.1.1. Busbars Model
2.1.2. AC Lines Model
2.1.3. Distribution Transformers Model
2.1.4. Loads
2.1.5. Shunts
2.2. Bidirectional Electric Vehicle Charging Infrastructure
2.2.1. Parameter Selection for the Charging Station
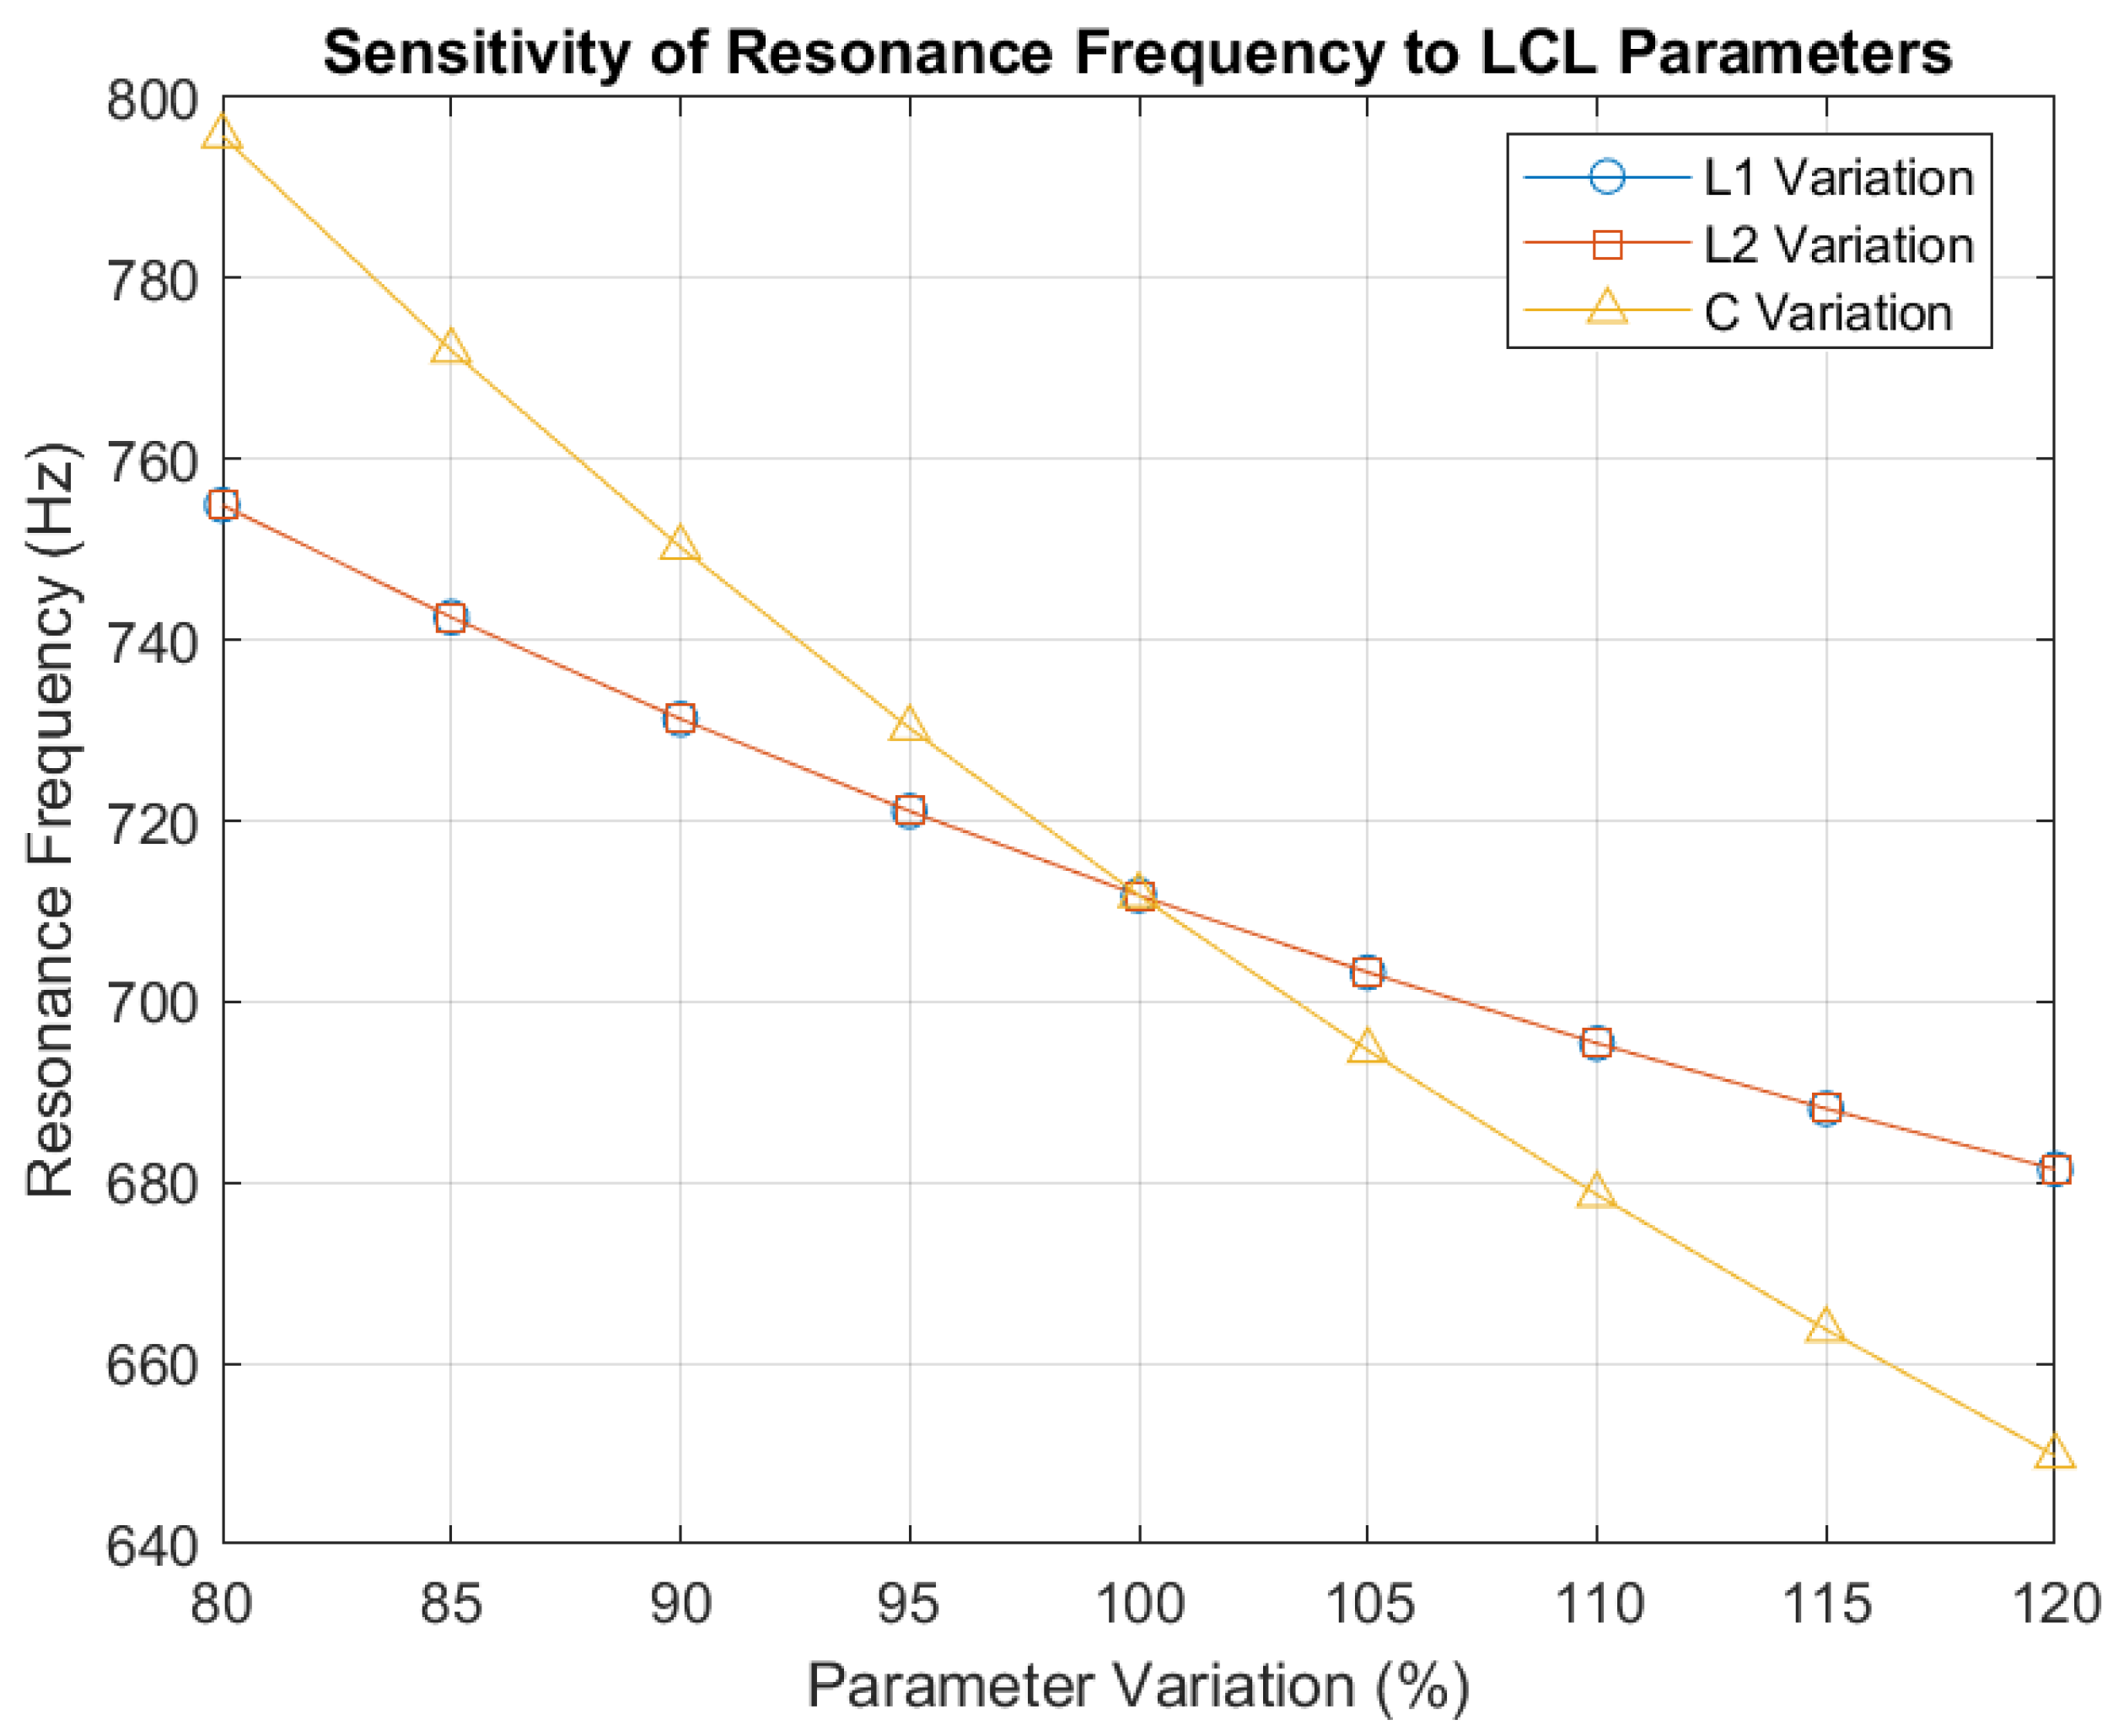
LCL Filter
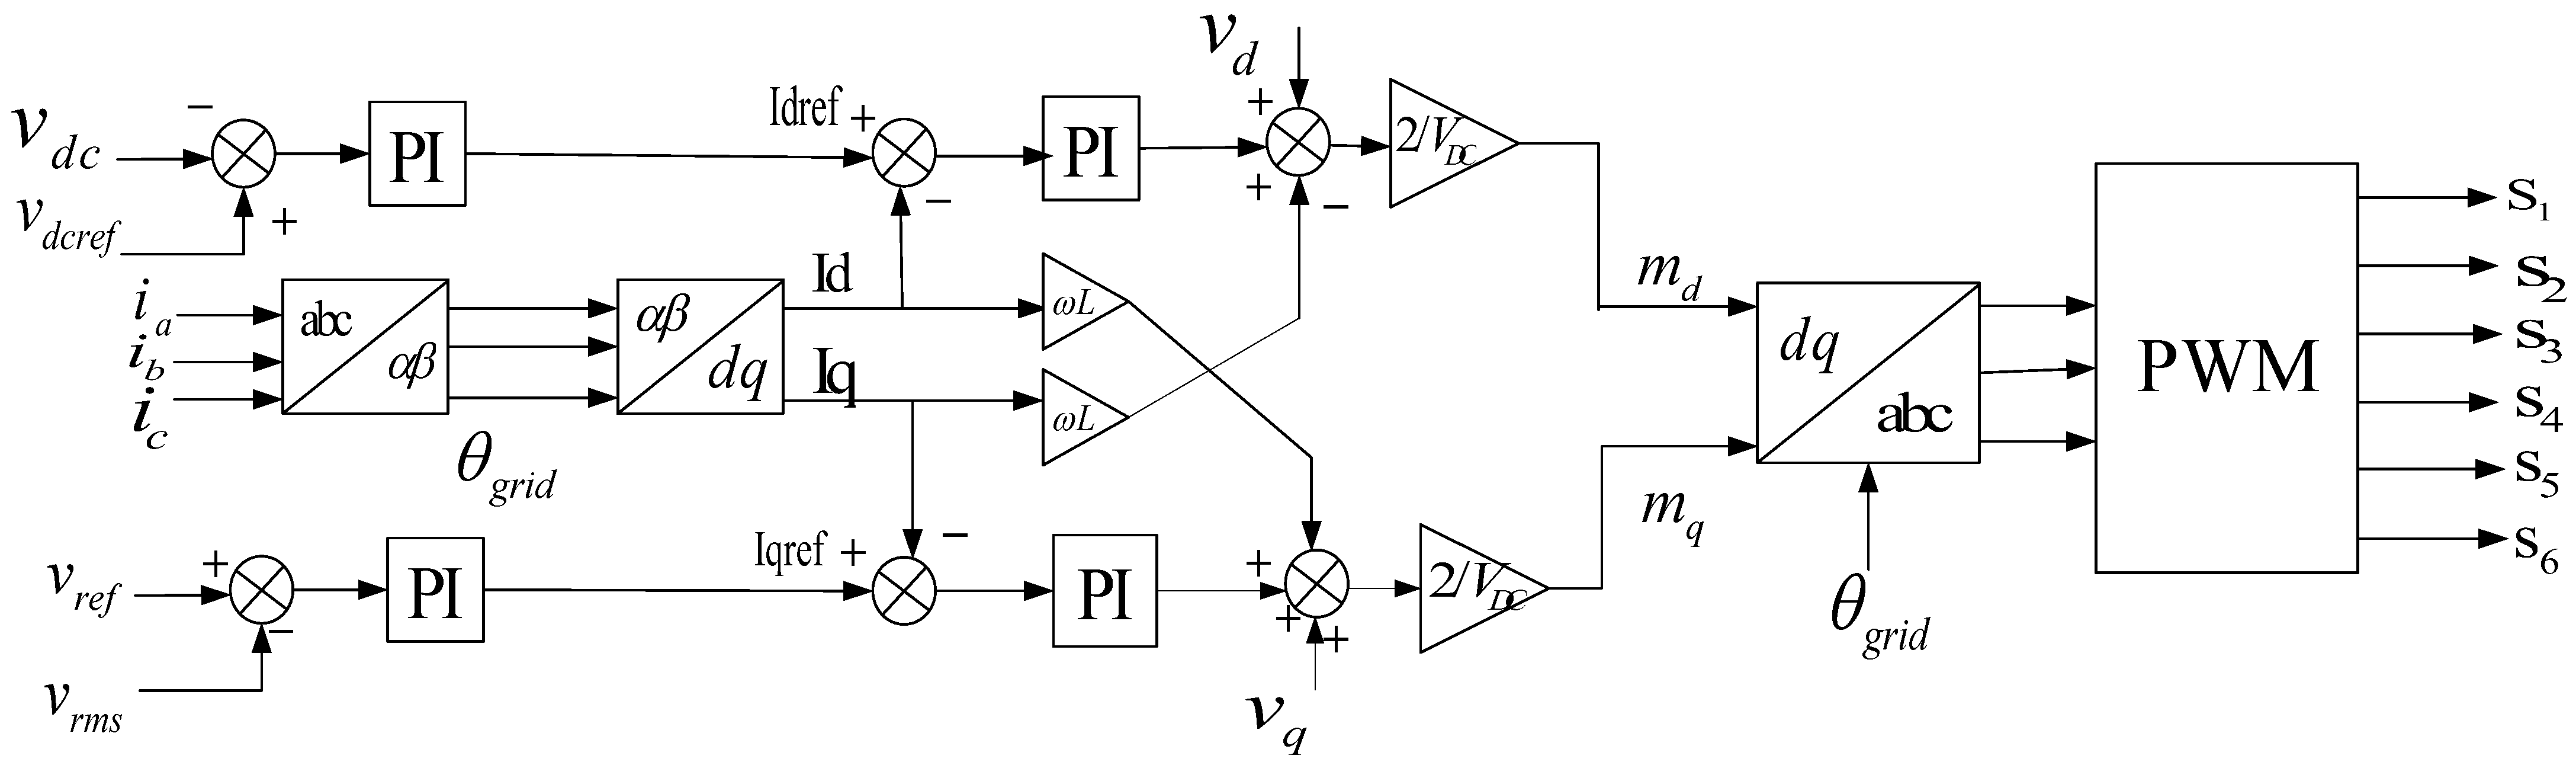
AC–DC Converter
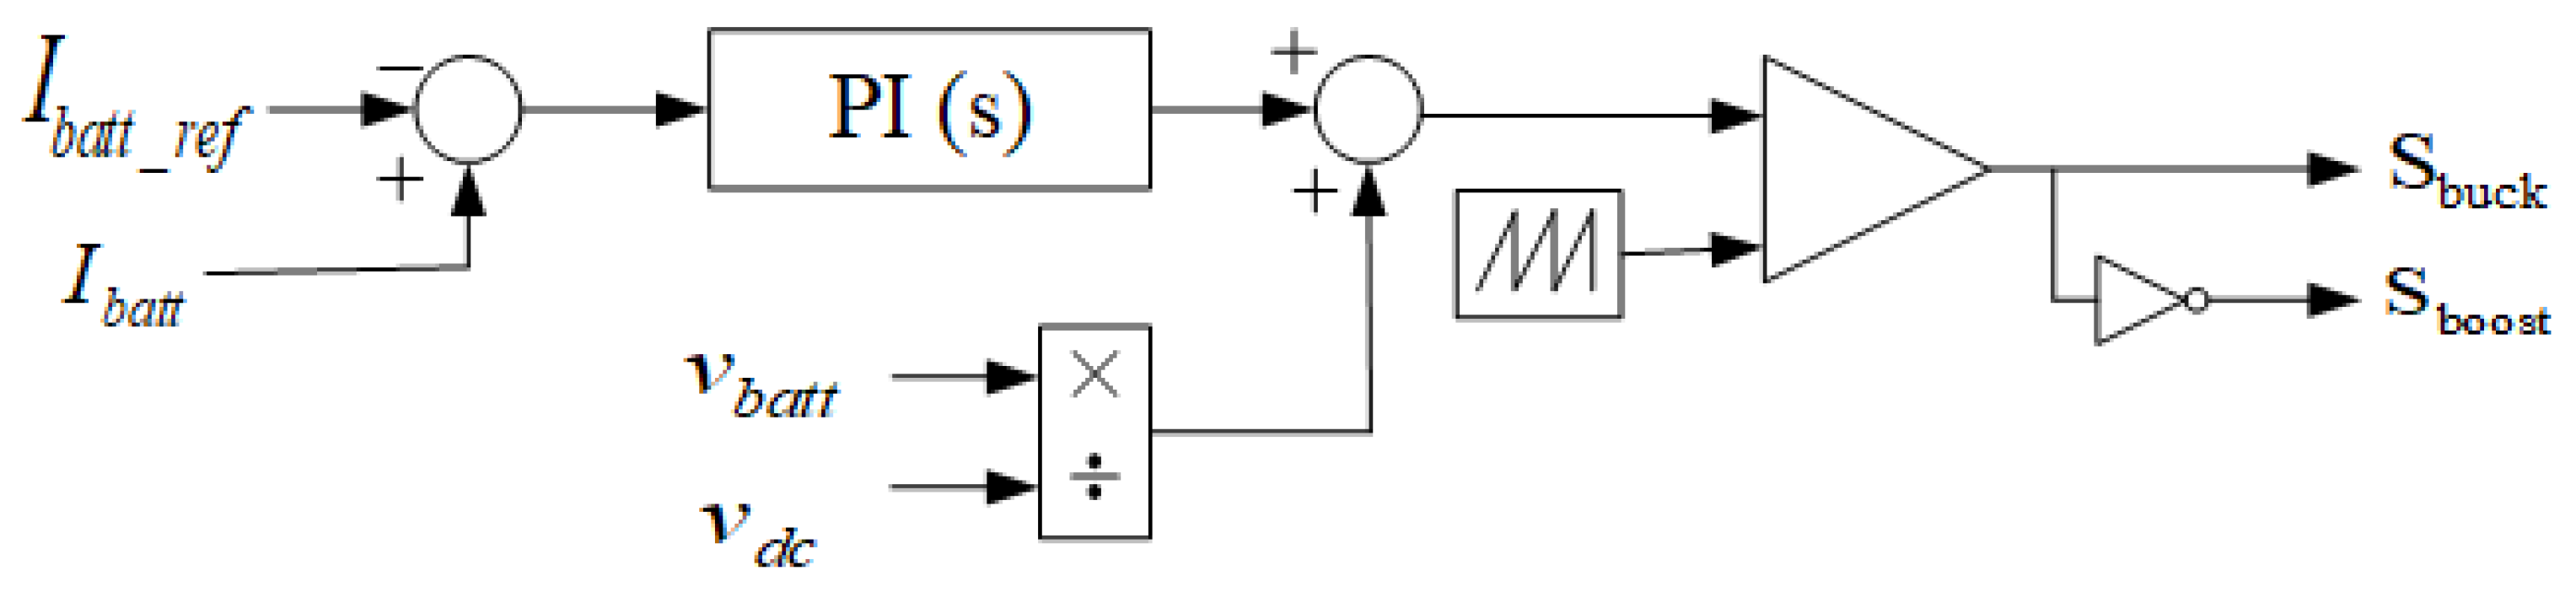
DC–DC Converter
2.2.2. Control System
3. Results
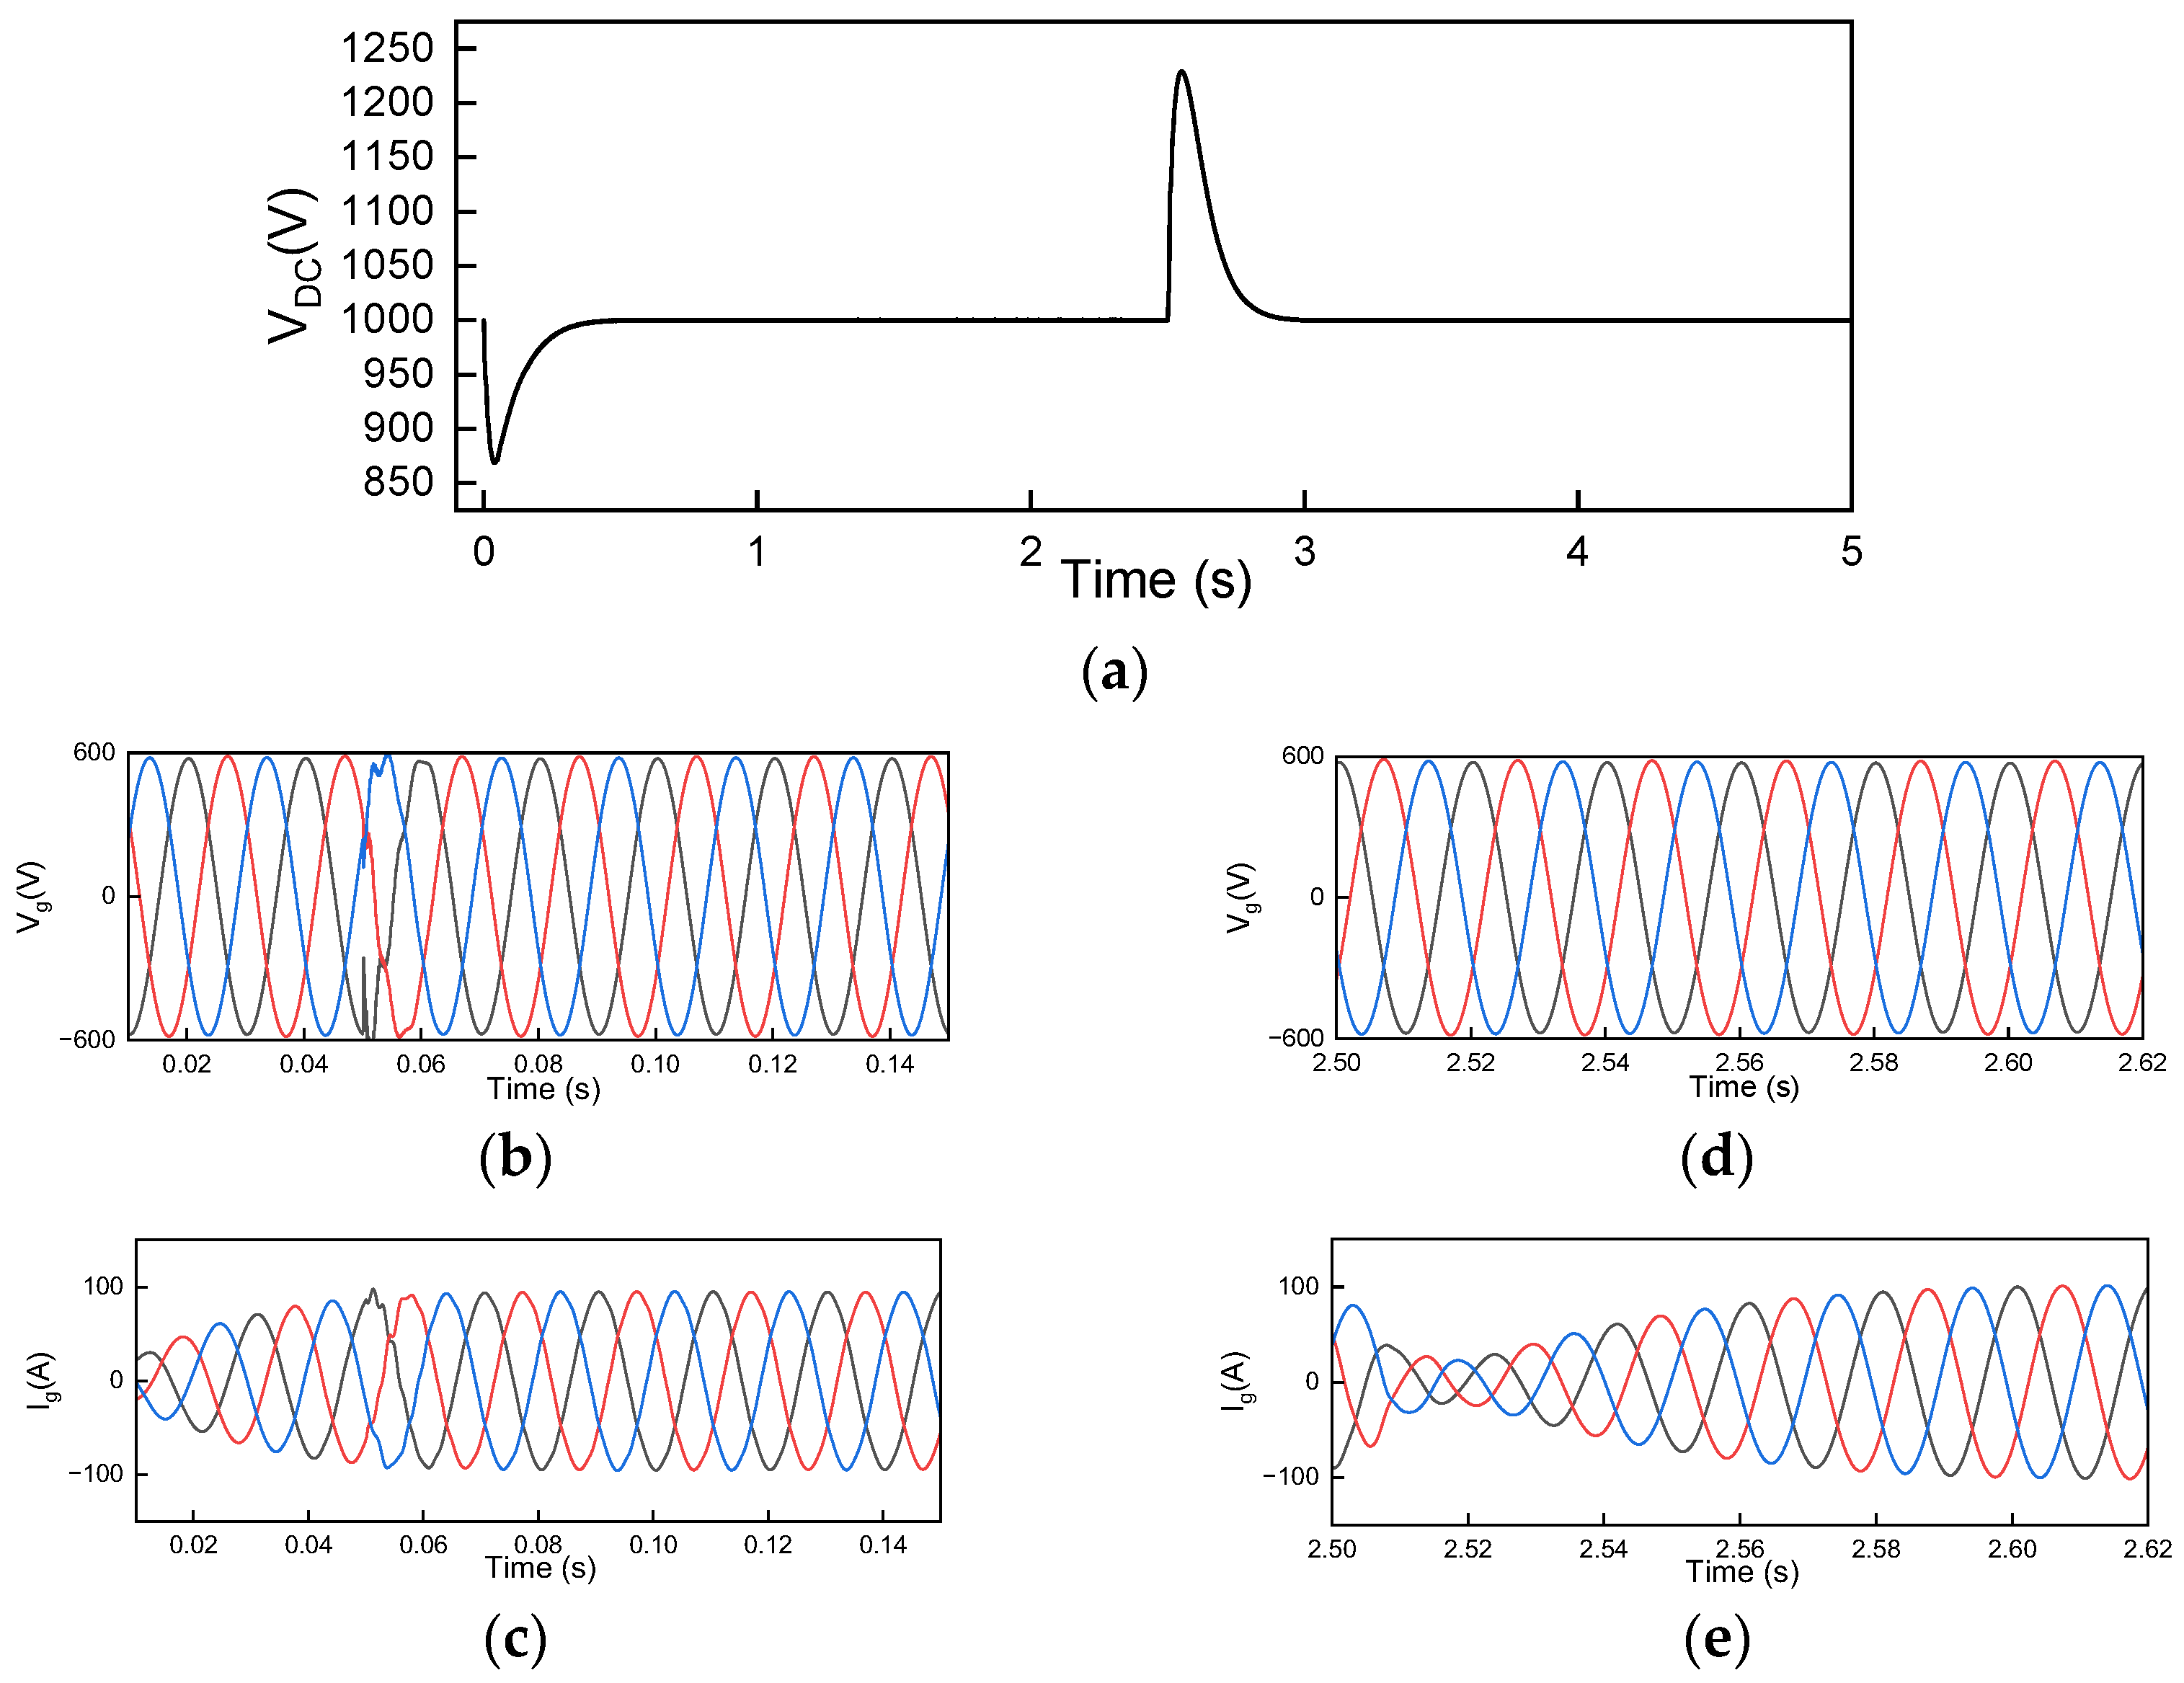
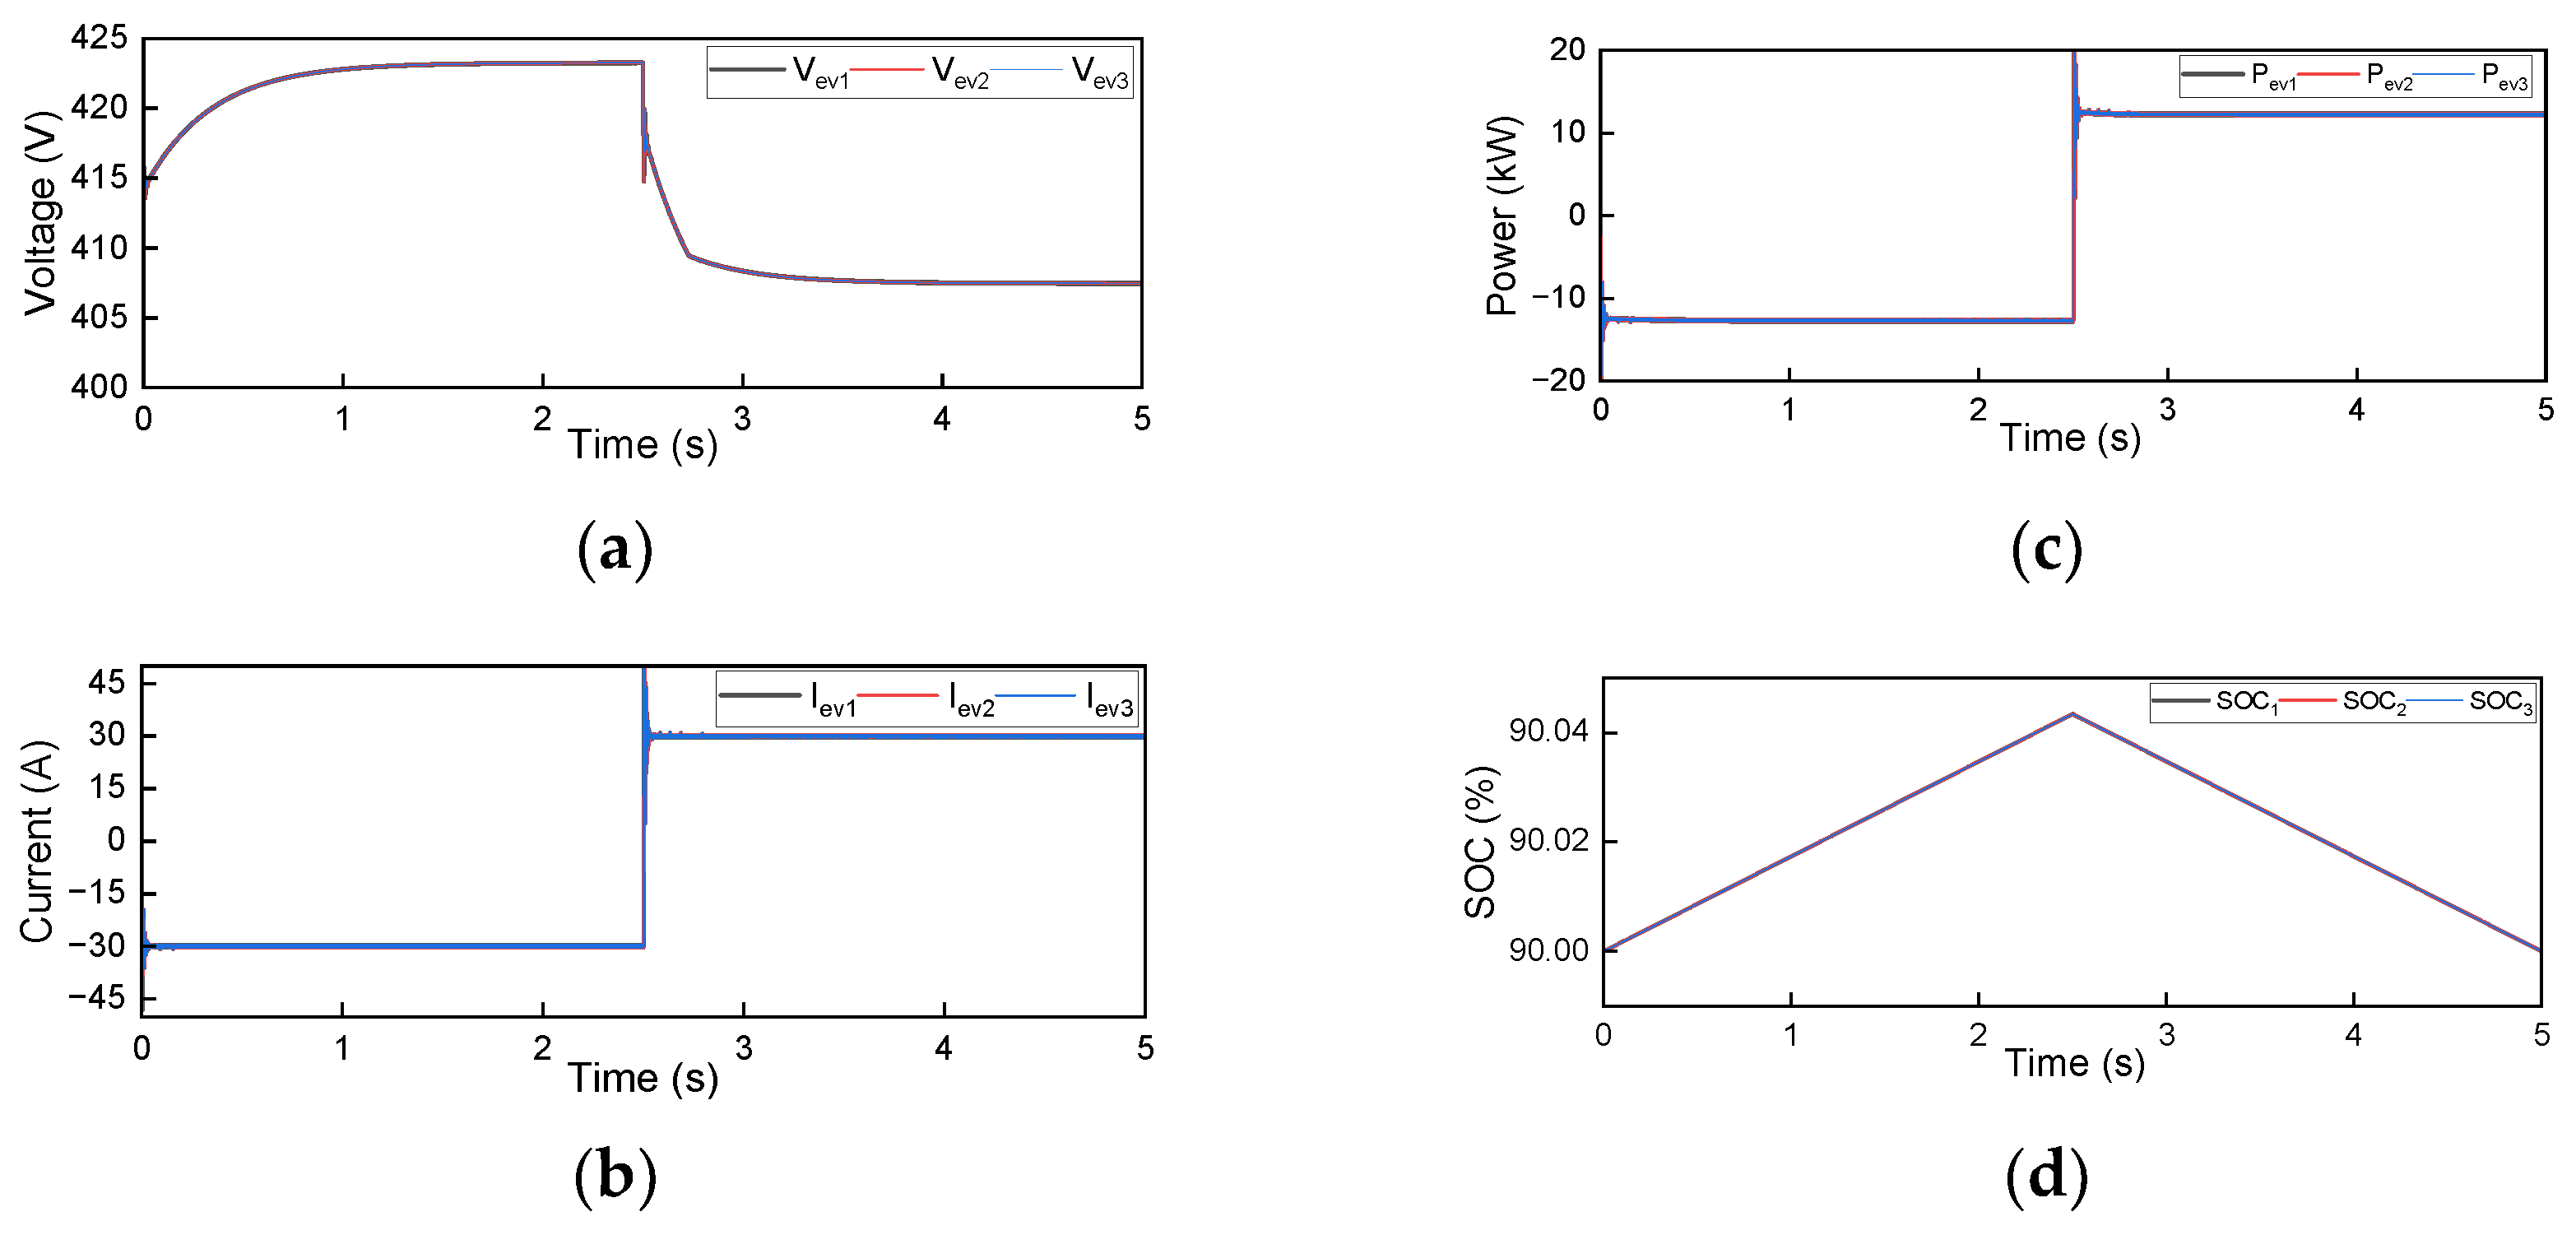
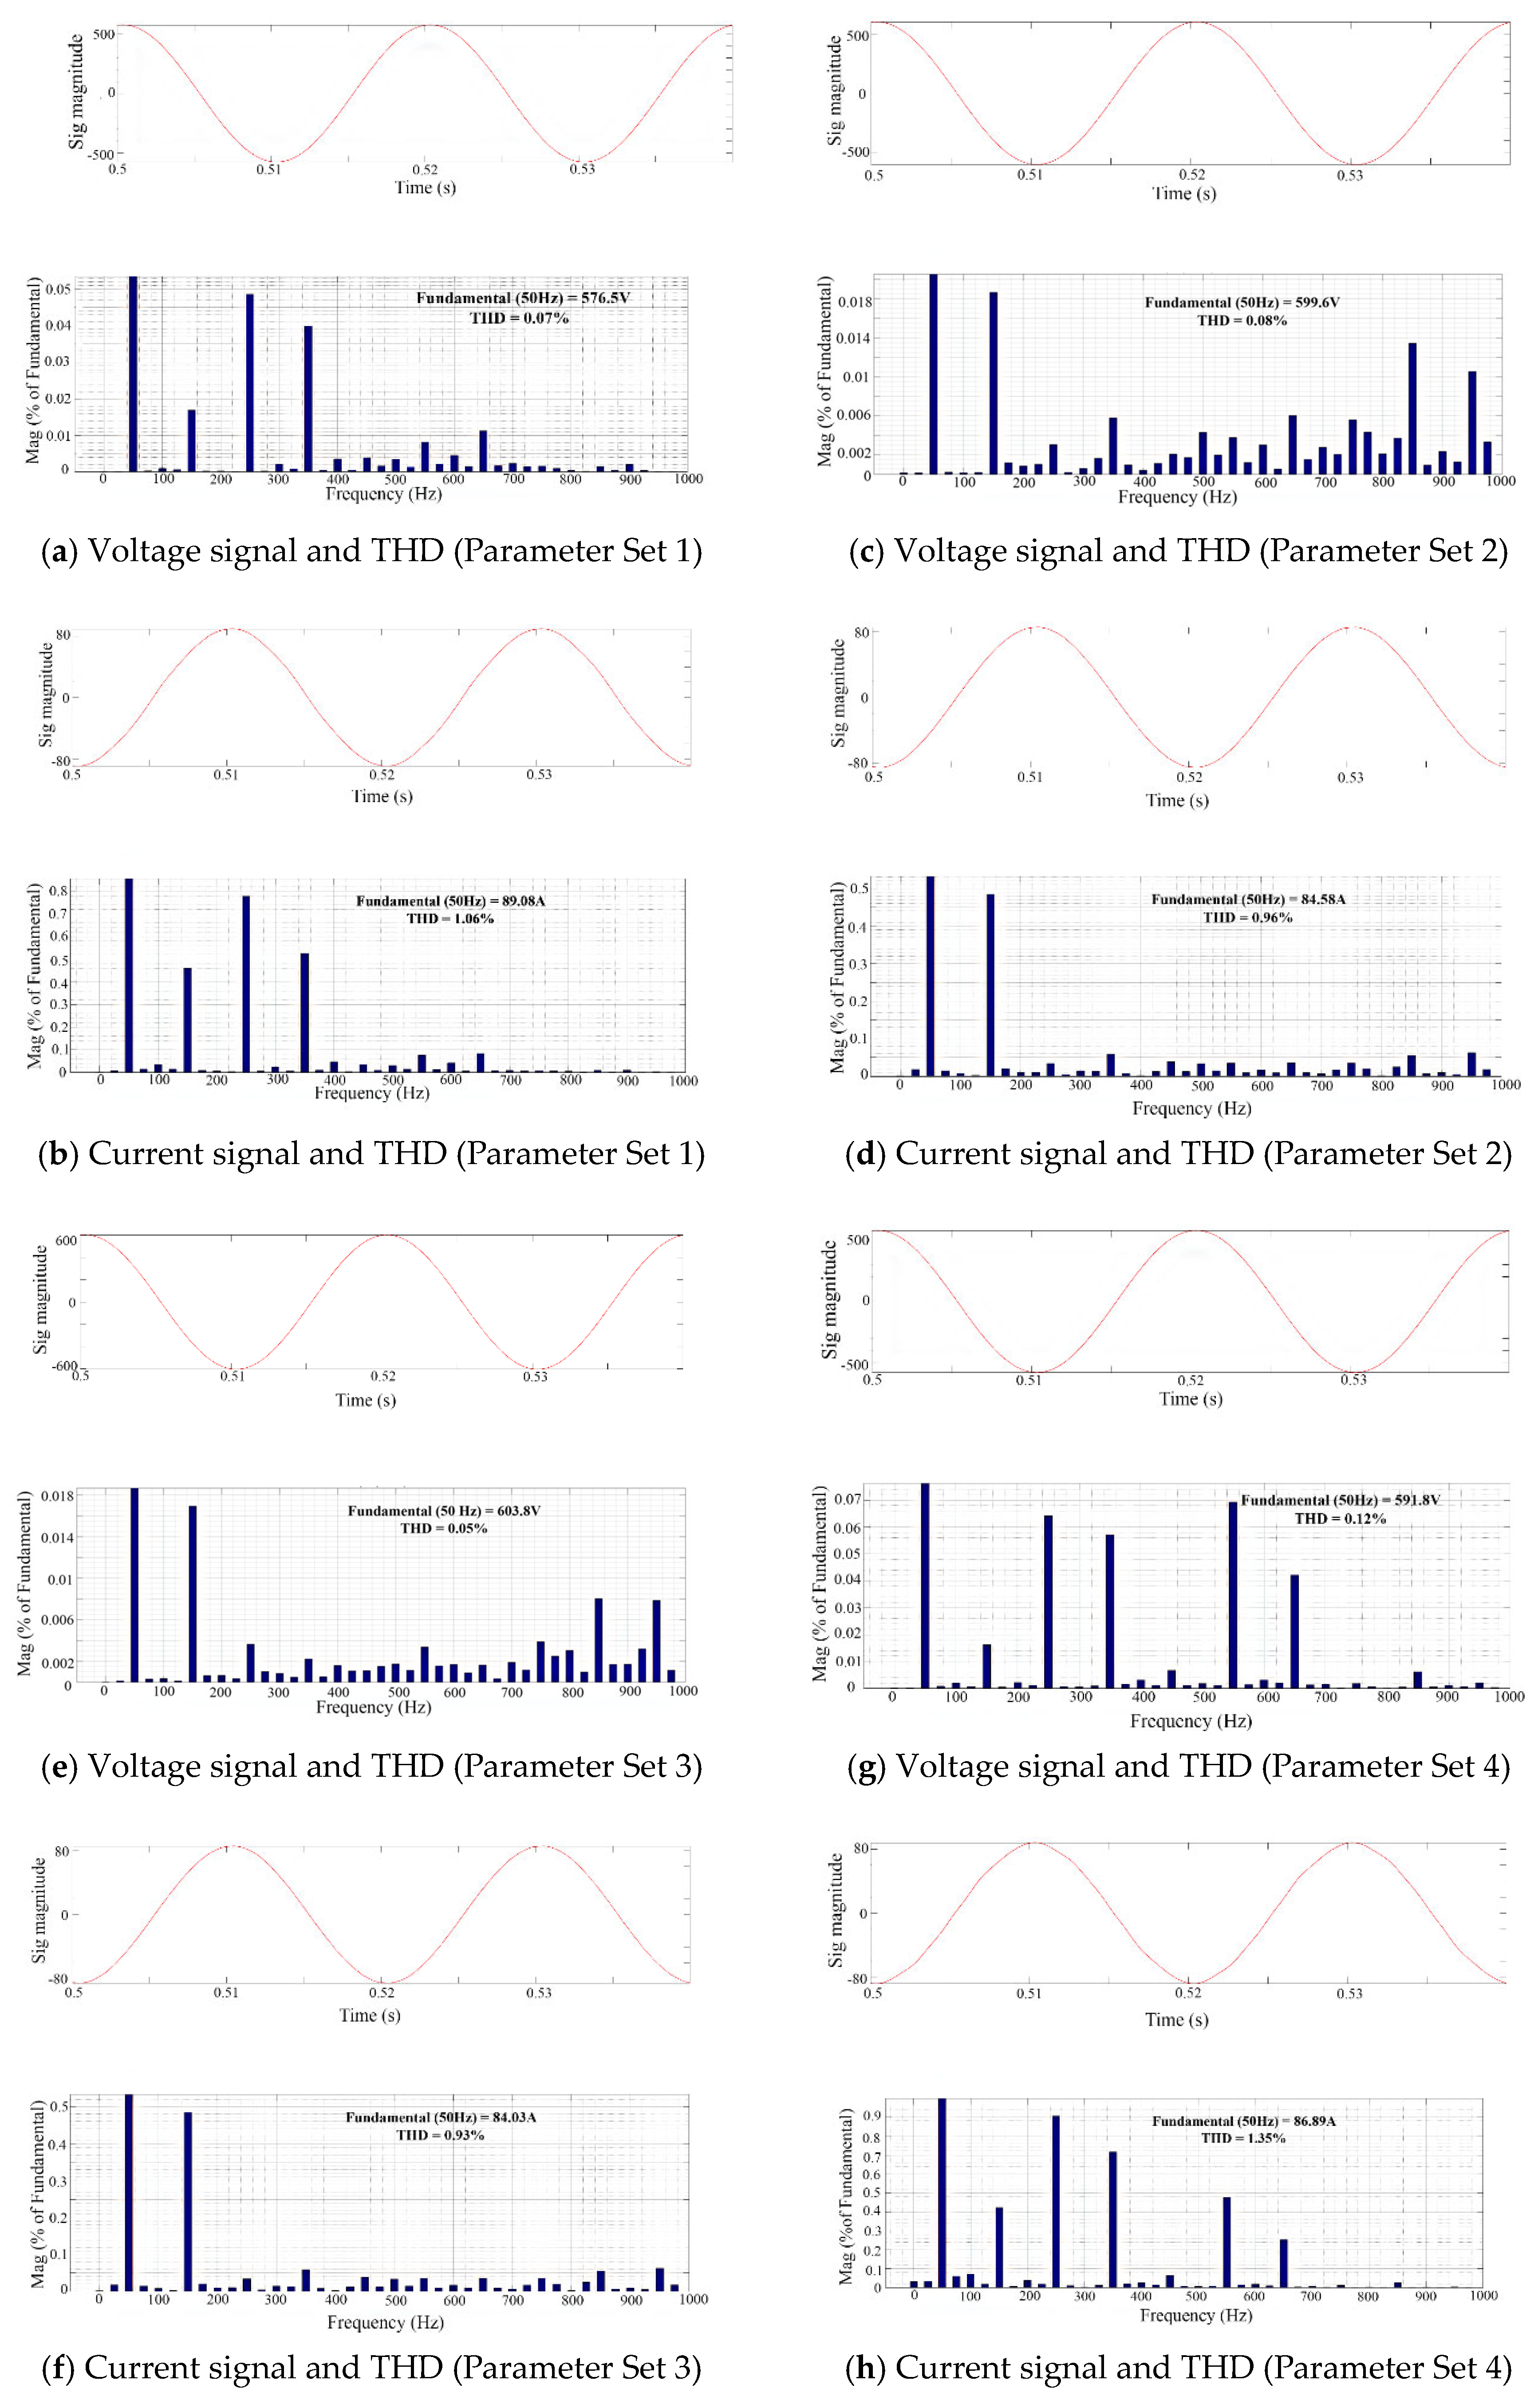
3.1. Parameter Set 1
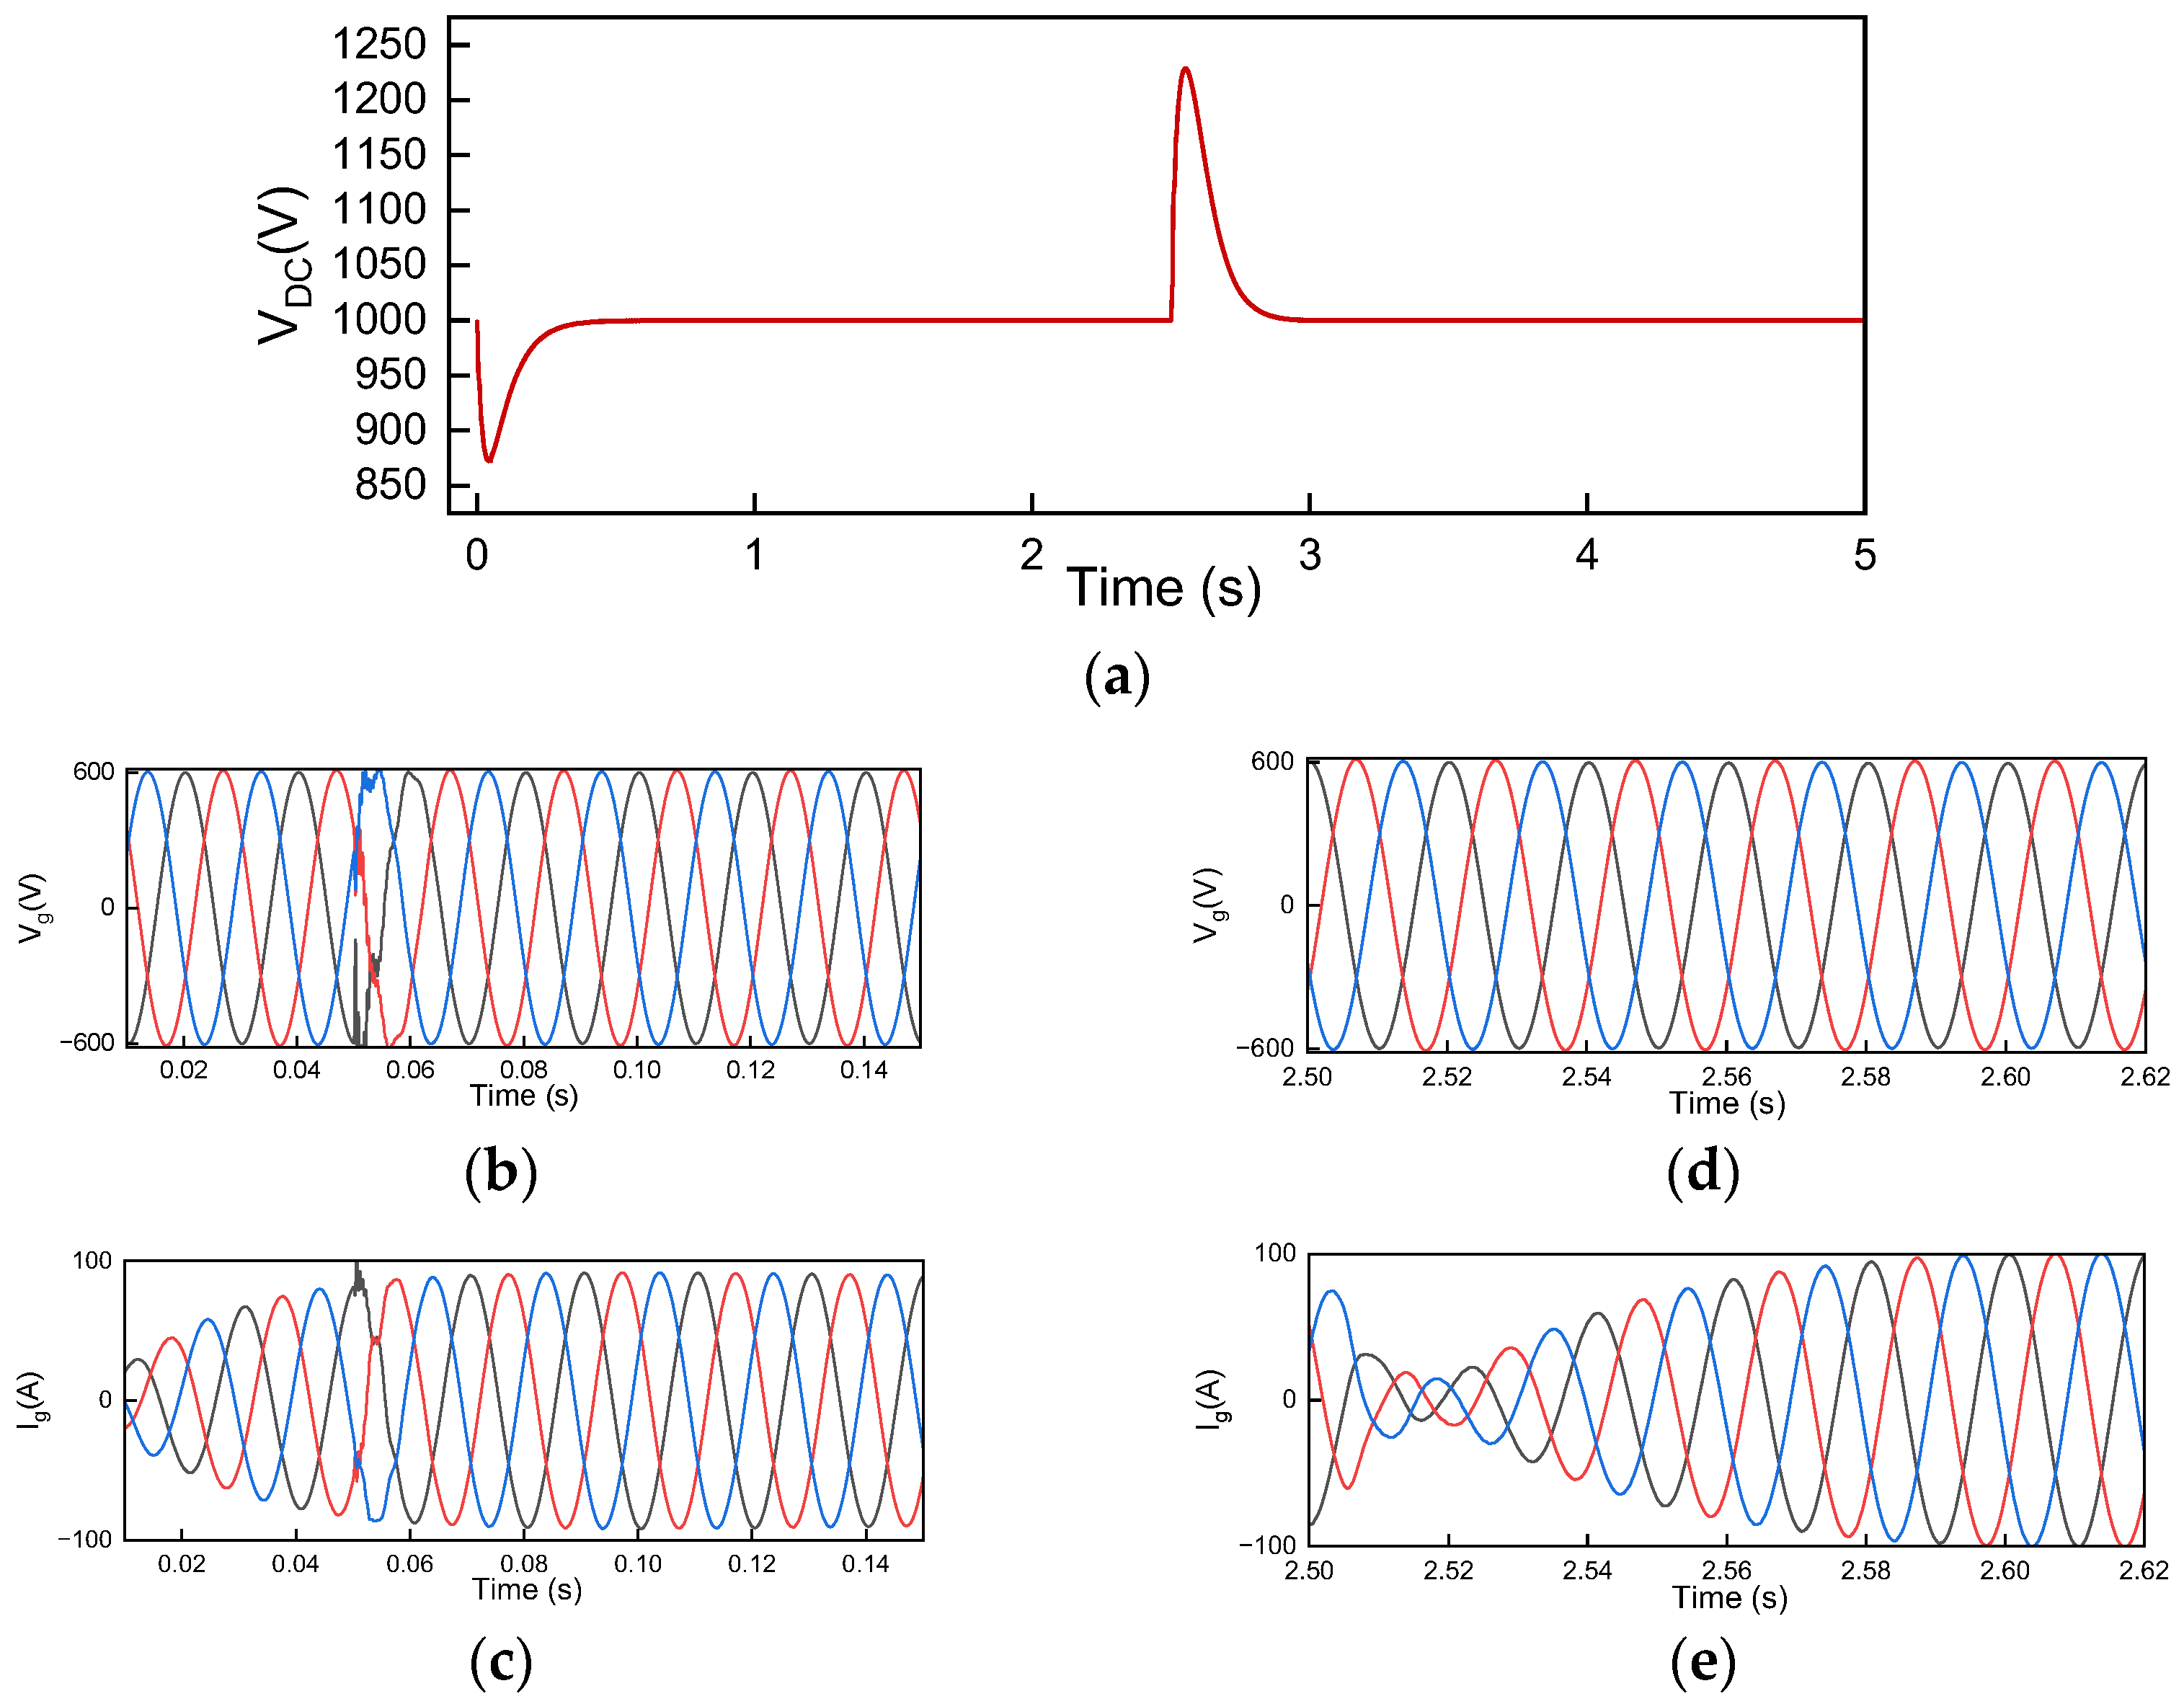
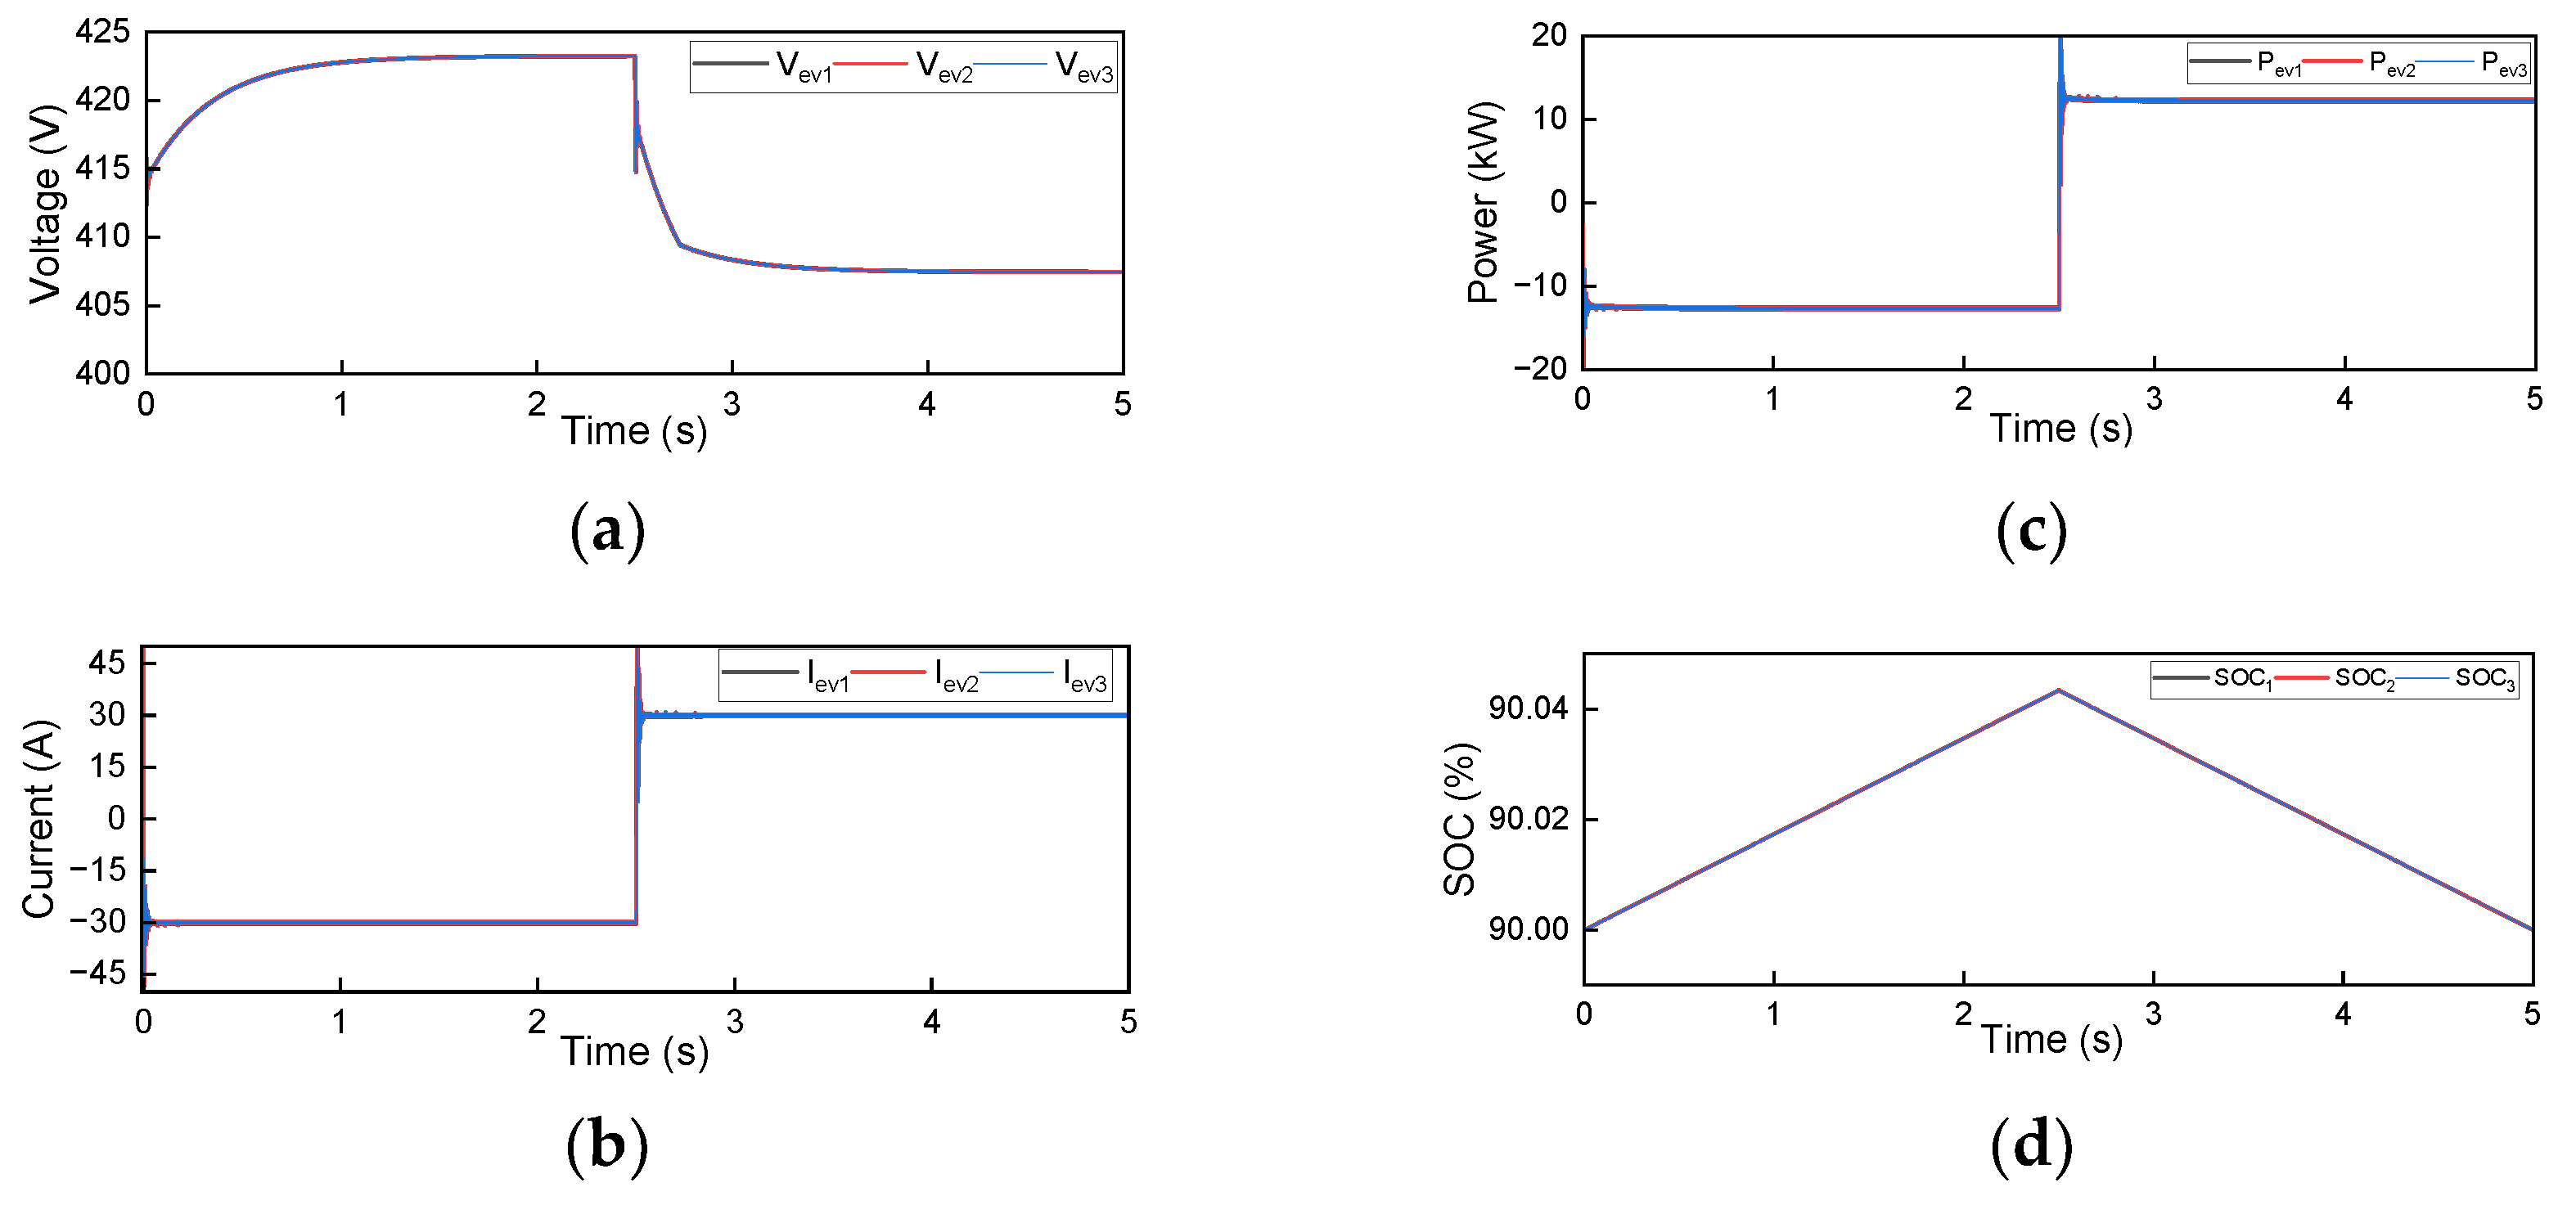
3.2. Parameter Set 2
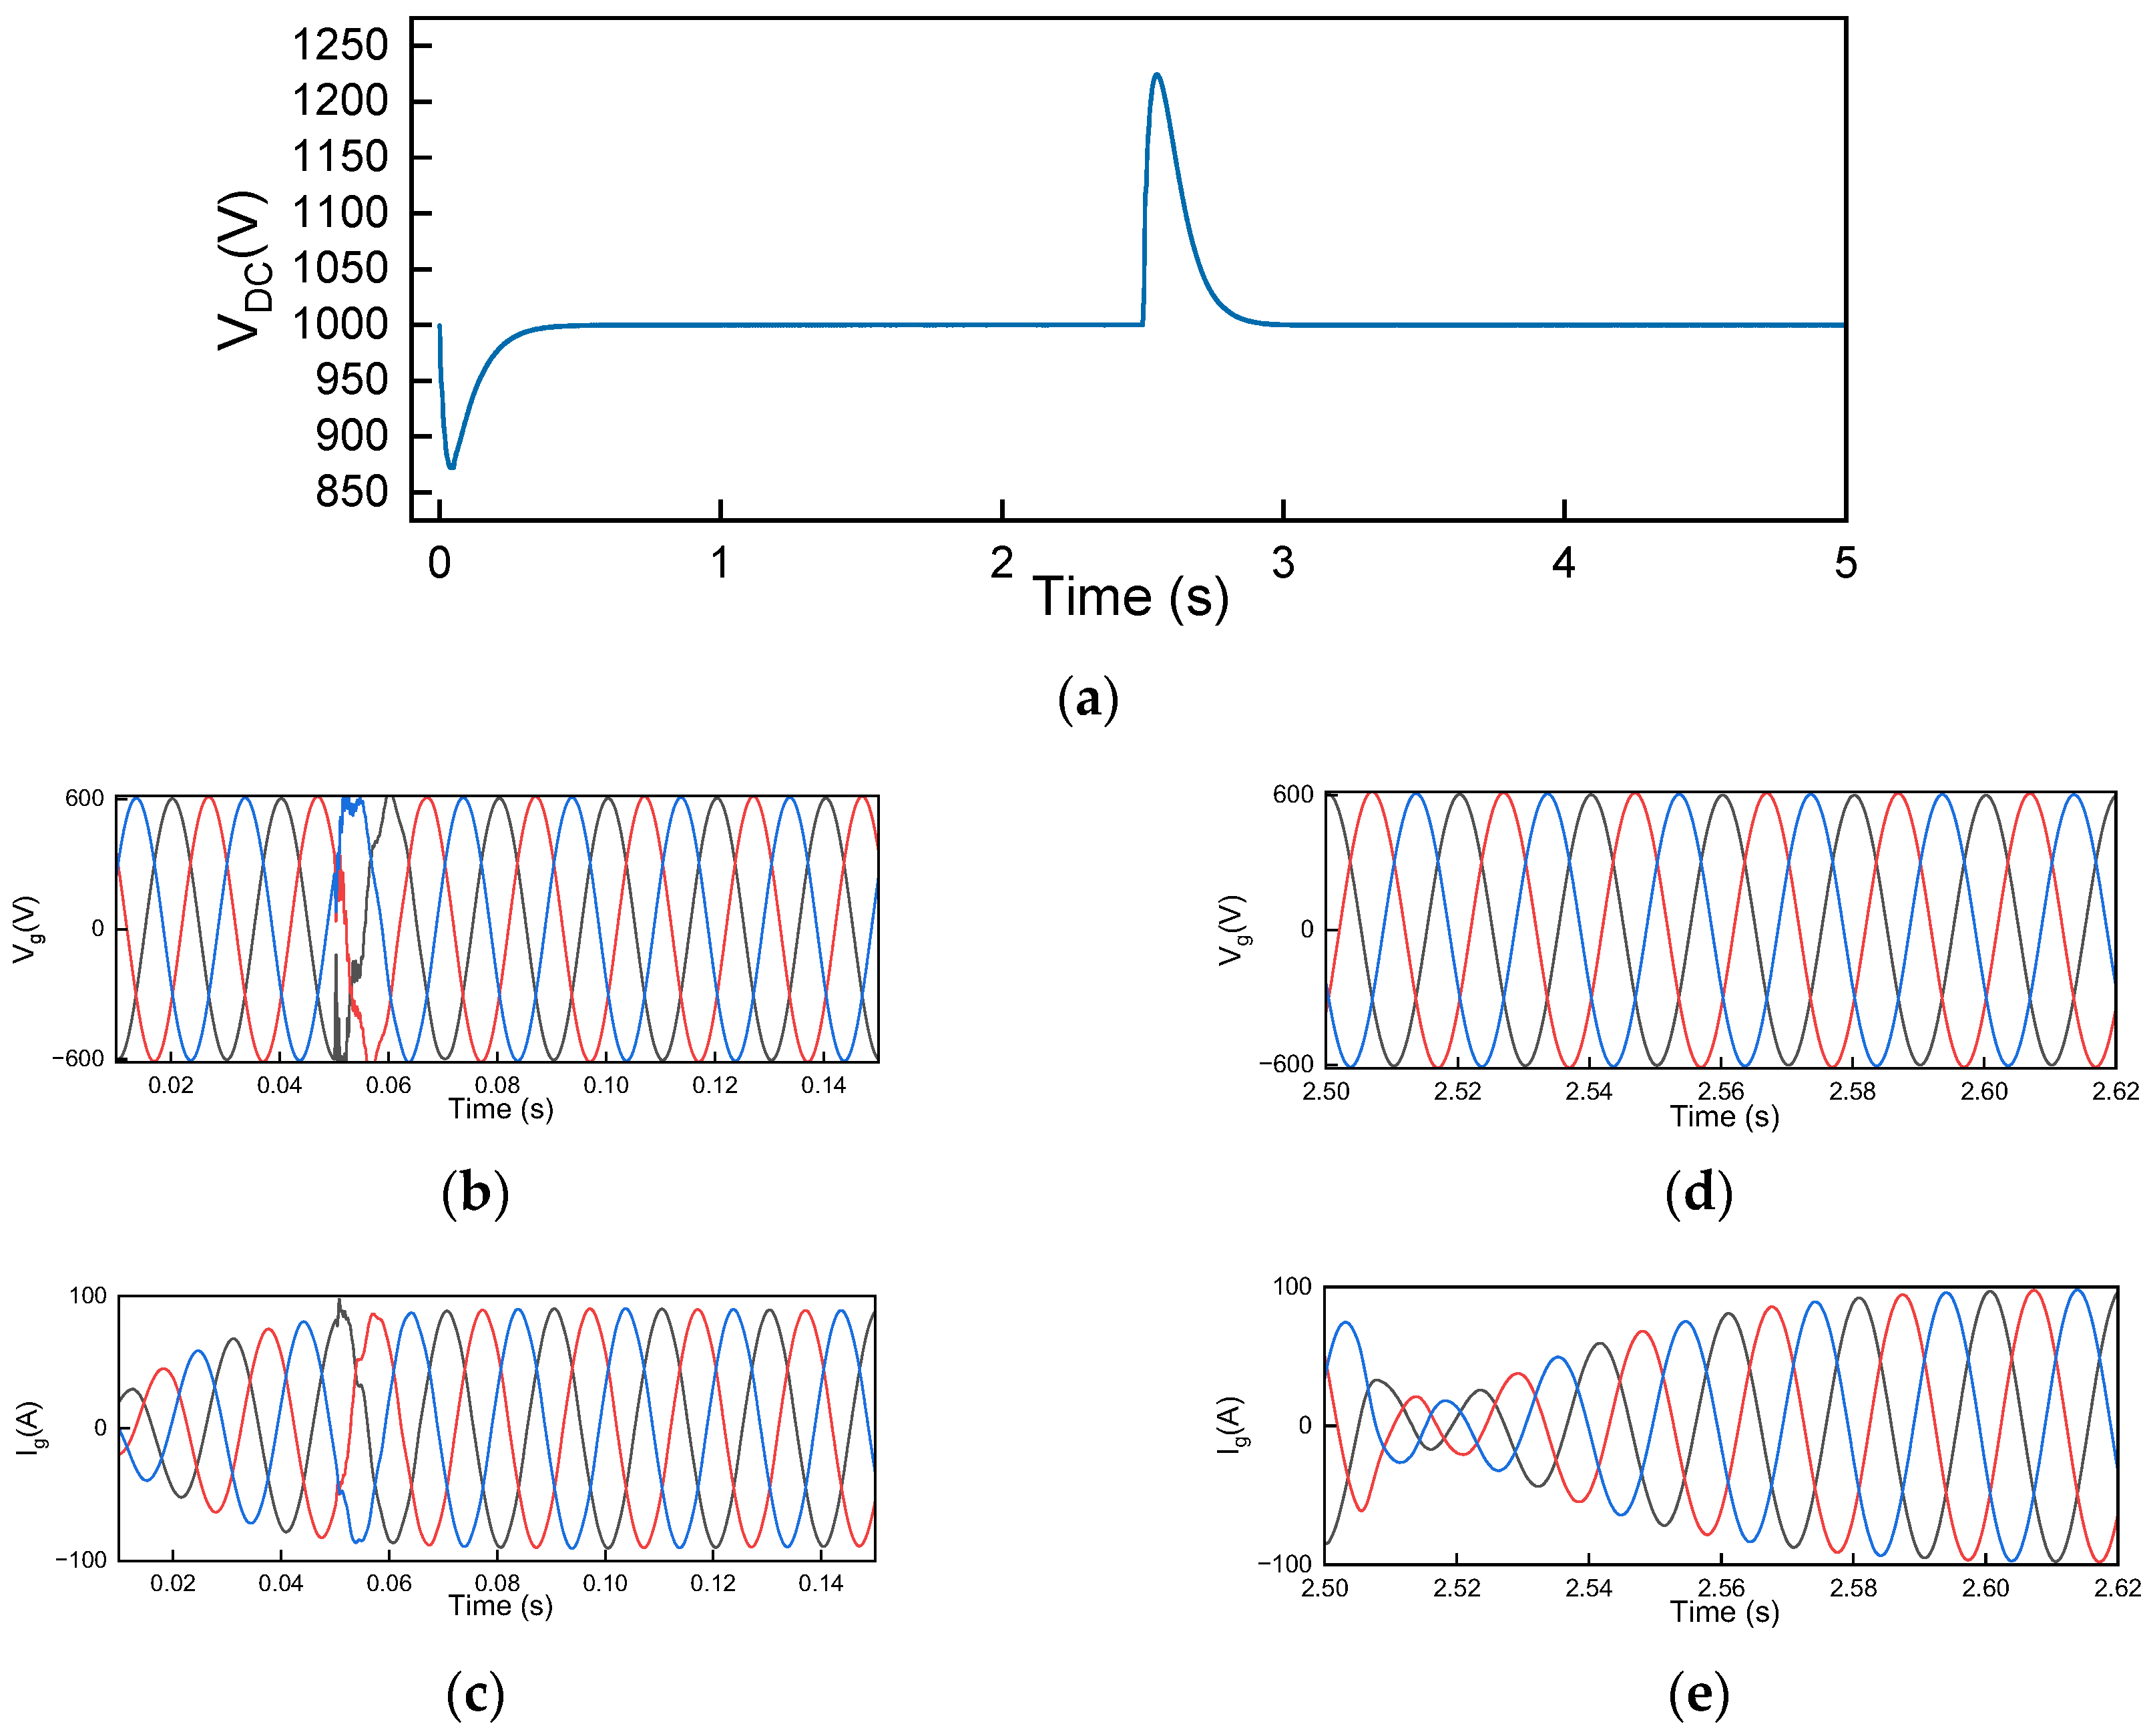
3.3. Parameter Set 3
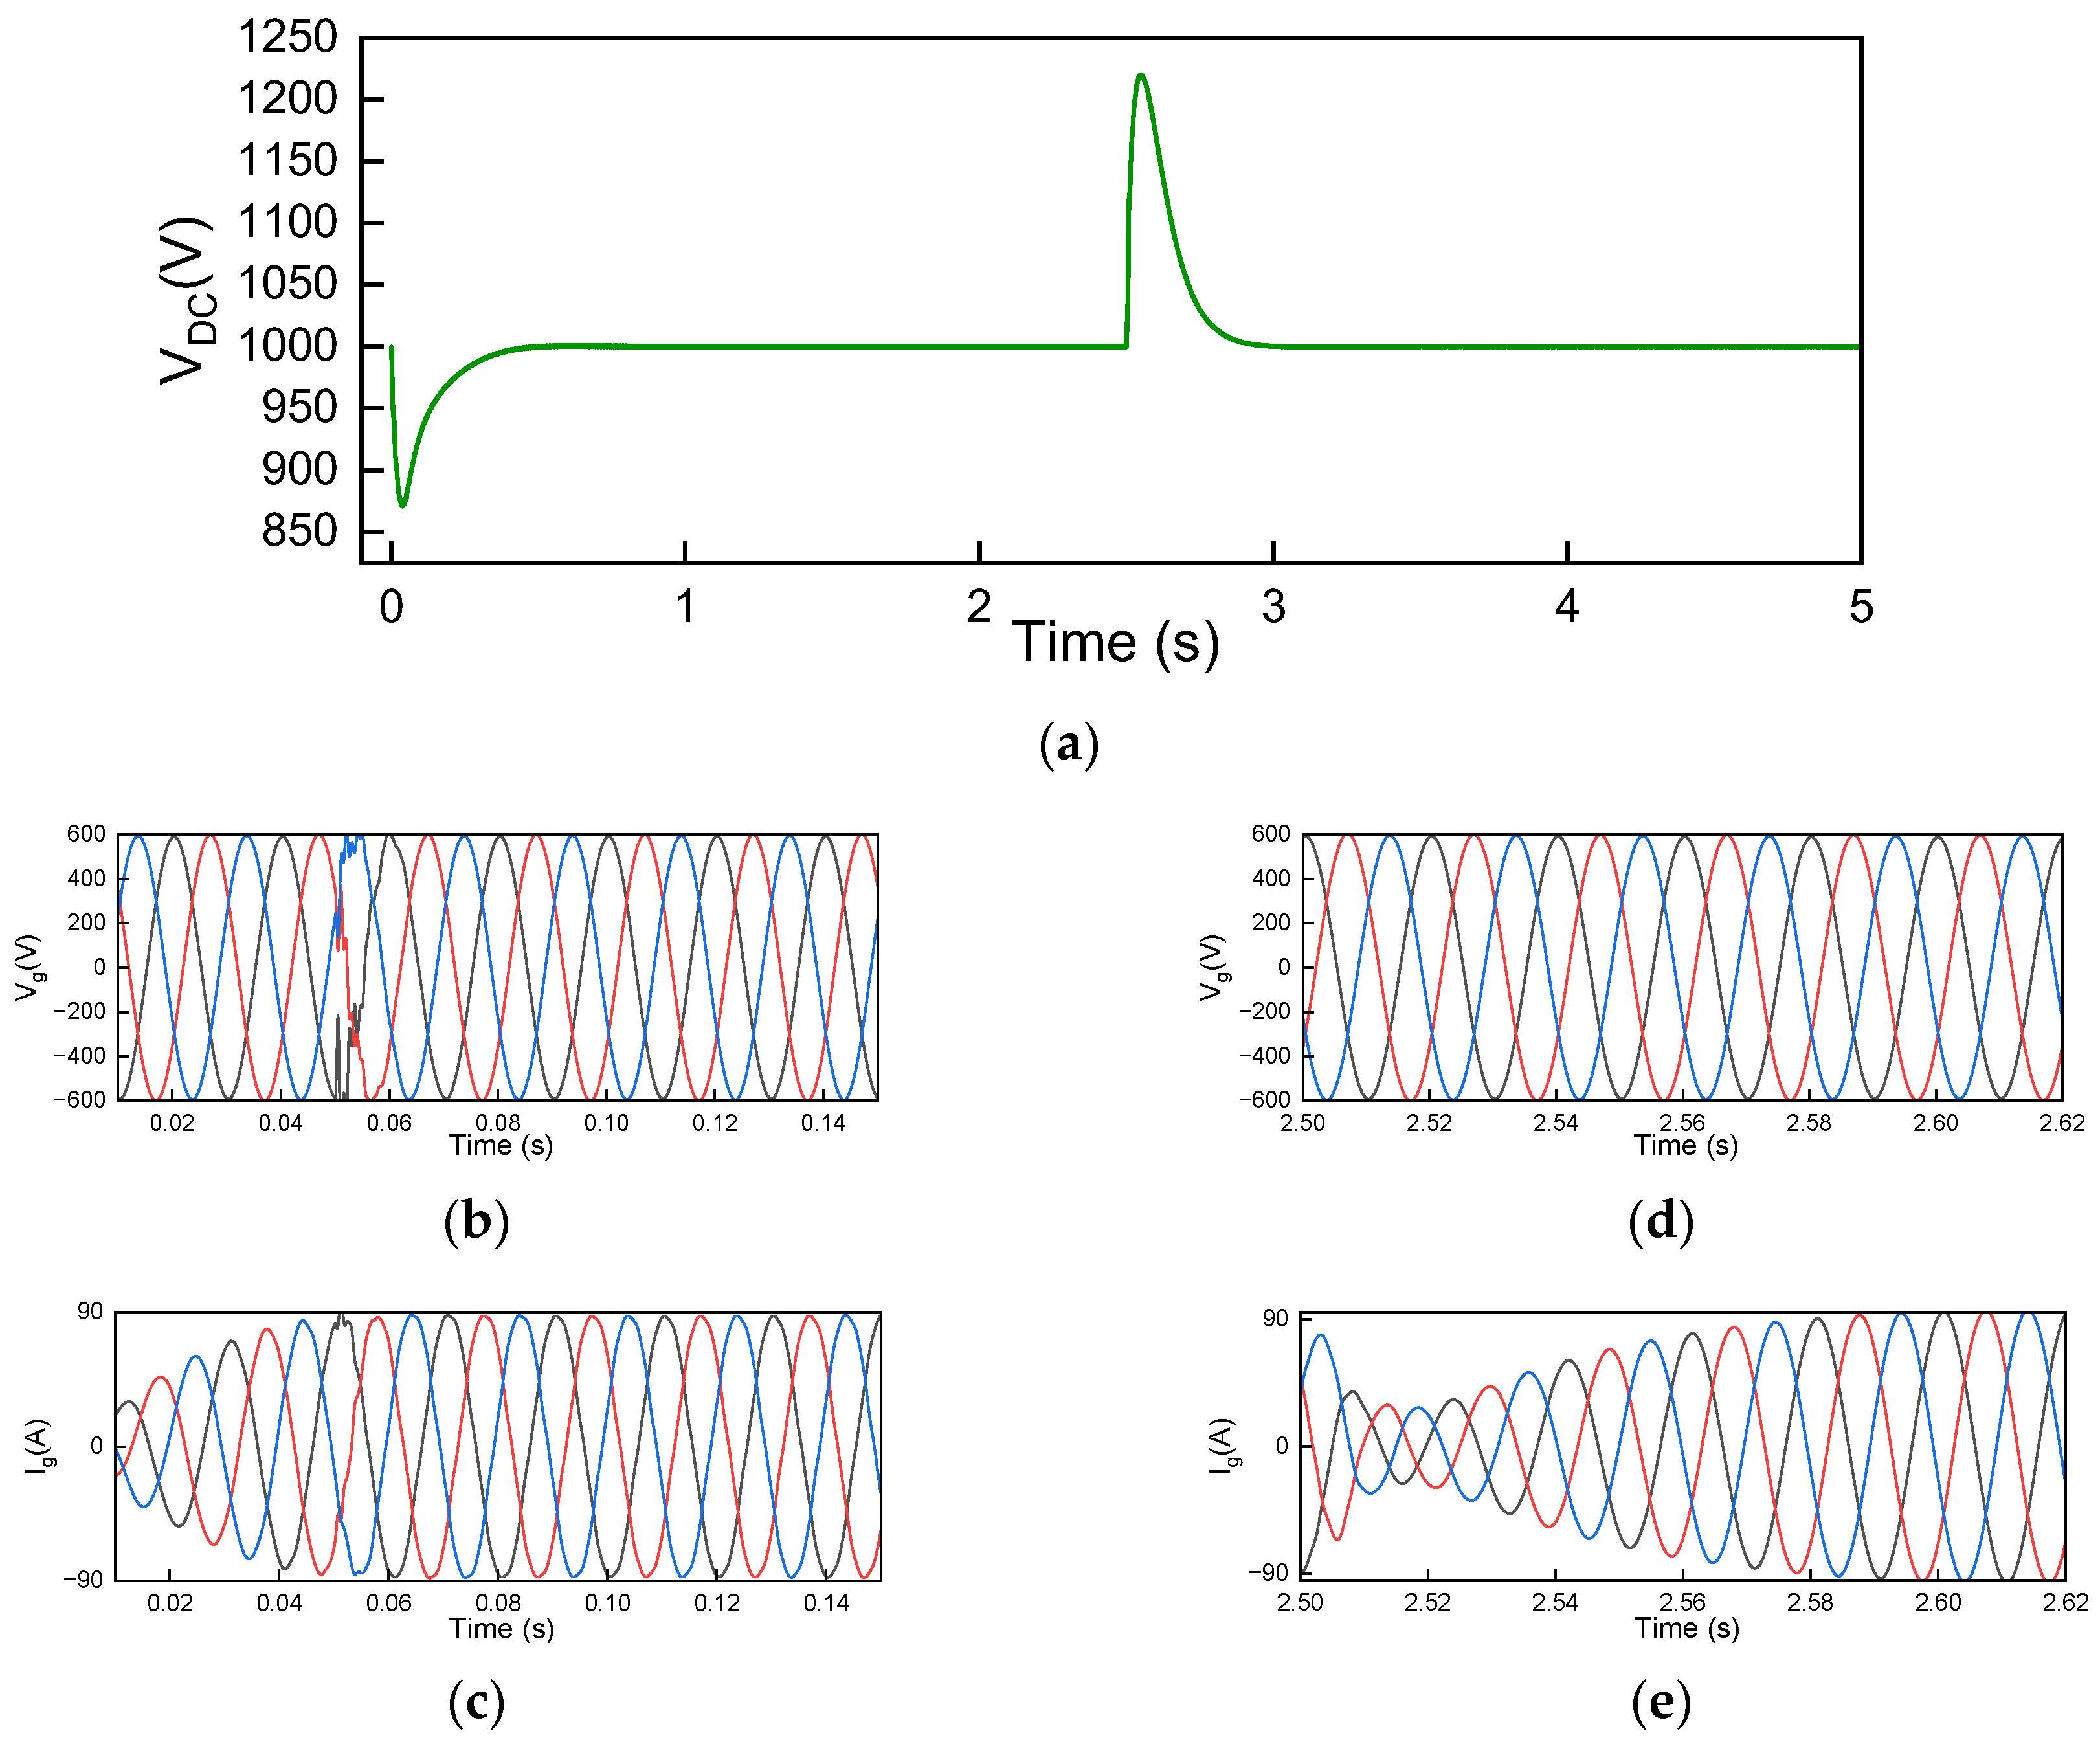
3.4. Parameter Set 4
3.5. Parameter Set 5
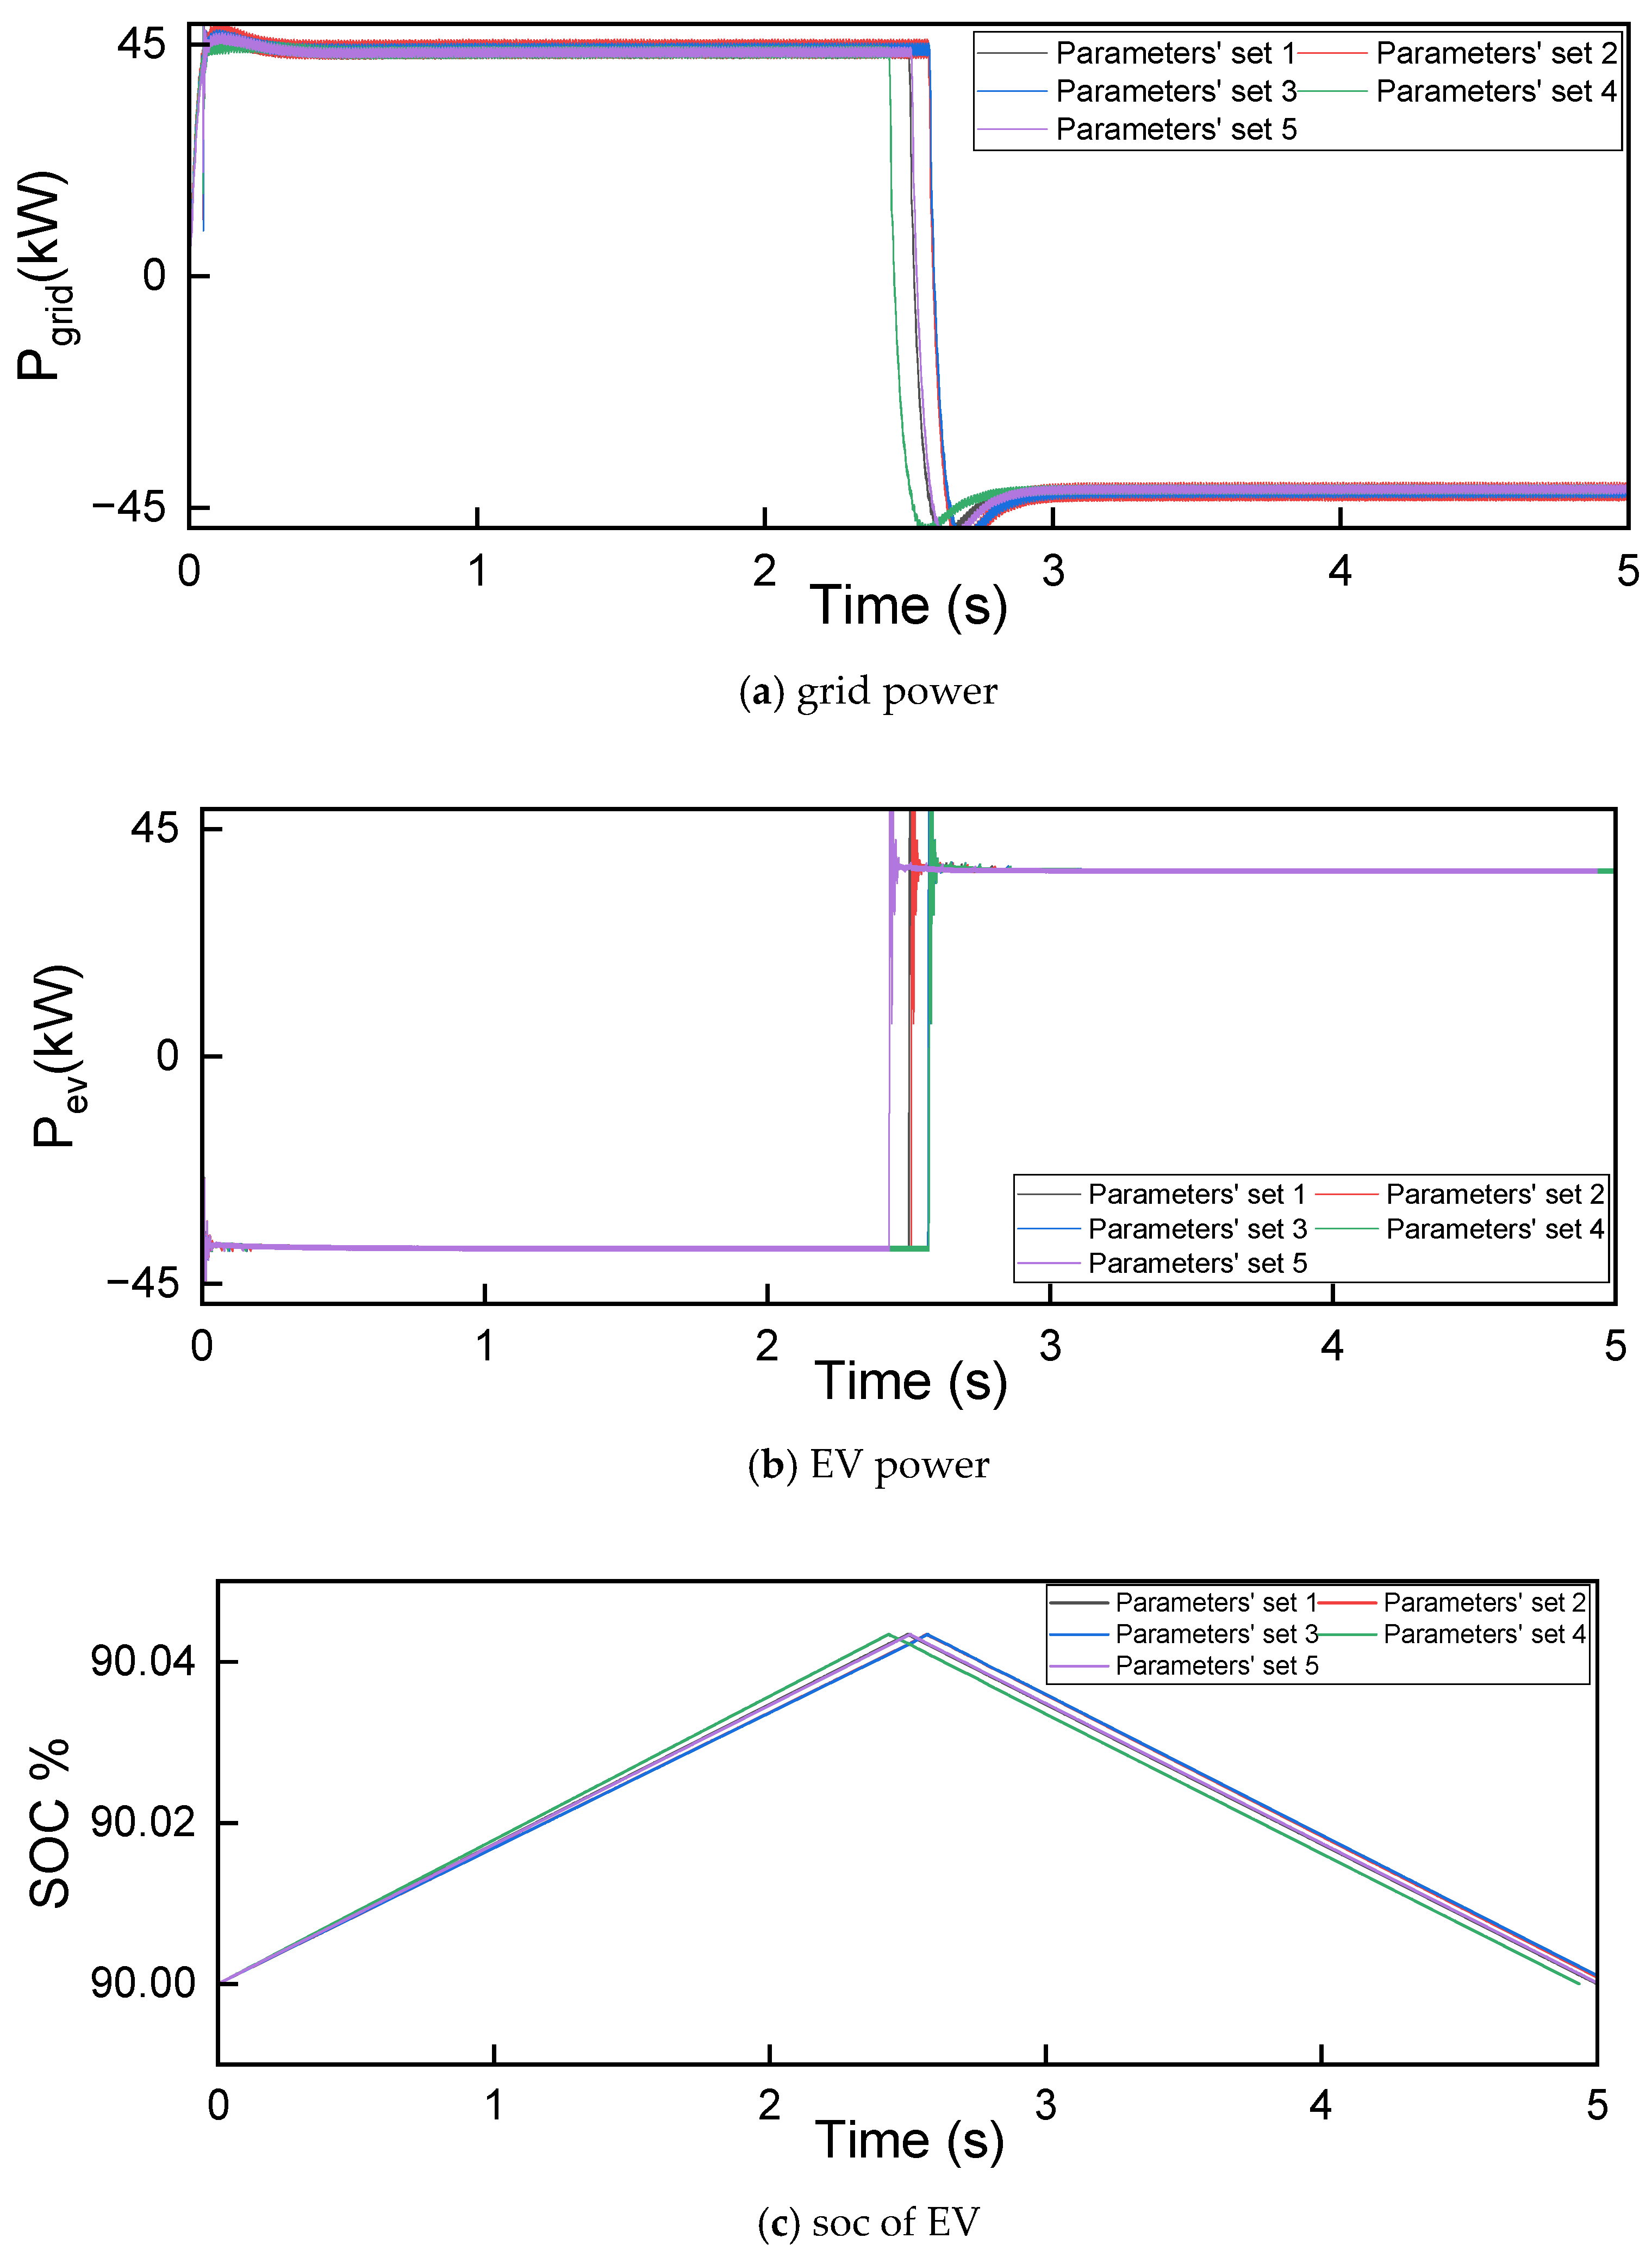
3.6. Power Flow Analysis
3.7. Advantages of the Proposed Bidirectional Charger vs. Unidirectional Charger
- Control Flexibility:
- 2.
- Power-Quality Support:
- 3.
- Inverter Design:
- 4.
- Grid Interaction:
3.8. Comparative Study
4. Discussion
- i.
- On the basis of mathematical calculations and real equipment data information gathered, a novel grid-integrated electric vehicle charging station has been modeled. The simulation tests were conducted to assess the impact of electric vehicle charging stations on the grid’s power quality. The development of reliable and accurate simulation models is possible, but at the same time, because of the solutions adopted, it is highly technical and complicated. Therefore, one-size-fits-all is ruled out. In short, it can be inferred that different grid topologies can have a different impact, either positive or negative, when new energy vehicles are integrated.
- ii.
- This work sheds light on the fact that in order to assess the impact of electric vehicle charging stations on the grid, not only do charging station components need to be modeled in detail, but also the grid’s topology and each of its components need to be calculated, designed, and verified via simulation analysis. These data are not readily available from distribution operators and/or equipment manufacturers.
- iii.
- Since there are no standards defined for the simultaneity factor, it is assumed that all the chargers are working simultaneously. In that case, the results showed that the voltage and current THD did not exceed 1%, which is acceptable, and they indicate that the charging station has no negative impact in the proposed scenario.
- iv.
- The V2G mode can be used as one of the elements of the smart grid, and it can also act as energy storage systems by reducing the need for power electronics circuitry, which results in power losses and harmonics not desired.
- v.
- To further test and analyse the introduction of the impact of electric vehicles on the grid, this model provides a good testing platform without the need for a costly hardware experimental setup. Since climate change has reached its peak point, there is a dire need to move towards low-carbon technologies in the transportation sector. The positive results provide a good base for using this model for the investigation of various other operations, i.e., new-energy vehicles and low-carbon technology integration into the grid.
5. Conclusions
Author Contributions
Funding
Data Availability Statement
Acknowledgments
Conflicts of Interest
References
- International Energy Agency-Global EV Outlook 2020—Entering the Decade of Electric Drive? 2020. Available online: https://iea.blob.core.windows.net/assets/af46e012-18c2-44d6-becd-bad21fa844fd/Global_EV_Outlook_2020.pdf (accessed on 1 April 2025).
- Becker, T.A.; Sidhu, I.; Tenderich, B. Electric Vehicles in the United States A New Model with Forecasts to 2030; University of California, Berkeley, Center for Entrepreneurship & Technology (CET): Berkeley, CA, USA, 2009. [Google Scholar]
- Colmenar-Santos, A.; Muñoz-Gómez, A.-M.; Rosales-Asensio, E.; López-Rey, Á. Electric vehicle charging strategy to support renewable energy sources in Europe 2050 low-carbon scenario. Energy 2019, 183, 61–74. [Google Scholar] [CrossRef]
- Tuballa, M.L.; Abundo, M.L. A review of the development of Smart Grid technologies. Renew. Sustain. Energy Rev. 2016, 59, 710–725. [Google Scholar] [CrossRef]
- Judge, M.A.; Khan, A.; Manzoor, A.; Khattak, H.A. Overview of smart grid implementation: Frameworks, impact, performance and challenges. J. Energy Storage 2022, 49, 104056. [Google Scholar] [CrossRef]
- Richardson, D.B. Electric vehicles and the electric grid: A review of modeling approaches, Impacts, and renewable energy integration. Renew. Sustain. Energy Rev. 2013, 19, 247–254. [Google Scholar] [CrossRef]
- Yong, J.Y.; Ramachandaramurthy, V.K.; Tan, K.M.; Mithulananthan, N. A review on the state-of-the-art technologies of electric vehicle, its impacts and prospects. Renew. Sustain. Energy Rev. 2015, 49, 365–385. [Google Scholar] [CrossRef]
- Haidar, A.M.A.; Muttaqi, K.M.; Sutanto, D. Technical challenges for electric power industries due to grid-integrated electric vehicles in low voltage distributions: A review. Energy Convers. Manag. 2014, 86, 689–700. [Google Scholar] [CrossRef]
- Su, W.; Eichi, H.; Zeng, W.; Chow, M.-Y. A Survey on the Electrification of Transportation in a Smart Grid Environment. IEEE Trans. Ind. Inform. 2012, 8, 1–10. [Google Scholar] [CrossRef]
- Eroǧlu, F.; Kurtoǧlu, M.; Vural, A.M. Bidirectional DC–DC converter based multilevel battery storage systems for electric vehicle and large-scale grid applications: A critical review considering different topologies, state-of-charge balancing and future trends. IET Renew. Power Gener. 2021, 15, 915–938. [Google Scholar] [CrossRef]
- Yilmaz, M.; Krein, P.T. Review of Battery Charger Topologies, Charging Power Levels, and Infrastructure for Plug-In Electric and Hybrid Vehicles. IEEE Trans. Power Electron. 2013, 28, 2151–2169. [Google Scholar] [CrossRef]
- Islam, S.; Iqbal, A.; Marzband, M.; Khan, I.; Al-Wahedi, A.M.A.B. State-of-the-art vehicle-to-everything mode of operation of electric vehicles and its future perspectives. Renew. Sustain. Energy Rev. 2022, 166, 112574. [Google Scholar] [CrossRef]
- Monteiro, V.; Pinto, J.G.; Afonso, J.L. Operation Modes for the Electric Vehicle in Smart Grids and Smart Homes: Present and Proposed Modes. IEEE Trans. Veh. Technol. 2016, 65, 1007–1020. [Google Scholar] [CrossRef]
- Lenka, R.K.; Panda, A.K. Grid power quality improvement using a vehicle-to-grid enabled bidirectional off-board electric vehicle battery charger. Int. J. Circuit Theory Appl. 2021, 49, 2612–2629. [Google Scholar] [CrossRef]
- Lenka, R.K.; Panda, A.K.; Senapati, L. Grid integrated multifunctional EV charging infrastructure with improved power quality. J. Energy Storage 2024, 76, 109637. [Google Scholar] [CrossRef]
- Thanakam, T.; Kumsuwan, Y. A novel Phase-Lock-Loop algorithm for Three-Phase grid voltage Distortion-Connected electric vehicle chargers. AEU Int. J. Electron. Commun. 2023, 158, 154468. [Google Scholar] [CrossRef]
- Milanes-Montero, M.I.; Gallardo-Lozano, J.; Romero-Cadaval, E.; Gonzalez-Romera, E. Hall-effect based semi-fast AC on-board charging equipment for electric vehicles. Sensors 2011, 11, 9313–9326. [Google Scholar] [CrossRef] [PubMed]
- Behera, S.; Venkata Ramana Naik, N.; Panda, A.K.; Behera, S.K. Advanced off-board bidirectional electric vehicle charger with enhanced power quality and supporting grid resilience. Electr. Eng. 2023, 106, 3231–3242. [Google Scholar] [CrossRef]
- Kushwaha, R.; Singh, B. Power Factor Improvement in Modified Bridgeless Landsman Converter Fed EV Battery Charger. IEEE Trans. Veh. Technol. 2019, 68, 3325–3336. [Google Scholar] [CrossRef]
- Farahani, H.F.; Rabiee, A.; Khalili, M. Plug-in electric vehicles as a harmonic compensator into microgrids. J. Clean. Prod. 2017, 159, 388–396. [Google Scholar] [CrossRef]
- Hu, Z.; Han, Y.; Zalhaf, A.S.; Zhou, S.; Zhao, E.; Yang, P. Harmonic Sources Modeling and Characterization in Modern Power Systems: A Comprehensive Overview. Electr. Power Syst. Res. 2023, 218, 109234. [Google Scholar] [CrossRef]
- Baraniak, J.; Starzyński, J. Modeling the Impact of Electric Vehicle Charging Systems on Electric Power Quality. Energies 2020, 13, 3951. [Google Scholar] [CrossRef]
- Deilami, S.; Masoum, A.S.; Moses, P.S.; Masoum, M.A.S. Voltage Profile and THD Distortion of Residential Network with High Penetration of Plug-in Electrical Vehicles. In Proceedings of the IEEE PES Innovative Smart Grid Technologies Conference Europe (ISGT Europe), Gothenberg, Sweden, 11–13 October 2010; pp. 1–6. [Google Scholar]
- Restrepo, M.; Morris, J.; Kazerani, M.; Canizares, C.A. Modeling and Testing of a Bidirectional Smart Charger for Distribution System EV Integration. IEEE Trans. Smart Grid 2018, 9, 152–162. [Google Scholar] [CrossRef]
- de Melo, H.N.; Trovao, J.P.F.; Pereirinha, P.G.; Jorge, H.M.; Antunes, C.H. A Controllable Bidirectional Battery Charger for Electric Vehicles with Vehicle-to-Grid Capability. IEEE Trans. Veh. Technol. 2018, 67, 114–123. [Google Scholar] [CrossRef]
- Monteiro, V.; Pinto, J.G.; Afonso, J.L. Improved vehicle-for-grid (iV4G) mode: Novel operation mode for EVs battery chargers in smart grids. Int. J. Electr. Power Energy Syst. 2019, 110, 579–587. [Google Scholar] [CrossRef]
- Lenka, R.K.; Panda, A.K.; Dash, A.R.; Senapati, L.; Tiwary, N. A Unified Control of Grid-Interactive Off-Board EV Battery Charger with Improved Power Quality. IEEE Trans. Transp. Electrif. 2023, 9, 920–933. [Google Scholar] [CrossRef]
- Gupta, J.; Maurya, R.; Arya, S.R. Improved Power Quality On-Board Integrated Charger With Reduced Switching Stress. IEEE Trans. Power Electron. 2020, 35, 10810–10820. [Google Scholar] [CrossRef]
- Gomez, J.C.; Morcos, M.M. Impact of EV battery chargers on the power quality of distribution systems. IEEE Trans. Power Deliv. 2003, 18, 975–981. [Google Scholar] [CrossRef]
- Ananthapadmanabha, B.R.; Maurya, R.; Arya, S.R. Improved Power Quality Switched Inductor Cuk Converter for Battery Charging Applications. IEEE Trans. Power Electron. 2018, 33, 9412–9423. [Google Scholar] [CrossRef]
- Khalid, M.R.; Alam, M.S.; Krishnamurthy, M.; Al-Ammar, E.A.; Alrajhi, H.; Asghar, M.S.J. A Multiphase AC–DC Converter With Improved Power Quality for EV Charging Station. IEEE Trans. Transp. Electrif. 2022, 8, 909–924. [Google Scholar] [CrossRef]
- Jaraniya, D.a.G. Urvashi Kumar Shailendra Mittal Arvind Multifunctional bidirectional charging system for EVs the grid with improved power quality using sparse proportionate-NLMFbased method. CSEE J. Power Energy Syst. 2022, 9, 1203–1213. [Google Scholar]
- Letha, S.S.; Busatto, T.; Bollen, M. Interaction Between Charging Infrastructure and the Electricity Grid; Tech. Rep.; Lulea University of Technology: Luleå, Sweden, 2021. [Google Scholar]
- Senol, M.; Safak Bayram, I.; Campos-Gaona, D.; Sevdari, K.; Gehrke, O.; Pepper, B.; Galloway, S. Measurement-based Harmonic Analysis of Electric Vehicle Smart Charging. In Proceedings of the 2024 IEEE Transportation Electrification Conference and Expo (ITEC), Chicago, IL, USA, 19–21 June 2024; pp. 1–6. [Google Scholar]
- The Future of Flexible Charging; Tech. Rep.; Agile Streets: London, UK, 2022.
- Caro, L.M.; Ramos, G.; Rauma, K.; Rodriguez, D.F.C.; Martinez, D.M.; Rehtanz, C. State of Charge Influence on the Harmonic Distortion from Electric Vehicle Charging. IEEE Trans. Ind. Appl. 2021, 57, 2077–2088. [Google Scholar] [CrossRef]
- Benedetto, G.; Bompard, E.; Mazza, A.; Pons, E.; Jaboeuf, R.; Tosco, P.; Zampolli, M. Impact of bidirectional EV charging stations on a distribution network: A Power Hardware-In-the-Loop implementation. Sustain. Energy Grids Netw. 2023, 35, 101106. [Google Scholar] [CrossRef]
- Tran, V.T.; Muttaqi, K.M.; Sutanto, D. A Robust Power Management Strategy With Multi-Mode Control Features for an Integrated PV and Energy Storage System to Take the Advantage of ToU Electricity Pricing. IEEE Trans. Ind. Appl. 2019, 55, 2110–2120. [Google Scholar] [CrossRef]
- Lenka, R.K.; Panda, A.K.; Patel, R.; Guerrero, J.M. PV Integrated Multifunctional Off-Board EV Charger With Improved Grid Power Quality. IEEE Trans. Ind. Appl. 2022, 58, 5520–5532. [Google Scholar] [CrossRef]
- Verma, A.; Singh, B.; Chandra, A.; Al Haddad, K. An Implementation of Solar PV Array Based Multifunctional EV Charger. IEEE Trans. Ind. Appl. 2020, 56, 4166–4178. [Google Scholar] [CrossRef]
- Kumar, B.A.; Jyothi, B.; Singh, A.R.; Bajaj, M.; Rathore, R.S.; Berhanu, M. A novel strategy towards efficient and reliable electric vehicle charging for the realisation of a true sustainable transportation landscape. Sci. Rep. 2024, 14, 3261. [Google Scholar] [CrossRef] [PubMed]
- Singh, B.; Verma, A.; Chandra, A.; Al Haddad, K. Implementation of Solar PV- Battery and Diesel Generator Based Electric Vehicle Charging Station. IEEE Trans. Ind. Appl. 2020, 56, 4007–4016. [Google Scholar] [CrossRef]
- Jain, V.; Singh, B.; Seema. A Grid Connected PV Array and Battery Energy Storage Interfaced EV Charging Station. IEEE Trans. Transp. Electrif. 2023, 9, 3723–3730. [Google Scholar] [CrossRef]
- Taghizadeh, S.; Hossain, M.J.; Poursafar, N.; Lu, J.; Konstantinou, G. A Multifunctional Single-Phase EV On-Board Charger with a New V2V Charging Assistance Capability. IEEE Access 2020, 8, 116812–116823. [Google Scholar] [CrossRef]
- Gupta, J.; Singh, B. A General-Purpose Transformerless Charging System Based on Fully Bridgeless Canonical Switching Cell High-Quality Rectifier for LVEVs. IEEE Trans. Transp. Electrif. 2023, 9, 4211–4222. [Google Scholar] [CrossRef]
- Kushwaha, R.; Singh, B. Interleaved Landsman Converter Fed EV Battery Charger with Power Factor Correction. IEEE Trans. Ind. Appl. 2020, 56, 4179–4192. [Google Scholar] [CrossRef]
- Zhang, M.; Yuan, Y.; Sun, X.; Zhang, Y.; Li, X. Harmonic Resonance Suppression Strategy of the Front-End Vienna Rectifier in EV Charging Piles. IEEE Trans. Power Electron. 2023, 38, 1036–1053. [Google Scholar] [CrossRef]
- Lin, P.; Wang, P.; Jin, C.; Xiao, J.; Li, X.; Guo, F.; Zhang, C. A Distributed Power Management Strategy for Multi-Paralleled Bidirectional Interlinking Converters in Hybrid AC/DC Microgrids. IEEE Trans. Smart Grid 2019, 10, 5696–5711. [Google Scholar] [CrossRef]
- Nguyen, H.V.; Lee, D.-C.; Blaabjerg, F. A Novel SiC-Based Multifunctional Onboard Battery Charger for Plug-In Electric Vehicles. IEEE Trans. Power Electron. 2021, 36, 5635–5646. [Google Scholar] [CrossRef]
- Makrygiorgou, J.J.; Alexandridis, A.T. Unified Modeling, Control, and Stability for a Vehicle-to-Grid and Plug-In EV System. IEEE J. Emerg. Sel. Top. Power Electron. 2022, 10, 3284–3301. [Google Scholar] [CrossRef]
- IEEE 519-2014; IEEE Recommended Practice and Requirements for Harmonic Control in Electric Power Systems. Institute of Electrical and Electronics Engineers (IEEE): New York, NY, USA, 2014.
- IEC 61000-3-2; Electromagnetic compatibility (EMC)—Part 3-2: Limits-Limits for Harmonic Current Emissions (Equipment Input Current ≤ 16 A Per Phase). International Electrotechnical Commission (IEC): Geneva, Switzerland, 2018.
- GB/T 32893-2016; Specification of Operation Management for Power User’s 10kV Substations and Above. China Electricity Council: Beijing, China, 2016. Available online: https://openstd.samr.gov.cn/bzgk/gb/newGbInfo?hcno=33E136866859A23DDBF36C475630107C (accessed on 1 April 2025).
- GB/T 5585.1-2018; Copper or Aluminium and Its Alloy Bus Bars for Electrical Purposes—Part 1: Copper and Copper Alloy Bus Bars. China Electrical Equipment Industry Association: Beijing, China, 2018. Available online: https://openstd.samr.gov.cn/bzgk/gb/newGbInfo?hcno=942B6BCC24D80C0796F31F217A4A4370 (accessed on 1 April 2025).
- GB/T 5585.2-2018; Copper or Aluminium and Its Alloy Bus Bars for Electrical Purposes—Part 2: Aluminium and Aluminium Alloy Bus Bars. China Electrical Equipment Industry Association: Beijing, China, 2018. Available online: https://openstd.samr.gov.cn/bzgk/gb/newGbInfo?hcno=D70AA7B5DFC0D0845CD88820A94B5D24 (accessed on 1 April 2025).
- GB 50217-2018; Standard for Design of Cables of Electric Power Engineering. China Planning Press: Beijing, China, 2018.
- GB 51302-2018; Design Standard for Overhead Insulated Distribution Lines. Ministry of Housing and Urban-Rural Development of the People’s Republic of China: Beijing, China, 2019.
- GB/T 17468-2019; Guide for Choice Power Transformers. China Electrical Equipment Industry Association: Beijing, China, 2019. Available online: https://openstd.samr.gov.cn/bzgk/gb/newGbInfo?hcno=CF33CE8B6298F40E9A9085145D65A8FC (accessed on 1 April 2025).
- GB/T 10228-2023; Technical Parameters and Requirements for Dry-Type Power Transformers. China Electrical Equipment Industry Association: Beijing, China, 2023. Available online: https://openstd.samr.gov.cn/bzgk/gb/newGbInfo?hcno=5666A2BCF8270816A703314BC64FAE0B (accessed on 1 April 2025).
- GB/T 6451-2023; Technical Parameters and Requirements for Oil-Immersed Power Transformers. China Electrical Equipment Industry Association: Beijing, China, 2023. Available online: https://openstd.samr.gov.cn/bzgk/gb/newGbInfo?hcno=A75E4FE74ED07563EAD11D6379E0E3A5 (accessed on 1 April 2025).
- GB/T 23755-2020; Three-Phase Site-Combined Power Transformer. China Electrical Equipment Industry Association: Beijing, China, 2020. Available online: https://openstd.samr.gov.cn/bzgk/gb/newGbInfo?hcno=A88109F060853D3C6B6F87A19B0BB02E (accessed on 1 April 2025).
- Mehmood, A.; Yang, F.; Dong, J.; Luo, Z.; Yi, L.; Wu, T. Modeling and Load Flow Analysis for Three phase Unbalanced Distribution System. In Proceedings of the 2021 4th International Conference on Energy, Electrical and Power Engineering (CEEPE), Chongqing, China, 23–25 April 2021; pp. 44–48. [Google Scholar]
- Arancibia, A.; Strunz, K. Modeling of an electric vehicle charging station for fast DC charging. In Proceedings of the 2012 IEEE International Electric Vehicle Conference (IEVC), Greenville, SC, USA, 4–8 March 2012; pp. 1–6. [Google Scholar]
- Kalichikadu Paramasivam, S.; Ramu, S.K.; Cholamuthu, P. Unit vector template control strategy-based harmonic mitigation and charging with three phase–three level–three switch Vienna rectifier for Level 3 electric vehicle charging applications. Int. J. Circuit Theory Appl. 2023, 52, 2889–2915. [Google Scholar] [CrossRef]
- Pattnaik, M.; Badoni, M.; Kumar, R.; Khetrapal, P.; Kumari, P. Enhancing the performance of solar-powered EV charging stations using the TOSSI-based CTF technique. Electr. Power Syst. Res. 2025, 239, 111206. [Google Scholar] [CrossRef]


| References | GCO | G2V | V2G | Reduction in Harmonics of Grid Current | Improved THD with EV Charging | Grid Electrical Components Modelling Based Approach | Efficiency | THD |
|---|---|---|---|---|---|---|---|---|
| [27] | ✓ | ✓ | ✓ | ✓ | ✕ | ✕ | - | I = 3.53%, 2.98%, 3.12% |
| [38] | ✓ | ✕ | ✕ | ✕ | ✕ | ✕ | - | - |
| [39] | ✓ | ✓ | ✓ | ✓ | ✕ | ✕ | - | - |
| [40] | ✓ | ✓ | ✓ | ✕ | ✕ | ✕ | - | V = 1.9%, I = 4.1% |
| [18] | ✓ | ✓ | ✓ | ✓ | ✕ | ✕ | - | V = 3.917%, I = 2.008% |
| [41] | ✕ | ✕ | ✕ | ✕ | ✕ | ✕ | - | - |
| [42,43] | ✓ | ✓ | ✓ | ✕ | ✕ | ✕ | - | - V = 2.02%, 2.05%, 2.06%, I = 3.17%, 2.98%, 3.32% |
| [44] | ✓ | ✓ | ✓ | ✕ | ✕ | ✕ | 87% | I = 3.37% |
| [45,46] | ✕ | ✕ | ✕ | ✕ | ✕ | ✕ | 80–90% 91.5% | I = 3.9%, 3.2%, 4.8%, I = 1.9%, 2.9% and 1.6% |
| [47] | ✓ | ✕ | ✕ | ✕ | ✕ | ✕ | - | - |
| [24] | ✓ | ✓ | ✓ | ✕ | ✕ | ✕ | - | - |
| [48] | ✓ | ✓ | ✓ | ✕ | ✕ | ✕ | - | - |
| [49] | ✓ | ✓ | ✓ | ✕ | ✕ | ✕ | 96.1% | - |
| [50] | ✓ | ✕ | ✓ | ✕ | ✕ | ✕ | - | - |
| proposed method | ✓ | ✓ | ✓ | ✓ | ✓ | ✓ | 97.4% | V = 0.05%, I = 0.88% |
| Interval Unit | Rated Voltage | Rated Current | Rated Frequency | Device Model | Steady Current | Stability Current | Stability Current Time | Bus Length | Cross-Section Specifications |
|---|---|---|---|---|---|---|---|---|---|
| (kV) | (A) | (Hz) | (kA) | (kA) | (s) | (m) | (mm2) | ||
| 35 kV I | 40.5 | 2500 | 50 | LGJ-300/25 | 80 | 31.5 | 4 | 50 | 333 |
| 35 kV II | 40.5 | 2500 | 50 | LGJ-300/25 | 80 | 31.5 | 4 | 50 | 333 |
| 10 kV I | 12 | 1250 | 50 | TMY-80 × 10 | 80 | 31.5 | 4 | 30 | 80 × 10 |
| 10 kV II | 12 | 1250 | 50 | TMY-80 × 10 | 80 | 31.5 | 4 | 30 | 80 × 10 |
| Interval | Voltage Level | Conductor Model | Line Length | Positive Sequence | Zero Sequence | Max Allowed Line Current | ||||||
|---|---|---|---|---|---|---|---|---|---|---|---|---|
| R | X | B | R | X | B | 40 | 25 | 10 | ||||
| kV | km | Ω/km | Ω/km | S/km | Ω/km | Ω/km | S/km | A | A | A | ||
| l1 | 10 | LGJ-120 | 6.8189 | 3.1746 | 0.0581 | 0.0002 | 0.1261 | 0.06 | 0.0001 | 295 | 380 | 395 |
| l2 | 10 | LGJ-50 | 35.691 | 0.58 | 0.0725 | 0.0001 | 0.1299 | 0.8 | 0.0001 | 170 | 210 | - |
| l3 | 10 | LGJ-120 | 5 | 3.1746 | 0.0581 | 0.0002 | 0.1261 | 0.06 | 0.0001 | 295 | 380 | 395 |
| l4 | 10 | - | - | - | - | - | - | - | - | - | - | |
| l5 | 10 | SGJ-185 | 2 | 2.0592 | 0.0533 | 0.0001 | 0.1251 | 0.15 | 0.0001 | 430 | 560 | - |
| l6 | 10 | JKLYJ-120 | 1.6608 | 3.1746 | 0.0581 | 0.0001 | 0.1261 | 0.06 | 0.0001 | 295 | 380 | 395 |
| l7 | 10 | LGJ-35 | 18.82 | 0.45 | 0.0612 | 0.0001 | 0.1268 | 0.06 | 0.0001 | 245 | 305 | - |
| l8 | 10 | LGJ-120 | 5 | 3.1746 | 0.0581 | 0.0002 | 0.1261 | 0.06 | 0.0001 | 295 | 380 | 395 |
| Label | Rated Voltage (HV) kV | Rated Voltage (LV) kV | Rated Current (LV) A | Rated Capacity MVA | Voltage Ratio | Connection Type | Losses (kW) | Short Circuit Impedance (%) | No Load Current Io (%) | |
|---|---|---|---|---|---|---|---|---|---|---|
| No Load Loss | Load Loss | |||||||||
| T/F1 | 35 kV | 10.5 kV | 549.9 | 10 | (35 ± 3 × 2.5%)/10.5 | YNd11 | 8.87 | 46 | 7.39 | 0.19 |
| T/F2 | 35 kV | 10.5 kV | 549.9 | 10 | (35 ± 3 × 2.5%)/10.5 | YNd11 | 8.87 | 0 | 7.39 | - |
| Label | Voltage Level kV | Rated Frequency Hz | Active Power MW | Reactive Power MVAr | Phases | Connection | Model |
|---|---|---|---|---|---|---|---|
| L1 | 10 kV | 50 | 0.72 | 0.3 | three | wye | constant PQ |
| L2 | 10 kV | 50 | 0.62 | 0.32 | three | wye | constant PQ |
| L3 | 10 kV | 50 | 0.25 | −0.43 | three | wye | constant PQ |
| L5 | 10 kV | 50 | 0.16 | 0.08 | three | wye | constant PQ |
| L6 | 10 kV | 50 | 0.62 | 0.39 | three | wye | constant PQ |
| L7 | 10 kV | 50 | 1.09 | 0.37 | three | wye | constant PQ |
| L8 | 10 kV | 50 | 0.29 | 0.22 | three | wye | constant PQ |
| Label | Voltage Level kV | Rated Capacity MVAr | Rated Voltage kV | Rated CURRENT A | Rated Frequency Hz | Single Unit Capacity | No. of Units | Total Capacity | Capacitance Value µF |
|---|---|---|---|---|---|---|---|---|---|
| C1 | 10 kV | 1.002 | 6.3509 | 105.00 | 50 | 334 | 3 | 1002 | 26.52 |
| C2 | 10 kV | 1.002 | 6.3509 | 105.00 | 50 | 334 | 3 | 1002 | 26.52 |
| Parameters | Specifications |
|---|---|
| Grid system | 230 V, 50 Hz |
| Filter inductance | 5 mH |
| Filter capacitor | 20 µF |
| DC capacitance | 5500 µF |
| DC link voltage | 1000 V |
| Charging power rating | 40 kVA |
| Battery storage | 400 V, 48 Ah |
| Parameter | Value | −20% Variation | +20% Variation |
|---|---|---|---|
| 5 mH | 4 mH | 6 mH | |
| 5 mH | 4 mH | 6 mH | |
| C | 20 µF | 16 µF | 24 µF |
| Technique | Efficiency | Voltage THD | Current THD |
|---|---|---|---|
| STF and SMC-based control strategy [27] | - | - | 3.53%, 2.98%, 3.12% |
| IGBT switch-based converters [40] | - | 1.9%, | 4.1% |
| Adaptive direct-power control theory [18] | - | 3.917%, | 2.008% |
| Positive-sequence components [43] | - | 2.02%, 2.05%, 2.06% | 3.17%, 2.98%, 3.32% |
| H-bridge [44] | 87% | - | 3.37% |
| Fully bridgeless canonical switching cell [45] | 80–90% | - | 3.9%, 3.2%, 4.8% |
| Interleaved Landsman converter [46] | 91.5% | - | 1.9%, 2.9%, 1.6% |
| SiC-based [49] | 96.1% | - | - |
| SPV-based SAPF with UVT control [64] | - | - | 2.5% |
| TOSSI-CTF [65] | - | - | 2.3% |
| Proposed method | 97.4% | 0.05% | 0.88% |
Disclaimer/Publisher’s Note: The statements, opinions and data contained in all publications are solely those of the individual author(s) and contributor(s) and not of MDPI and/or the editor(s). MDPI and/or the editor(s) disclaim responsibility for any injury to people or property resulting from any ideas, methods, instructions or products referred to in the content. |
© 2025 by the authors. Licensee MDPI, Basel, Switzerland. This article is an open access article distributed under the terms and conditions of the Creative Commons Attribution (CC BY) license (https://creativecommons.org/licenses/by/4.0/).
Share and Cite
Mehmood, A.; Yang, F. Improvement of Power Quality of Grid-Connected EV Charging Station Using Grid-Component Based Harmonic Mitigation Technique. Energies 2025, 18, 2876. https://doi.org/10.3390/en18112876
Mehmood A, Yang F. Improvement of Power Quality of Grid-Connected EV Charging Station Using Grid-Component Based Harmonic Mitigation Technique. Energies. 2025; 18(11):2876. https://doi.org/10.3390/en18112876
Chicago/Turabian StyleMehmood, Anum, and Fan Yang. 2025. "Improvement of Power Quality of Grid-Connected EV Charging Station Using Grid-Component Based Harmonic Mitigation Technique" Energies 18, no. 11: 2876. https://doi.org/10.3390/en18112876
APA StyleMehmood, A., & Yang, F. (2025). Improvement of Power Quality of Grid-Connected EV Charging Station Using Grid-Component Based Harmonic Mitigation Technique. Energies, 18(11), 2876. https://doi.org/10.3390/en18112876