
Resilient Distribution System Reconfiguration Based on Genetic Algorithms Considering Load Margin and Contingencies


Abstract
1. Introduction
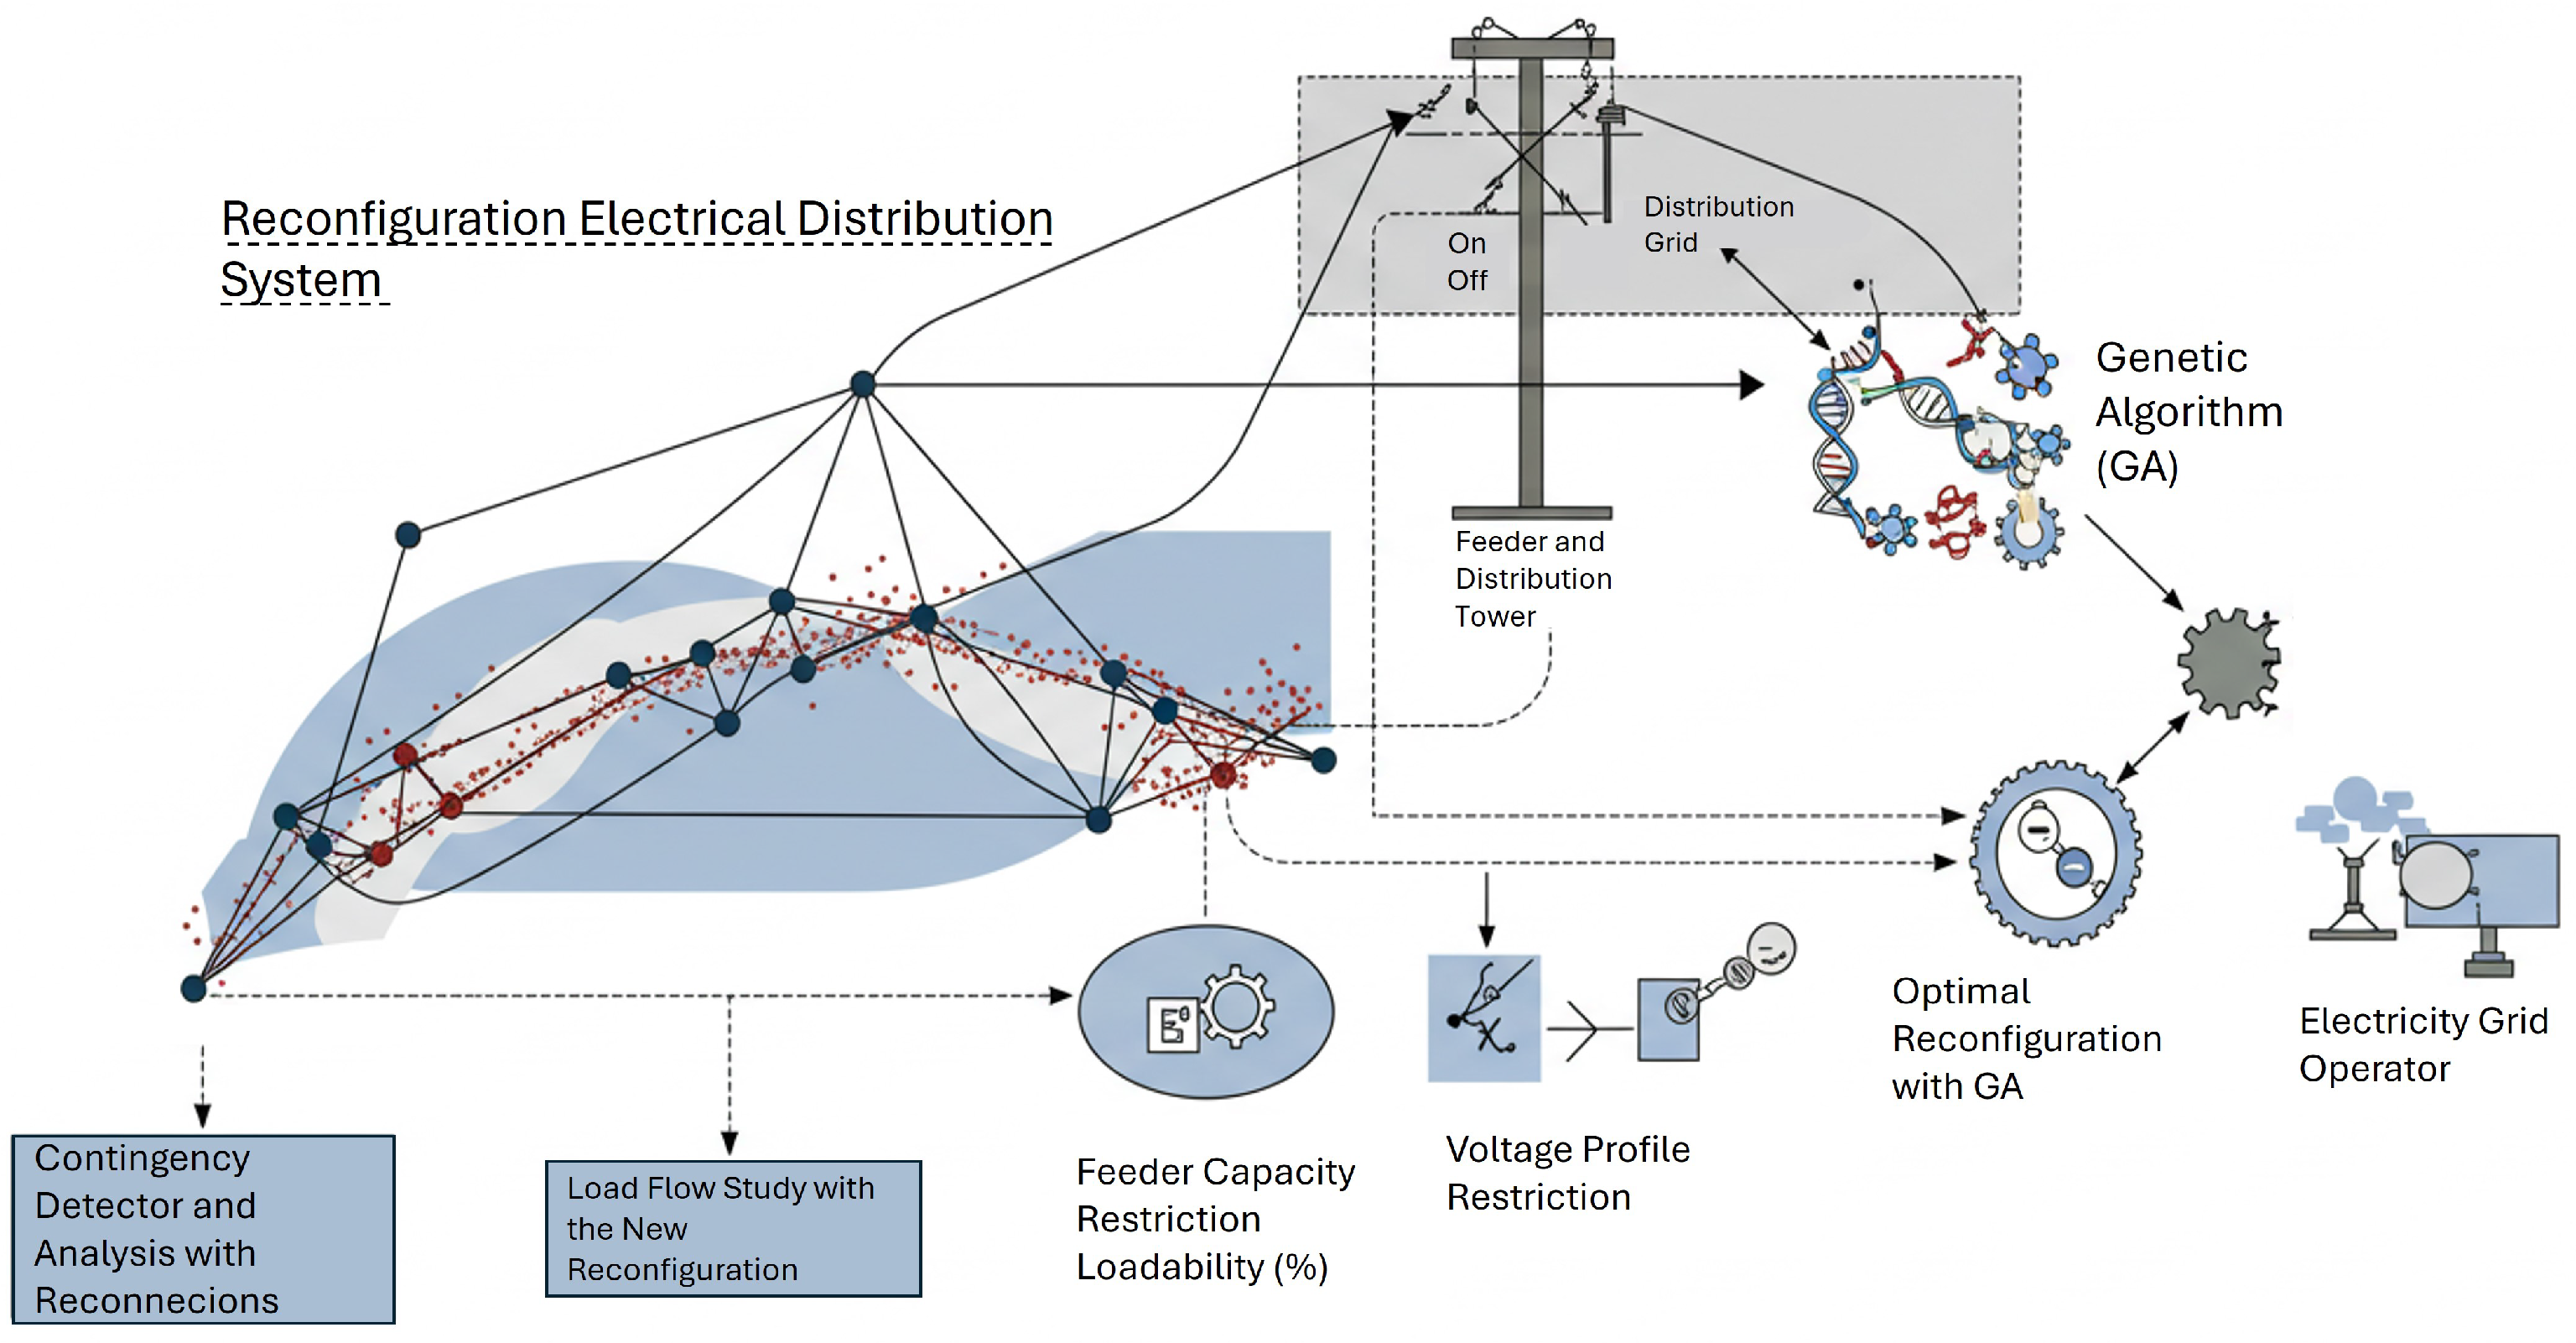
1.1. Research Motivation and Graphical Framework
1.2. Literature Review on Distribution Network Reconfiguration
2. Materials and Methods
2.1. Objective Function
- Nodal loads;
- Binary breaker state variables;
- Z—weighted restored load;
- —priority coefficient for critical users in node K;
- —node load K;
- —binary decision variable of the problem;
- R—de-energized load set;
- —current between nodes i and j;
- —maximum current supported by a conductor;
- —minimum allowed nodal voltage;
- —maximum allowed nodal voltage;
- —number of connected branches of the system;
- —total number of connected nodes of the system.
2.2. Methodology
| Algorithm 1 Distribution System Optimization Using Genetic Algorithm (GA). |
|
2.3. Case Studies
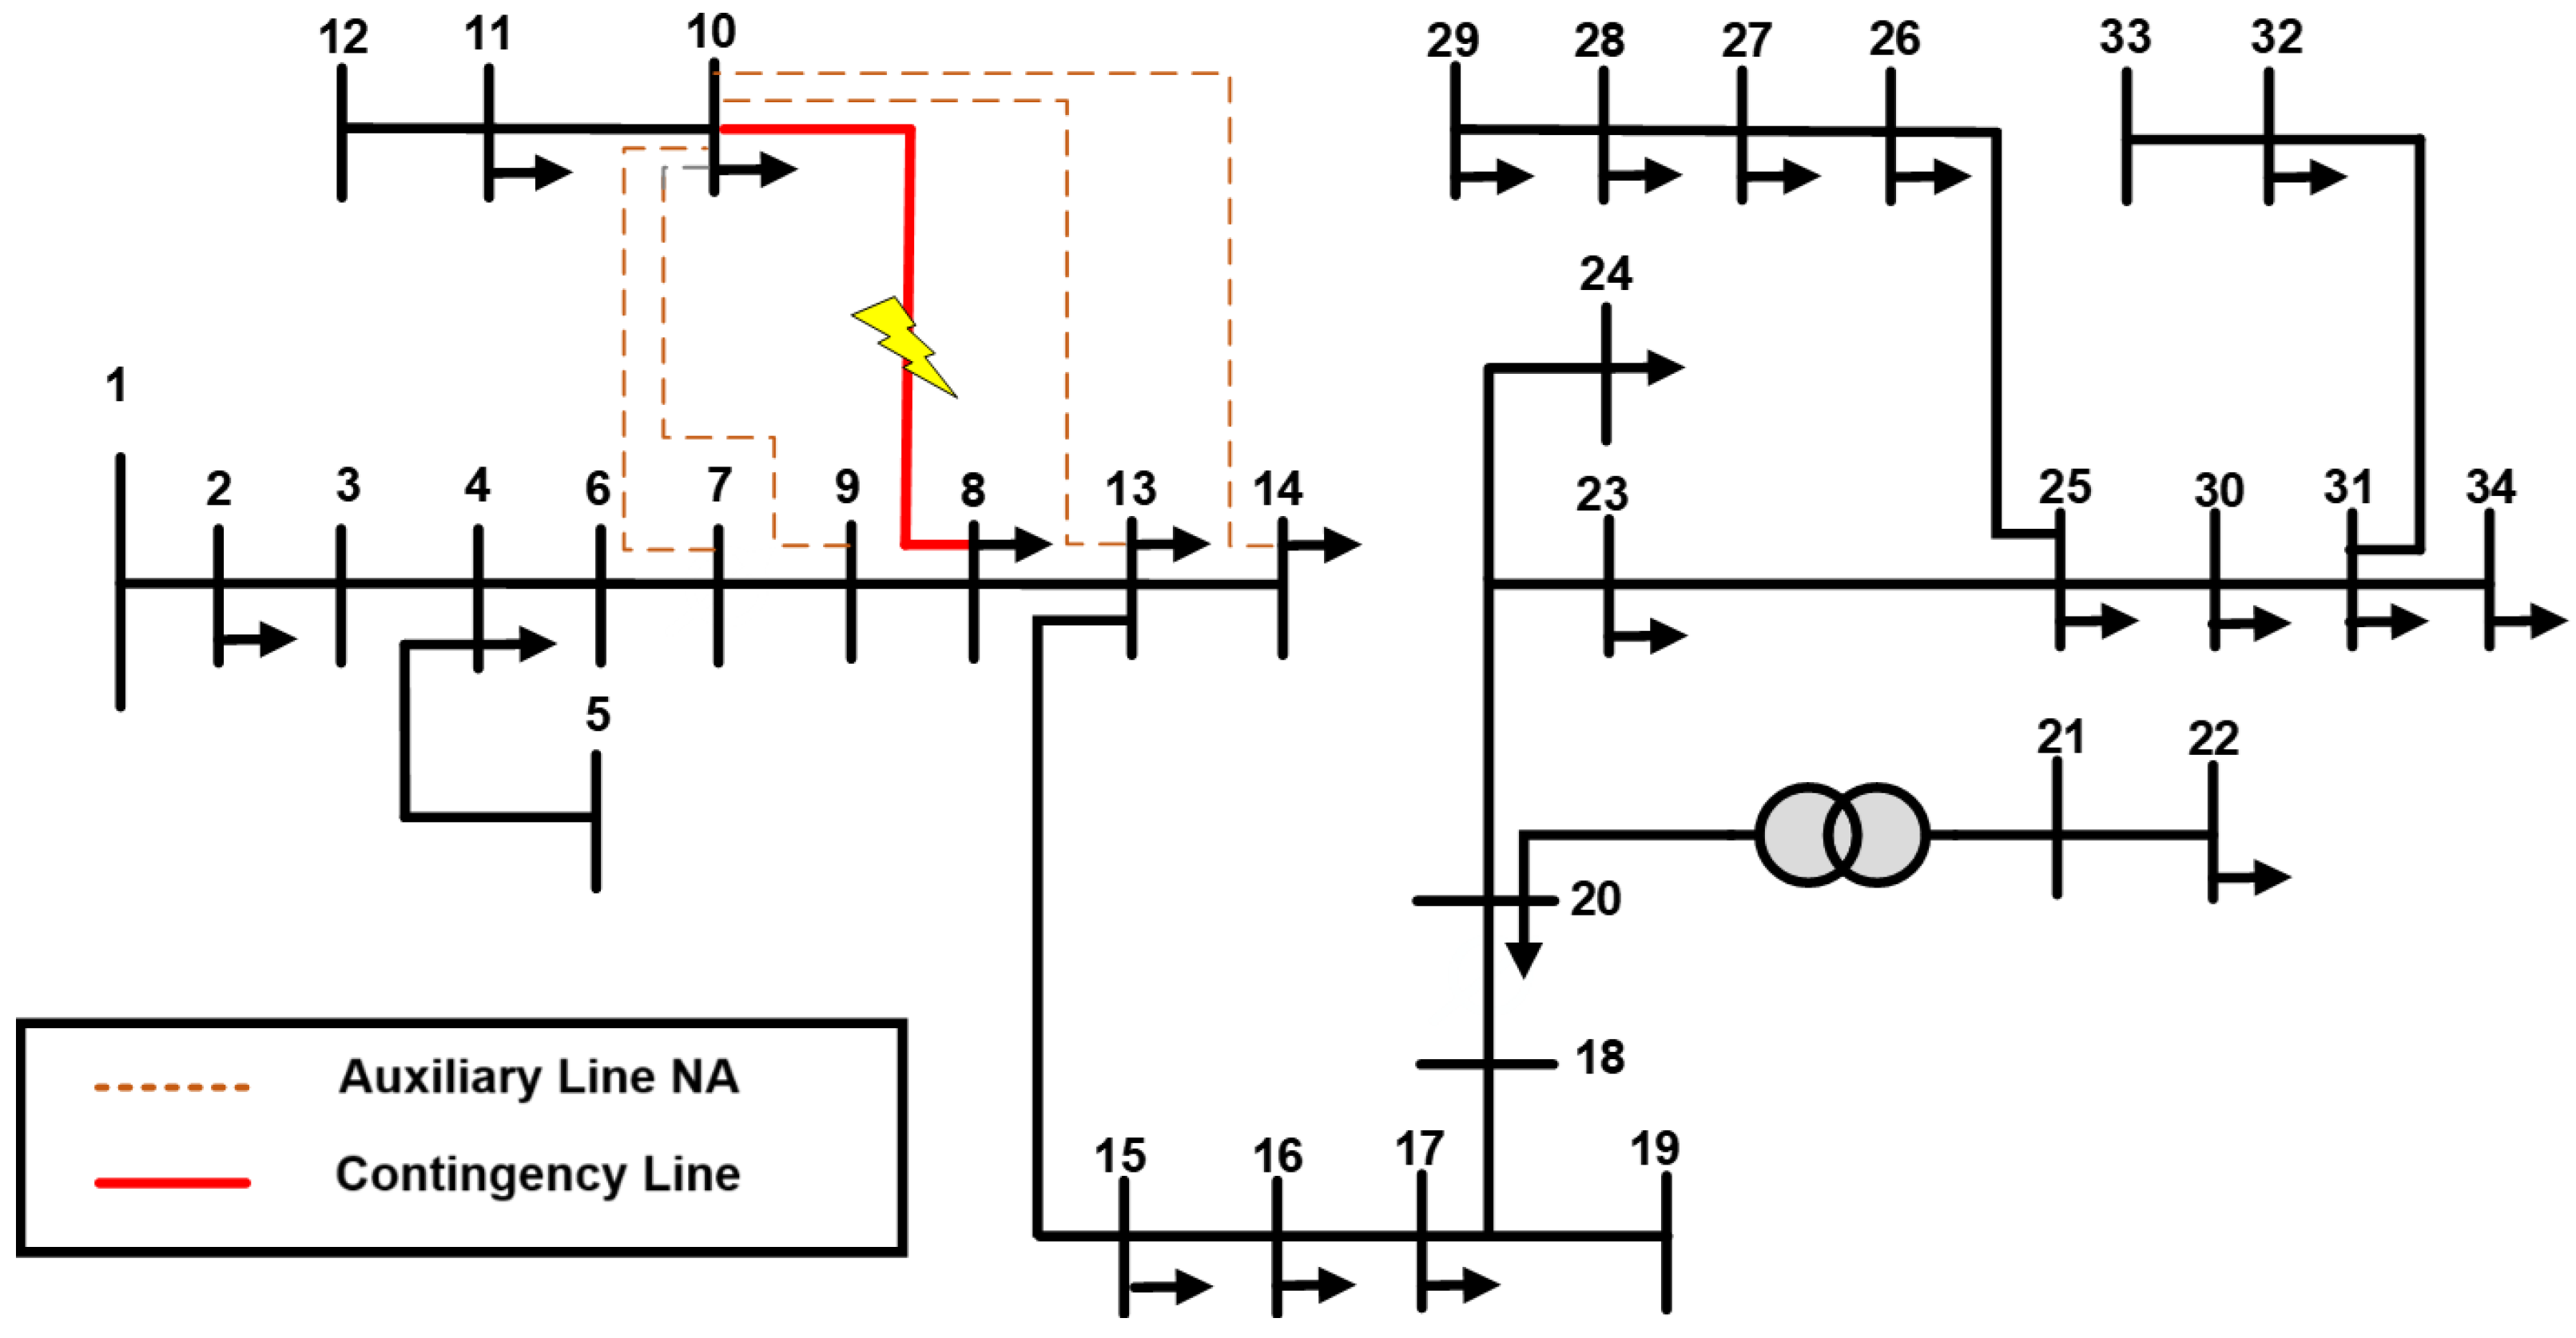
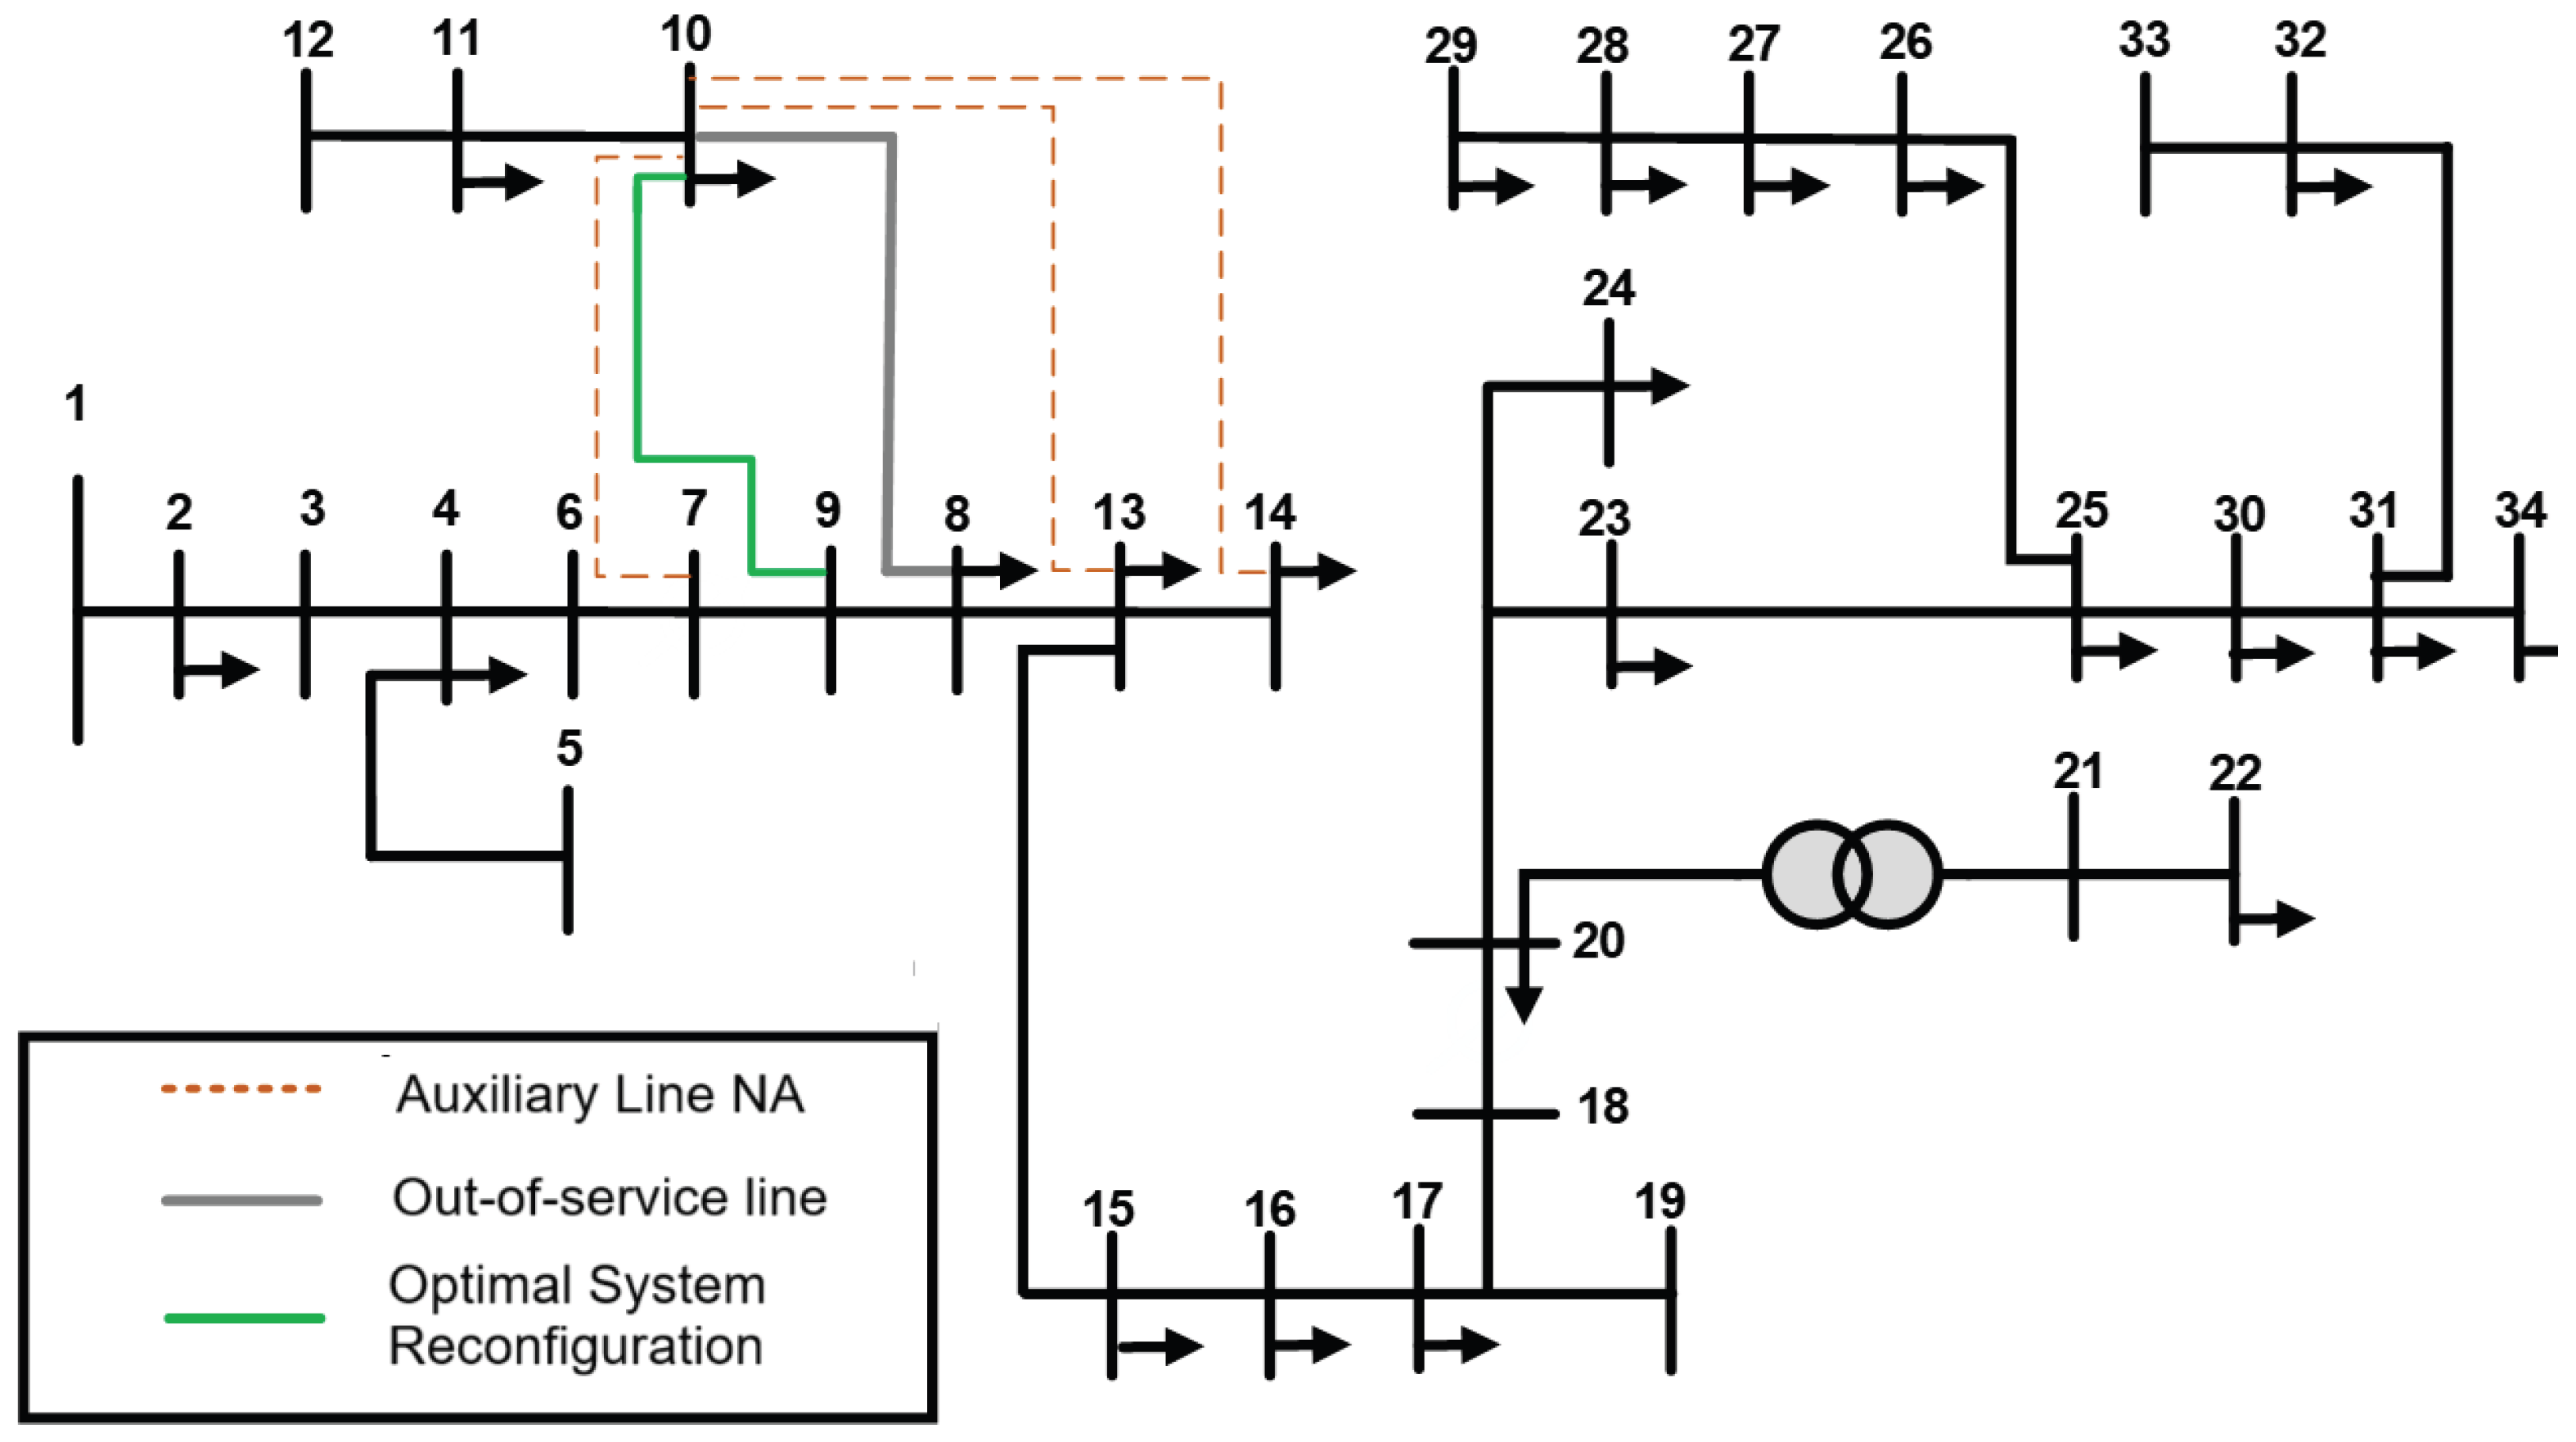
2.3.1. Case 1: Contingency on Line 8–10
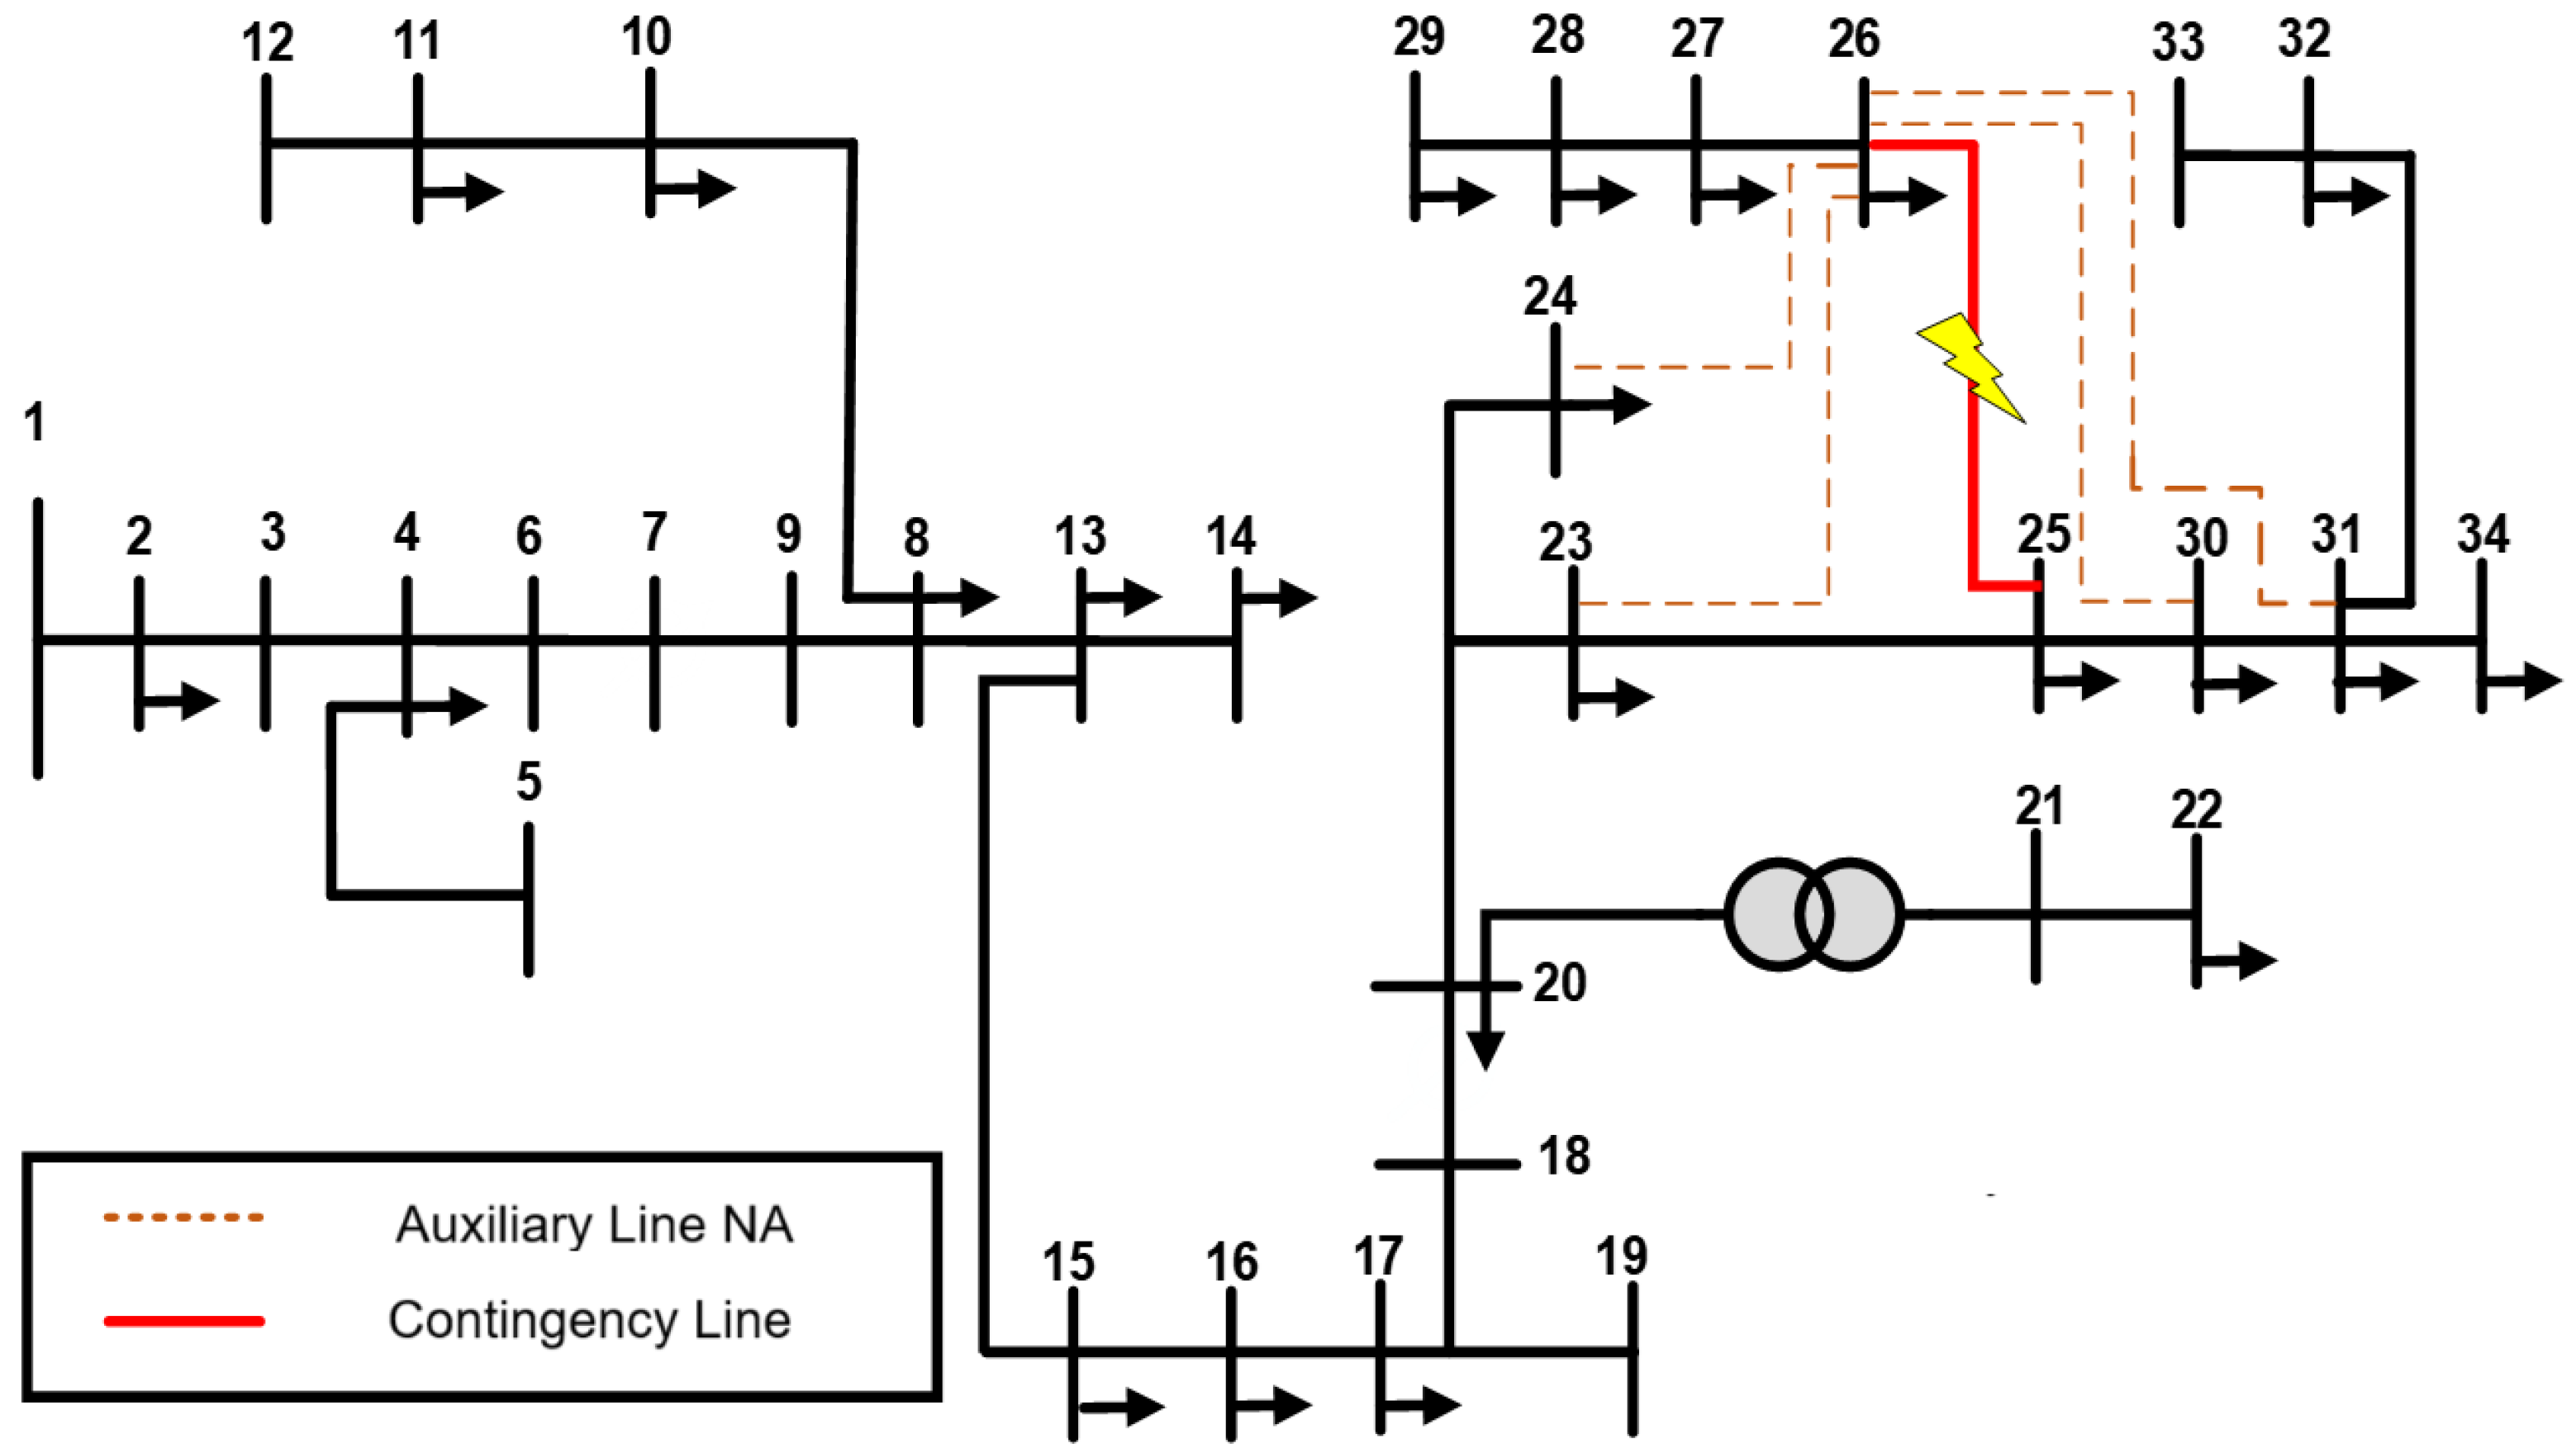
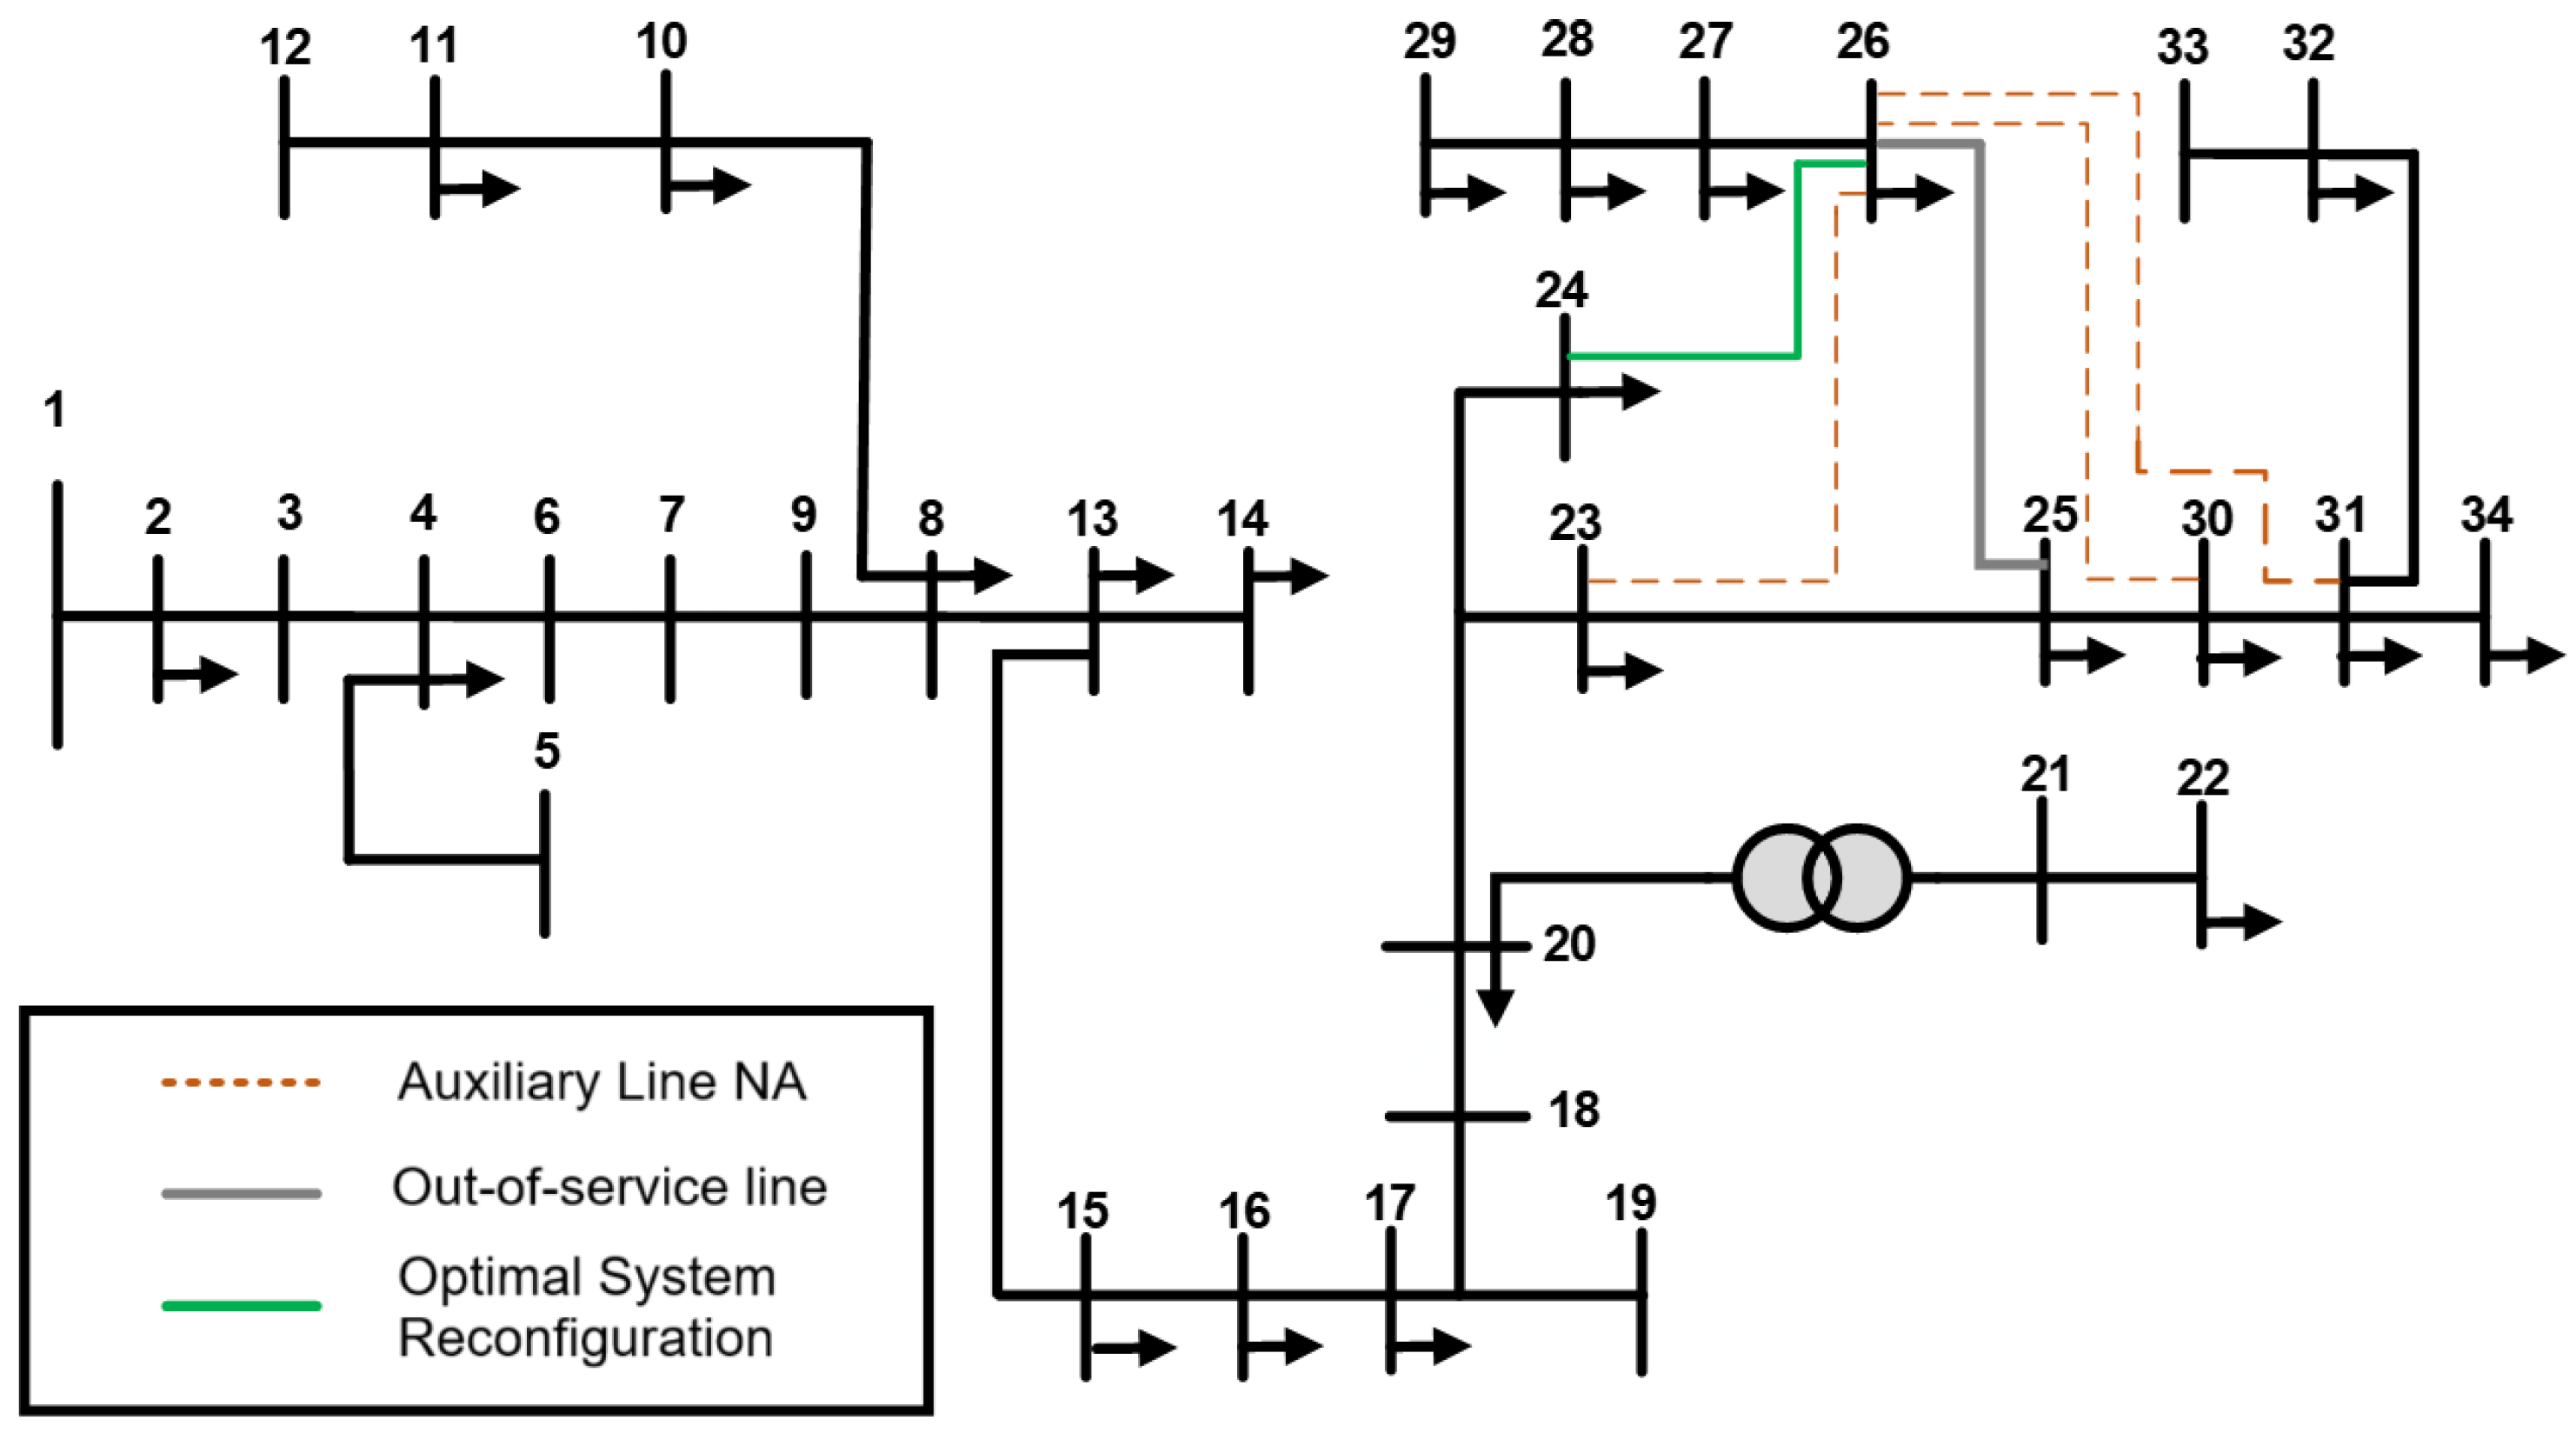
2.3.2. Case 2: Contingency on Line 25–26
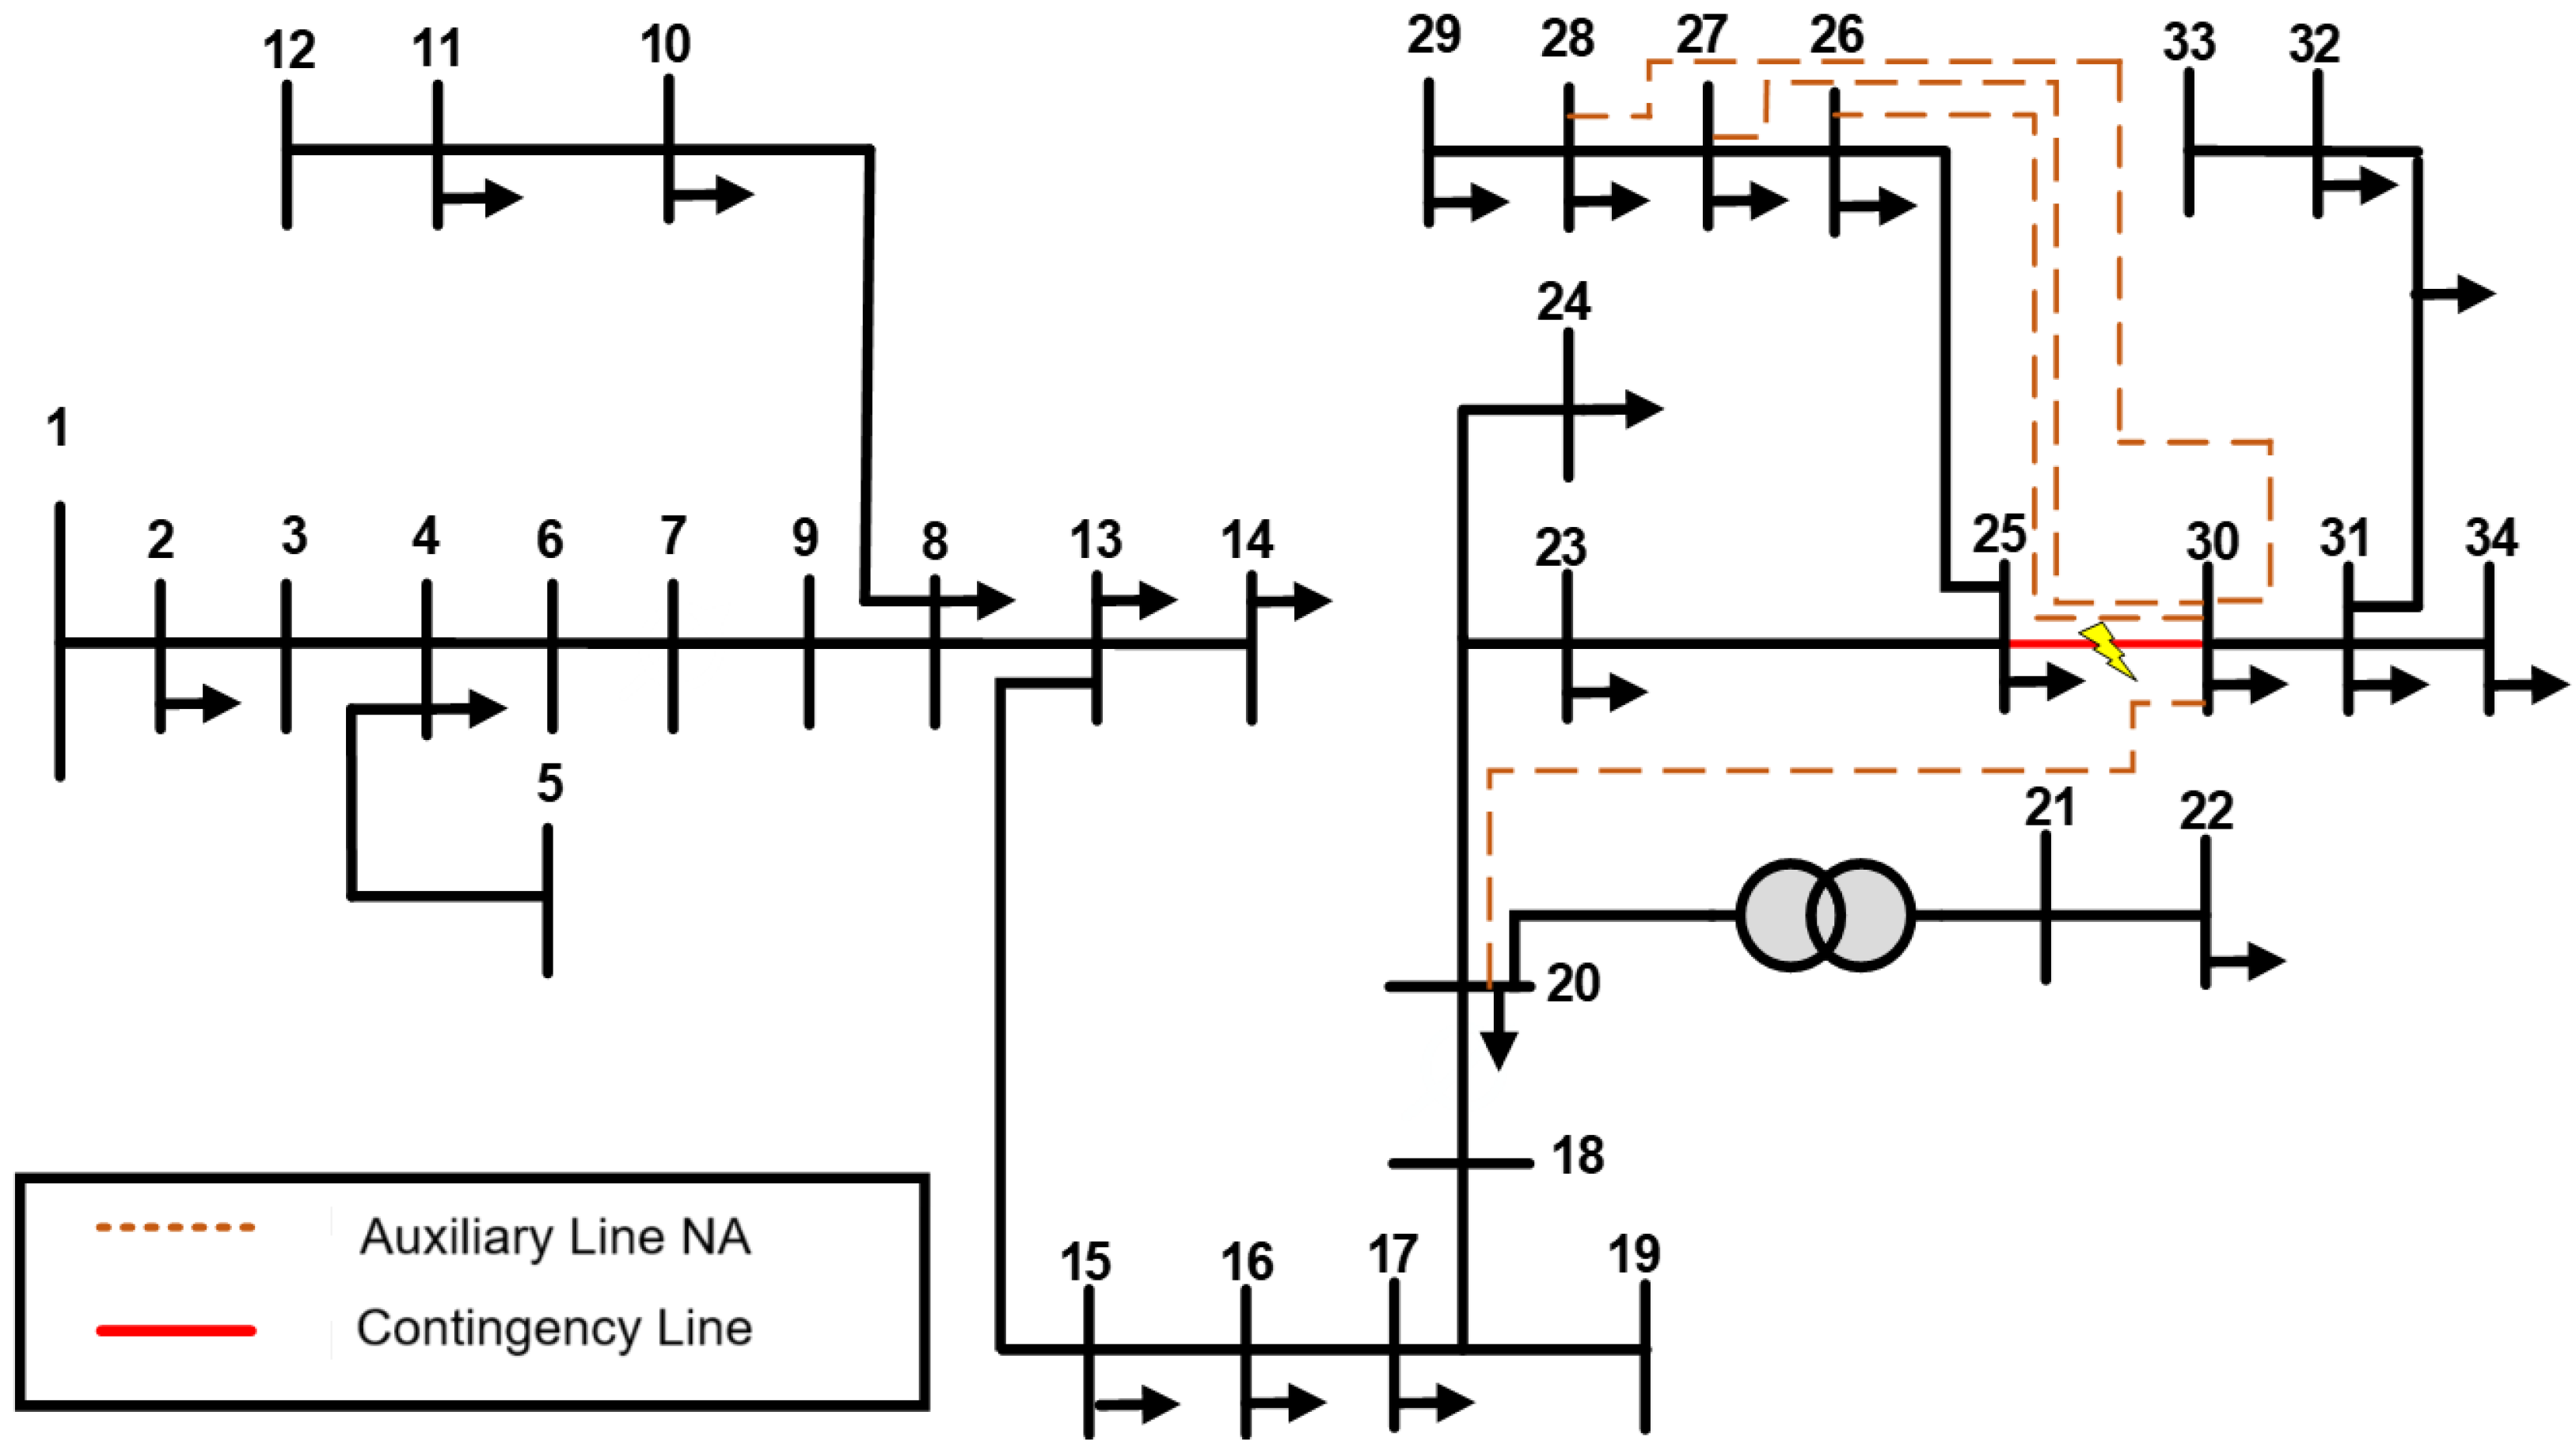
2.3.3. Case 3: Contingency on Line 25–30
2.3.4. Case 4: Contingency on Line 30–31
3. Results
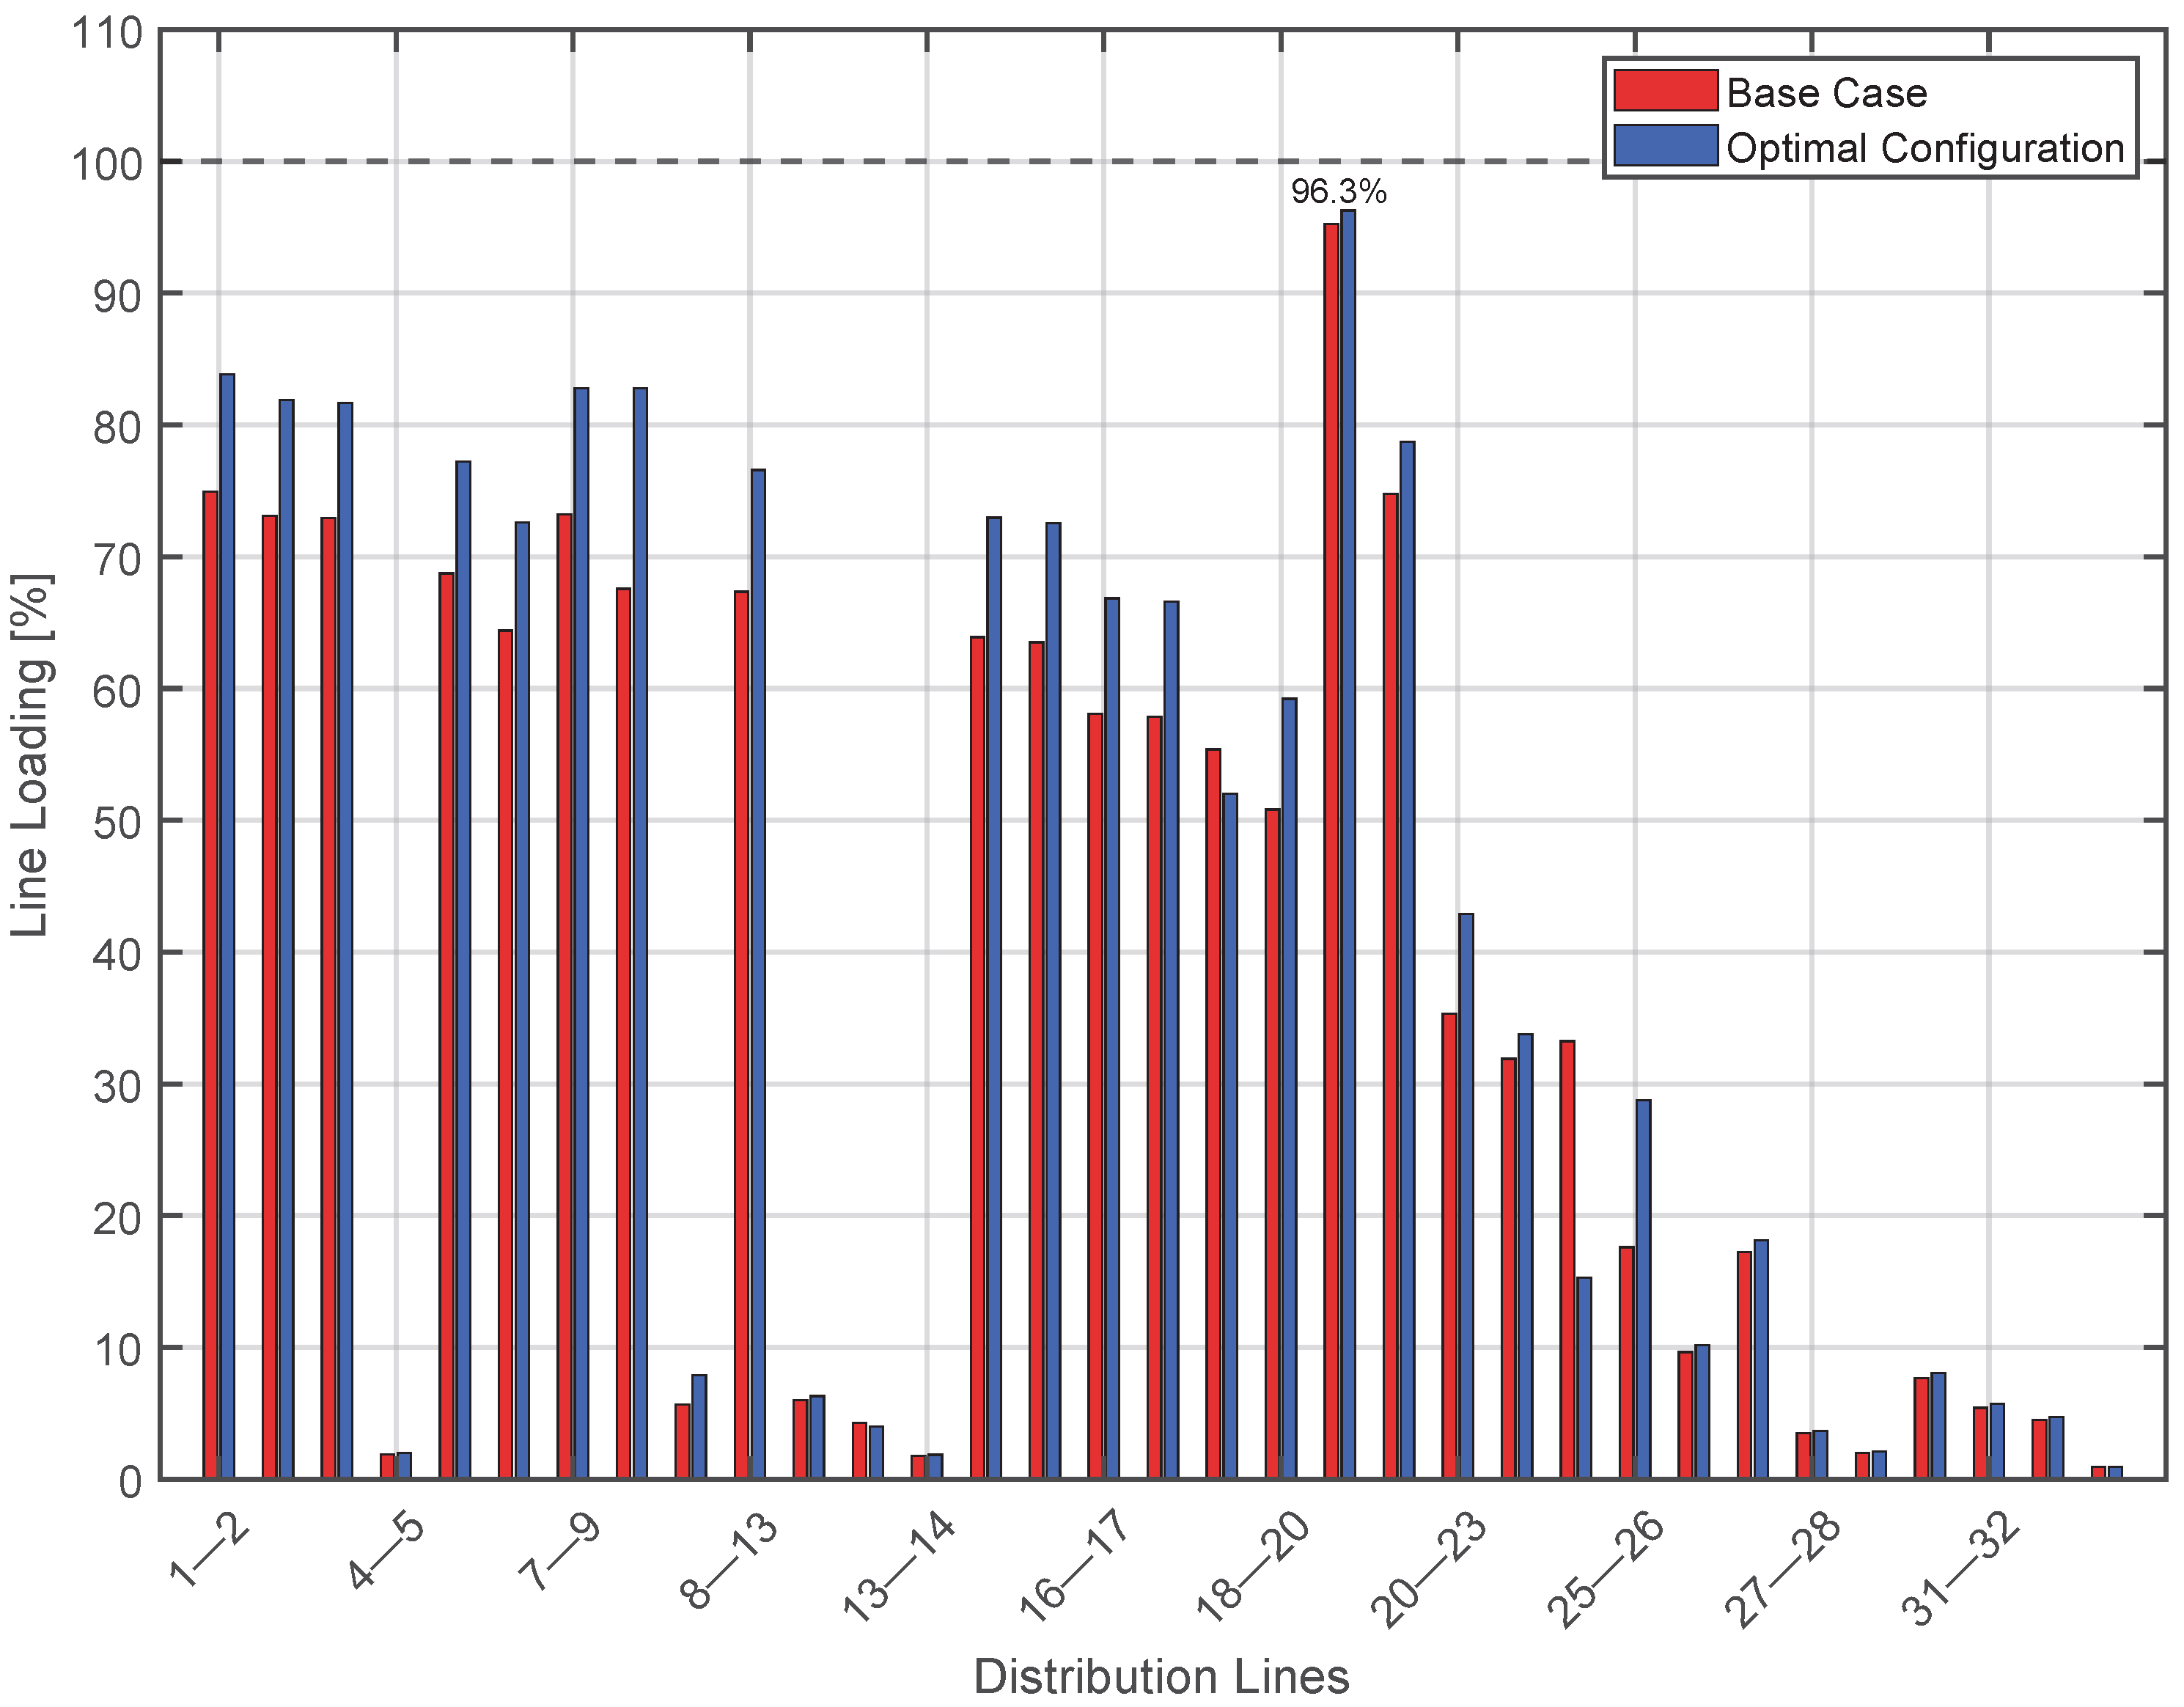
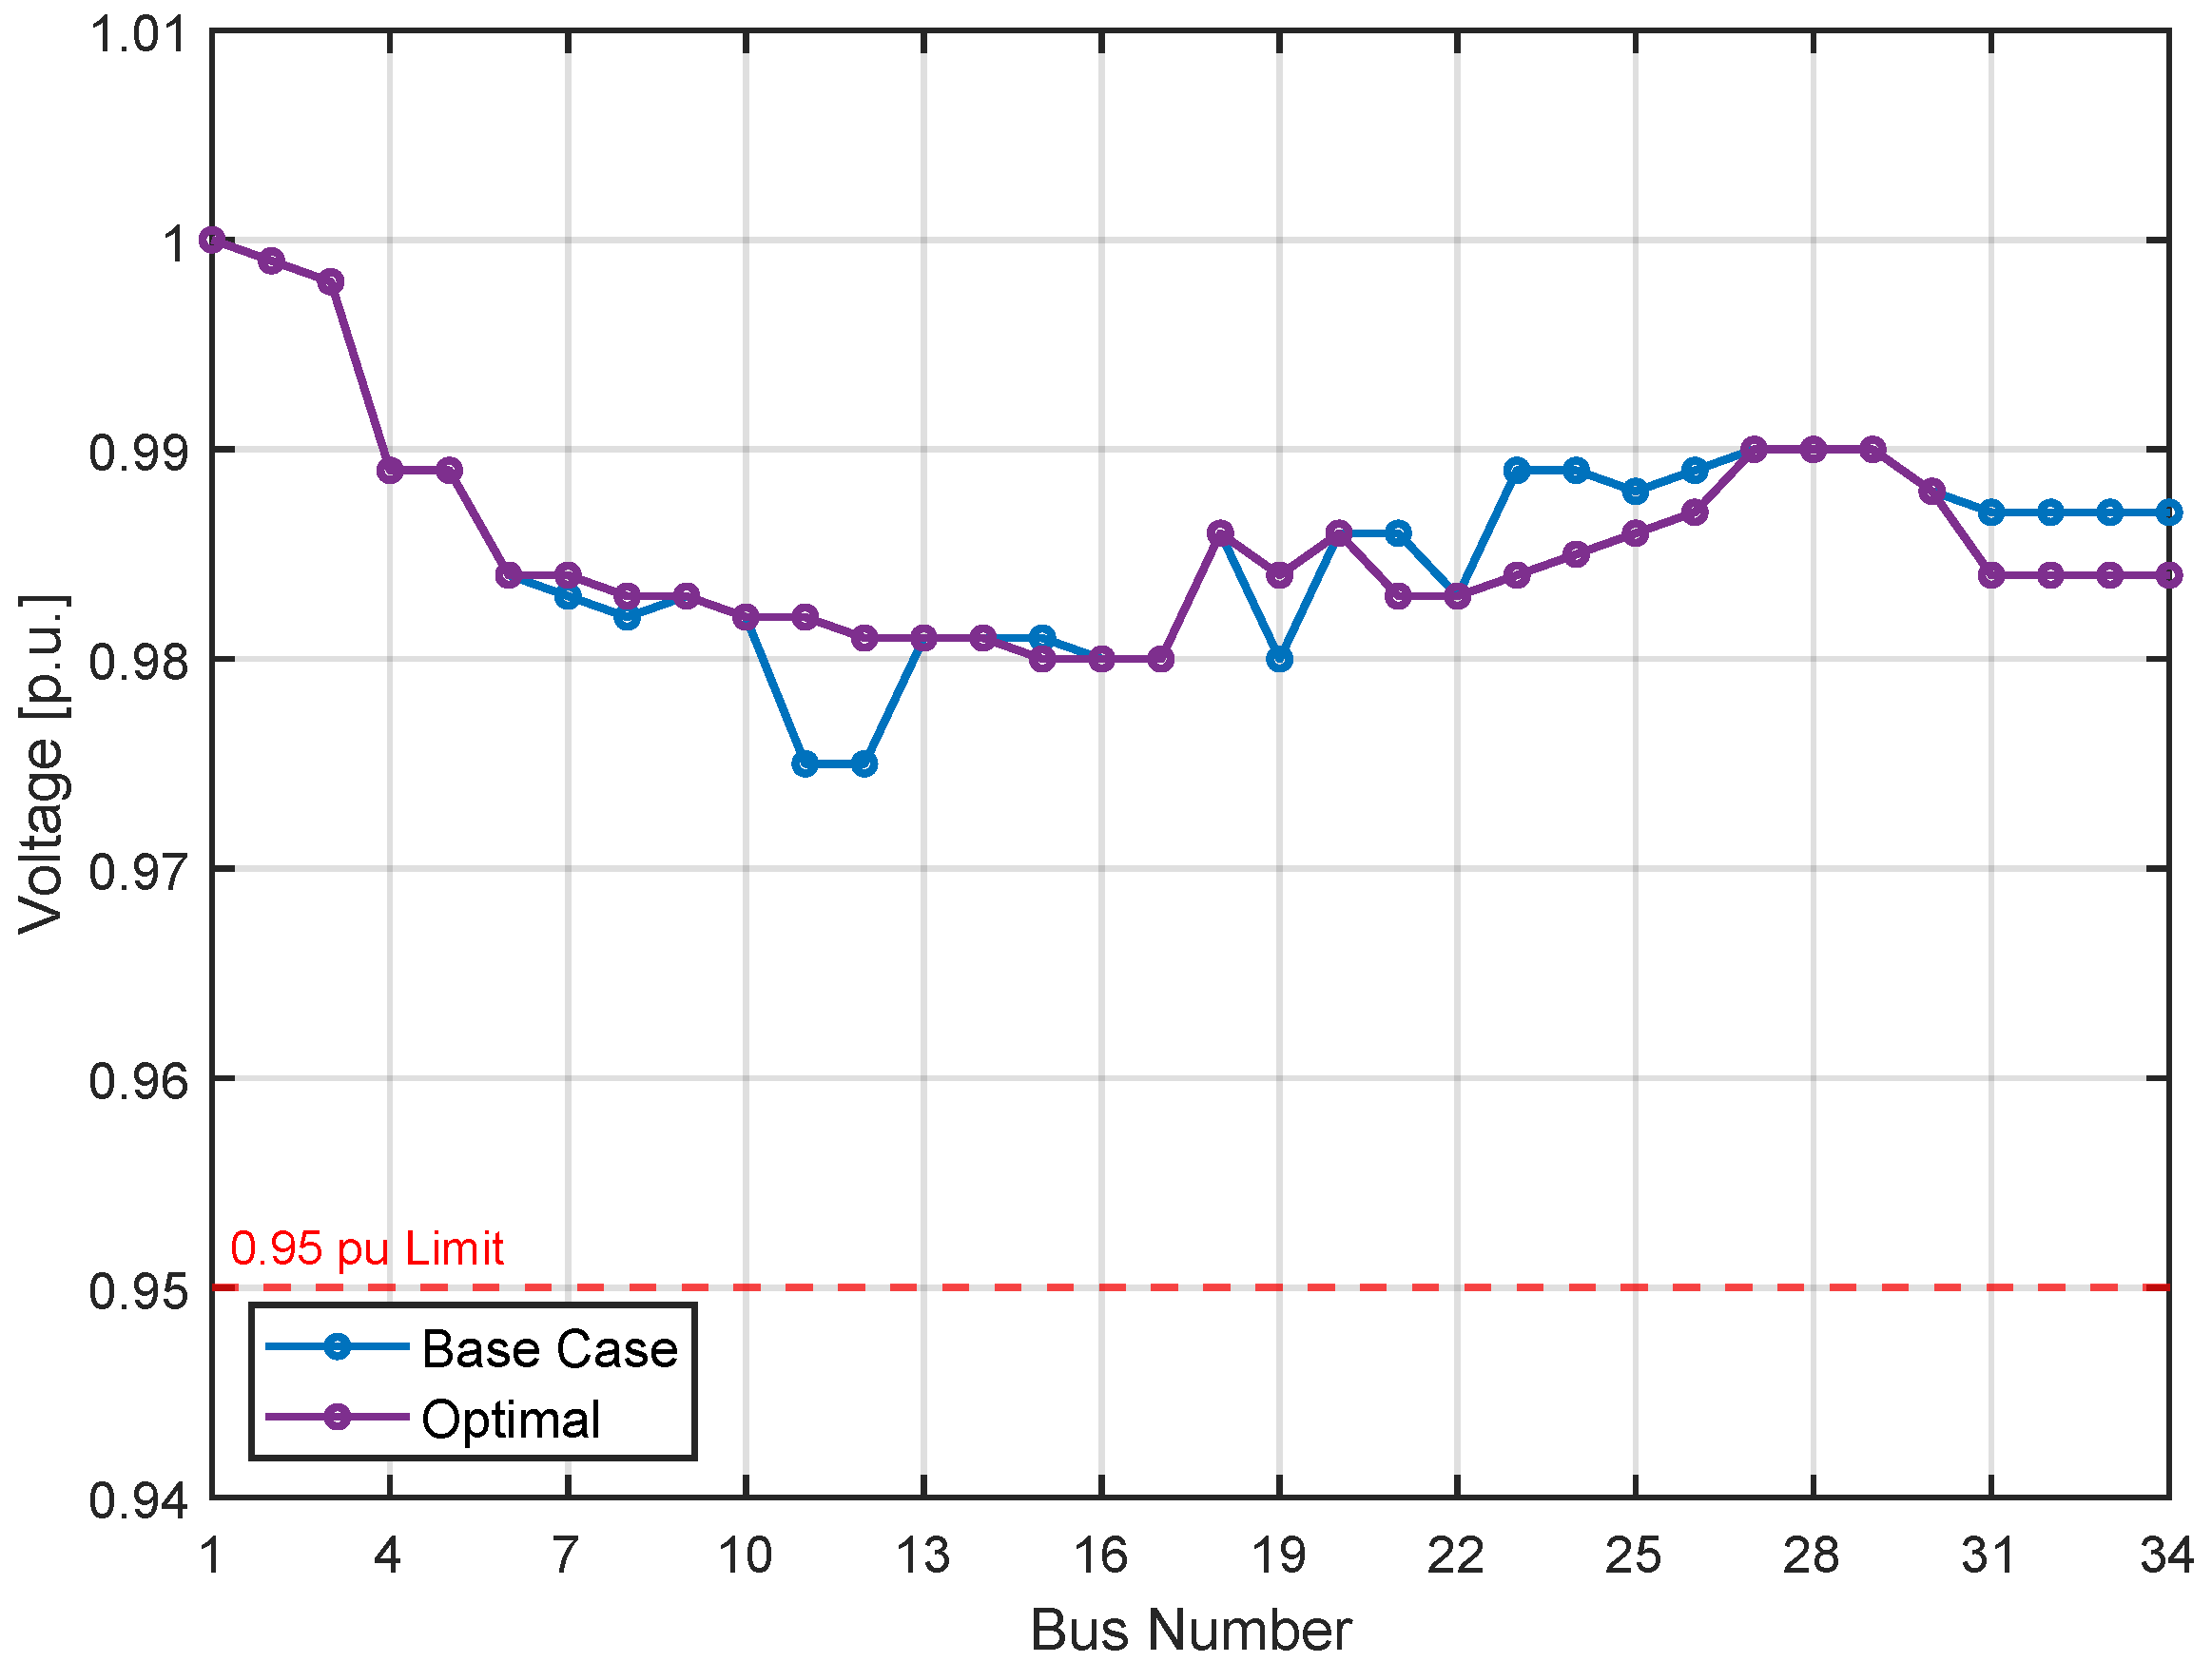
3.1. Case 1: Contingency on Line 8–10
3.2. Case 2: Contingency on Line 25–26
3.3. Case 3: Contingency on Line 25–30
3.4. Case 4: Contingency on Line 30–31
4. Discussion
5. Conclusions
Author Contributions
Funding
Data Availability Statement
Conflicts of Interest
Abbreviations
| BPSO | Binary Particle Swarm Optimization |
| DER | Distributed Energy Resources |
| DS | Distribution System |
| GA | Genetic Algorithm |
| ICOA | Improved Coyote Optimization Algorithms |
| MILP | Mixed-Integer Linear Programming |
| current on branch i–j | |
| maximum conductor current capacity | |
| initial population | |
| load at node k | |
| minimum active power demand | |
| active power demand at a node | |
| power flow on branch i–j for individual i | |
| maximum power flow on a line | |
| maximum reactive power demand | |
| reactive power demand at a node | |
| voltage profile vector of individual i | |
| , | lower and upper voltage limits |
| priority coefficient for node k | |
| line loadability (relative to ) | |
| binary energization variable for node k (1 = energized) | |
| Z | weighted restored load. |
References
- Salau, A.O.; Gebru, Y.W.; Bitew, D. Optimal network reconfiguration for power loss minimization and voltage profile enhancement in distribution systems. Heliyon 2020, 6, e04233. [Google Scholar] [CrossRef] [PubMed]
- Choobdari, M.; Moghaddam, M.S.; Davarzani, R.; Azarfar, A.; Hoseinpour, H. Robust distribution networks reconfiguration considering the improvement of network resilience considering renewable energy resources. Sci. Rep. 2024, 14, 23041. [Google Scholar] [CrossRef] [PubMed]
- Musaruddin, M.; Tambi, T.; Zulkaidah, W.; Masikki, G.A.N.; Lolok, A.; Djohar, A.; Marwan, M. Optimizing network reconfiguration to reduce power loss and improve the voltage profile in the distribution system: A practical case study. e-Prime—Adv. Electr. Eng. Electron. Energy 2024, 8, 100599. [Google Scholar] [CrossRef]
- Jacob, R.A.; Zhang, J. Distribution Network Reconfiguration to Increase Photovoltaic Hosting Capacity. In Proceedings of the 2020 IEEE Power & Energy Society General Meeting (PESGM), Montreal, QC, Canada, 2–6 August 2020; Volume 2020. [Google Scholar] [CrossRef]
- Zhang, K.; Zhu, R.; Song, R.; Shi, F.; Shi, S.; Fang, C. A Mesh Analysis Model and the Coherent Evaluation Index System for Urban Distribution Network Planning. In Proceedings of the 2021 3rd Asia Energy and Electrical Engineering Symposium (AEEES), Chengdu, China, 26–29 March 2021; pp. 443–447. [Google Scholar] [CrossRef]
- Mahdavi, M.; Alhelou, H.H.; Hatziargyriou, N.D.; Jurado, F. Reconfiguration of Electric Power Distribution Systems: Comprehensive Review and Classification. IEEE Access 2021, 9, 118502–118527. [Google Scholar] [CrossRef]
- Liu, J.; Zhang, Q.; Li, J.; Wang, Y. An Iterative Heuristic Method to Determine Radial Topology for Distribution System Restoration. In Proceedings of the 2021 IEEE 4th International Electrical and Energy Conference (CIEEC), Wuhan, China, 28–30 May 2021. [Google Scholar] [CrossRef]
- Iftikhar, M.Z.; Imran, K. Network reconfiguration and integration of distributed energy resources in distribution network by novel optimization techniques. Energy Rep. 2024, 12, 3155–3179. [Google Scholar] [CrossRef]
- Vargas, G.A.D.; Mosquera, D.J.; Trujillo, E.R. Optimization of Topological Reconfiguration in Electric Power Systems Using Genetic Algorithm and Nonlinear Programming with Discontinuous Derivatives. Electronics 2024, 13, 616. [Google Scholar] [CrossRef]
- Clavijo-Blanco, J.; Rosendo-Macías, J. Failure rates in distribution networks: Estimation methodology and application. Electr. Power Syst. Res. 2020, 185, 106398. [Google Scholar] [CrossRef]
- Dehghany, N.; Asghari, R. Multi-objective optimal reconfiguration of distribution networks using a novel meta-heuristic algorithm. Int. J. Electr. Comput. Eng. 2024, 14, 3557–3569. [Google Scholar] [CrossRef]
- Lei, S.; Chen, C.; Song, Y.; Hou, Y. Radiality Constraints for Resilient Reconfiguration of Distribution Systems: Formulation and Application to Microgrid Formation. IEEE Trans. Smart Grid 2020, 11, 3944–3956. [Google Scholar] [CrossRef]
- Bassey, O.; Butler-Purry, K.L.; Chen, B. Dynamic Modeling of Sequential Service Restoration in Islanded Single Master Microgrids. IEEE Trans. Power Syst. 2020, 35, 202–214. [Google Scholar] [CrossRef]
- Guimarães, I.G.; Bernardon, D.P.; Garcia, V.J.; Schmitz, M.; Pfitscher, L.L. A decomposition heuristic algorithm for dynamic reconfiguration after contingency situations in distribution systems considering island operations. Electr. Power Syst. Res. 2021, 192, 106969. [Google Scholar] [CrossRef]
- Jayabarathi, T.; Raghunathan, T.; Mithulananthan, N.; Cherukuri, S.; Loknath Sai, G. Enhancement of distribution system performance with reconfiguration, distributed generation and capacitor bank deployment. Heliyon 2024, 10, e26343. [Google Scholar] [CrossRef] [PubMed]
- Olabode, O.E.; Akinyele, D.O.; Ajewole, T.O.; Omogoye, S.O.; Raji, A.A. Impact of integrating type-1 distributed generation on distribution network using modified genetic algorithm and voltage stability index: A technical and cost–benefit analysis approach. J. Eng. Appl. Sci. 2024, 71, 222. [Google Scholar] [CrossRef]
- Dukovska, I.; Morren, J.; Slootweg, H.J.G. Switching Sequence Optimization for Service Restoration in Distribution Networks. In Proceedings of the 2020 IEEE PES Innovative Smart Grid Technologies Europe (ISGT-Europe), The Hague, The Netherlands, 26–28 October 2020; Volume 2020, pp. 6–10. [Google Scholar] [CrossRef]
- Arun, M.; Samal, S.; Barik, D.; Chandran, S.S.; Tudu, K.; Praveenkumar, S. Integration of energy storage systems and grid modernization for reliable urban power management toward future energy sustainability. J. Energy Storage 2025, 114, 115830. [Google Scholar] [CrossRef]
- Mariño, W.; Muñoz, J.; Jaramillo, M.; Barrera-Singaña, C.; Pavón, W. Distribution System Reconfiguration for Voltage Profile Improvement Using Enhanced Particle Swarm Optimization. In Proceedings of the 2023 IEEE IAS Global Conference on Renewable Energy and Hydrogen Technologies (GlobConHT), Male, Maldives, 11–12 March 2023; pp. 1–6. [Google Scholar] [CrossRef]
- Di, H.; Bao, Y.; Wang, B. Research on Distribution Network Reconfiguration Based on Deep Q-Learning Network. In Proceedings of the 2020 IEEE 4th Conference on Energy Internet and Energy System Integration (EI2), Wuhan, China, 30 October–1 November 2020; pp. 2728–2732. [Google Scholar] [CrossRef]
- Jakus, D.; Čađenović, R.; Vasilj, J.; Sarajčev, P. Optimal Reconfiguration of Distribution Networks Using Hybrid Heuristic-Genetic Algorithm. Energy 2024, 13, 1544. [Google Scholar] [CrossRef]
- Xia, N.; Deng, J.; Zheng, T.; Zhang, H.; Wang, J.; Peng, S.; Cheng, L. Fuzzy Logic Based Network Reconfiguration Strategy During Power System Restoration. IEEE Syst. J. 2021, 16, 4735–4743. [Google Scholar] [CrossRef]
- Adewuyi, O.B.; Krishnamurthy, S. Performance Analysis for Predictive Voltage Stability Monitoring Using Enhanced Adaptive Neuro-Fuzzy Expert System. Mathematics 2024, 12, 3008. [Google Scholar] [CrossRef]
- Gautam, M.; Bhusal, N.; Benidris, M. Deep Q-Learning-based Distribution Network Reconfiguration for Reliability Improvement. In Proceedings of the 2022 IEEE/PES Transmission and Distribution Conference and Exposition (T&D), New Orleans, LA, USA, 25–28 April 2022; pp. 1–5. [Google Scholar] [CrossRef]
- Nakiganda, A.M.; Cheylan, C.; Chatzivasileiadis, S. Topology-Aware Neural Networks for Fast Contingency Analysis of Power Systems. arXiv 2023, arXiv:2310.04213. [Google Scholar] [CrossRef]
- Pratap, A.; Tiwari, P.; Maurya, R.; Maurya, P. Adaptive genetic-enhanced mountain gazelle optimization for integrated network reconfiguration, distributed generation, and capacitor bank planning in large-scale radial distribution systems. Electr. Eng. 2024. [Google Scholar] [CrossRef]
- Ntombela, M.; Musasa, K.; Leoaneka, M.C. Power Loss Minimization and Voltage Profile Improvement by System Reconfiguration, DG Sizing, and Placement. Computation 2022, 10, 180. [Google Scholar] [CrossRef]
- Ma, L.; Si, C.; Wang, K.; Luo, J.; Jiang, S.; Song, Y. Deep Reinforcement Learning-Based Distribution Network Planning Method Considering Renewable Energy. Energies 2025, 18, 1254. [Google Scholar] [CrossRef]
- Vukobratović, M.; Marić, P.; Horvat, G.; Balkić, Z.; Sučić, S. A Survey on Computational Intelligence Applications in Distribution Network Optimization. Electronics 2021, 10, 1247. [Google Scholar] [CrossRef]
- Nassef, A.M.; Abdelkareem, M.A.; Maghrabie, H.M.; Baroutaji, A. Review of Metaheuristic Optimization Algorithms for Power Systems Problems. Sustainability 2023, 15, 9434. [Google Scholar] [CrossRef]
- Masache, P.; Carrión, D.; Cárdenas, J. Optimal Transmission Line Switching to Improve the Reliability of the Power System Considering AC Power Flows. Energies 2021, 14, 3281. [Google Scholar] [CrossRef]
- Kerckhove, S.; D’hulst, R.; Van Hertem, D. Reconfiguration Method for Low Voltage Distribution Networks. In Proceedings of the 2023 IEEE PES Innovative Smart Grid Technologies Europe (ISGT EUROPE), Grenoble, France, 23–26 October 2023. [Google Scholar] [CrossRef]
- Nguyen, T.T.; Nguyen, Q.T.; Nguyen, T.T. Optimal radial topology of electric unbalanced and balanced distribution system using improved coyote optimization algorithm for power loss reduction. Neural Comput. Appl. 2021, 33, 12209–12236. [Google Scholar] [CrossRef]
- Jangdoost, A.; Keypour, R.; Golmohamadi, H. Optimization of distribution network reconfiguration by a novel RCA integrated with genetic algorithm. Energy Syst. 2021, 12, 801–833. [Google Scholar] [CrossRef]
- Gallego Pareja, L.A.; López-Lezama, J.M.; Gómez Carmona, O. Optimal Integration of Distribution Network Reconfiguration and Conductor Selection in Power Distribution Systems via MILP. Energies 2023, 16, 6998. [Google Scholar] [CrossRef]
- Hakim, M.N.; Fayumi, F.A.H.; Prakasa, M.A.; Putra, D.F.U.; Robandi, I.; Sidqi, F.Q.; Sirait, E.J.S. Optimal Reconfiguration of Distribution Network With Photovoltaic Using Binary Particle Swarm Optimization Considering Voltage Stability Index. In Proceedings of the International Seminar on Intelligent Technology and its Applications (ISITIA), Mataram, Indosesia, 10–12 July 2024; pp. 53–58. [Google Scholar] [CrossRef]


| Method | Description |
|---|---|
| Heuristic methods | Provide near-optimal solutions, prioritizing reduced computation times [4,19,21]. |
| Fuzzy logic | Combined with heuristics; starts from a meshed network and reconfigures it to achieve lower losses than the initial system [22,23]. |
| Neural networks | Use weight factors between neurons to evaluate and select reconfiguration solutions [24,25]. |
| Genetic algorithms (GA) | Adaptive methods based on evolutionary processes; each individual represents a potentially optimal solution [4,21,24,26,27]. |
| Author | Year | Methodology | Test System | Reconnection/Losses | Voltage Profile Improvement |
|---|---|---|---|---|---|
| Kerckhove et al. [32] | 2023 | Genetic Algorithm with subnetwork decomposition and radiality-preserving operators | LV grid (3836-bus), IEEE 33-bus, IEEE 83-bus | 19.5–31.1% loss reduction | 0.943–0.952 p.u. (LV), 0.938 (33-bus), 0.953 (83-bus) |
| Nguyen et al. [33] | 2021 | Improved Coyote Optimization Algorithm (ICOA) for unbalanced and balanced systems with backward/forward sweep power flow | 25-node (unbalanced), 33-node, 69-node (balanced) | 11–56.2% loss reduction | 0.9206–0.9337 (25-node); 0.9111–0.9396 (33-node); 0.9092–0.9495 (69-node) |
| Jangdoost et al. [34] | 2020 | Improved Genetic Algorithm with Radial Checking Algorithm (RCA) considering power loss, ENS, and switching cost with RDG and PHEV scenarios | IEEE 33-bus with RDG and PHEVs | Up to 60% reduction in total operation cost | All bus voltages maintained within [0.95, 1.05] p.u. |
| Gallego Pareja et al. [35] | 2023 | MILP integrating reconfiguration and conductor sizing | IEEE 33-, 69-, 83-bus systems | 50.9–85.23% loss reduction | 0.9128–0.9689 (33-bus); 0.8919–0.9725 (69-bus) |
| Hakim et al. [36] | 2024 | BPSO with VSI and stochastic PV/load modeling | Modified IEEE 69-bus with 8 PVs and 2× load | 74.015% (active), 25.93% (reactive) losses reduction | 0.801–0.925 (min); 0.880–0.954 (avg) |
| Present Work | 2025 | GA-based load restoration under contingencies with voltage and loadability constraints | IEEE 34-bus, 4 contingency scenarios | 97–99% load reconnection | All bus voltages maintained in [0.95, 1.05] p.u. |
Disclaimer/Publisher’s Note: The statements, opinions and data contained in all publications are solely those of the individual author(s) and contributor(s) and not of MDPI and/or the editor(s). MDPI and/or the editor(s) disclaim responsibility for any injury to people or property resulting from any ideas, methods, instructions or products referred to in the content. |
© 2025 by the authors. Licensee MDPI, Basel, Switzerland. This article is an open access article distributed under the terms and conditions of the Creative Commons Attribution (CC BY) license (https://creativecommons.org/licenses/by/4.0/).
Share and Cite
Muñoz, J.; Tipán, L.; Cuji, C.; Jaramillo, M. Resilient Distribution System Reconfiguration Based on Genetic Algorithms Considering Load Margin and Contingencies. Energies 2025, 18, 2889. https://doi.org/10.3390/en18112889
Muñoz J, Tipán L, Cuji C, Jaramillo M. Resilient Distribution System Reconfiguration Based on Genetic Algorithms Considering Load Margin and Contingencies. Energies. 2025; 18(11):2889. https://doi.org/10.3390/en18112889
Chicago/Turabian StyleMuñoz, Jorge, Luis Tipán, Cristian Cuji, and Manuel Jaramillo. 2025. "Resilient Distribution System Reconfiguration Based on Genetic Algorithms Considering Load Margin and Contingencies" Energies 18, no. 11: 2889. https://doi.org/10.3390/en18112889
APA StyleMuñoz, J., Tipán, L., Cuji, C., & Jaramillo, M. (2025). Resilient Distribution System Reconfiguration Based on Genetic Algorithms Considering Load Margin and Contingencies. Energies, 18(11), 2889. https://doi.org/10.3390/en18112889