


Corona-Generated Space Charge Characteristic in an Indoor HVDC Corona Cage Under Atmospheric Temperature Conditions
Abstract
1. Introduction
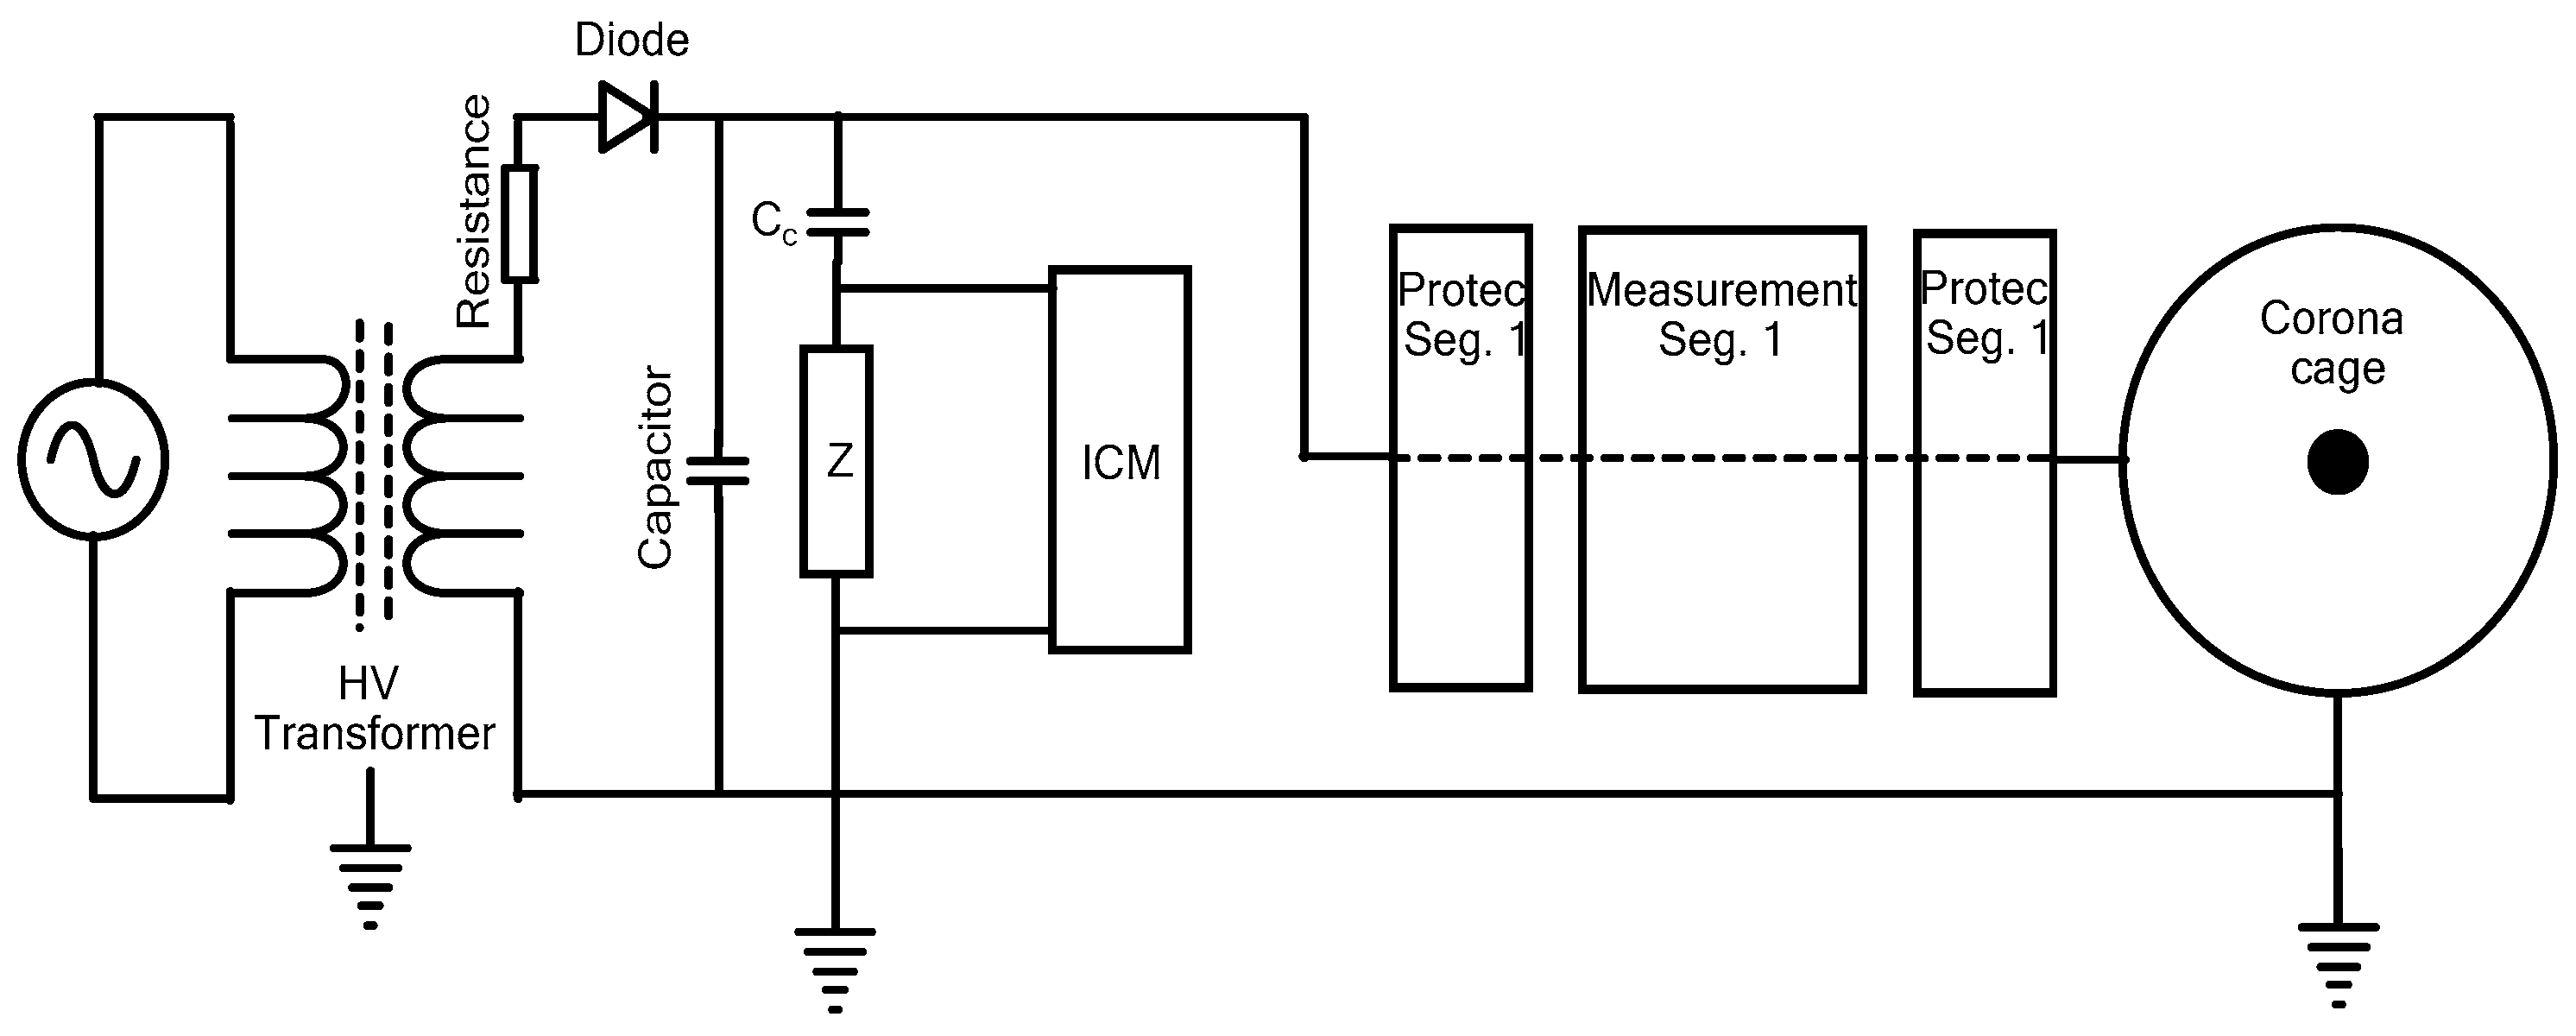
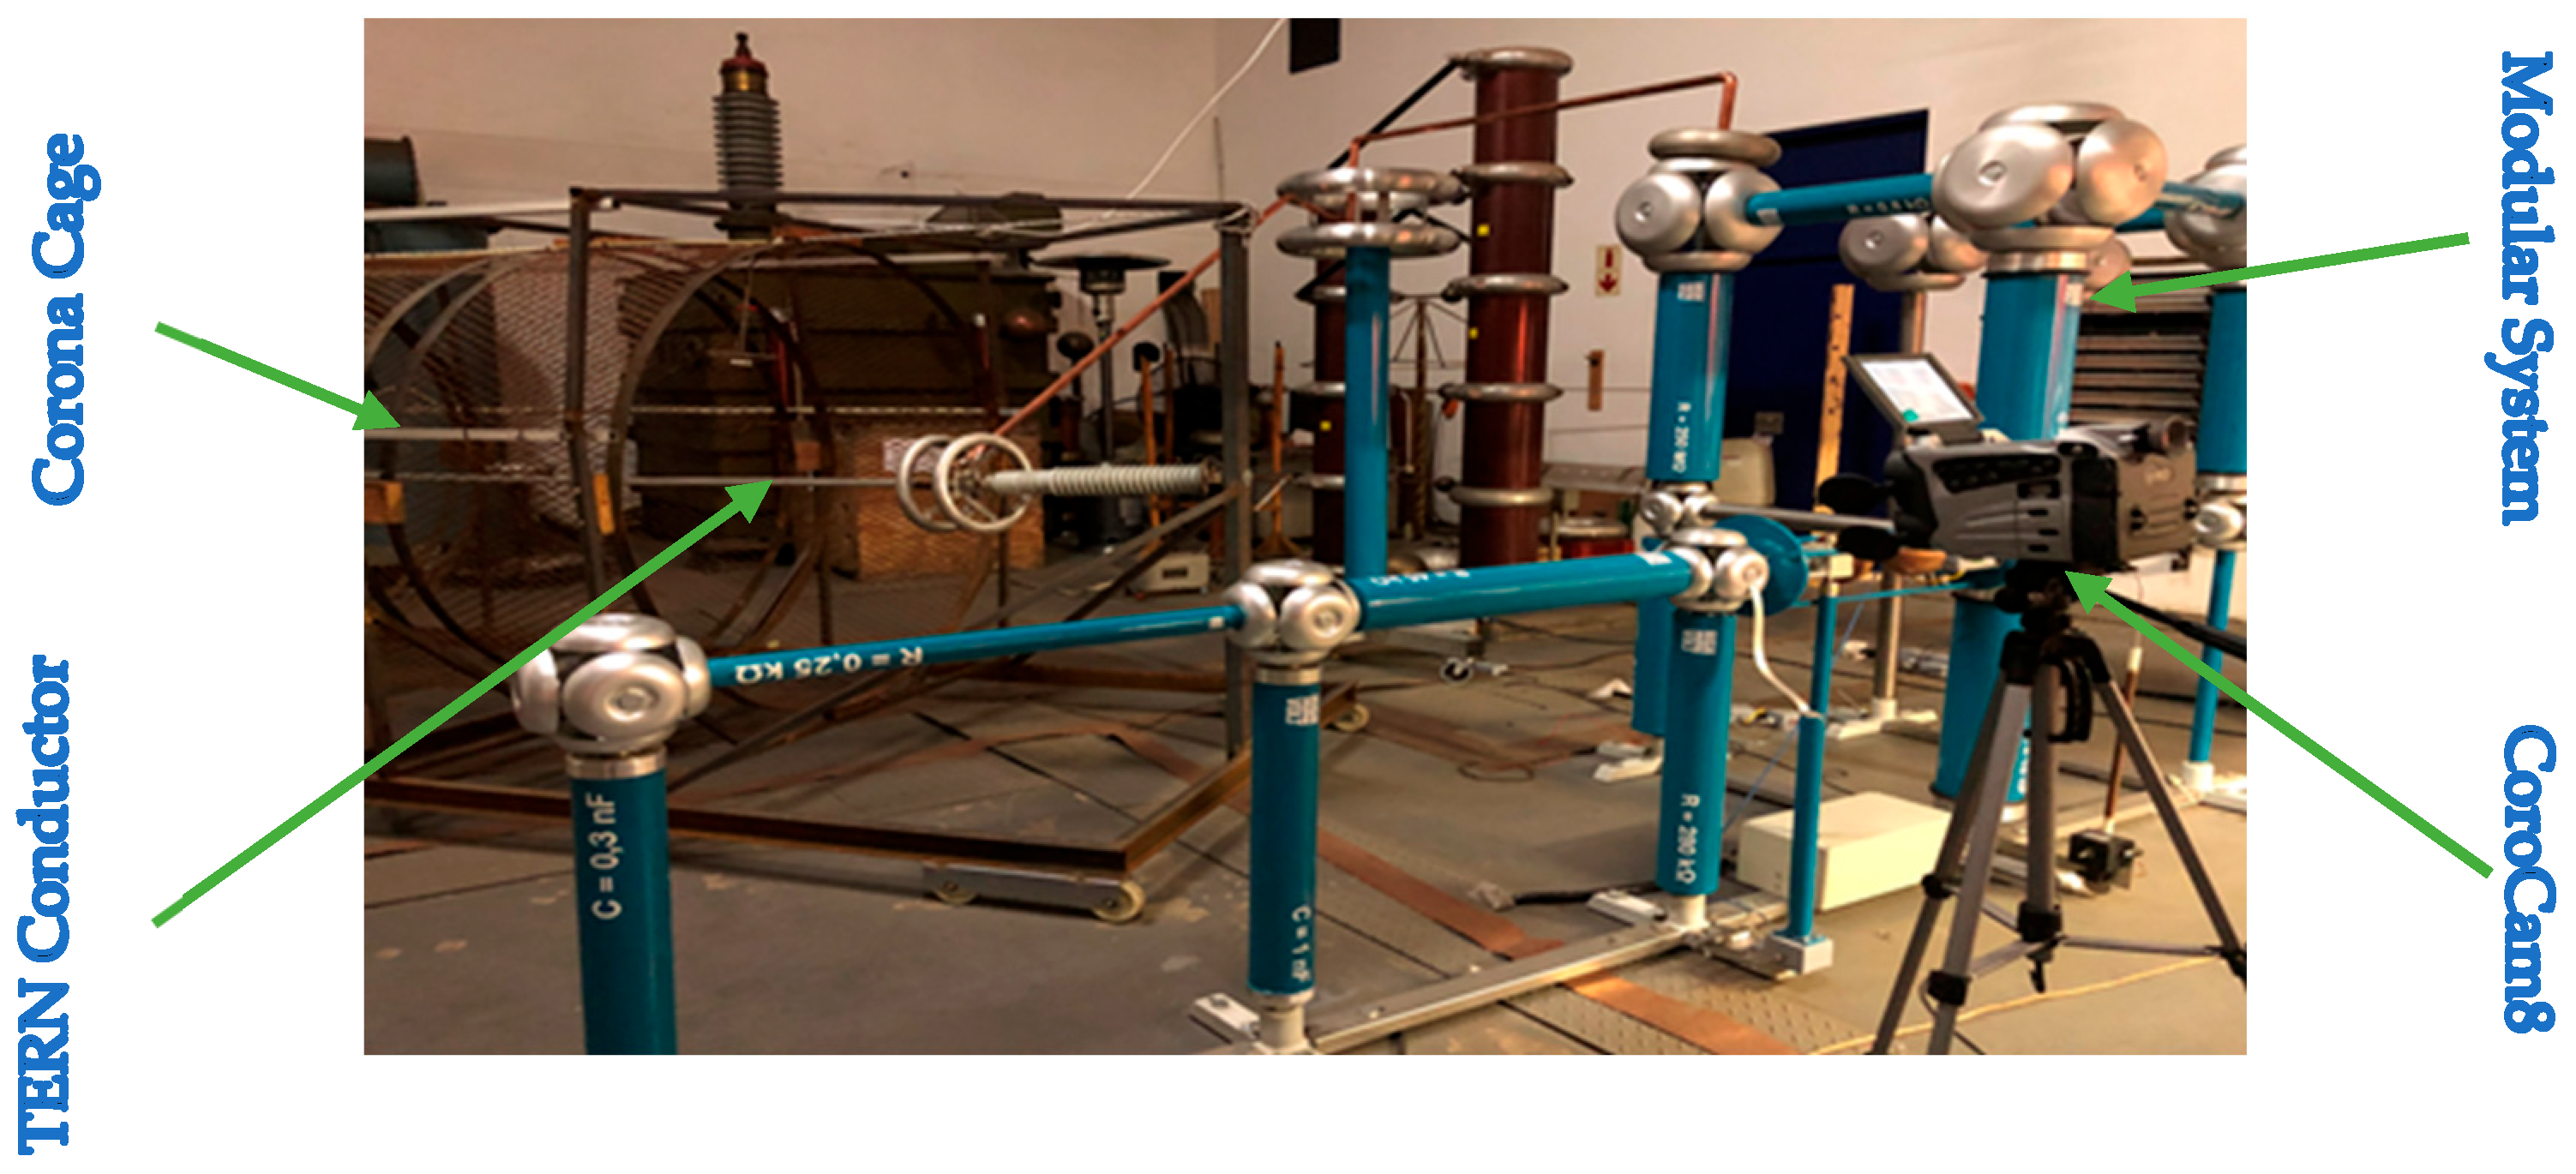
2. Experimental Setup
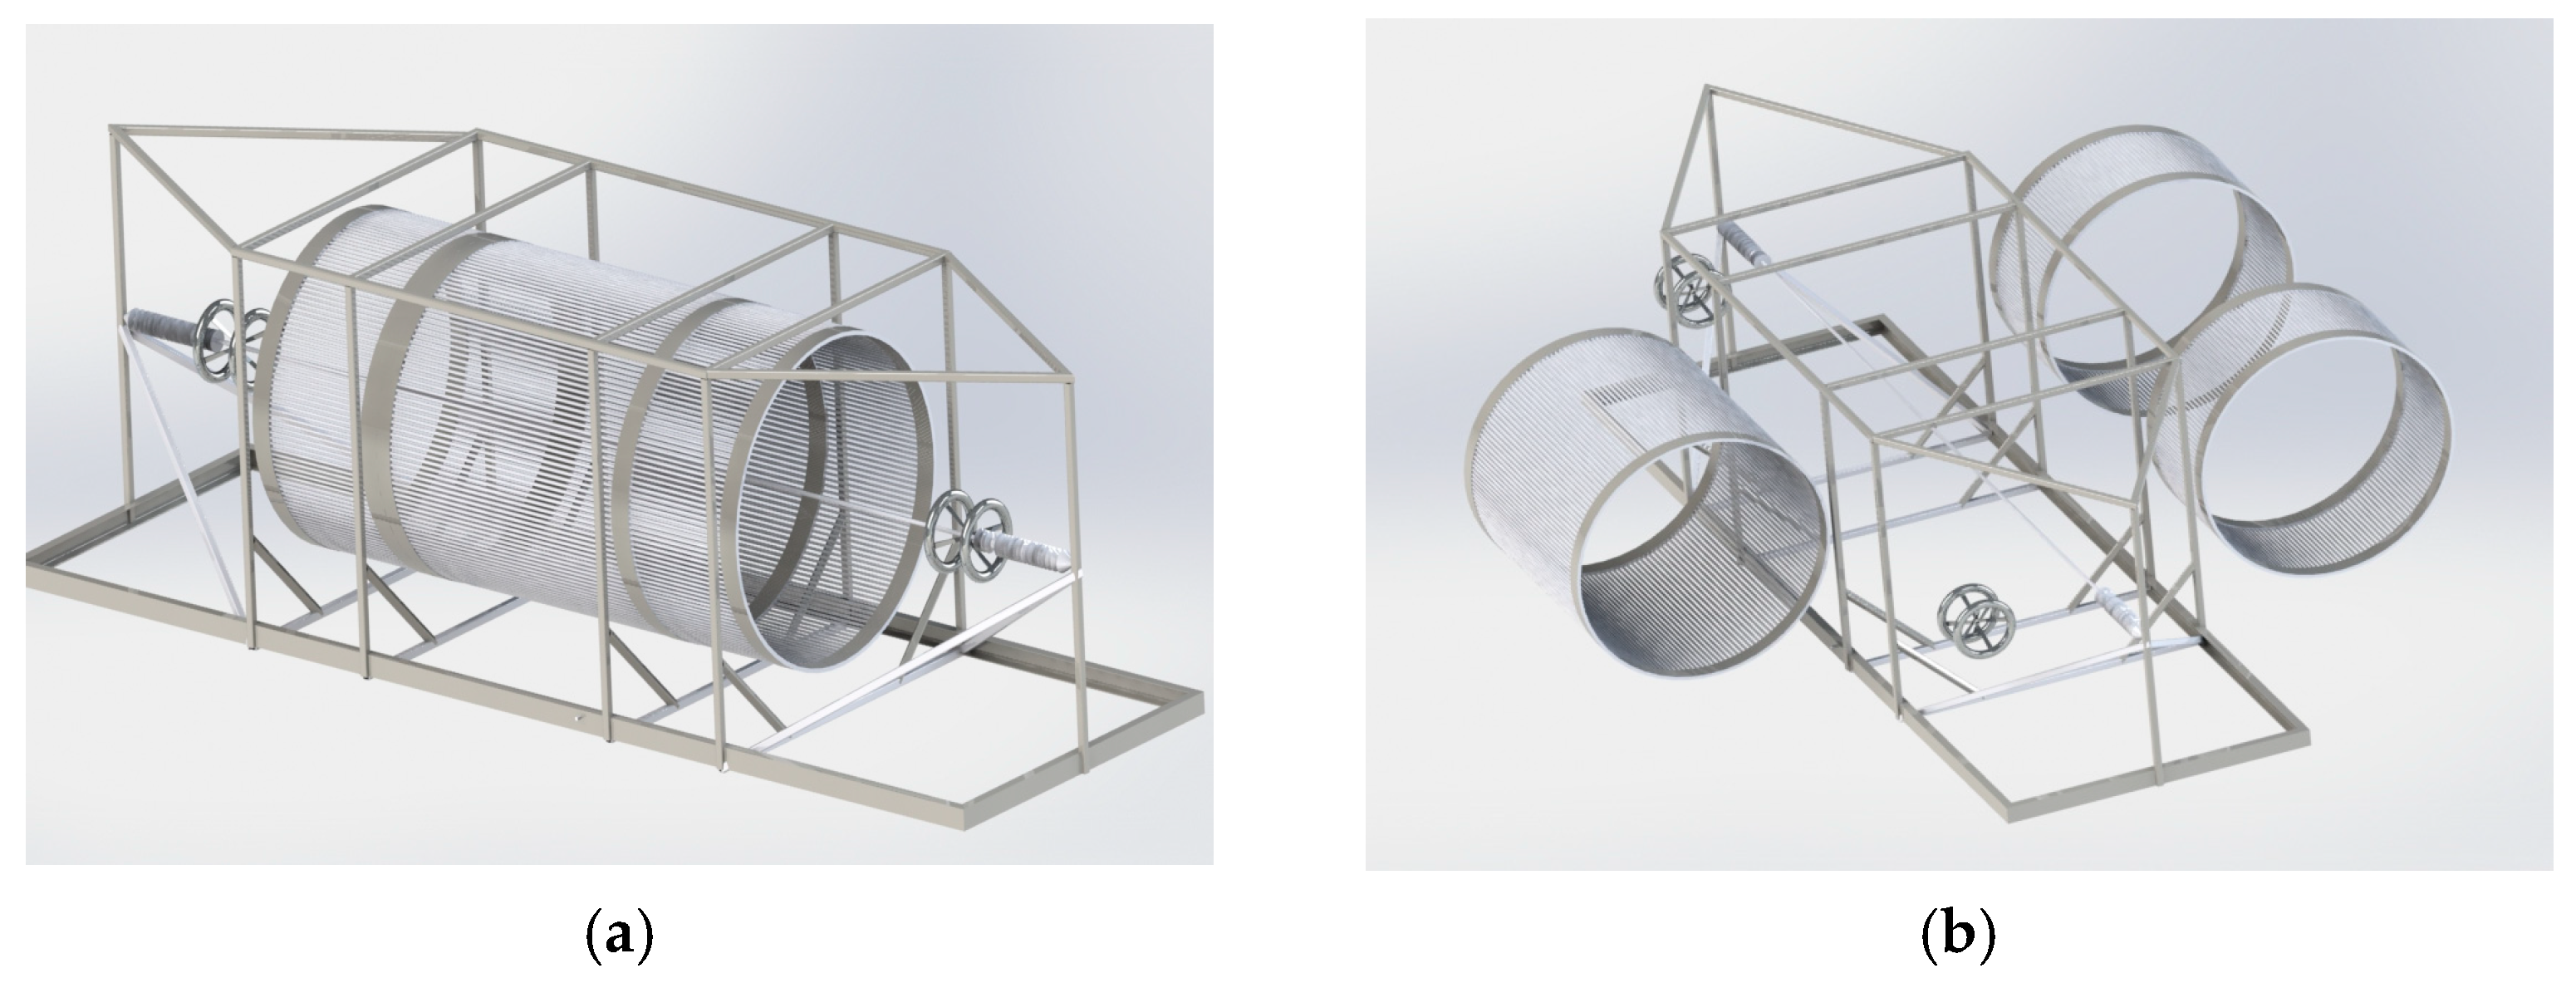
2.1. Corona Cage 3D Design
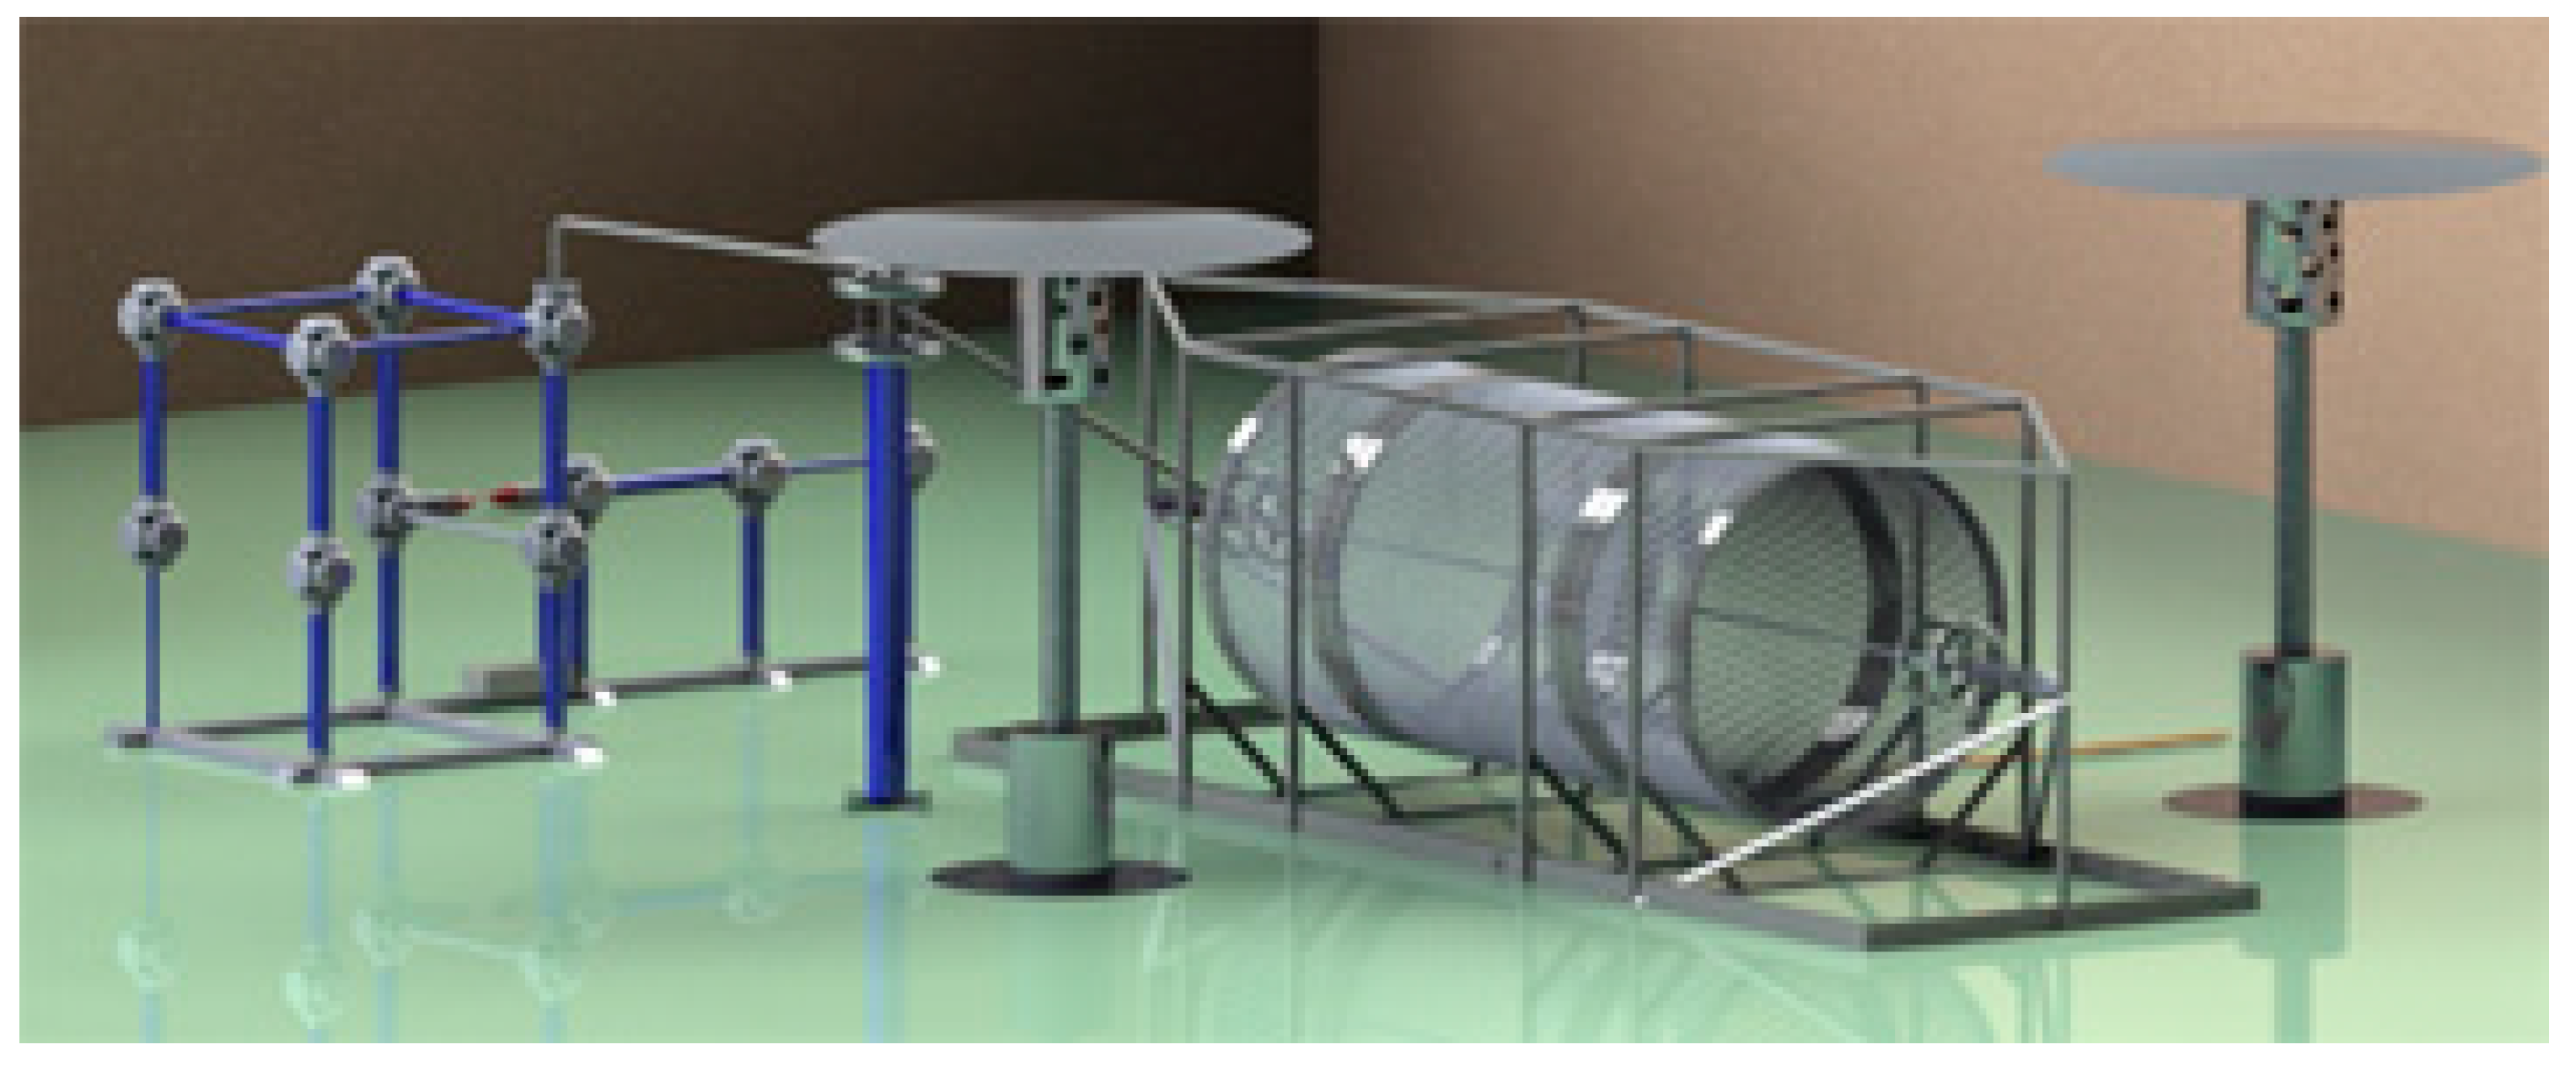
2.2. Real Experimental Arrangement in the HV Laboratory
2.3. Corona Inception Voltage at the Ambient Temperature (CIV)
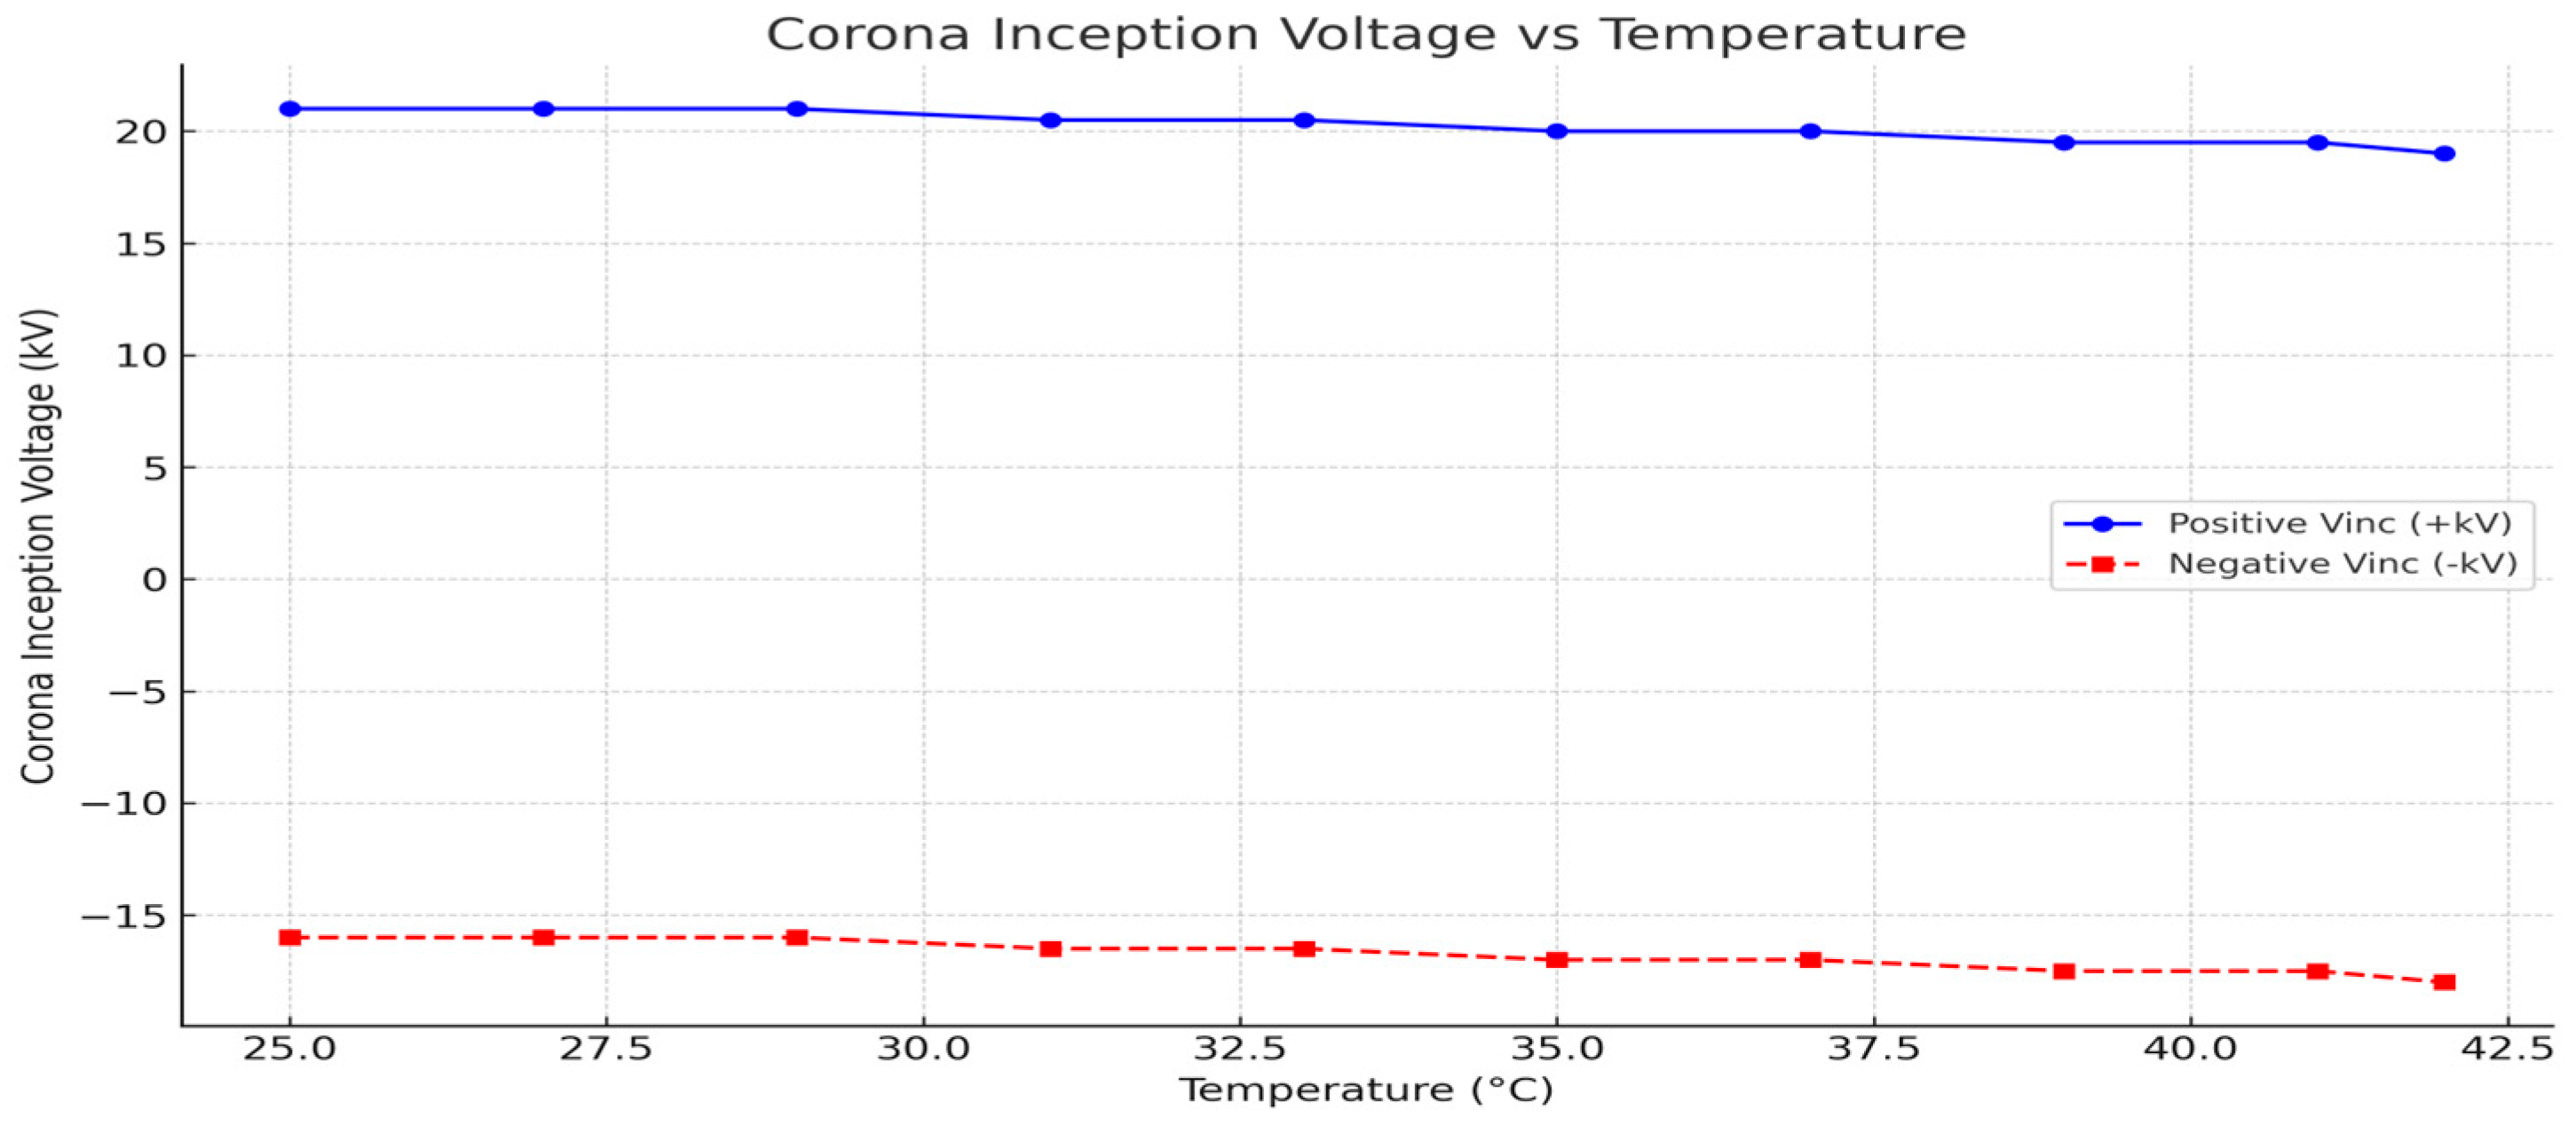
2.4. Environmental Temperature on the Corona Inception Voltage (Vinc)
2.5. Experimental Procedure in the High-Voltage Laboratory
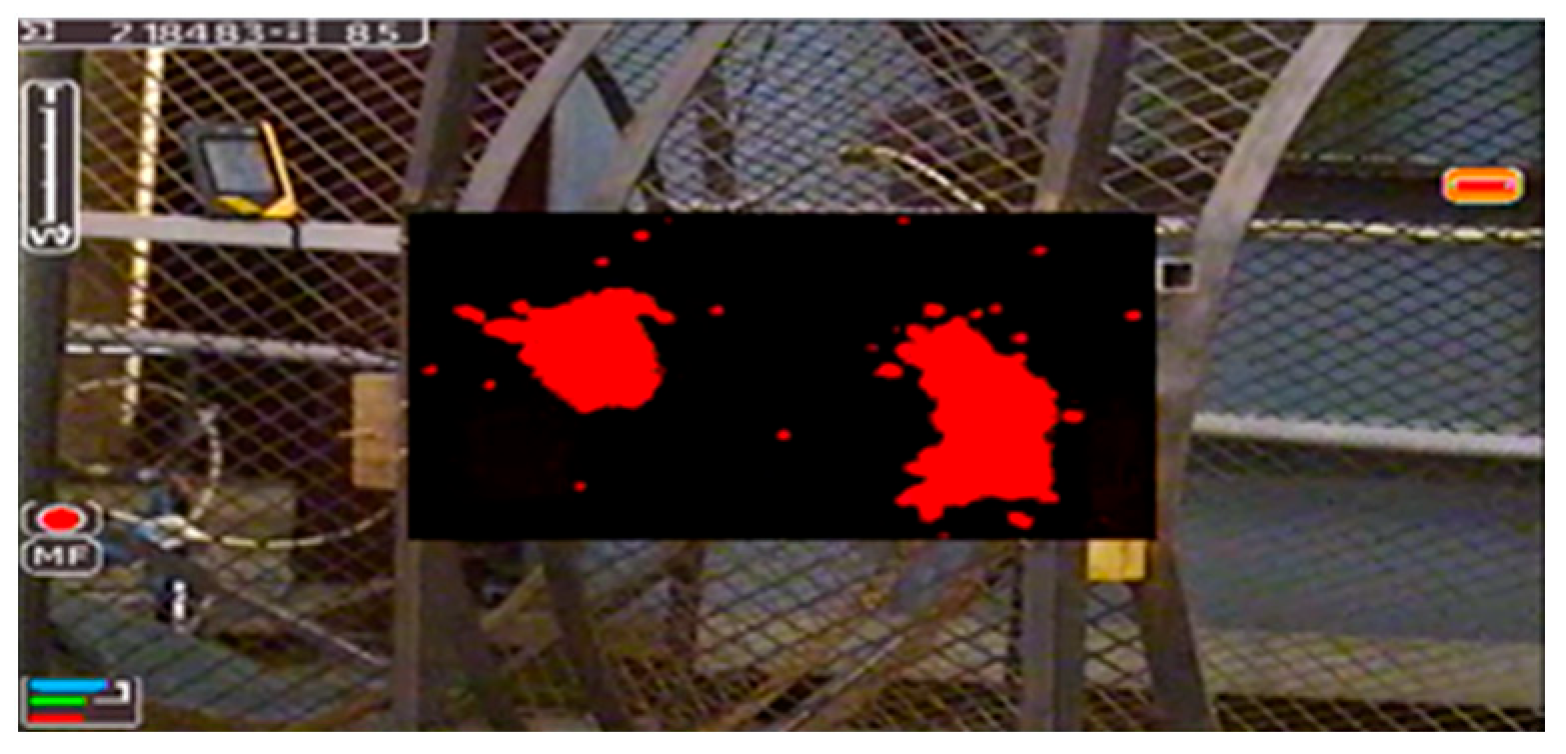
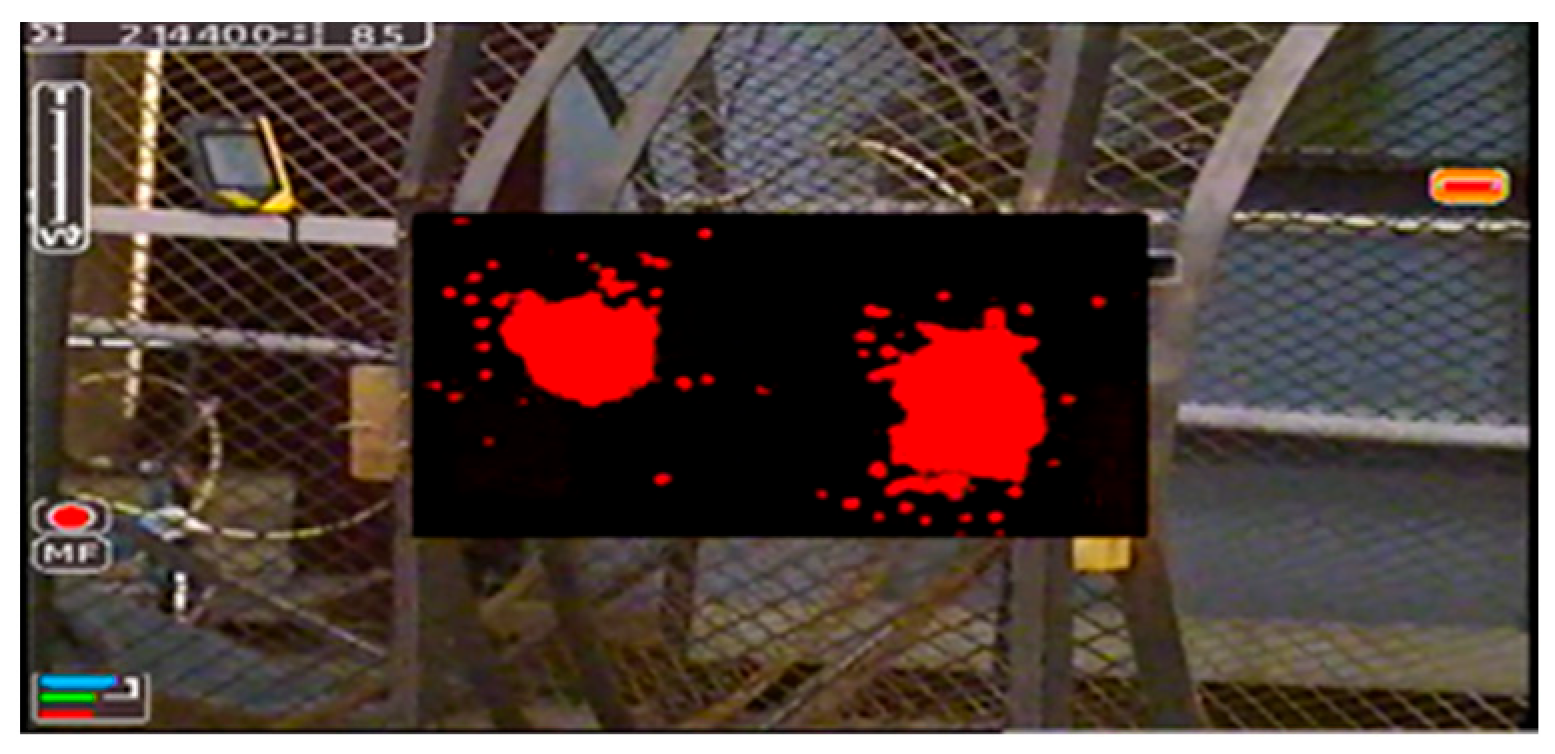
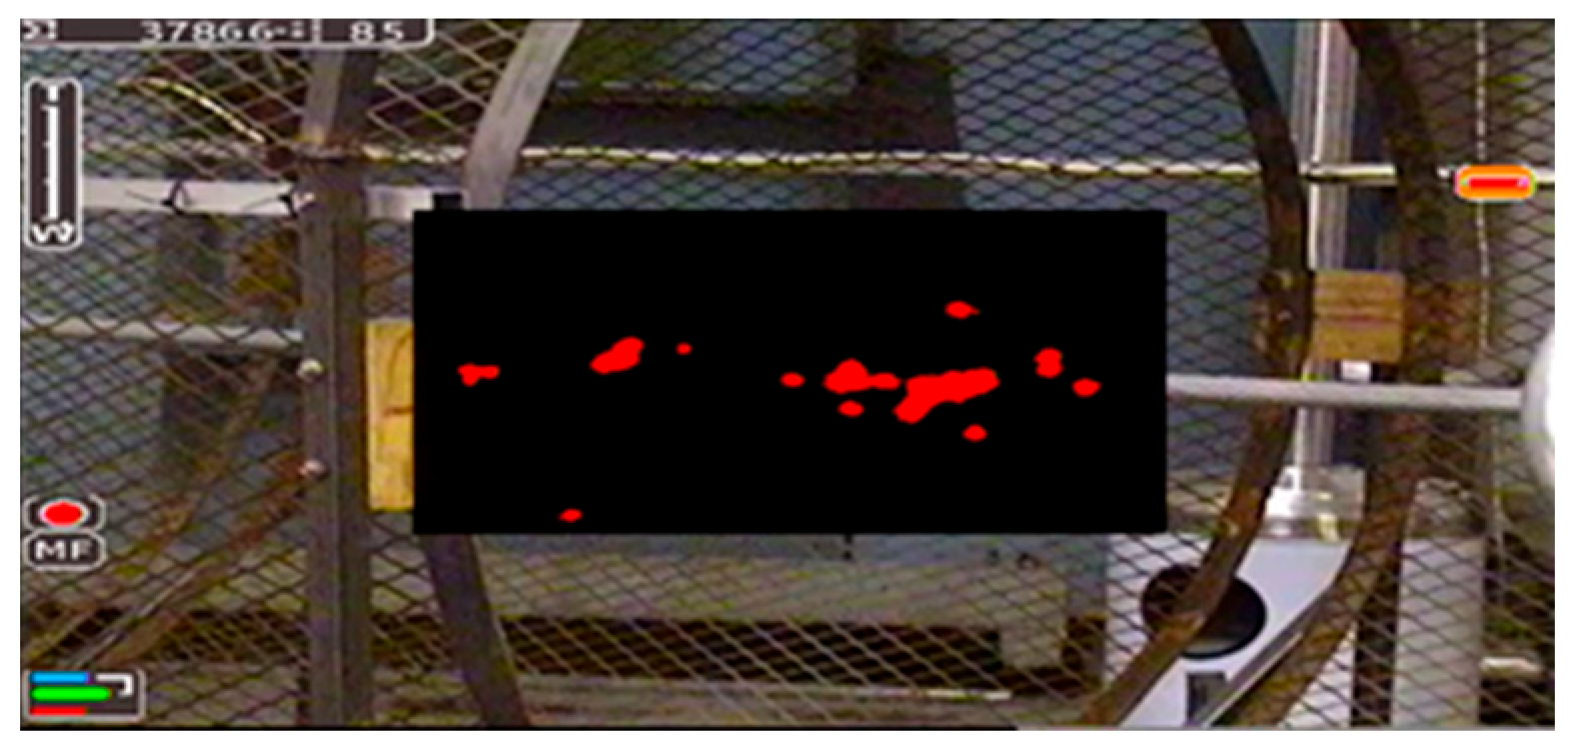
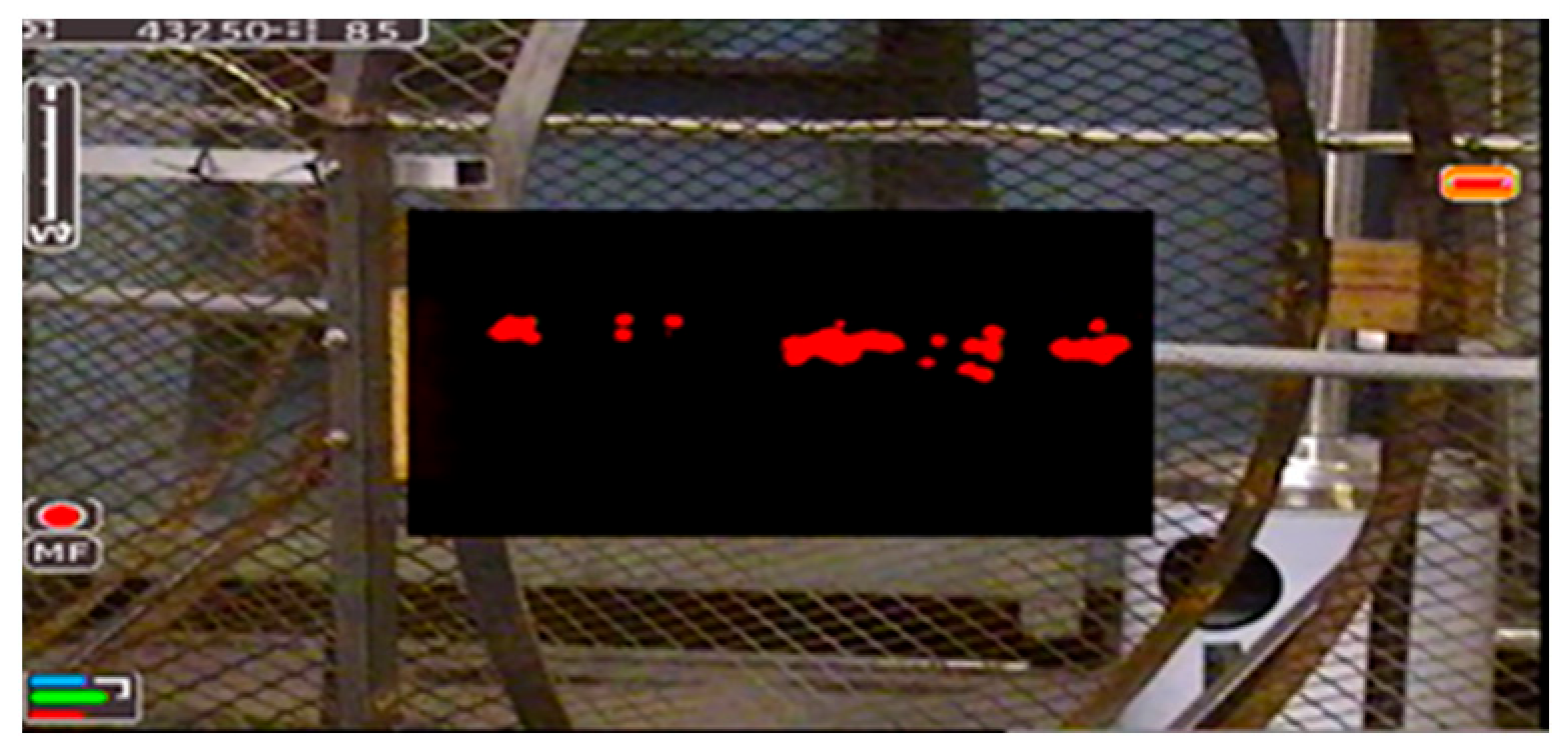
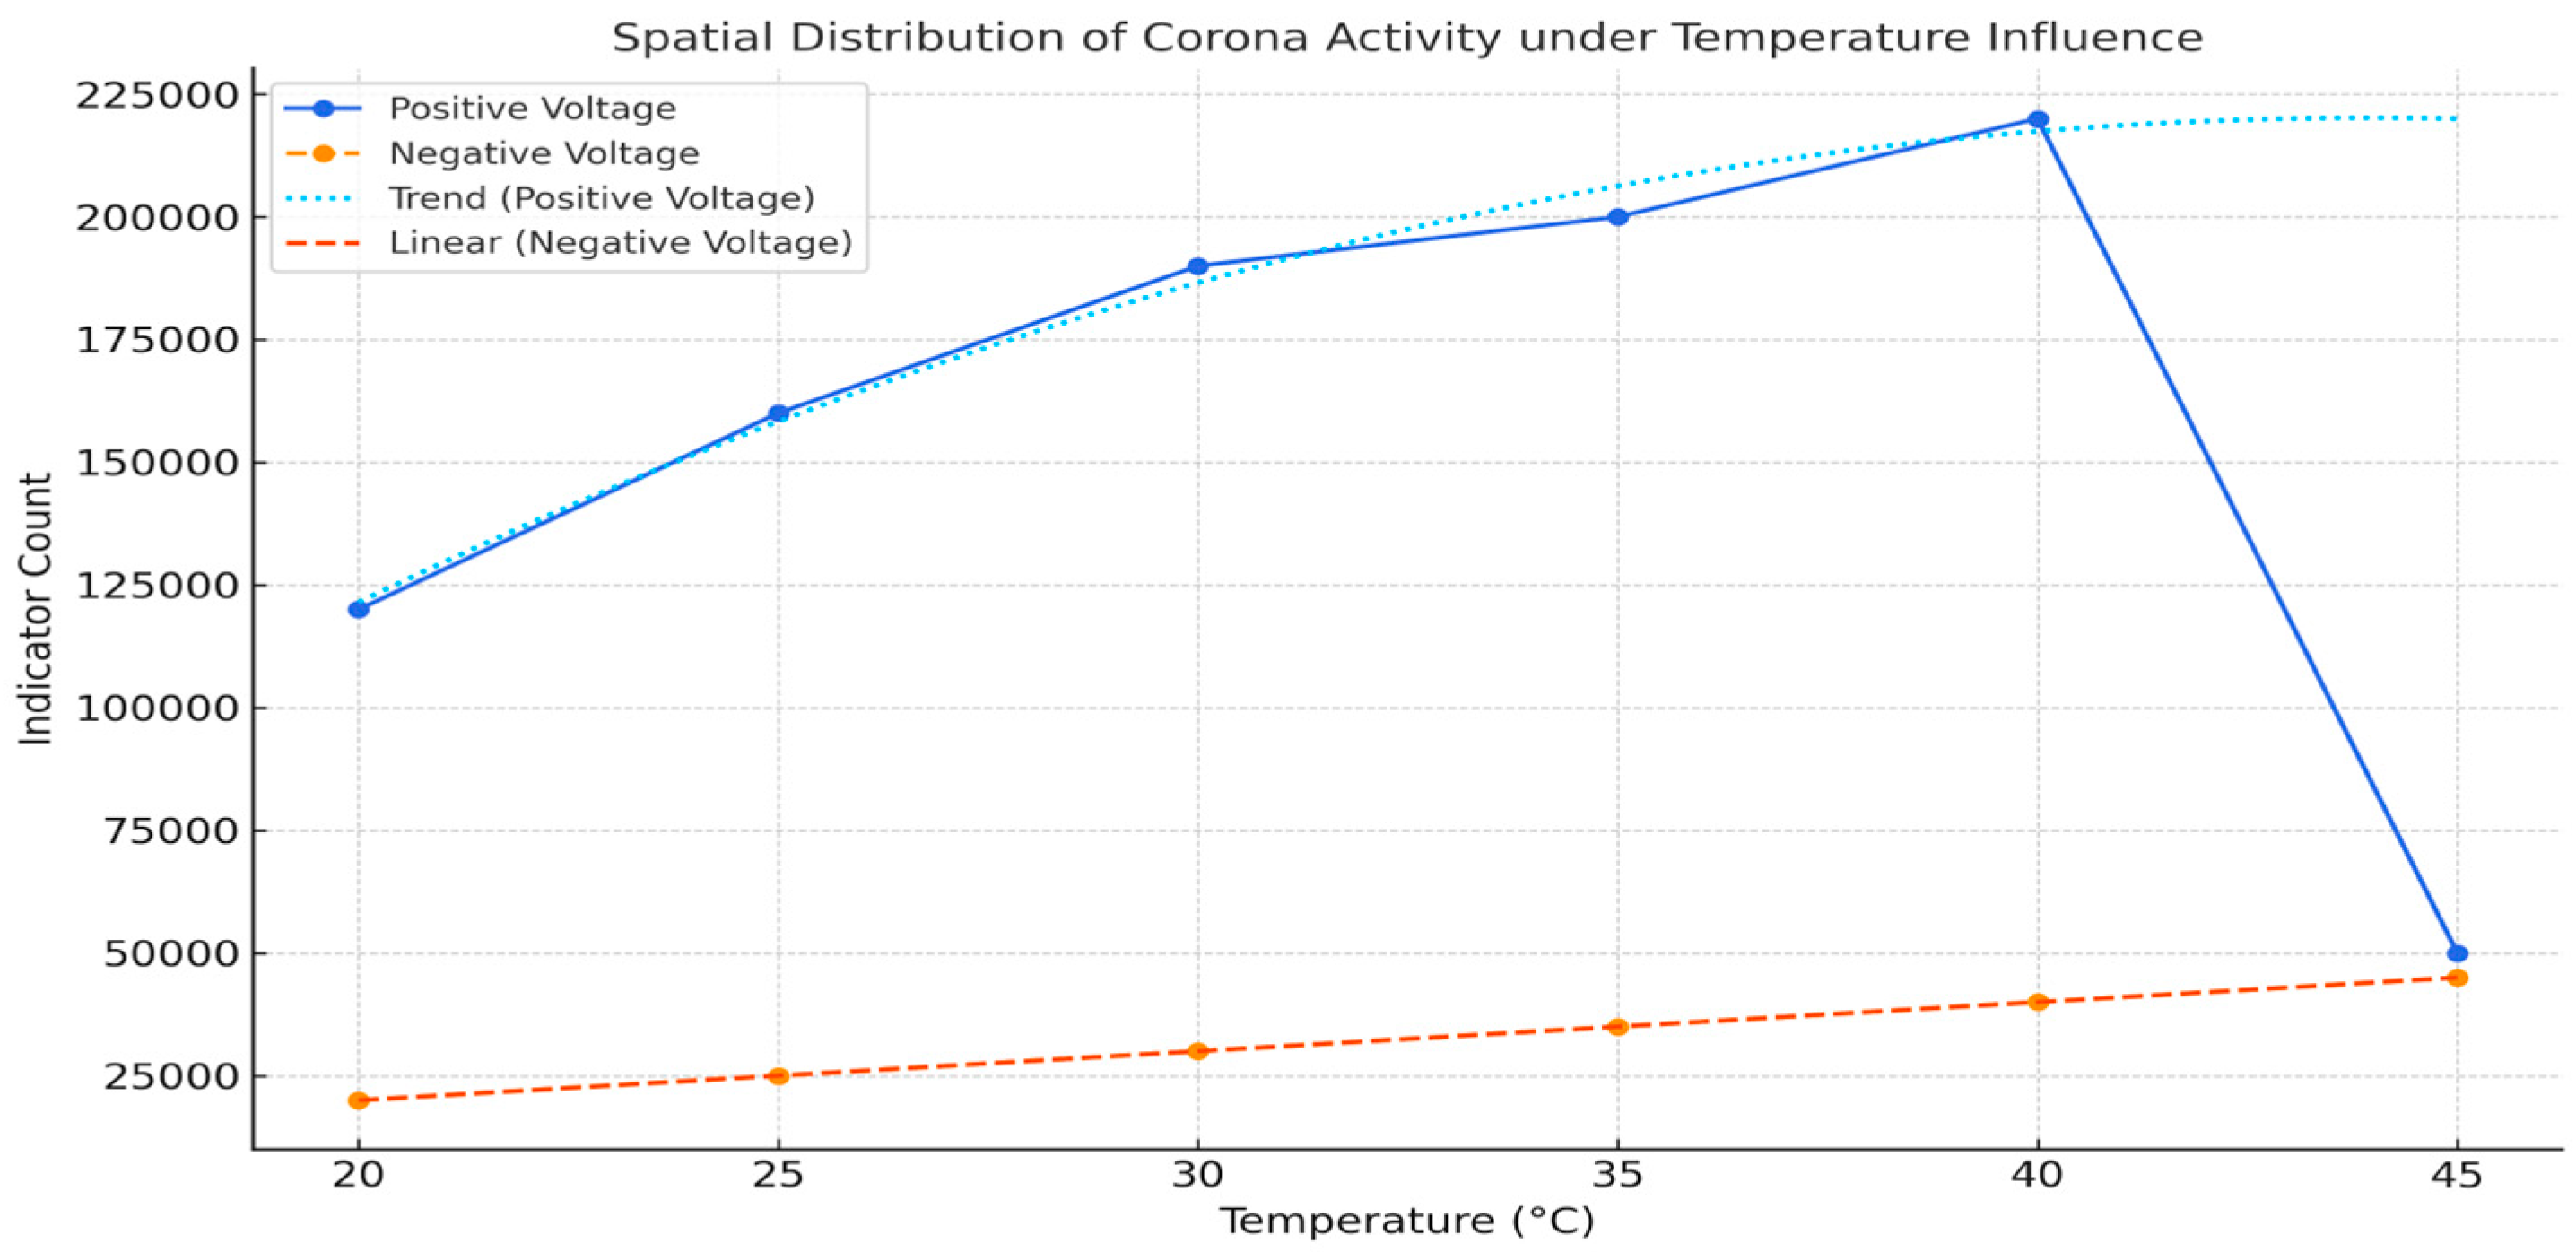
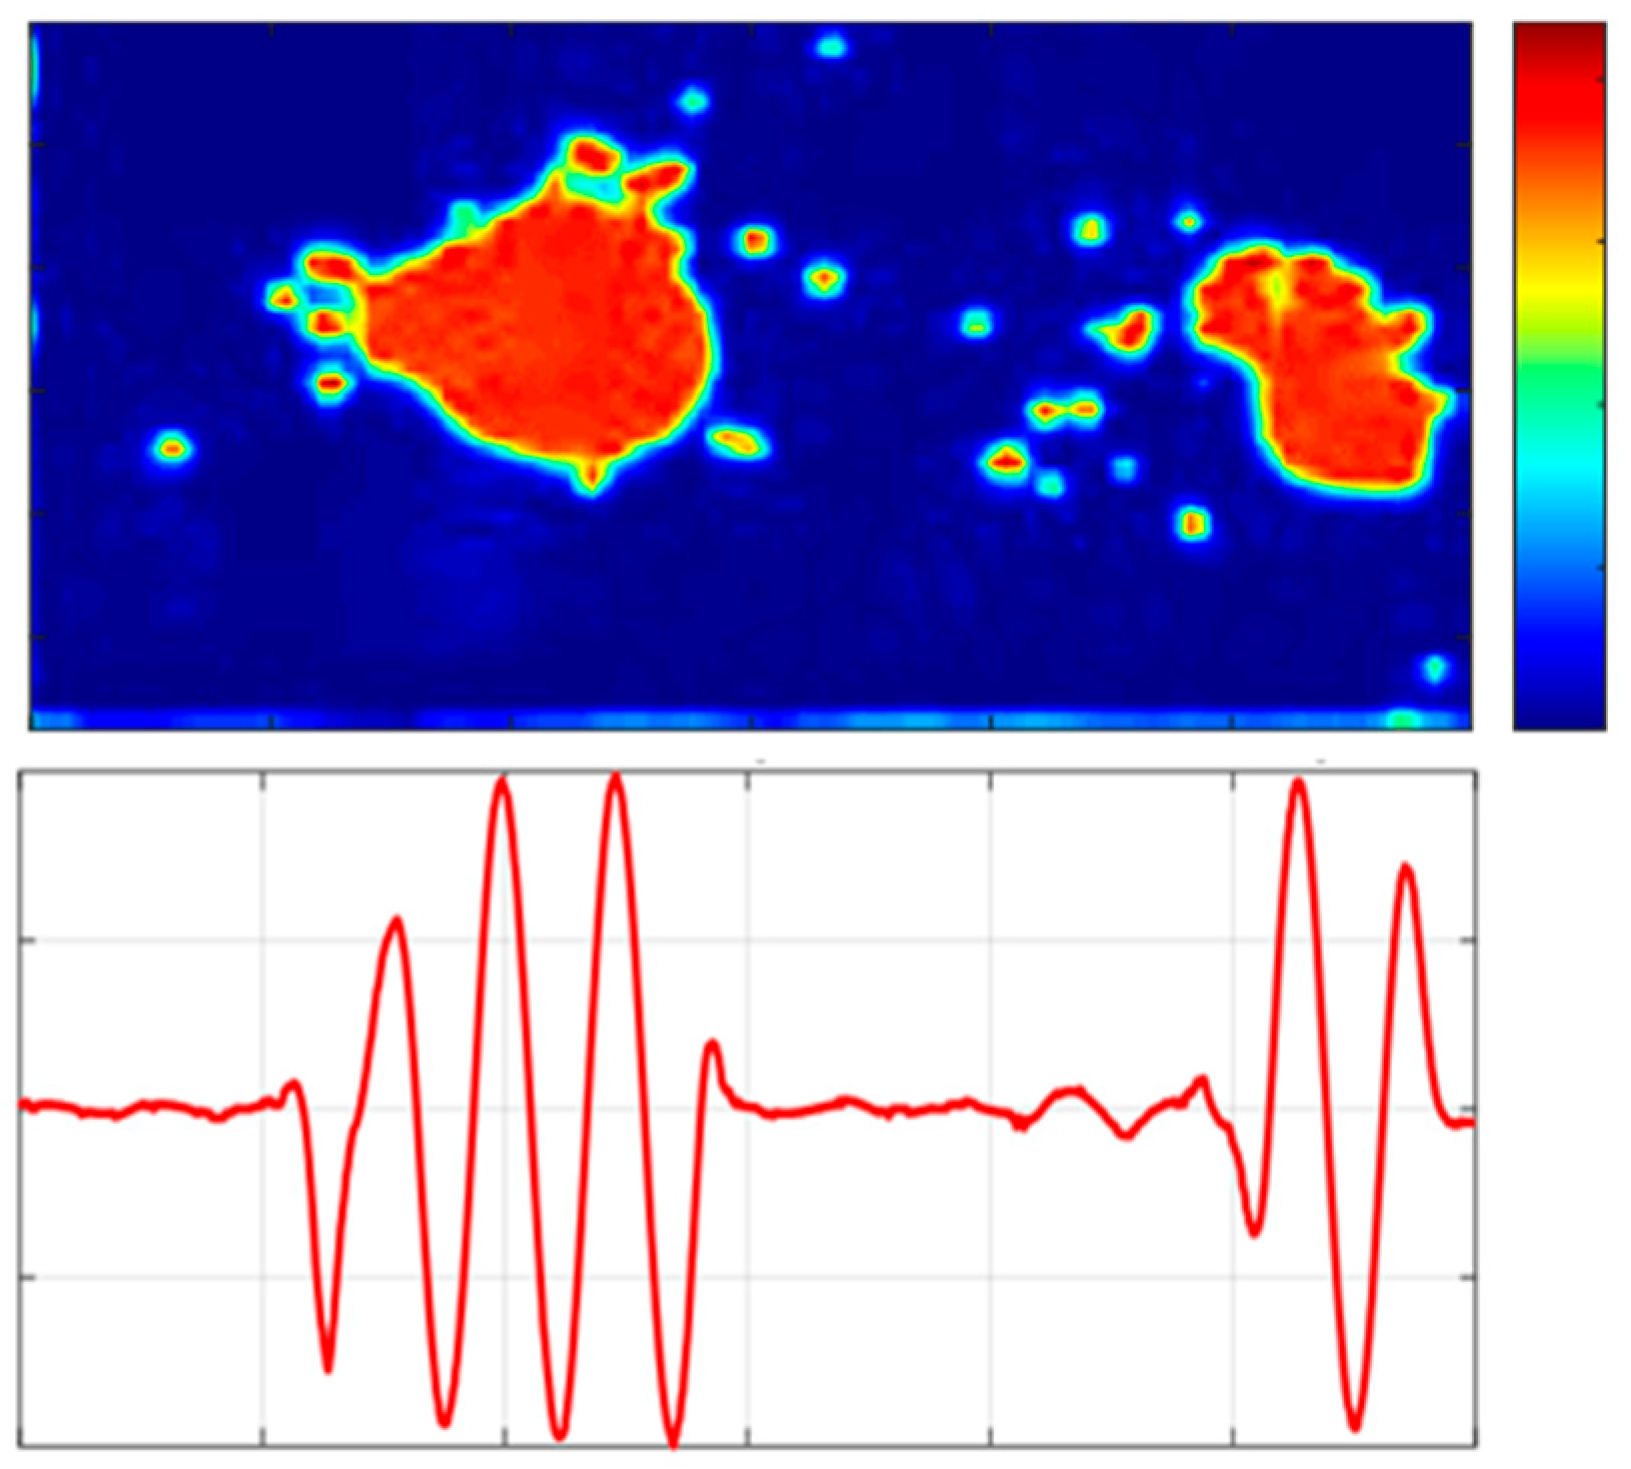
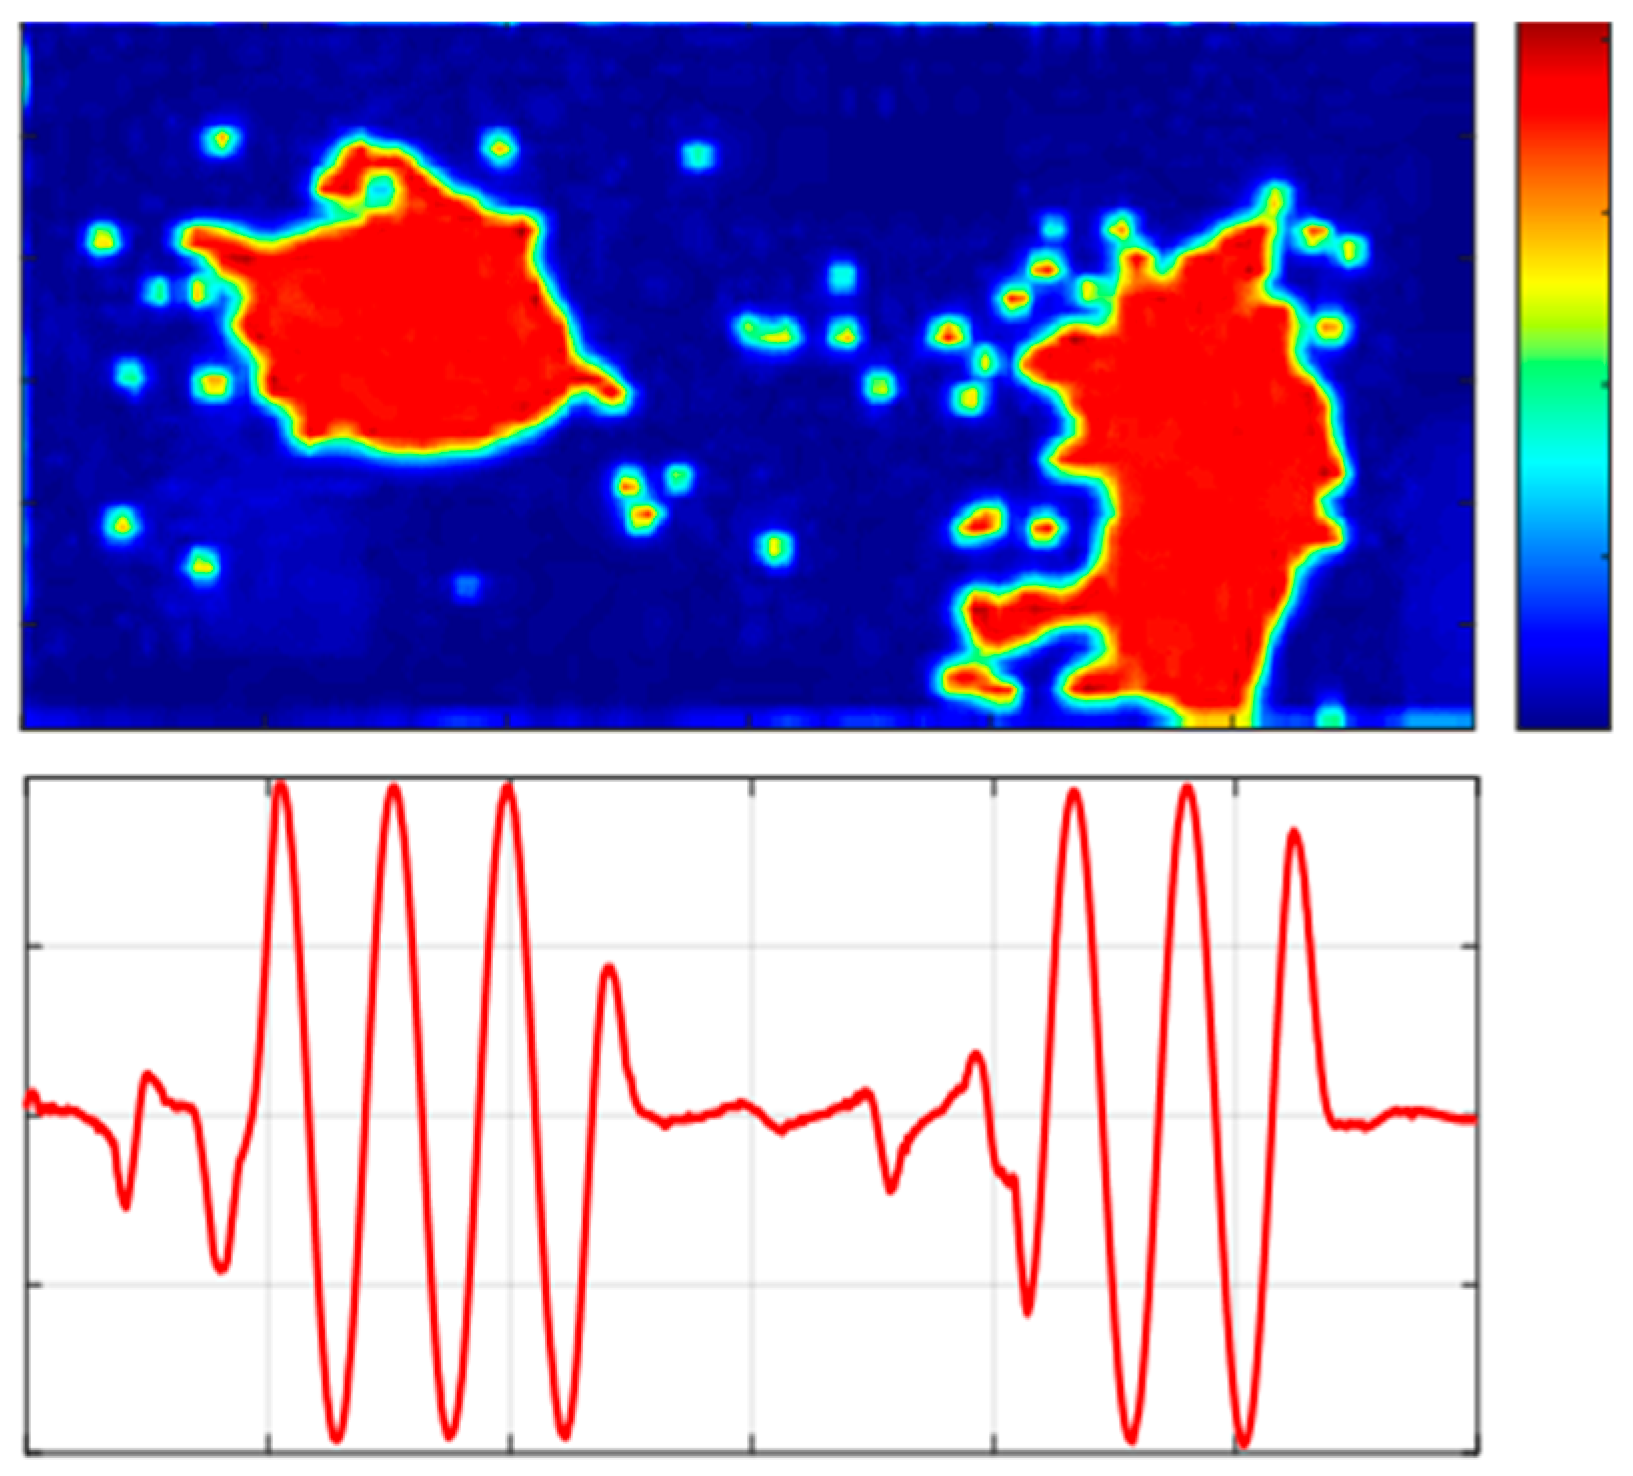
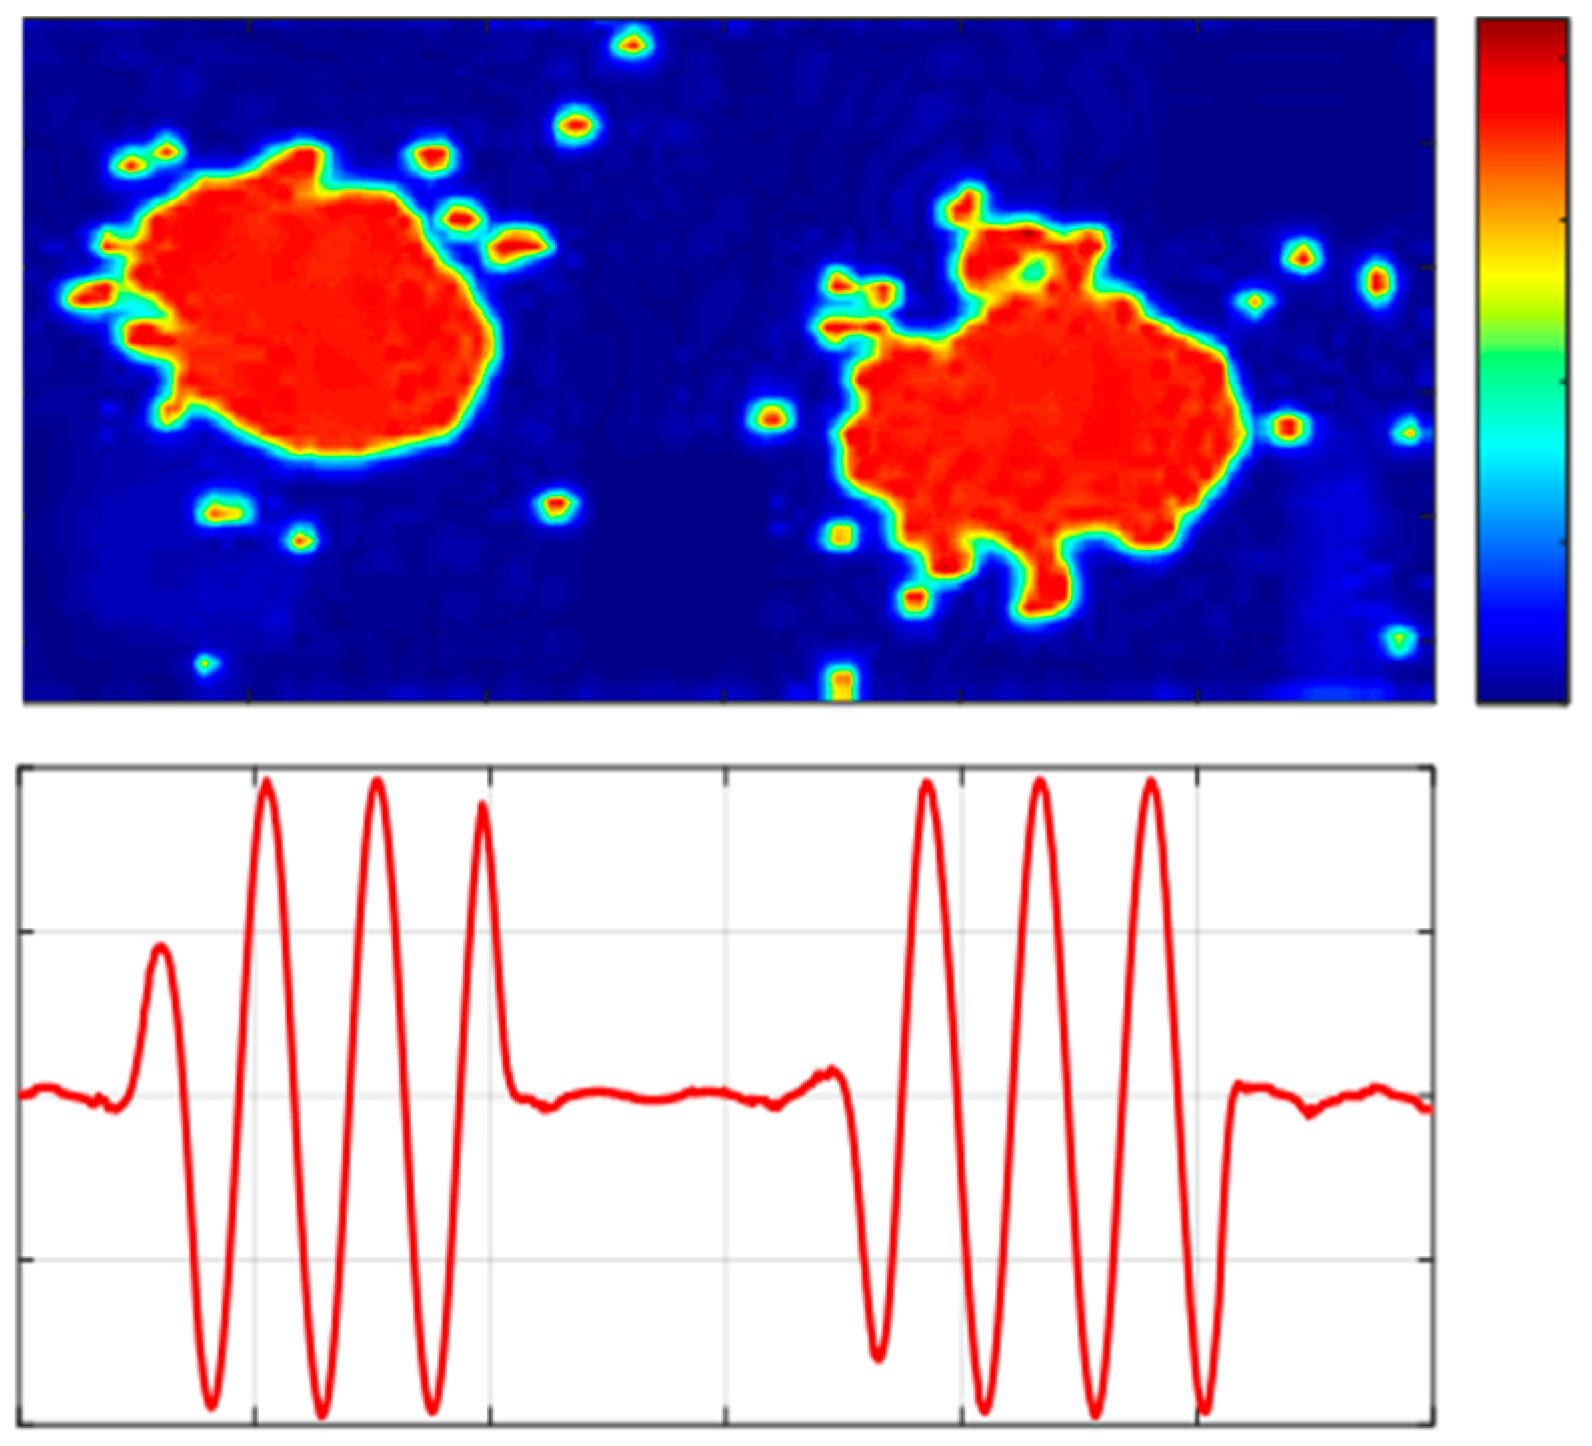
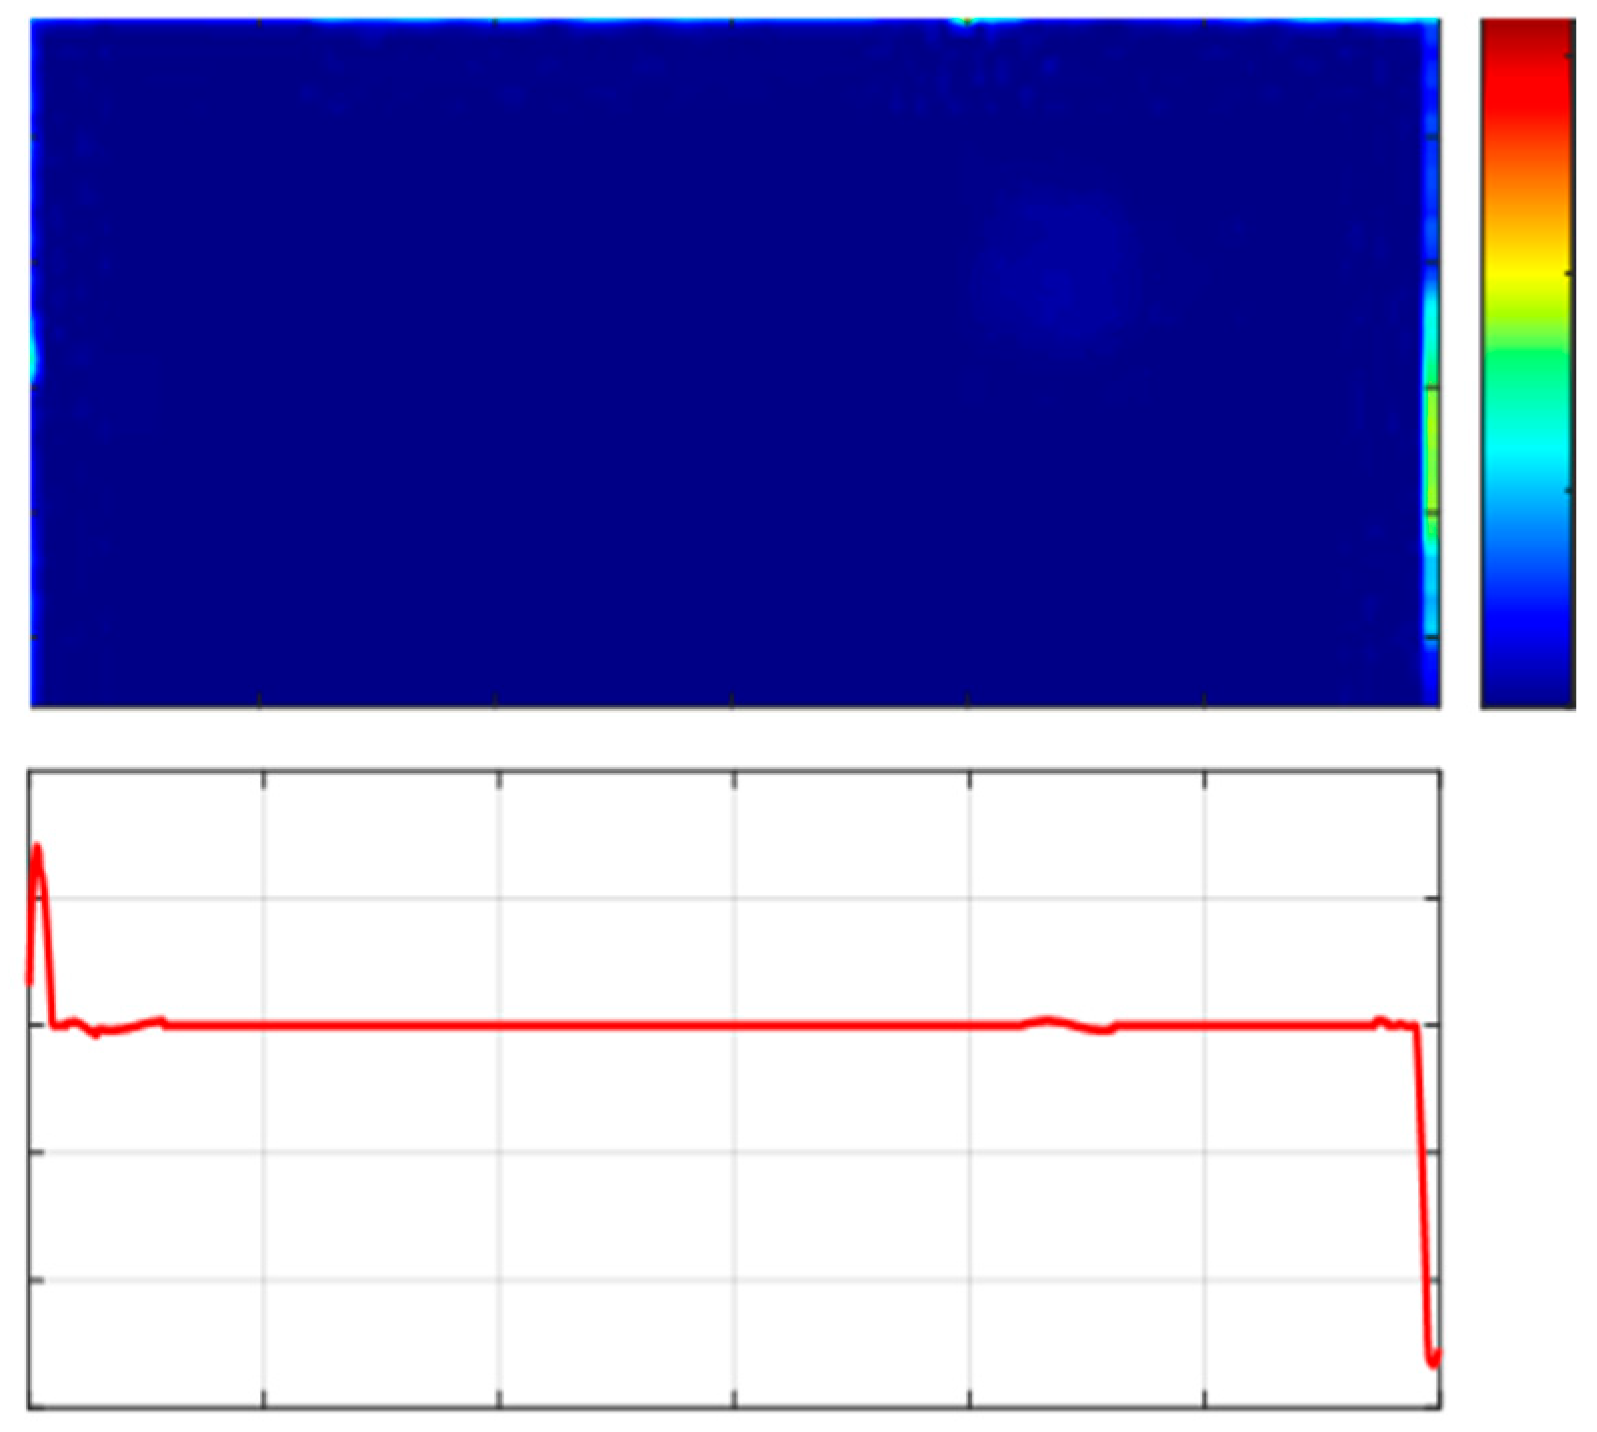
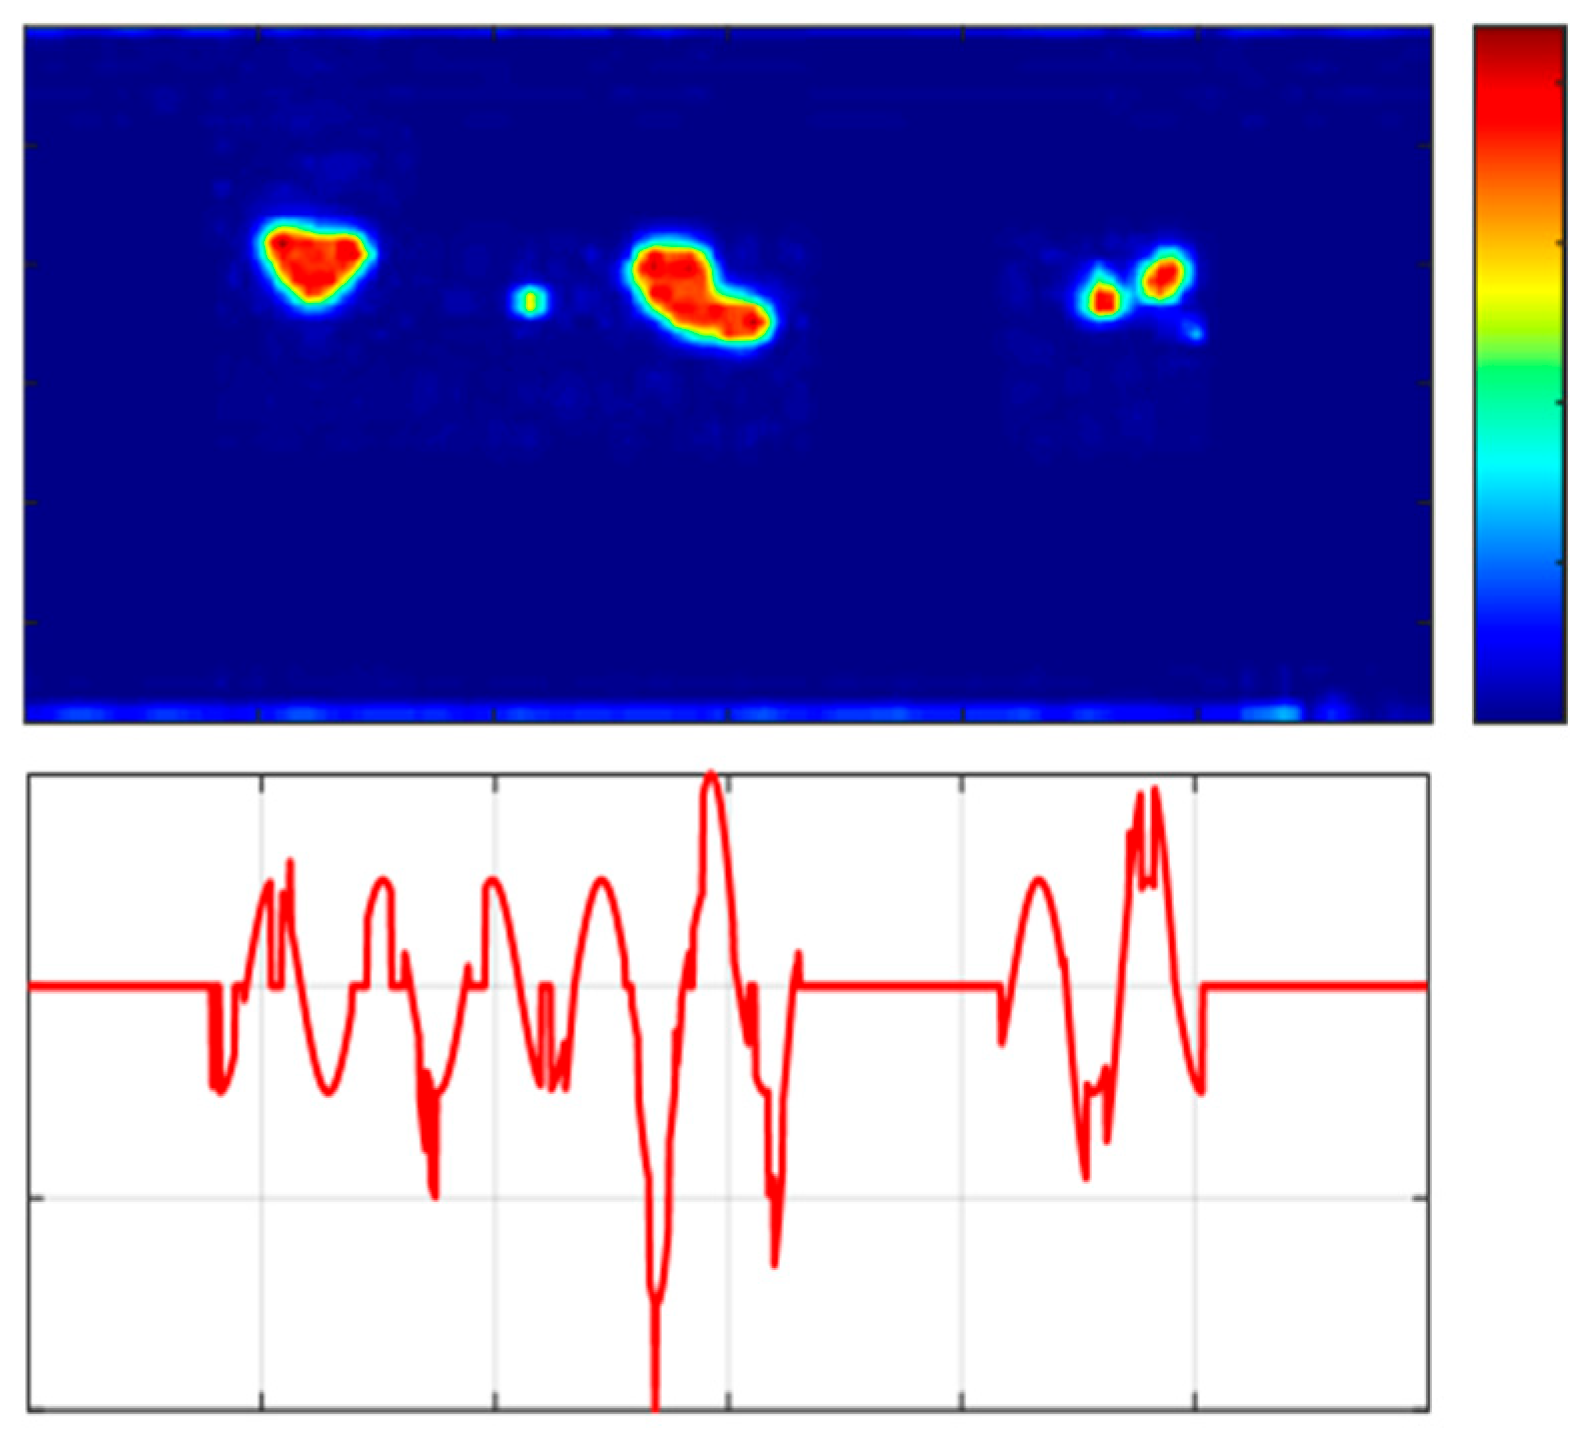
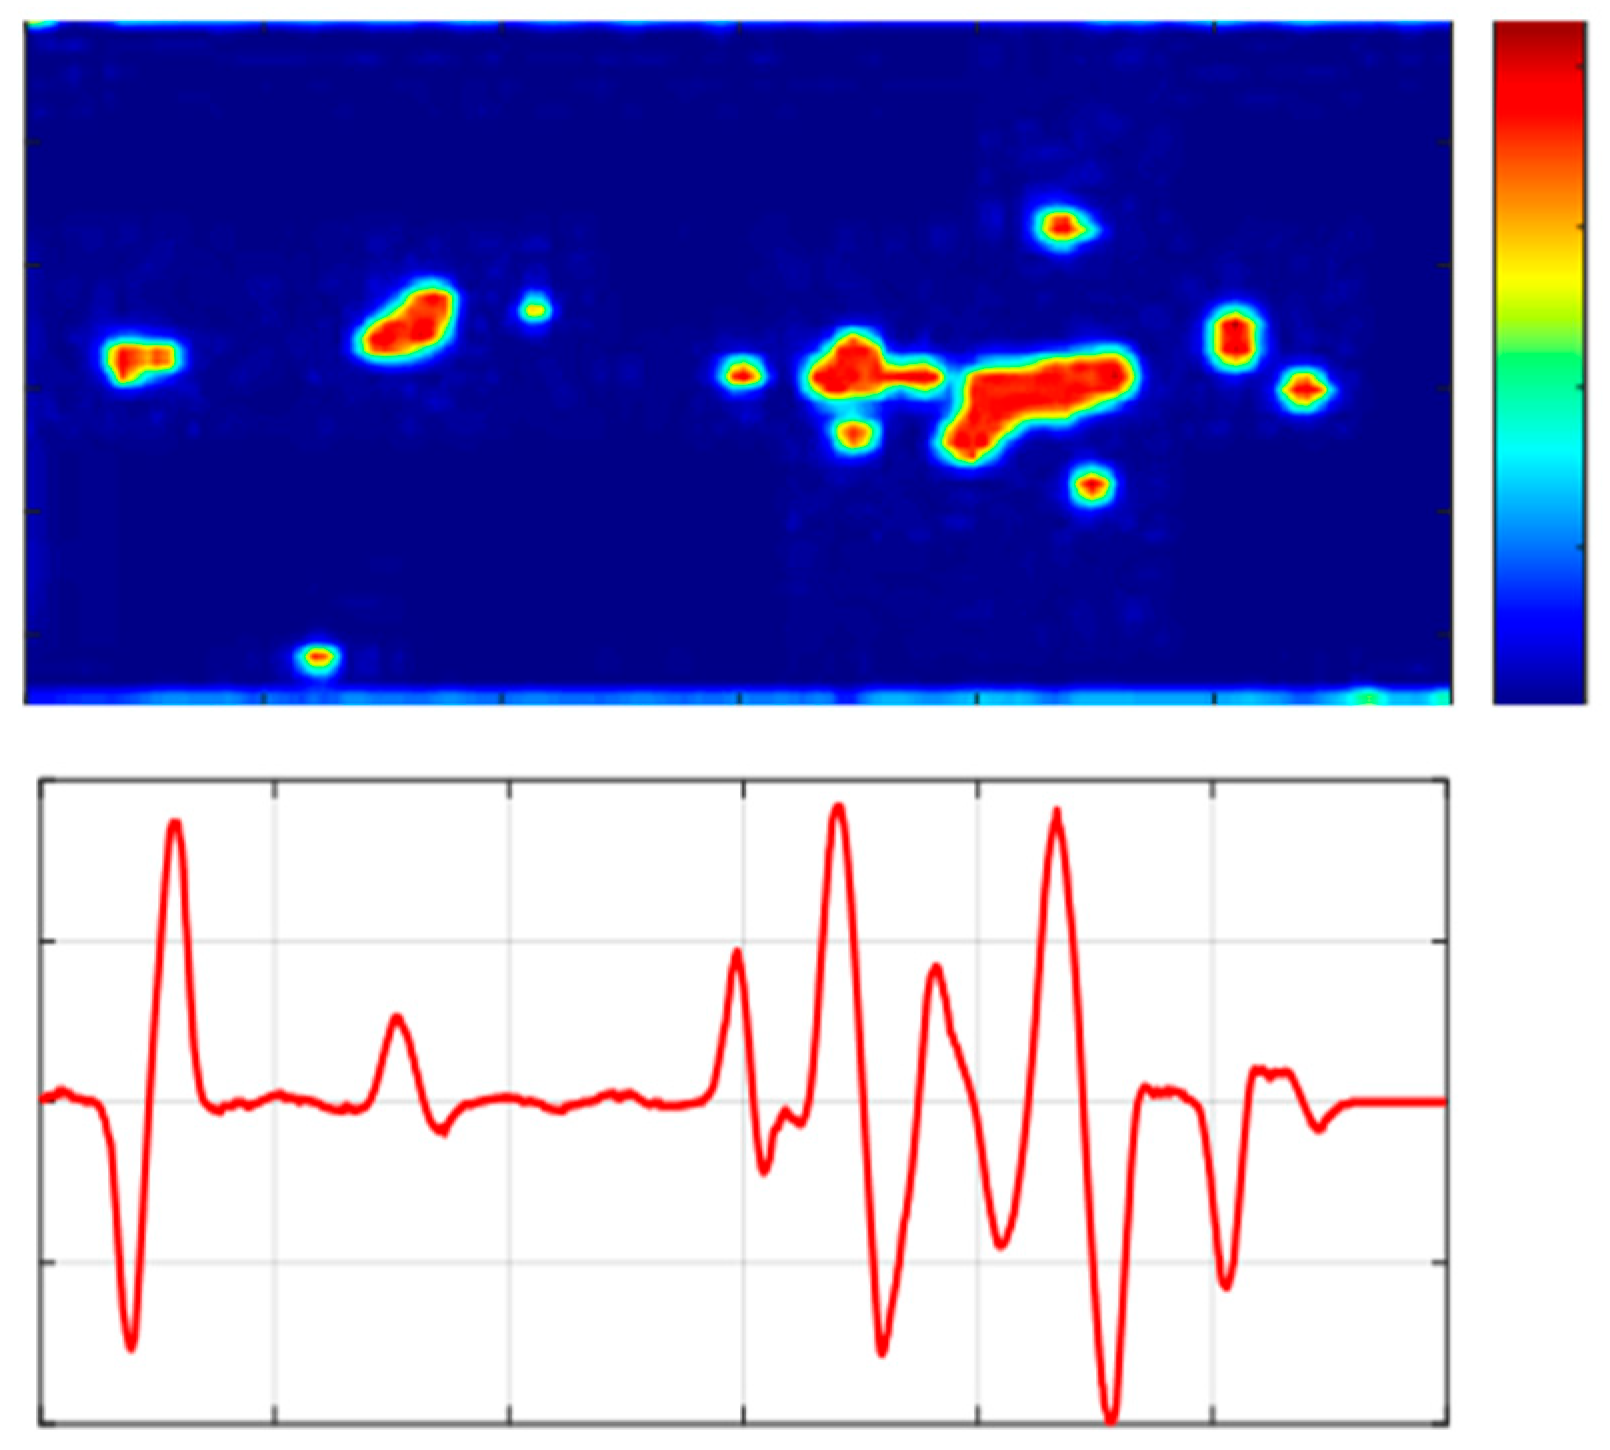
2.5.1. Effect of Temperature on Corona-Generated Space Charge for a Positive Voltage
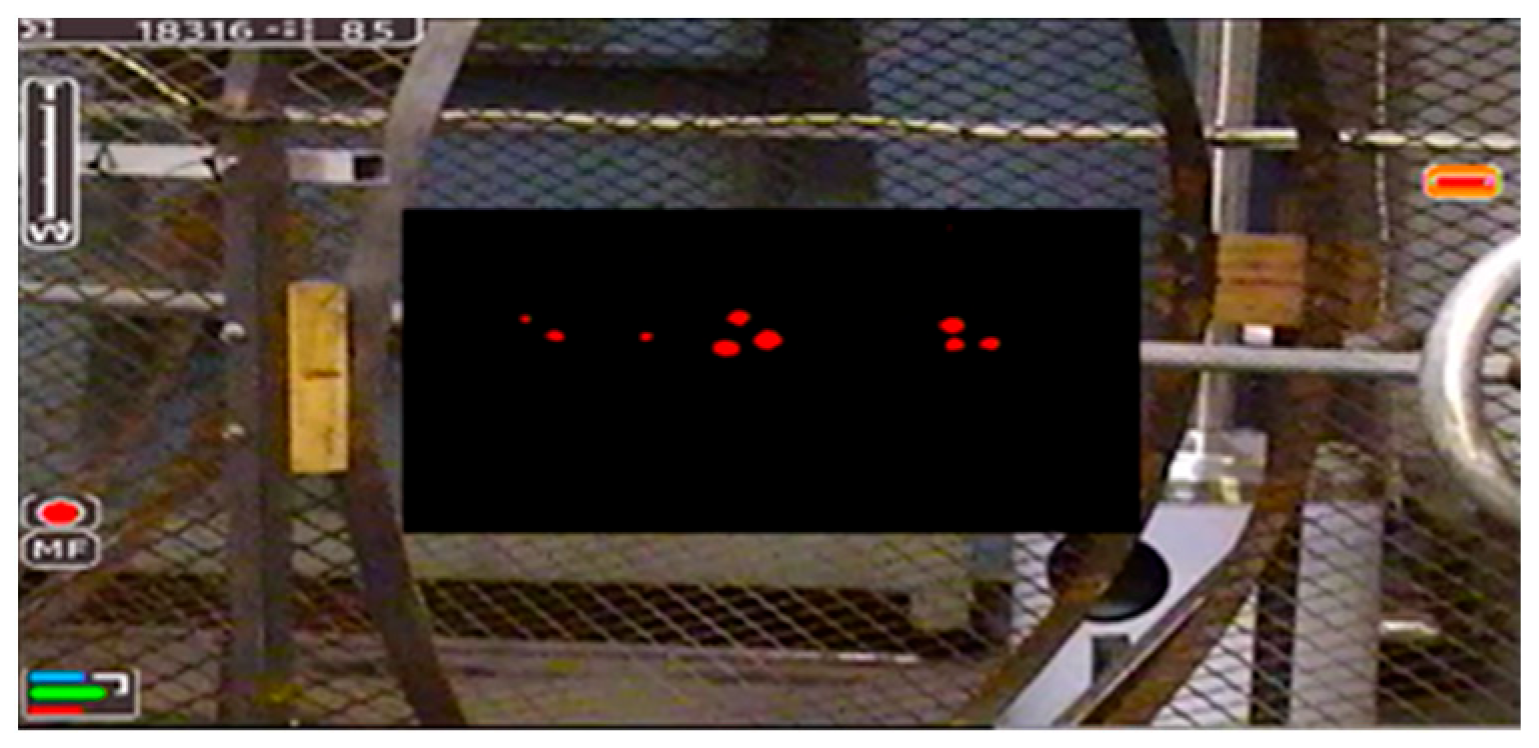
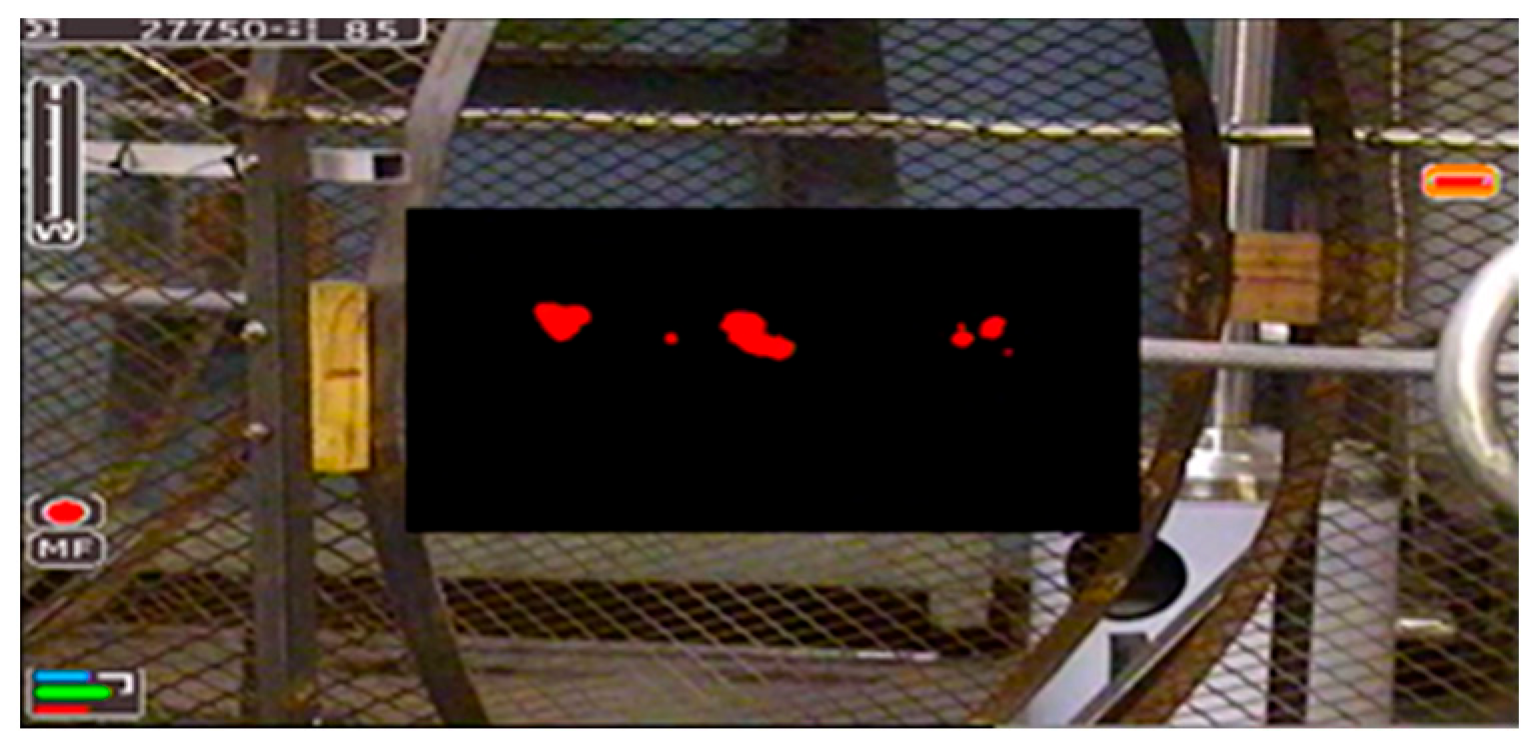
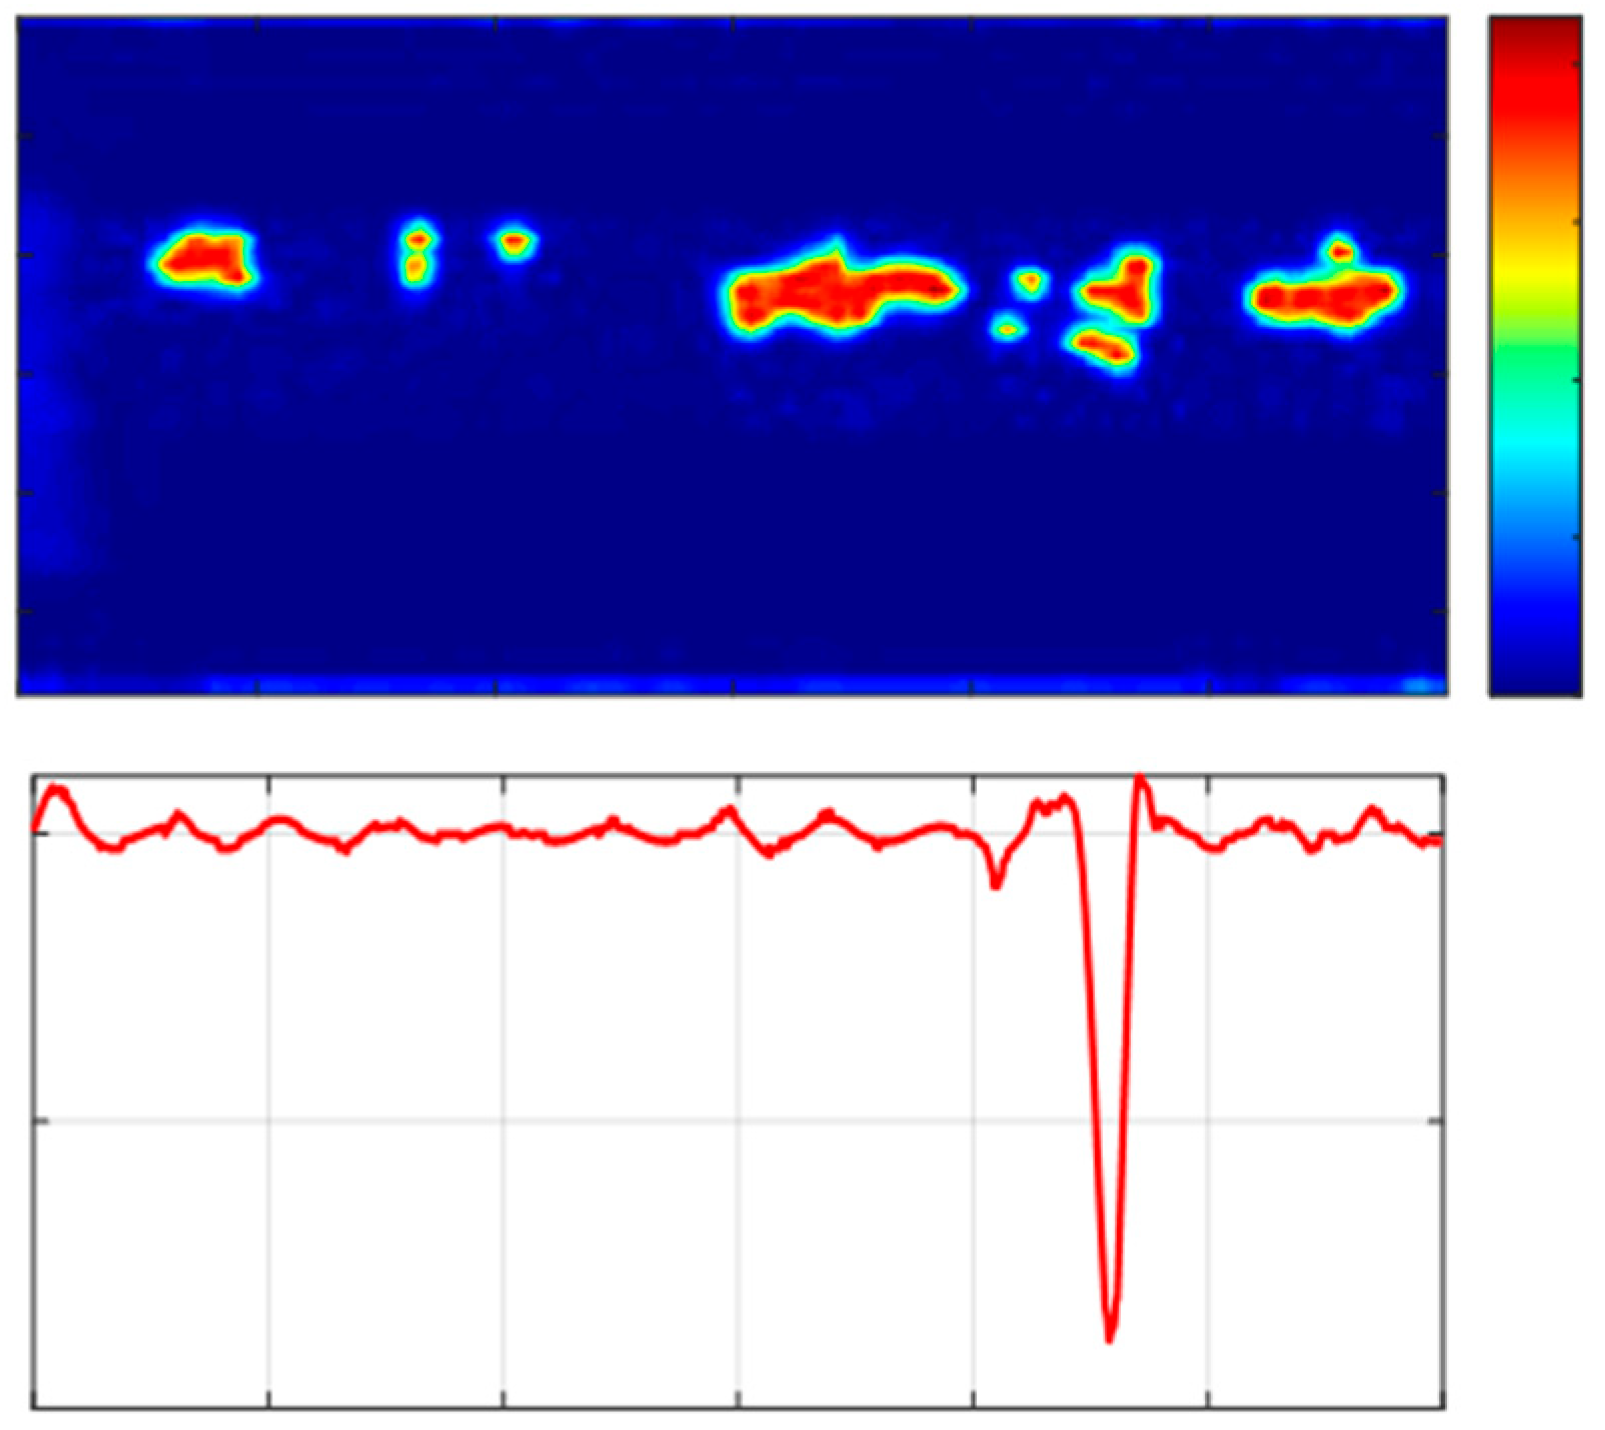
2.5.2. Effect of Temperature on Corona-Generated Space Charge for a Negative Voltage
2.6. Effect of Temperature on Corona Loss for a Positive and Negative Voltage
3. Simulation Studies
3.1. Simulation of the Effect of Temperature on Corona-Generated Space Charge for a +V Voltage
3.1.1. Mesh Quality Evaluation
3.1.2. Mesh Parameters Used
3.1.3. Mesh Convergence Test
- Step 1: Start a New COMSOL Project
- Choose Space Dimension: 3D. Next, select Physics Interfaces.
- Step 2: Add Physics:
- AC/DC Module > Electrostatics (for electric field distribution).
- Plasma Module > Corona Discharge (to simulate corona discharge and space charge).
- Heat Transfer Module > Heat Transfer in Fluids (to model temperature variation).
- Step 3: Define the Geometry
- HVDC Transmission Line Conductor Geometry:
- ▪
- Create a cylinder to represent the HVDC conductor.
- ▪
- Radius = 2 cm (0.02 m).
- ▪
- Length = 2 m (arbitrary, choose the length to simulate a section of the line).
- Air Domain:
- ▪
- Create a larger cylinder representing the air surrounding the HVDC conductor line.
- Radius = 0.75 m (to capture the influence of the electric field over a reasonable distance), the size of the cage.
- Height = 2 m (same as the conductor length).
- ▪
- Ground Plane:
- -
- Add a flat plane below the conductor (at 75 cm) to simulate the ground.
- Step 4: Define Materials
- Conductor: Assign aluminium to the HVDC line (from the Material Library).
- Relative permittivity (dielectric constant) = 1 (for metals).
- Conductivity = 5.8 × 1075.8\times 10^75.8 × 10⁷ S/m.
- ▪
- Air Domain: Assign air to the surrounding volume.
- Relative permittivity = 1 (for air).
- Electrical conductivity: Use default air properties.
- Step 5: Setup Electrostatics (AC/DC Module)
- Voltage Potential:
- ▪
- Select the conductor surface and set the electric potential to ±175 kV.
- ▪
- Boundary condition: 200 kV DC (±200,000 V).
- Ground Potential:
- Set the ground plane (bottom of the air domain) to 0 V (ground potential).
- ▪
- Boundary Conditions:
- Leave the rest of the air domain as open boundary conditions, allowing the field to decay naturally in space.
- Step 6: Setup Corona Discharge (Plasma Module)
- Activate Corona Discharge:
- Apply the Corona Discharge interface to the air domain.
- ▪
- Corona Discharge Settings:
- Corona inception voltage: Set the threshold voltage for corona discharge to 200 kV (typical value for air breakdown).
- ▪
- Positive and Negative Ions:
- For the ion species, define:
- ▪
- Positive ion mobility = 1.5 × 10 − 41.5 \times 10{−4}1.5 × 10⁻⁴ m2/Vs (for typical ions in air).
- ▪
- Negative ion mobility = 2.0 × 10 − 42.0\times 10{−4}2.0 × 10⁻⁴ m2/Vs.
- Space Charge Accumulation:
- ▪
- Add positive and negative ion densities to simulate charge build-up.
- -
- Initial space charge density: 0 C/m3 (assume no initial charge).
- Step 7: Setup Heat Transfer (Heat Transfer Module)
- Heat Transfer in Air:
- ▪
- Apply the Heat Transfer in the Fluids interface to the air domain.
- Initial Temperature:
- ▪
- Set the initial air temperature to 25 °C, standard or ambient temperature
- Variable Temperature:
- ▪
- In the parametric sweep (Step 10), we varied the temperature between 25 °C and 42 °C.
- Air Properties:
- ▪
- Air properties, such as thermal conductivity, density, and specific heat, should be taken from COMSOL’s air material properties. These are already temperature-dependent in COMSOL.
- Step 8: Multiphysics Coupling
- Electrostatics and Corona Discharge:
- ▪
- Couple the Electrostatics with the Corona Discharge module to ensure that the corona-generated space charges affect the electric field distribution.
- Heat Transfer and Corona Discharge:
- ▪
- Couple Heat Transfer and Corona Discharge, so that the air’s ion mobility is affected by temperature, where mobility increases.
- Step 9: Mesh Generation
- Mesh Settings:
- ▪
- Use a fine mesh near the conductor to accurately capture the electric field and corona-generated space charge effects.
- ▪
- A coarse mesh can be used for the outer parts of the air domain to save computation time.
- Step 10: Study Setup
- Study Type: Select Stationary Study (for a steady-state solution).
- Parametric Sweep:
- ▪
- Define a parametric sweep for 25 °C and 42 °C atmospheric temperatures.
- -
- Parametric values: 25 °C, 30 °C, 35 °C, and 42 °C.
- Compute: Run the simulation.
3.2. Simulation of the Effect of Temperature on Corona-Generated Space Charge for a −V Voltage
3.3. Validation Strategy: Simulation vs. Experimental Results
3.3.1. Electric Field Validation
3.3.2. Space Charge Validation
3.3.3. Quantitative Alignment
3.4. Simulation Limitations (Thermal Modelling)
- The FEM simulations assumed uniform temperature fields, which may not reflect localised thermal gradients within the corona cage.
- The thermal coupling between the ionized air and surrounding surfaces was simplified, omitting transient or convective effects.
- Humidity was excluded as a parameter, though it is known to influence breakdown strength and charge mobility.
- The lack of direct space charge measurement tools means validation depends on indirect indicators (e.g., UV count, electric field).
4. Conclusions
Author Contributions
Funding
Data Availability Statement
Conflicts of Interest
References
- Dallaire, R.D.; Maruvada, P.S.; Rivest, N. HVDC Monopolar and Bipolar Cage Studies on the Corona Performance of Conductor Bundles. IEEE Trans. Power Appar. Syst. 1984, PAS-103, 84–91. [Google Scholar] [CrossRef]
- Wang, F.; Zheng, H.; Shao, T. Study of the Corona Characteristics and Space Charge Distribution of HVDC Transmission Lines. IEEE Access 2020, 8, 131–137. [Google Scholar]
- Fang, M.; Wang, L.; Zhan, Y. Temperature-Dependent Characteristics of Space Charge Accumulation in Gas-Insulated HVDC Systems. IEEE Trans. Power Deliv. 2022, 37, 2712–2721. [Google Scholar]
- Liu, C.; Zhang, Y.; Zhang, H.; Shi, Q. Effect of Temperature on Corona Discharge and Ion Flow Characteristics in HVDC Substations. IEEE Trans. Power Deliv. 2021, 36, 1692–1700. [Google Scholar]
- Chen, Y.; Zhou, Y.; Jiang, Z. Modeling and Analysis of Corona-Induced Space Charge in Indoor HVDC Test Chambers. IEEE Trans. Dielectr. Electr. Insul. 2022, 29, 2201–2209. [Google Scholar]
- Yi, Y.; Zhang, C.; Wang, L. Positive DC corona inception on dielectric coated stranded conductors in air. IET Sci. Meas. Technol. 2016, 10, 557–563. [Google Scholar] [CrossRef]
- Bas-Calopa, P.; Riba, J.R.; Moreno-Eguilaz, M. Measurement of corona discharges under variable geometry, frequency, and pressure environment. Sensors 2022, 22, 1856. [Google Scholar] [CrossRef]
- Gharaaghaji, S.; Fadil, H.; Ilhan, S.; Ozdemir, A.; Ismailoglu, H.; Cortes, F.E. Corona Inception and Breakdown Voltages of Rod–Plane Electrode for Severe Ambient Conditions. In Proceedings of the 2019 IEEE PowerTech Conference, Milan, Italy, 23–27 June 2019; IEEE: New York, NY, USA, 2019. [Google Scholar]
- Xiao, F.; Zhang, B.; Deng, Y. Experimental Study on Impulse Corona Characteristics of HVDC Conductors With Space Charges. IEEE Trans. Power Deliv. 2021, 36, 1705–1713. [Google Scholar] [CrossRef]
- Zhao, W.; Zhang, J.; Wang, L. Simulation of Space Charge Effect on Electric Field Distribution in DC GIS Under Temperature Variation. IEEE Trans. Plasma Sci. 2020, 48, 3260–3266. [Google Scholar]
- Wang, H.; Liu, J.; Xie, R. Numerical Analysis of Space Charge Effects on HVDC Electric Field Distribution Considering Environmental Parameters. IEEE Trans. Dielectr. Electr. Insul. 2021, 28, 1753–1761. [Google Scholar]
- Djeumen, J.S.; Walker, J.J.; West, N.J. Measurement of space charge distribution in a corona cage under the influence of different atmospheric conditions. In Proceedings of the 2018 IEEE International Conference on High Voltage Engineering and Application (ICHVE 2018), Athens, Greece, 10–13 September 2018; p. 107. [Google Scholar]
- Xu, Z.; Li, B.; Wang, D. Temperature Influence on Space Charge Distribution and Breakdown Strength in Epoxy Composites for HVDC Applications. IEEE Trans. Dielectr. Electr. Insul. 2020, 27, 1050–1057. [Google Scholar]
- Djeumen, J.S.; Walker, J.J. Environmental influence on corona inception with HVDC application. In Proceedings of the International Symposium on High Voltage Engineering, (ISH 2017), Buenos Aires, Argentina, 28 August–1 September 2017; pp. 1–6. [Google Scholar]
- Yang, K.; Liu, Q.; Chen, L. Experimental Study on Electric Field Distortion Caused by Corona Discharge in HVDC Chambers. IEEE Access 2021, 9, 78823–78831. [Google Scholar]
- Megala, V.; Karpagam, R.; Sathishkumar, G.K.; Gopinath, B.; Marish Kumar, P.; Deva Brindha, M. Investigation on corona performance of conductors using fabricated indoor corona cage. Mater. Today Proc. 2021, 44, 3652–3656. [Google Scholar] [CrossRef]
- Nayak, M.; Sekhar, K.C. Computation of corona-generated ionic current environment of unipolar UHVDC transmission lines using gas bimolecular collision theory. Electr. Power Syst. Res. 2024, 230, 110204. [Google Scholar] [CrossRef]
- Liu, H.; Liao, R.; Zhao, X.; Lin, Y. Variation of surface electric field intensity determined by space charge density at different temperatures. IEEE Trans. Dielectr. Electr. Insul. 2019, 26, 1660–1668. [Google Scholar] [CrossRef]
- Bian, X.B.; Liming, W.; Zhicheng, G.; Jing, C.; Yingjian, Y.; Xiong, W. Experimental investigation on altitude correction factor of positive dc corona inception voltages of transmission lines based on the mobile corona cage. In Proceedings of the International Conference High Voltage Engineering (ICHVE), New Orleans, LA, USA, 11–14 October 2010; pp. 548–551. [Google Scholar]
- Font, A.; Solak, Y.T.; Ilhan, S.; Ozdemir, A.; Ismailoglu, H.; Cortes, F.E. DC corona characteristics derived from corona cage tests and simulations. IEEE Trans. Dielectr. Electr. Insul. 2019, 26, 1867–1875. [Google Scholar] [CrossRef]
- Zhang, B.; Wang, W.; He, J. Theoretical Study on Radio Interference of HVDC Transmission Line Based on Cage Tests. IEEE Trans. Power Deliv. 2017, 32, 1891–1898. [Google Scholar] [CrossRef]
- Xiao, F.; Zhang, B. Transient Overvoltage on HVDC Overhead Transmission Lines With Background DC Space Charges and Impulse Corona. IEEE Trans. Power Deliv. 2021, 36, 2921–2928. [Google Scholar] [CrossRef]
- Nayak, M.R.; Sekhar, K.C. A Novel Computational Technique to Analyse the Corona Generated Ionized Field Environment of EHV/UHV DC Transmission Lines. Int. J. Emerg. Electr. Power Syst. 2023, 25, 667–674. [Google Scholar]
- Nayak, M.R.; Mujeer, S.A. New Computational Method for Study of Ionic Current Environment of HVDC Transmission Lines. In Proceedings of the 2020 IEEE International Conference on Advances and Developments in Electrical and Electronics Engineering (ICADEE), Coimbatore, India, 10–11 December 2020. [Google Scholar]
- Maruvada, P.S.; Dallaire, R.D.; Héroux, P.; Rivest, N. Corona Studies for Biploar HVDC Transmission at Voltages Between ±600 kV AND ±1200 kV PART 2: Special Biploar Line, Bipolar Cage and Bus Studies. IEEE Trans. Power Appar. Syst. 1981, 100, 1462–1471. [Google Scholar] [CrossRef]
- Smith, J.; Lee, A. High Voltage Direct Current (HVDC) Transmission. J. Energy Nat. Resour. Res. 2023, 5, 45–56. [Google Scholar]
- Kyere, I.K.; Nyamupangedengu, C.; Swanson, A.G. A Comparative Study of Time-Evolution Characteristics of Single and Double Cavity Partial Discharges. Energies 2024, 17, 1905. [Google Scholar] [CrossRef]
- Doe, J.; Zhang, Y. Advancements and Comparative Analysis of High-Voltage Direct Current Transmission Technologies. Int. J. Electr. Power Energy Syst. 2023, 120, 100–110. [Google Scholar]
- Mahamuda, M.; Yoshida, K.; Suzuki, Y.; Murakami, K. Influence of Conductor Temperature on the V–I Characteristic of Corona Discharge in a Coaxial Arrangement: Experiments and Simulation. Energies 2025, 18, 1303. [Google Scholar]
- Sibilant, G. A Study of HVDC Conductor Corona in a Purpose-Built Corona Cage. Master’s Thesis, University of Durban-Westville, Westville, South Africa, 2003. [Google Scholar]
- Swanson, A.; Ijumba, N.; Stephen, R. Experimental Investigation of the Effect of Conductor Temperature on Corona Performance in Overhead Transmission Lines. IEEE Trans. Power Deliv. 2024, 38, 952–960. [Google Scholar]
- He, K.; Gu, J.; Huang, S.; Bian, K.; Ju, Y.; Chen, W.; Lu, J. The Corona Space Charge Distribution of Changji-Guquan ±1100kV UHVDC Transmission Line within the Thundercloud Electric Field. In Proceedings of the 2020 IEEE International Conference on High Voltage Engineering and Application, Beijing, China, 6–10 September 2020. [Google Scholar]
- Pfeiffer, M.; Hedtke, S.; Franck, C. Corona Current Coupling in Bipolar HVDC and Hybrid HVAC/HVDC Overhead Lines. IEEE Trans. Power Deliv. 2018, 33, 393–402. [Google Scholar] [CrossRef]


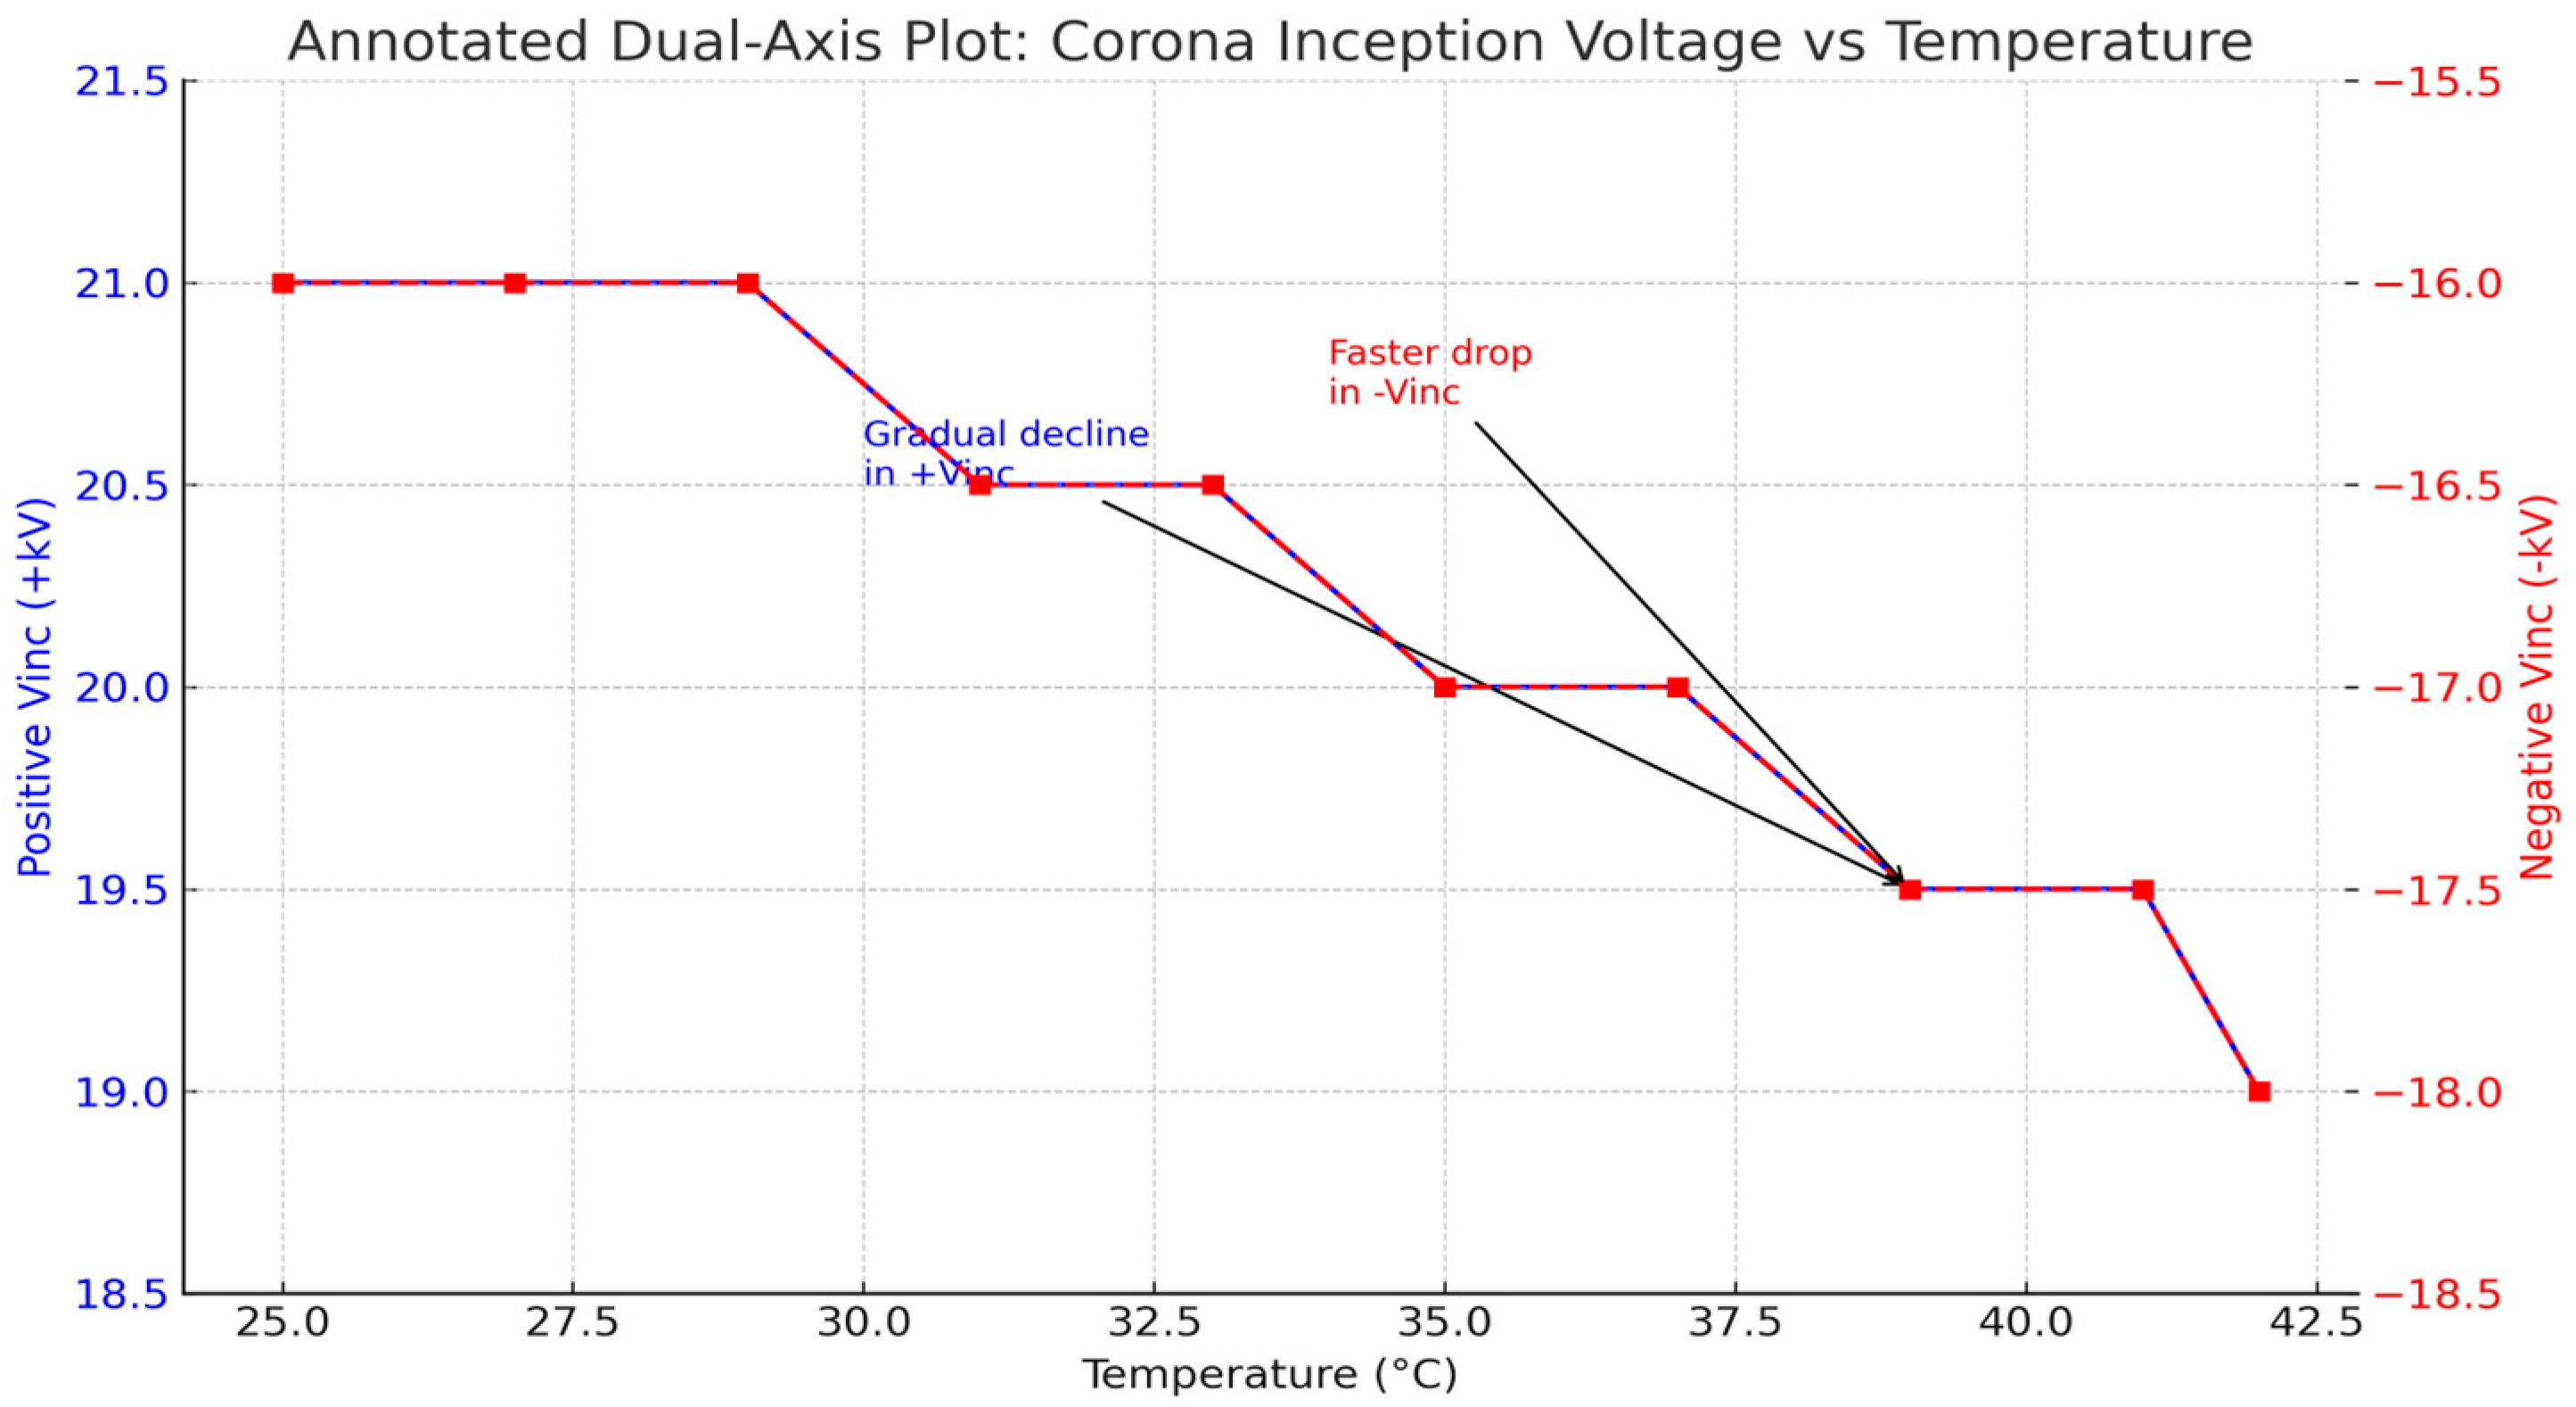
| T (°C) | 25 °C | 27 °C | 29 °C | 31 °C | 33 °C | 35 °C | 37 °C | 39 °C | 41 °C | 42 °C |
|---|---|---|---|---|---|---|---|---|---|---|
| Positive (+Vinc) | +21 kV | +21 kV | +21 kV | +20.5 kV | +20.5 kV | +20 kV | +20 kV | +19.5 kV | +19.5 kV | +19 kV |
| Negative (−Vinc) | −16 kV | −16 kV | −16 kV | −16.5 kV | −16.5 kV | −17 kV | −17 kV | −17.5 kV | −17.5 kV | −18 kV |
| Testing Voltage ±175 kV | |||
|---|---|---|---|
| Positive Voltage (+V) | Negative Voltage (−V) | ||
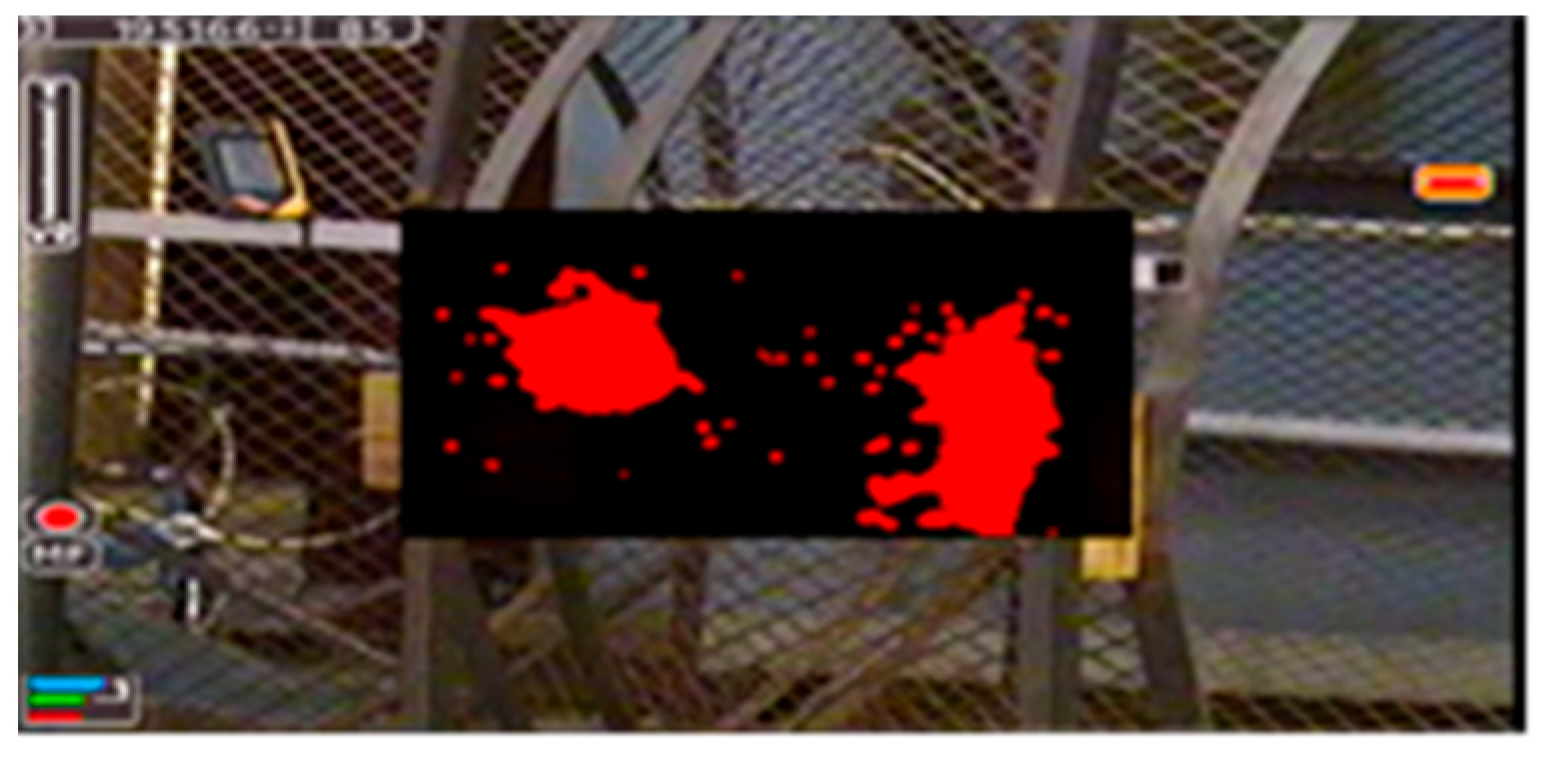
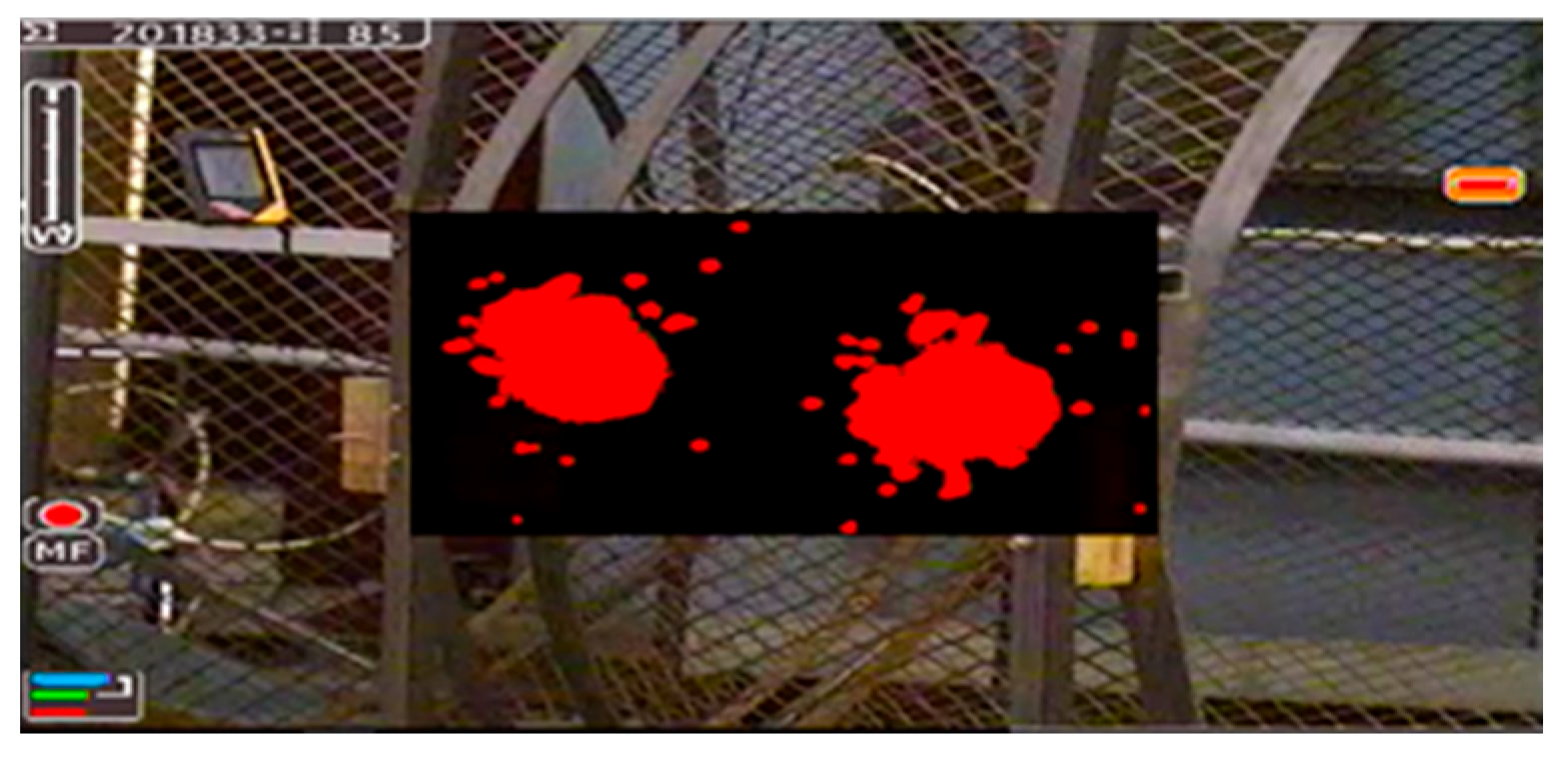
| Indicator Count | Temperature | Indicator Count | Temperature |
| 126,784 | 21 °C | 16,324 | 21 °C |
| 142,283 | 25 °C | 18,316 | 25 °C |
| 195,166 | 30 °C | 27,750 | 30 °C |
| 201,833 | 35 °C | 37,866 | 35 °C |
| 218,483 | 40 °C | 41,370 | 40 °C |
| 133 (breakdown) | 42 °C | 43,250 | 42 °C |
Disclaimer/Publisher’s Note: The statements, opinions and data contained in all publications are solely those of the individual author(s) and contributor(s) and not of MDPI and/or the editor(s). MDPI and/or the editor(s) disclaim responsibility for any injury to people or property resulting from any ideas, methods, instructions or products referred to in the content. |
© 2025 by the authors. Licensee MDPI, Basel, Switzerland. This article is an open access article distributed under the terms and conditions of the Creative Commons Attribution (CC BY) license (https://creativecommons.org/licenses/by/4.0/).
Share and Cite
Djeumen, J.S.; Langa, H.M.; Sutherland, T. Corona-Generated Space Charge Characteristic in an Indoor HVDC Corona Cage Under Atmospheric Temperature Conditions. Energies 2025, 18, 2872. https://doi.org/10.3390/en18112872
Djeumen JS, Langa HM, Sutherland T. Corona-Generated Space Charge Characteristic in an Indoor HVDC Corona Cage Under Atmospheric Temperature Conditions. Energies. 2025; 18(11):2872. https://doi.org/10.3390/en18112872
Chicago/Turabian StyleDjeumen, Jules Simplice, Hendrick Musawenkosi Langa, and Trudy Sutherland. 2025. "Corona-Generated Space Charge Characteristic in an Indoor HVDC Corona Cage Under Atmospheric Temperature Conditions" Energies 18, no. 11: 2872. https://doi.org/10.3390/en18112872
APA StyleDjeumen, J. S., Langa, H. M., & Sutherland, T. (2025). Corona-Generated Space Charge Characteristic in an Indoor HVDC Corona Cage Under Atmospheric Temperature Conditions. Energies, 18(11), 2872. https://doi.org/10.3390/en18112872