Abstract
Focusing on the power consumption of a regional multi-energy system with the characteristics of energy congestion in students’ dormitory buildings in the hot summer and warm winter regions of southern China, a practical regional multi-energy system consisting of three subsystems, namely an integrated screw chiller (ISC), a screw ground-source heat pump (SGSHP), and an air-source heat pump (ASHP), was optimised by the operation control strategy. The system’s power consumption and cooling/heating load characteristics during operation were analysed, and changes in the terminal air-conditioning load were simulated. Based on the dynamic cooling and heating load of the building, a two-stage loading strategy was proposed for optimising the system operation. Taking the load demand matching requirement of the system output and the terminal load demand as constraints, a simulation model of the system was developed using TRNSYS 16 software, and the changes in power consumption and the cooling/heating capacity before and after optimisation were analysed. The results show that the optimised system reduced annual power consumption by approximately 19% and increased condensation heat recovery by about 2.3%. The optimised operation control strategy was aligned well with the terminal cooling and heating demands.
1. Introduction
With the growth of the global energy demand and increasing awareness of environmental protection, multi-energy regional energy systems have attracted significant attention as an efficient, clean, and sustainable energy solution. A multi-energy regional energy system is not a system for a specific energy type, but a framework designed to meet diverse energy demands, including cooling, heating, electricity, hot water, and steam. By optimising energy conversion devices, it transforms local energy sources such as geothermal, natural gas, wind, solar, electricity, and industrial waste heat sources into usable forms. It enhances long-term energy adaptability while maximising environmental and economic benefits [1]. In China, the integration of renewable energy sources into regional energy systems has led to a 30% increase in renewable energy capacity since 2010. China owns 32% of the global renewable energy market, alongside an installed capacity of about 1.26 TW in the first quarter of 2023 [2]. However, China still lacks standardised theories and technical guidelines for implementing regional multi-energy systems. This issue is especially prominent in student dormitory buildings, where research remains limited, and these systems’ potential should be determined through the in-depth analysis of real-time operations and predictions of terminal dynamic cooling and heating loads.
Modern regional energy systems are evolving toward multi-energy coupling by integrating various energy forms. Consequently, numerous scholars have conducted extensive studies. Wang et al. [3] analysed the energy efficiency of various units in a hybrid energy system comprising a ground-source heat pump (GSHP), chiller, and boiler. The study also analysed various control strategies for the cooling tower of the GSHP. Chika et al. [4] studied the long-term operational performance of an energy system in warmer regions of Japan, where an air-source heat pump (ASHP) was used to assist a GSHP. WEST et al. [5] examined a regional multi-energy system in two office buildings in Australia; it comprised a central chiller, a gas-fired boiler, and other heating, ventilation, and air-conditioning (HVAC) systems. By developing a mathematical model using historical data, a new optimised control algorithm was designed with the objectives of high comfort and low operating costs and carbon emissions. Alirahmi et al. [6] proposed an energy system integrating geothermal energy and parabolic trough solar collectors, capable of generating electricity, cooling, freshwater, hydrogen, and heat. A multi-objective optimisation genetic algorithm was introduced using dynamic data exchange to enhance the system performance. All these studies indicate that the application of regional multi-energy systems has become practical. However, challenges such as extensive and dispersed energy-demanding areas, diverse user groups, and inconsistent user characteristics (e.g., different usage times and peak loads) still remain. Thus, every individual regional multi-energy system has to customise its operational strategy and tailor its specific conditions and terminal energy demand.
A feasible approach to these challenges is to develop a theoretical model of the building energy system that optimises operational strategies by analysing energy consumption and carbon emissions. Tang et al. [7] proposed an optimal scheduling model for a regional integrated energy system that incorporated carbon trading costs and dynamic demand response to enhance energy efficiency. Kavei et al. [8] developed a long-term energy planning model based on the local characteristics of energy carriers in both production and consumption. Yang et al. [9] proposed an optimal scheduling strategy considering privacy protection and low-carbon demand response. The pricing factors were used to guide stakeholders to reduce carbon emissions while avoiding unnecessary increases in operational costs due to indiscriminate carbon reduction. Lu et al. [10] proposed a two-stage optimisation strategy to address supply–demand imbalance, considering the demand response and the uncertainties of photovoltaic (PV) and wind power generation. Jiao et al. [11] developed a regional energy system (RES) management model and a coordinated optimisation strategy for shared energy storage systems to minimise investment and operational costs.
Moreover, the operation of regional energy systems is a long-term process. Many scholars employed simulation modelling to evaluate the actual operational performance of these systems. Some examples of representative simulation software are EnergyPlus [12], MATLAB [13], Fluent [14], and TRNSYS [15]. TRNSYS, because of its modular approach, is one of the most flexible simulation tools for analysing building energy consumption. Table 1 shows the comparison of TRNSYS with other commonly used Simulation software. Zeyu Dai et al. [16] conducted simulations of multiple GSHP systems using TRNSYS and demonstrated that increasing the average part–load ratio was more energy-efficient compared to the traditional average load method. Wang X [3] redesigned a GSHP-Chiller-Boiler system and compared it with the original Chiller-Boiler system using TRNSYS. The results showed that the annual electricity consumption of the renovated system was reduced by 21% compared to the original one. Korichi et al. [17] used TRNSYS modelling to reduce the energy consumption in a residential building in the Sahara Desert, where a GSHP is coupled with a horizontal geothermal heat exchanger (GHE). Wang et al. [18] used TRNSYS to simulate an existing heating and hot water system, demonstrating the feasibility of converting a traditional fossil-fuel-based heating system into a PV-driven hot water heat pump system. Saleem et al. [19] used TRNSYS to analyse the performance of an energy system integrating reversible heat pumps with thermal storage and compared it with a gas boiler system. The results showed that the reversible heat pump system used 1.15–2.34 times less energy per month for the same heat demand. Fu et al. [20] performed a dynamic TRNSYS simulation of a water-source heat pump system using the Hai River as a heat source. The study confirmed a strong correlation between the coefficient of performance (COP) of the heat pump unit and the Hai River water temperature. Therefore, conducting simulation models for energy systems is an economical and rapid means of system optimization. The above studies mainly focus on simulating the performance of different systems for comparison, redesigning existing systems, or optimizing operation strategies using TRNSYS. However, most of the application scenarios involved only a single residential building with a single heat source. For more than one building in campus where the usage of air conditioning and hot water is highly concentrated in specific hours, research on multi-source energy station systems—particularly in terms of energy usage patterns, refined load matching operation, and system energy dispatch—is still very limited.

Table 1.
Comparison of TRNSYS with other commonly used simulation software.
This study investigates a centralised system for cooling, heating, and hot water supply in six student dormitory buildings in Nanning, China. The system exhibited the characteristics of energy congestion because of the student users’ daily routine, which involved almost zero energy consumption during work hours and maximum energy consumption during off-work hours. The study analyses the load characteristics of the practical regional multi-energy system by measuring its operating load. A TRNSYS-based optimisation model was developed to simulate dynamic optimisation strategies. In order to deal with energy congestion, the study proposes a two-stage loading strategy to optimise dynamic air-conditioning load operations. The effectiveness of the optimised operational strategy for the regional multi-energy system was validated and energy-saving benefits were proved through simulation analysis. The strategy addressed optimisation challenges in the operation of regional multi-energy systems by effectively reducing electricity costs and improving energy efficiency.
The main contributions are as follows:
- (1)
- This study investigates a practical regional multi-energy system with the characteristics of energy congestion.
- (2)
- A TRNSYS-based optimisation model is developed to simulate dynamic optimisation strategies to reduce the actual monitoring data collection and analysis.
- (3)
- A two-stage loading strategy is proposed for optimising the system operation.
The structure of this paper is arranged as follows. Section 1 discusses the research background and current status of district energy systems. Section 2 outlines the operating principles and evaluation indicators of the multi-source district energy system. Section 3 analyses the system power consumption of air conditioning. Section 4 simulates the cooling and heating loads of the student dormitory buildings and proposes an optimized operation strategy based on dynamic loads. Section 5 analyses the system simulation results by comparing the optimized operation strategy with the original strategy.
2. Materials and Methods
2.1. Overview of Multi-Source Regional Energy Systems
The regional multi-energy system was located in Nanning, China (south of the Tropic of Cancer), which is a region with hot summers and warm winters. It provided cooling in summer, heating in winter, and hot water for six student dormitory buildings (C1–C6) at a university. The dormitory buildings had similar layouts, with 1021 rooms, and they accommodated about 4368 residents, with a total air-conditioning area of 3250 m2. During the summer, the regional multi-energy system for cooling is mainly composed of chillers, two screw ground-source heat pumps (SGSHPs), and the corresponding cooling towers. Additionally, a plate heat exchanger (PHE) was added to recover heat from the condenser to heat domestic hot water. Given Nanning’s short winter, heating is primarily achieved by eight air-source heat pumps (ASHPs), with the two ground-source heat pumps supplying domestic hot water. Table 2 shows the system equipment’s parameters, and Figure 1 illustrates the operational principle of the regional multi-energy system.
Table 2.
System equipment’s parameters.
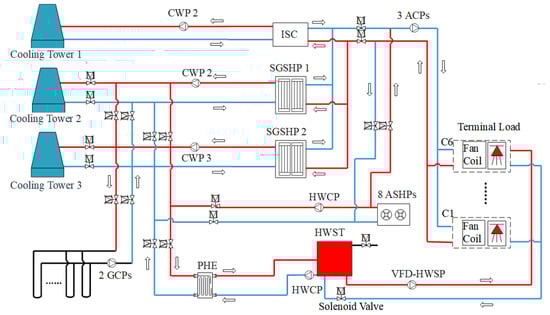
Figure 1.
Operational principal diagram of the regional multi-energy system.
The student dormitory buildings exhibited typical characteristics of energy congestion due to students’ daily routines. The air conditioning was used from 12:00 to 14:00, 17:00 to 19:00, and 21:00 to 7:00 the next day. The hot water was used from 6:00 to 7:30, 12:00 to 14:00, 17:00 to 19:00, and 21:00 to 0:30 the next day. Therefore, as energy consumption is tight during the peak period, it is necessary to optimise the operation strategies of the equipment to improve the system’s energy efficiency and reduce stress and failure rates.
2.2. System Parameters and Evaluation Indicators
- 1.
- The unit instantaneous cooling/heating capacity Q (kW) is
- 2.
- The electric power W (kW) is
- 3.
- The unit cooling/heating coefficient of performance COPj is
- 4.
- The system cooling/heating coefficient of performance COPs is
- 5.
- Part Load Ratio PLR:
The ratio of the unit’s actual cooling/heating capacity to its rated cooling/heating capacity is called the unit part load ratio (PLR):
where QR is the actual cooling/heating capacity of the unit (kW), and QE is the rated cooling/heating capacity of the unit (kW).
3. Energy Consumption Analysis of Regional Multi-Energy System
Analysing the energy consumption on both the user and equipment sides of a regional multi-energy system helps us to understand the air-conditioning demand at different periods and determine the short-term and long-term trends in terminal cooling/heating loads. These characteristics can be used to help build load-forecasting models and optimise the operational strategies.
3.1. Cooling Energy Consumption Analysis of Regional Multi-Energy System
3.1.1. Cooling Energy Consumption Analysis of the Whole System
Figure 2 shows the cooling energy consumption of the whole system.
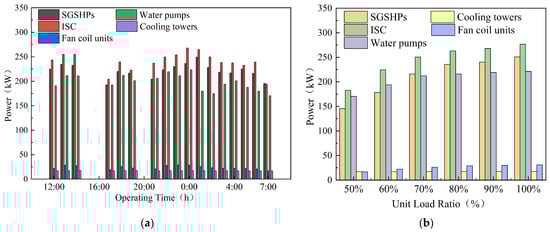
Figure 2.
Cooling power consumption of the whole system. (a) Power consumption of each device during different operating periods; (b) power consumption of each device under different unit load ratios.
The power of units and pumps increased as the unit load rose. When the unit load increased from 50% to 100% (Figure 2b), the power of the SGSHP rose from 145.5 kW to 250.9 kW, with its power share increasing from 27.33% to 31.48%. The power of the ISC increased from 182.8 kW to 276.6 kW, with its power share rising from 34.33% to 34.7%. The power of the water pumps increased from 170.4 kW to 221.2 kW, but their power share decreased from 32% to 27.76%. The power of the cooling towers increased from 17.1 kW to 17.4 kW, and their power share decreased from 3.2% to 2.18%. The power of the fan coil unit increased from 16.8 kW to 30.9 kW, with its power share growing from 3.15% to 3.88%. This indicates that within the unit load ratio range from 50% to 100%, the unit power of the SGSHP and ISC continuously increased, reaching its peak at 100% load. However, when the load ratio was between 80% and 90%, their unit power remained nearly unchanged. Therefore, maintaining a unit load ratio of around 90% can meet cooling demands and improve system energy efficiency.
3.1.2. COP of Each Unit Under Different Loads
With a constant flow of circulating chilled/cooling water in the air-conditioning system, the loading demand of the building’s cooling/heating, which is also represented as a unit load ratio, is the key factor affecting the temperature difference of the supply and return chilled/cooling water. Then, the COPs of units change accordingly.
The SGSHP system included the SGSHPs, water pumps, and cooling towers, while the ISC system included the ISC, water pumps, and a cooling tower. As shown in Figure 3, COPISC increased as the unit load rose. COPISCS gradually increased when the unit load ratio increased from 50% to 90% but slightly decreased when the unit load ratio exceeded 90%. COPISCS reached its peak value of 2.9 at a unit load ratio of 90%. As the unit load ratio increased from 50% to 90%, COPSGSHP and COPSGSHPS increased. However, when the unit load ratio increased from 90% to 100%, both showed a slight decreasing trend. At a unit load ratio of 90%, COPSGSHP and COPSGSHPS reached their maximum values of 4.4 and 3.2, respectively. Therefore, for both the ISC and the SGSHP, the unit and system were most efficient at a unit load ratio of 90%.
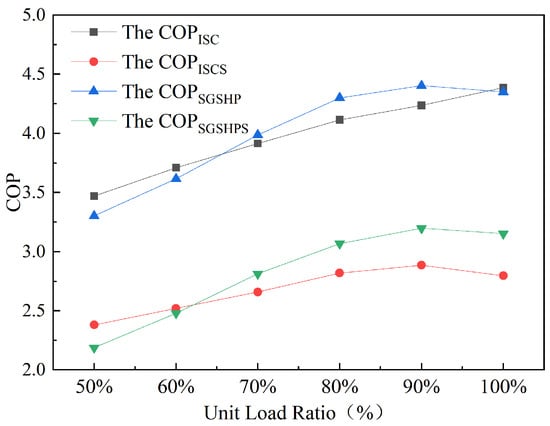
Figure 3.
The relationship between the unit load ratio of units and the COP of units and systems.
3.2. Heating Energy Consumption Analysis of the Regional Multi-Energy System
Figure 4 shows the heat and power consumption of heating. As the unit load increased, the power of the units and pumps rose. When the unit load ratio increased from 50% to 100%, the power of the ASHP rose from 214 kW to 340 kW, with its share of the total system power increasing from 79.35% to 83.6%. The water pump power increased from 48.6 kW to 52.3 kW, but its power share decreased from 18.02% to 12.86%. The power of the fan coil unit increased from 7.1 kW to 14.4 kW, with its power share rising from 2.63% to 3.54%. This indicates that the proportion of the ASHP’s power consumption out of the total power consumption gradually rose, with its unit load ratio continuously increasing from 50% to 100%. Meanwhile, the proportions of the water pumps and fan coil units (FCUs) of the total power consumption decreased significantly. A reasonably higher unit load ratio was recommended for improving the unit operating efficiency.
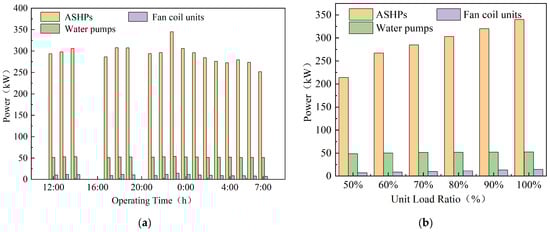
Figure 4.
Heat and power consumption of heating. (a) Power consumption of each device in the regional multi-energy system; (b) power consumption of each device under different loads in the regional multi-energy system.
3.3. Analysis of Cooling and Heating Power Consumption in the Regional Multi-Energy System
Table 3 shows the system’s air-conditioning cooling/heating capacity and consumption. The regional multi-energy system generated approximately 29,927.7 kWh of cooling per day, with a total daily power consumption of about 11,505 kWh for all system devices (excluding the FCUs (Figure 2)), and its average COP was 2.6. Meanwhile, it generated approximately 12,881 kWh of heating per day, with a daily power consumption of about 5862 kWh (excluding the FCUs) and an average COP of around 2.2. There was still significant potential for improvement in the system.
Table 3.
The system’s air-conditioning cooling/heating capacity and consumption.
Figure 5 illustrates the cooling and heating capacity usage at different operating times. The cooling and heating capacity exhibited typical energy congestion characteristics, as described in Section 2.1, with consumption peaks occurring from 12:00 to 14:00 and 22:00 to 00:00.
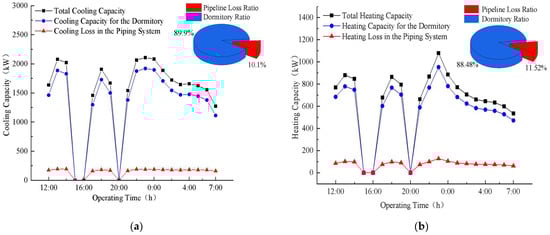
Figure 5.
The cooling/heating capacity usage at different operating times. (a) The cooling capacity usage at different operating times; (b) The heating capacity usage at different operating times.
The total cooling load of all buildings was 5176.5 kWh from 12:00 to 14:00, 4524.8 kWh from 17:00 to 19:00, and 17,198.8 kWh from 21:00 to 7:00 the next day (Figure 5a). The system consumed approximately 11,910 kWh of power per day, of which the units consumed about 7848 kWh, accounting for around 65.9% of the total power consumption. The total water pump power consumption was 3365 kWh, which was significantly higher than that of the cooling towers and terminal air-conditioning equipment, accounting for about 28.26% of the total power consumption. The large proportion of water pump power consumption might be due to the long distance from the dormitory buildings to the units and the extended length of the chilled water distribution pipes. To ensure the supply of chilled water from the units to each dormitory, two ACPs were kept running at all times. Even when the cooling demand of the dormitory buildings was low, both ACPs continued to operate and increased the total water pump power consumption. The cooling load of all buildings closely followed the actual cooling capacity trend of the system, with small fluctuations in pipeline cooling losses. As shown in Figure 5a, the daily cooling efficiency of the dormitory buildings was approximately 89.9%, with pipeline losses of around 10.1%.
For time periods of 12:00 to 14:00, 17:00 to 19:00, and 21:00 to 7:00 the next day, the total heating consumption of all buildings was 2212 kWh, 2075 kWh, and 7110 kWh, respectively. The period from 22:00 to 00:00 reached a peak value for terminal air-conditioning usage. The heating load used by the dormitories was close to the actual heating capacity trend of the system. As shown in Figure 5b, the daily heating efficiency of the dormitory buildings was approximately 88.5%, with pipeline losses of around 11.5%.
The above analysis reveals that the operational strategy of the regional energy system’s air-conditioning cooling and heating can be optimised in two aspects. First, the power consumption of the pump was a large proportion of the total power consumption, and cooling/heating capacity was lost during delivery. Second, it was necessary to match the cooling/heating capacity produced by the system with the users’ demand.
4. Numerical Simulation
The characteristics of the building’s cooling and heating loads are crucial indicators for system design. To better fit the actual engineering operating conditions, a building system model should be established to simulate its cooling and heating load based on the practical system. Then, TRNSYS software can be used to optimise and simulate the operational strategy of the system, including the operational parameters of each device, unit efficiency, and user-side cooling and heating loads.
4.1. Building Cooling and Heating Load Simulation
The cooling and heating loads of the building’s terminal air-conditioning system were simulated and calculated using the Heat Transfer Function (CTF) and thermal balance methods in the DesignBuilder V7.0 software. The main parameters are shown in Table 4. The three-dimensional model of one of the actual buildings is shown in Figure 6.
Table 4.
Building cooling and heating load simulation model parameters in DesignBuilder.
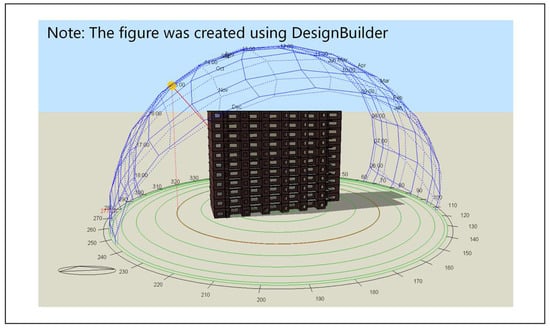
Figure 6.
3D model of one of the dormitory buildings in DesignBuilder.
Since the overall power consumption simulation of the building was not influenced by the indoor layout and structural partitioning [22], indoor spaces were simplified and consolidated during the modelling process. The simulated hourly cooling and heating load of the terminal air-conditioning system throughout the year is presented in Figure 7.
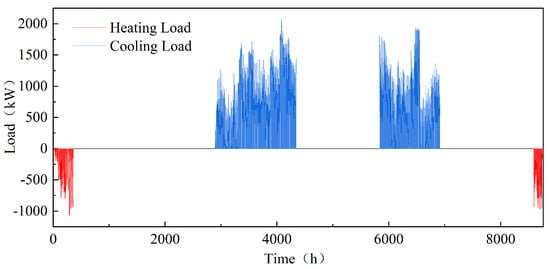
Figure 7.
Hourly cooling and heating load of the terminal air-conditioning system throughout the year.
4.2. Unit Optimisation Operation Control Strategy Based on Dynamic Load
The original operational strategy of the system was relatively simple. When there was load demand at the terminal during the cooling season, both SGSHPs, the ISC, and their corresponding water pumps and cooling towers were activated. During the heating season, eight ASHPs were turned on, and the staff made adjustments based on experience. When the unit load decreased to a certain extent, the staff turned off some cooling equipment, their corresponding cooling towers, and pumps. This operation strategy heavily relied on the experience of the staff.
Since the energy consumption did not significantly change as the unit load ratio increased from 90–100%, a unit load ratio of 90% was selected as the control point for strategy optimisation, and a unit optimisation control strategy was proposed based on the dynamic load, as shown in Figure 8. When the terminal cooling load increased/decreased to intersection point A, turning backup units on/off helped to reduce power consumption; this intersection can be regarded as the threshold for running more/fewer units. However, the criterion for turning backup units on or off only depended on a single value, which may lead to issues such as excess energy supply or deviation from the expected equipment performance. To avoid frequent starts and stops of the units and improve the system operational stability, a delay region [lower limit, upper limit] was added.−
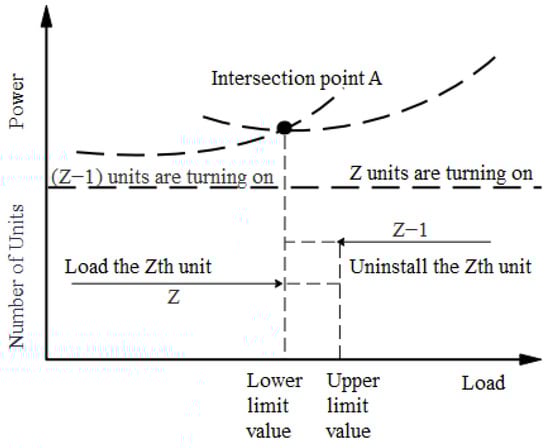
Figure 8.
Unit optimisation control strategy based on dynamic load.
Based on the optimisation control strategy described above, the air-conditioning load/unload sequence for the regional multi-energy system is shown in Figure 9. During the cooling period, a two-stage loading strategy was applied. To be specific, when 90% of QGSHP of one GSHP unit < unit load < 90% of QGSHP of two GSHP units, two GSHP units, ACP 2, and ACP 3 were turned on; when the unit load > 90% of QGSHP of two GSHP units, the ISC was also turned on. During the heating period, the eight ASHPs can be regarded as a single unit, and thus the load of the ASHPs could be adjusted by regulating the flow rate through the air-conditioning water pumps. When the terminal heating load > 50% of the rated heating capacity of the ASHPs, ACP 2 and ACP 3 started to operate simultaneously.
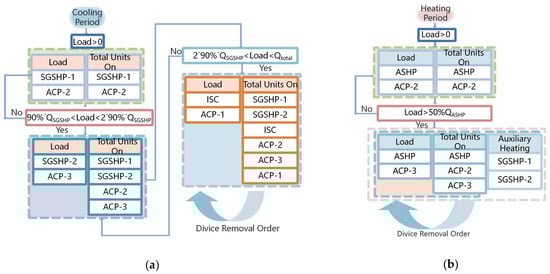
Figure 9.
Unit optimisation control strategy for cooling period and heating period. (a) System control strategy for cooling; (b) system control strategy for heating.
4.3. Simulation Parameters
The simulation parameters set in the TRNSYS system are shown in Table 5.
Table 5.
System parameters in the simulation.
A model for the regional multi-energy system was established using the modular transient simulation software TRNSYS, which was primarily composed of the following modules: chiller unit, heat pump unit, water pump, heat exchanger, terminal air-conditioning, cooling tower, data input module, printing module, integration module, and data processing module. Their corresponding codes and functions are shown in Table 6.
Table 6.
TRNSYS module codes and functions.
4.4. Model Validation
Figure 10 shows the annual temperature variation in cooling and heating water in the air conditioner of the regional multi-energy system. The simulation system uses experimental data as the baseline and adjusts system parameters based on the cooling and heating load obtained from the DesignBuilder model to ensure that the simulated data align with actual conditions. Figure 11 shows the comparison of measured and simulated inlet and outlet water temperatures for randomly selected days during the cooling and heating seasons, respectively.
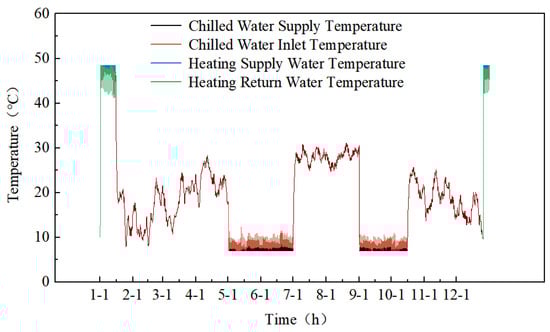
Figure 10.
Annual temperature variation of cooling and heating water in the air conditioner of the regional multi-energy system.
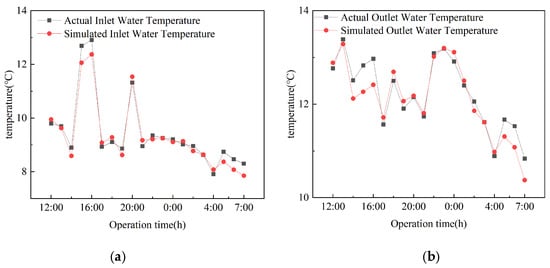
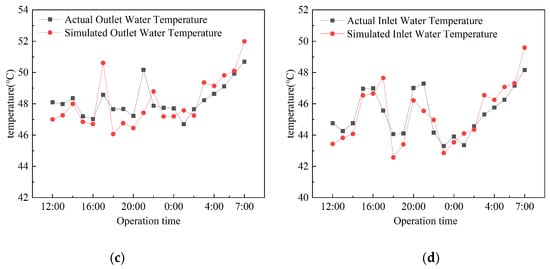
Figure 11.
Comparison of measured and simulated inlet and outlet water temperatures on a random day during the cooling and heating seasons. Comparison of measured and simulated (a) outlet water temperatures during the cooling season; (b) inlet water temperatures during the cooling season; (c) outlet water temperatures during the heating season; (d) inlet water temperatures during the heating season.
4.5. Error Calculation
- 1.
- Absolute Error
- 2.
- Mean Error
- 3.
- Root Mean Squared Error [23]
- 4.
- Coefficient of Determination
After the calculations using the aforementioned formulas, the error calculation results were presented in Table 7.
Table 7.
Error calculation results.
5. System Simulation Results
5.1. Simulation of the Regional Multi-Energy System Under the Original Operation Strategy
Table 8 shows the simulation results of the monthly power consumption of each device in the regional multi-energy system. The power consumption of each device in January, May, June, September, October, and December was determined based on students’ daily schedules.
Table 8.
Monthly power consumption of each device in the district multi-energy system.
5.2. Power Consumption of Each Device Before and After Optimisation
Figure 12 shows the annual running time of the regional multi-energy system before and after optimisation. Under the original operation strategy, the total operating time of the system was 7510 h, while under the optimized operation strategy, it was reduced to 5345 h. After optimisation, the total running time of all units was reduced by 28.83%. Among them, the running time of the ISC was reduced the most, by approximately 80.04%. It indicated that the two-stage loading strategy effectively controls the start-stop cycle of the ISC through the dynamic load. Since GSHP 1 was running first, its reduction in running time was the smallest at only 4.2%. The operation time of GSHP 2 was reduced by approximately 23.84%.
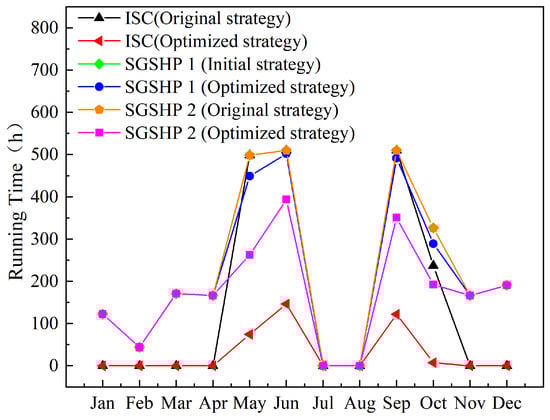
Figure 12.
Annual running time before and after optimisation.
Due to the reduced unit running time under the optimised operation control strategy, the overall system power consumption significantly decreased. Figure 13 shows the monthly power consumption of each device after optimisation. Compared with the original operation strategy, the total power consumption of the optimised system decreased by 18.92%. Meanwhile, the annual power consumption of all units accounted for 76.95% of the total power consumption, which was an increase of 6.68% compared to the original operation strategy. Therefore, the optimised operation control strategy was better aligned with the terminal cooling and heating demands, and more electricity was consumed by the units compared to other auxiliary equipment.
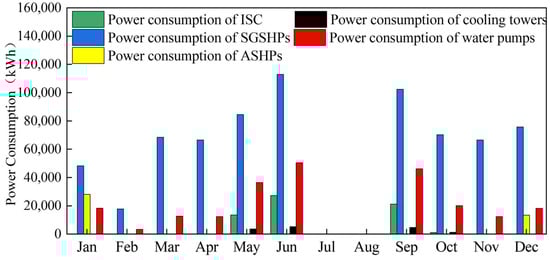
Figure 13.
Monthly power consumption of each device after optimisation.
5.3. Cooling/Heating Capacity of Each Device Before and After Optimisation
Figure 14 shows the annual cooling/heating capacity of each device before and after the optimisation. During the summer, the system’s cooling capacity decreased by approximately 1.83% after optimisation, which was a very small change, but the system still met the terminal load demands while maintaining the initial comfort requirements. During the winter, the optimised system’s heating capacity increased by approximately 0.92% compared to the original operation strategy, which was also a small change in the heating capacity after optimisation; however, the system fully met the terminal load demand. After optimisation, the regional multi-energy system’s condensate heat recovery during the summer increased by 2.33%. Therefore, the optimisation control strategy was more stable and energy saving for the regional multi-energy system.
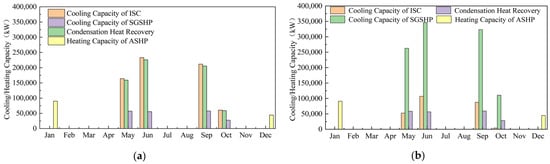
Figure 14.
Annual cooling/heating capacity before and after the optimisation. (a) Annual cooling/heating capacity before optimisation; (b) annual cooling/heating capacity after optimisation.
6. Conclusions
This paper focuses on the optimisation operation control strategy of a regional multi-energy system in dormitory buildings in southern China, characterised by energy congestion during hot summers and warm winters. After the analysis of real system operation experiments and simulation optimisation, the main conclusions are as follows:
- For the practical regional multi-energy system, the power consumption of the units and pumps increased as the unit load increased for air-conditioning cooling. However, the proportion of power consumed by the units increased by 4.15%, while the proportion of the water pump’s power decreased by 4.24%. At a unit load ratio of 90%, COPSGSHP and COPSGSHPS reached maximum values of 4.4 and 3.2, respectively. During system heating, the power consumption of the ASHPs continuously increased for the unit load ratio range of 50–100%, and their share of the total power consumption increased. The proportion of all the water pumps and FCUs of the total power consumption also significantly decreased. A reasonable unit load ratio enhances the unit’s operating efficiency, and 90% was recommended under the conditions in this paper.
- For the practical regional multi-energy system, the daily use of the cooling capacity was approximately 89.76% of the total cooling capacity, with pipeline losses of around 10.24%. The power consumption of the water pumps was significantly higher than that of the regional multi-energy system for heat dissipation and terminal air-conditioning equipment. The daily use of the heating capacity was approximately 88.5% of the total heating capacity, with pipeline losses of around 11.5%.
- The DesignBuilder software was used to simulate the cooling and heating load of the building’s terminal air-conditioning system. Based on the simulation results from DesignBuilder, a two-stage loading strategy for ISC operation based on dynamic loads has been proposed.
- A TRNSYS building simulation model was established based on the optimisation operation control strategy. After optimisation, the total running time of all units decreased by 28.83%, with the chiller unit’s operating time decreasing the most, approximately 80.04%. The total power consumption of the optimised system decreased by about 19%, and the power consumption of all units throughout the year increased by 6.68% compared to the original operation strategy, which indicated that the unit’s operating efficiency was improved. The cooling/heating capacity of the optimised system changed little, and the system still met the terminal load requirements. Furthermore, the condensate heat recovery during the cooling season increased by about 2.3%.
7. Limitations and Future Research
- Due to the limitations of experimental conditions, the data of the system’s annual performance were mainly based on simulation results. Long-term data monitoring should be carried out under permissible conditions to compare the fitting degree between simulation results and measured results, thereby enhancing the reliability of the simulation.
- During certain months of the year, college students stopped using air conditioning but still used the domestic hot water. This paper mainly focuses on the system’s power consumption during the season that the air conditioning was in use. The analysis of the system’s operation should be expanded to domestic hot water coupled with air conditioning in the future.
Author Contributions
Conceptualization, J.F.; methodology, Y.H. (Yubang Hu), J.F. and Y.H. (Yingning Hu); formal analysis, J.F.; investigation, Q.C., S.H.; writing—original draft preparation, Y.H. (Yubang Hu); writing—review and editing, Q.C.; supervision, Q.C.; project administration, S.H.; funding acquisition, Y.H. (Yingning Hu); Validation, Y.H. (Yubang Hu). All authors have read and agreed to the published version of the manuscript.
Funding
This research was funded by Guangxi Science and Technology Major Program of P.R. China, grant number: GuikeAA24263053; Guangxi Science and Technology Program of P.R. China, grant number: GuikeAD25069080.
Data Availability Statement
Research data are not shared.
Conflicts of Interest
The authors declare no conflict of interest.
Abbreviations
| Items | Full name |
| ACP | Air-conditioning pump |
| ACPs | Air-conditioning pumps |
| ASHP | Air-source heat pump |
| ASHPs | Air-source heat pumps |
| ASHPS | Air-source heat pump system |
| COP | Coefficient of performance |
| CT | Cooling tower |
| CTs | Cooling towers |
| CWP | Cooling water pump |
| CWPs | Cooling water pumps |
| FCU | Fan coil unit |
| GCP | Geothermal circulation pump |
| GCPs | Geothermal circulation pumps |
| GHE | Geothermal heat exchanger |
| GSHP | Ground-source heat pump |
| GSHPS | Ground-source heat pump system |
| HVAC | Heating, ventilation, and air-conditioning |
| HWCP | Hot water circulation pump |
| HWST | Hot water storage tank |
| ISC | Integrated screw chiller |
| ISCS | Integrated screw chiller system |
| PHE | Plate heat exchanger |
| PLR | Part load ratio |
| PV | Photovoltaic |
| RES | Regional energy system |
| SGSHP | Screw ground-source heat pump |
| SGSHPs | Screw ground-source heat pumps |
| SGSHPS | Screw ground-source heat pump system |
| VFD-HWSP | Variable frequency drive hot water supply pump |
References
- Han, J.; Zhao, H.; Hu, X. Reliability evaluation of regional integrated energy system considering multiple energy storage resources. In Proceedings of the 2020 IEEE 16th International Conference on Control & Automation (ICCA), Singapore, 9–11 October 2020; pp. 436–441. [Google Scholar]
- Abimbola, S.A.; Wanning, M. The status and potential of regional integrated energy systems in sub-Saharan Africa: An Investigation of the feasibility and implications for sustainable energy development. Energy Strategy Rev. 2024, 53, 101402. [Google Scholar]
- Wang, X.; Li, T.; Yu, Y. Performance simulation and energy efficiency analysis of multi-energy complementary HVAC system based on TRNSYS. Appl. Therm. Eng. 2024, 257, 124378. [Google Scholar] [CrossRef]
- Chika, K.; Mika, Y. Long-term operation analysis of a ground source heat pump with an air source heat pump as an auxiliary heat source in a warm region. Energy Build. 2023, 289, 113050. [Google Scholar]
- West, S.R.; Ward, J.K.; Wall, J. Trial results from a model predictive control and optimisation system for commercial building HVAC. Energy Build. 2014, 72, 271–279. [Google Scholar] [CrossRef]
- Alirahmi, S.M.; Rahmani, D.S.; Ahmadi, P. Multi-objective design optimization of a multi-generation energy system based on geothermal and solar energy. Energy Convers. Manag. 2020, 205, 112426. [Google Scholar] [CrossRef]
- Tang, W.T. Operation optimization of regional integrated energy systems. Energy Sci. Eng. 2023, 11, 4542–4556. [Google Scholar] [CrossRef]
- Kavei, F.A.; Nicoli, M.; Quatraro, F.; Savoldi, L. Enhancing energy transition with open-source regional energy system optimization models: TEMOA-Piedmont. Energy Convers. Manag. 2025, 327, 119536. [Google Scholar] [CrossRef]
- Yang, T.; Wang, Q.C. Low-carbon economic distributed dispatch for district-level integrated energy system considering privacy protection and demand response. Appl. Energy 2025, 383, 125389. [Google Scholar] [CrossRef]
- Lu, M.X.; Teng, Y. A bi-level optimization strategy of electricity-hydrogen-carbon integrated energy system considering photovoltaic and wind power uncertainty and demand response. Sci. Rep. 2025, 15, 18. [Google Scholar] [CrossRef]
- Jiao, X.N.; Wu, J.K. An optimal method of energy management for regional energy system with a shared energy storage. Energies 2023, 16, 886. [Google Scholar] [CrossRef]
- Porsani, G.B.; Casquero-Modrego, N.; Trueba, J.B.E.; Bandera, C.F. Empirical evaluation of EnergyPlus infiltration model for a case study in a high-rise residential building. Energy Build. 2023, 296, 113322. [Google Scholar] [CrossRef]
- Maryam, K.; Hajar, A. Energy and exergy analysis of the transient performance of a qanat-source heat pump using TRNSYS-MATLAB co-simulato. Energy Environ. 2023, 34, 560–585. [Google Scholar]
- Qu, Y.; Wang, F.; Wang, Y.; Wang, P.; Li, T.; Meng, Z.F. Simulation Optimization and Experiment of R1234-ze on the Heat Pump Water Heater Storage Tank. Adv. Mater. Res. 2014, 1051, 828–831. [Google Scholar] [CrossRef]
- Leila, A.; Umberto, B. Dynamic simulation of a hydrogen-fueled system for zero-energy buildings using TRNSYS software. E3S Web Conf. 2023, 396, 04005. [Google Scholar]
- Dai, Z.; Zhang, X.; Liu, J.; Liu, B.; Tang, F. Energy-saving control strategy for the joint operation of multiple ground source heat pumps system based on TRNSYS: A research study. Case Stud. Therm. Eng. 2025, 67, 105834. [Google Scholar] [CrossRef]
- Korichi, S.; Bouchekima, B.; Naili, N. Performance analysis of horizontal ground source heat pump for building cooling in arid Saharan climate: Thermal-economic modeling and optimization on TRNSYS. Renew. Energy Environ. Sustain. 2021, 61, 1. [Google Scholar] [CrossRef]
- Wang, Z.; Luther, M.; Horan, P. Residential space heating electrification through a PV-driven hot water heat pump. Energy Build. 2025, 330, 115319. [Google Scholar] [CrossRef]
- Saleem, A.; Loo, U.E.C. Thermal performance analysis of a heat pump-based energy system to meet heating and cooling demand of residential buildings. Appl. Energy 2025, 383, 125306. [Google Scholar] [CrossRef]
- Fu, H.; Li, J.; Wang, X. Performance analysis of water source heat pump air-conditioning system for Haihe River as heat source. Int. J. Refrig. 2025, 171, 38–50. [Google Scholar] [CrossRef]
- Arif, F.; Khan, A.W. Smart Progress Monitoring Framework for Building Construction Elements Using Videography–MATLAB–BIM Integration. Int. J. Civ. Eng. 2021, 19, 717–732. [Google Scholar] [CrossRef]
- Crawley, D.B.; Lawrie, L.K.; Winkelmann, F.C. EnergyPlus: Creating a new-generation building energy simulation program. Energy Build. 2001, 33, 319–331. [Google Scholar] [CrossRef]
- Hodson, T.O. Root-mean-square error (RMSE) or mean absolute error (MAE): When to use them or not. Geosci. Model Dev. 2022, 15, 5481–5487. [Google Scholar] [CrossRef]


Disclaimer/Publisher’s Note: The statements, opinions and data contained in all publications are solely those of the individual author(s) and contributor(s) and not of MDPI and/or the editor(s). MDPI and/or the editor(s) disclaim responsibility for any injury to people or property resulting from any ideas, methods, instructions or products referred to in the content. |
© 2025 by the authors. Licensee MDPI, Basel, Switzerland. This article is an open access article distributed under the terms and conditions of the Creative Commons Attribution (CC BY) license (https://creativecommons.org/licenses/by/4.0/).