Article

Optimization of Offshore Wind and Wave Energy Co-Generation System Based on Improved Seagull Optimization Algorithm

by
Xiaoshi Zhuang
,
Honglue Wan
,
Dongran Song
*,
Xinyu Fan
*,
Yuchen Wang
,
Qian Huang
and
Jian Yang
School of Automation, Central South University, Changsha 410083, China
*
Authors to whom correspondence should be addressed.
Energies 2025, 18(11), 2846; https://doi.org/10.3390/en18112846
Submission received: 25 April 2025 / Revised: 23 May 2025 / Accepted: 26 May 2025 / Published: 29 May 2025

Abstract

To address the high complexity layout optimization problem of an offshore wind and wave energy co-generation system, an improved seagull optimization algorithm-based method is proposed. Firstly, the levelized cost of electricity (LCOE) model, based on the whole-life-cycle cost, serves as the optimization objective. Therein, the synergistic effect between wind turbines and wave energy generators is taken into consideration to decouple the problem and establish a two-layer optimization framework. Secondly, the seagull optimization algorithm is enhanced by integrating three strategies: the nonlinear adjustment strategy for control factors, the Gaussian–Cauchy hybrid variational strategy, and the multiple swarm strategy, thereby improving the global search capability. Finally, a case study in the South China Sea validates the effectiveness of the model and algorithm. Using the improved algorithm, the optimal layout of the co-generation system and the optimal wind turbine parameters are obtained. The results indicate that the optimized system achieves a LCOE of 0.6561 CNY/kWh, which is 0.29% lower than that achieved by traditional algorithms. The proposed method provides a reliable technical solution for the economic optimization of the co-generation system.

1. Introduction

With the continuous advancement of marine development, the rational development and utilization of marine renewable resources with abundant energy storage, which are low-carbon and clean, has become an inevitable route for energy transformation [1]. However, challenges persist: harsh operating environments, difficulties in installing and maintaining equipment, and high submarine cables costs impede progress [2]. In addition, the development of marine renewable energy is also affected by complex marine environments, such as extreme weather, seawater corrosion, and the need for protection of marine ecosystems [3]. These technical and economic barriers collectively elevate system complexity, escalate development costs, and hinder large-scale commercial deployment. Against this backdrop, the integrated development of co-generation systems, featuring infrastructure sharing, synergistic effects, and other benefits, has emerged as an inevitable trend in marine resource development [4].
According to the International Renewable Energy Agency (IRENA), the installed capacity of offshore wind and wave energy is projected to reach 2000 GW and 350 GW, respectively, by 2050, accounting for over 12% of global energy supply [5]. When integrated with offshore wind power development, wave energy exhibits distinct advantages. Firstly, offshore wind–wave co-generation systems enable the sharing of infrastructure such as mooring systems, electrical infrastructure and other components [6]. Secondly, wind and wave energy utilize the same ocean space, thereby enhancing the efficiency of the development of resources per unit of sea area [7]. Thirdly, through a rational layout, wave energy power generation devices are able to effectively utilize the wave energy of the sea area while safeguarding wind turbine generator systems (WTGs), mitigating the direct impact of strong waves. This masking effect enhances the operational stability of WTGs, leading to a significant reduction in operation and maintenance costs and risks [6]. Owing to these advantages, the joint development of offshore wind and wave energy has emerged as a cutting-edge research topic [8], with enhancing the economic viability of the co-generation system being a key research challenge.
Currently, the majority of studies on the design of offshore wind and wave energy co-generation systems are conducted in specific sea areas or fixed power generation devices. For instance, Astariz et al. [9] evaluated decade-long wind–wave data from Danish coastal waters, demonstrating a 3.4% increase in energy yield per unit area and a 58% reduction in downtime compared to standalone wind farms. Similarly, Ragab et al. [10] identified that, in the Mediterranean Sea region of Egypt, under the conditions of specific wind turbines and wave energy generators, a non-uniformly distributed array layout yields the best performance, and on this basis, an optimal staggered layout of devices was proposed. Nevertheless, existing studies predominantly concentrate on the European and North American seas, and there is currently no research that addresses the system design for China’s marine conditions.
The system design of an offshore wind and wave energy co-generation system mainly encompasses two aspects: system cost modeling and optimization algorithm design. In terms of system cost modeling, Astariz et al. [11] proposed the levelized cost of energy (LCOE) model for offshore wind and wave energy co-generation systems, which was further refined in [12]. However, this model has two limitations: overlooking the dominant impact of the initial capital investment for the offshore wind turbine in the total costs, as well as the large effect of the design parameters of offshore wind turbines on the total power generation. In the context of optimization algorithms, the co-location layout of offshore wind and wave energy co-generation systems presents a complex multi-objective optimization problem. WEI et al. [13] used genetic algorithms to optimize the design of the relative layout topology of wave-energy-generating devices on existing offshore WTGs, in which the proposed two-tiered optimization framework rudimentarily decoupled the layout problems of WTGs and wave energy devices but did not fully consider the influence of WTG parameters on total power generation and cost. In addition, the research on layout optimization for a single offshore wind farm is relatively mature. For example, Tao et al. proposed a binary particle swarm optimization algorithm for solving the configuration and topology of the optimal layout of offshore wind turbines [14], and Sinvaldo et al. utilized a flash multi-objective optimization algorithm to solve the problem by considering the annual power generation of offshore wind farms, the surface of the field, and the wake effect at the same time [15]. However, the layout optimization problem of a co-generation system is more complex than the layout optimization of a single-generation system, as it necessitates consideration of the interactions between WTGs and wave energy devices, the wake effect, the masking effect, and the key parameters of WTGs.
The economy of the offshore wind–wave co-generation system is predominantly influenced by the layout and key parameters of WTGs. On the one hand, via a rational relative layout, WTGs can leverage the masking effect to reduce their own operation and maintenance costs; on the other hand, the key parameters of WTGs, such as the rotor radius and the rated power, determine the power generation capacity of the WTGs and the various costs. Therefore, this study considers the optimization of the layout parameters of WTGs and wave power generators, as well as the parameters of WTGs, with the aim of enhancing the economic viability of the co-generation system. Compared with existing studies, the main contributions of this work can be summarized as follows:
  • It establishes a full life-cycle parametric cost model for an offshore wind and wave energy co-generation system applicable to China’s sea area, along with an LCOE model for the entire co-generation system and an LCOEwind model for the wind energy part, in order to evaluate the economic performance of the co-generation system more accurately.
  • A two-layer layout optimization framework is constructed by integrating the wake effect model, the masking effect model and the wind and wave conditions, which successfully decouples the complex problem and improves the solving efficiency of the optimization problem.
  • An improved seagull optimization algorithm (ISOA) is proposed to effectively solve the multi-peaked non-convex problem of optimization of offshore wind and wave energy co-generation systems, improving the global and local search capabilities of the algorithm to avoid falling into local optimal solutions.
  • The layout optimization of the offshore wind and wave power co-generation system is completed under the determined wind and wave conditions in the South China Sea. The results verify the reliability of the two-layer optimization framework and the effectiveness of the improved seagull optimization algorithm.

2. Two-Layer Optimization Framework for Offshore Wind and Wave Energy Co-Generation Systems

2.1. Levelized Cost of Electricity (LCOE) Model

The levelized cost of electricity (LCOE) of the offshore wind and wave energy co-generation system is an effective parameter for assessing the economics of the project, and it can be expressed as follows:
L C O E = A P C A E P
where APC is the annual production cost of the offshore wind and wave energy co-generation system, and AEP is the annual electricity production.

2.1.1. AEP Modeling

The annual power generation (AEP) of the co-generation system can be expressed as follows:
A E P = N T u r b i n e A E P w i n d + N W E C A E P w a v e
where NTurbine and NWEC denote the number of offshore wind turbines and wave energy generators in the co-generation system, respectively; AEPwind is the annual power generation of offshore wind turbines in the field area; AEPwave is the annual power generation of wave energy generators.
The annual power generation of offshore WTGs can be expressed as follows:
A E P w i n d = 0 h y e a r η T u r b i n e P ( v ) f ( v ) d v
where hyear denotes the number of hours in a year, which is 8760; ηTurbine denotes the actual application rate of WTGs, set as 0.83 here [16]; P(v) denotes the power curve of offshore WTGs, and f(v) is the wind speed distribution function.
The relationship between wind speed and the power output of WTGs can be described by the function P(v) [17], which is expressed as follows:
P ( v ) 0                                                                             v < v i P r T u r b i n e ( C p , max / C p r ) ( v / v r ) 3                     v i v < v u P r T u r b i n e ( C p , max / C p r ) ( v / v r ) 3 i = 0 n a i v i     v u v < v r P r                                                                           v r v < v o 0                                                                             v o < v
where PrTurbine denotes the rated power of offshore WTGs; vi and vo denote the cut-in and cut-out speeds, respectively; vu is the upwind speed of offshore WTGs; vr denotes the rated speed of offshore WTGs; Cpr is the power coefficient of the rated wind speed; and Cp,max denotes the maximum power coefficient.
The following relationship exists between the power coefficient at the rated wind speed and the maximum power coefficient:
C p r = C p , max i = 0 n a i v r i
The rated speed and the upwind speed of the offshore WTGs are calculated using the following equations:
v r = ( 2 P r T u r b i n e / ( ρ π R 2 C p , max ) ) 1 / 3
v u = min ( ω r , 2 T g r N G e a r b o x λ o p t 3 / ρ w i n d π R 5 C p , max ) R / λ o p t
where ρwind denotes the air density of the site where the wind farm is located; ωr denotes the rated rotor speed of the offshore WTGs; λopt stands for the optimal tip speed ratio; NGearbox stands for the gearbox ratio; Tgr is the rated generator torque; and R is the rotor radius.
The annual power output of a wave energy generator can be expressed as follows:
A E P w a v e = h y e a r η W E C P ( H S )
where P(Hs) denotes the power response of the wave energy device and ηWEC denotes the energy conversion efficiency of the wave energy generator.
The output power of a single wave energy generator is approximated by calculating the available raw wave energy based on the wave period and effective wave height [12], which is calculated as follows:
P W E C = 1 2 ρ w a t e r g 2 0 S w ( ω ) d ω ω
where ρwater is the density of seawater in the area where the site is located; g is the acceleration of gravity; ω is the frequency of the wave; and Sw(ω) represents the wave spectrum.
The wave energy period Te is calculated as follows:
T e = 2 π m 1 m 0
where mn (n = −1, 0) represents the nth order spectral moment, which is calculated as follows:
m 0 = 0 S w ( ω ) d ω = 16 H s 2 m 1 = 0 S w ( ω ) ω d ω
where m0 represents the 0th order spectral moment, and Hs is the effective wave height.
Substituting Equations (10) and (11) into Equation (9) yields the expression of P(HS) as follows:
P ( H S ) = 1 64 π ( ρ w a t e r g 2 H s 2 T e )
Moreover, in engineering practice, Te can be calculated using the following empirical equation:
T e = 1.14 T m o l
where Tmol is the average wave period of the wave.

2.1.2. APC Modeling

The annual production cost APC can be expressed as an annual average conversion of the full life cycle cost model. The full life cycle cost COSTlife includes the costs of project feasibility analysis and planning and investigation, project design, field installation and construction, operation and maintenance, and plant decommissioning [18]. It can be divided into the total initial investment cost CICC, the operation cost COperation, and the decommissioning cost CDe, and they are calculated as follows:
COST life = C ICC + C Operation + C De
By introducing a fixed rate factor for annual discounting of COSTlife, APC is calculated as follows:
A P C = F C R ( C ICC + C De ) + C Operation
where FCR is a fixed-rate coefficient with a value of 0.1158 [19], used for annual discounting of initial investment costs and decommissioning costs.
The total initial investment cost CICC is divided into the planning and design phase and the construction phase costs. The planning and design phase cost can be estimated as 12% of all capital cost expenditures of the project [12]. Among these, the cost of the wave energy farm is approximately 10% of all capital cost expenditures of the project [20]. The construction phase costs mainly include the construction and installation costs of the wave-energy-generating unit, offshore wind turbine component costs, offshore platform infrastructure construction and installation costs, port operation costs, submarine cable costs, and substation construction costs.
The construction cost of a wave energy generator, CBuildWEC, can be expressed as follows:
C B u i l d W E C = m W E C C W E C u n i t + C W E C s y s t e m + C W E C m o o r i n g
where mWEC is the total weight of the wave energy generator; CWECunit is the cost of materials per unit mass; CWECsystem is the total power output system cost; and CWECmooring is the cost of mooring the wave energy generator, which can be expressed as follows:
C W E C m o o r i n g = 9.81 L d 2 K C u n i t
where L is the mooring chain’s total length, which is generally set as 4 times of the water depth; d is the diameter of the anchor chain; K is a constant with a value of 0.0219 [20]; and Cunit is the cost per unit mass.
The installation cost of wave energy generator, CWECInstallation, is expressed as follows:
C W E C I n s t a l l a t i o n = C u n i t I n s t a l l N W E C
where CunitInstall is the installation cost of a single wave energy generator.
The cost of WTG components mainly depends on three key parameters of WTGs: impeller radius R, rated power PrTurbine and hub height H. According to the research of the European Wind Energy Association, the functional relationship between R and H can be expressed as follows [21]:
H = 2.7936 ( 2 R ) 0.7633
Referring to the parametric cost model of WTGs proposed by previous researchers [22], the exchange rate conversion, and partial sales’ data reports of domestic WTGs from various manufacturers over the past five years, etc., the relationship between the cost of each component and the unit parameters can be presented in Table 1, where the sum of the costs in the table represents the cost of a single wind turbine unit.
The cost of the offshore platform’s infrastructure construction and installation depends on PrTurbine, and the cost formula for each component is shown in Table 2.
The cost of port operations, Cport, depends on the total installed capacity [23] and can be expressed as follows:
C p o r t = 132 ( P r T u r b i n e N T u r b i n e + P r W E C N W E C )
where PrWEC denotes the rated power of the wave energy generator.
The cable cost comprises the 1 kV low voltage cable cost, CCable_lv, for the connection between the wave energy generation unit and the offshore WTGs, the 35 kV medium voltage cable cost, CCable_array, for the power pooling between the offshore WTGs, and the 220 kV export cable cost, CCable_ex, for the transmission power from the offshore substation to the land-based substation. The calculations can be expressed as follows [13,24]:
C C a b l e _ l v = 134 l T W
C C a b l e _ a r r a y = 1800 l a r r a y
C C a b l e _ e x = 5800 l E x p o r t
where lT-W represents the total length of the connecting low-voltage cables between each offshore wind turbine and each wave energy generator, larray is the total length of the connecting cables for the power pooling between each offshore wind turbine, and lExport is the total length of the cables for delivering power from the offshore substation to the onshore substation.
The substation cost includes the offshore-sub and onshore-sub costs, which can be expressed as costs proportional to the total installed capacity. It has been shown that the cost of an offshore substation is approximately twice as much as that of an onshore substation [25], as given by the following equations:
C o f f s h o r e s u b = 865 P r T u r b i n e N T u r b i n e + P r W E C N W E C
C o n s h o r e s u b = 432 P r T u r b i n e N T u r b i n e + P r W E C N W E C
COperation mainly consists of the project operation and maintenance cost, CO&M, and the project insurance cost, CInsurance. The calculation formula for COperation is as follows:
C O p e r a t i o n = C O & M T u r b i n e + C O & M W E C + C I n s u r a n c e T
where CO&MTurbine is the operation and maintenance cost of the offshore wind turbine; CO&MWEC is the operation and maintenance cost of the wave energy generator; T is the design life of the offshore wind and wave energy co-generation system, typically set at 20 years.
The equations of CO&MTurbine and CO&MWEC are as follows:
C O & M T u r b i n e = π C f i x e d T u r b i n e + k g r i d A E P w i n d N T u r b i n e
C O & M W E C = π C f i x e d W E C + k g r i d A E P W E C N W E C
where CfixedTurbine is the fixed maintenance cost of the offshore wind turbine; kgrid is the operation and maintenance parameter, set as 0.12 here [22]; CfixedWEC is the fixed maintenance cost of wave energy generator.
It is noteworthy that in the offshore wind–wave co-generation system, the masking effect of wave energy generators on offshore WTGs extends the WTG O&M weather window, potentially reducing O&M costs by approximately 25% [11].
The operation and maintenance cost of offshore wind turbines after deploying wave energy generators is denoted as CO&MTurbine_WEC. By introducing the maintenance cost saving effect coefficient β, the calculation formula for CO&MTurbine_WEC is expressed as follows:
C O & M T u r b i n e _ W E C = β 1 H R F / 100 C O & M T u r b i n e
where HRF refers to the percentage reduction in significant wave height at the location of offshore wind turbines in the field [26].
The CInsurance cost of the project can be calculated as 2% of the O&M cost [12,27], with the following calculation formula:
C I n s u r a n c e = 0.02 C O & M
The decommissioning cost CDe primarily encompasses the cost of dismantling the equipment, such as offshore wind turbines and wave energy generators and power system, as well as the cost of cleaning up the marine site [25], which can be estimated by the overall cost. The decommissioning cost of co-generation system ranges from 0.0017% to 3% [12]; in this study, 3% is adopted, and thus CDe can be expressed as follows:
C D e = 0.03 C O S T l i f e

2.1.3. Modeling of Wind Partial Cost of Electricity LCOEwind

The whole-life-cycle cost COSTlife can be divided into the wind energy part and wave energy part. By allocating the common cost of the two parts according to the proportion of installed capacity, the cost of the wind energy part, Cwind, which can be regarded as the cost of establishing an independent wind farm, is calculated as follows:
C wind = C ICC _ wind + C Operation _ wind + C D _ wind
where CICC_wind is the initial investment cost of the offshore wind energy part; COperation _wind is the operation cost of the offshore wind component; CD_wind is the decommissioning cost of the offshore wind component, accounting for 3% of Cwind.
The expression for CICC_wind is as follows:
C I C C _ w i n d = C P r e _ w i n d + C B u i l d T u r b i n e + C p o r t _ w i n d + C C a b l e _ e x + C C a b l e _ a r r a y + C o f f s h o r e _ s u b + C o n s h o r e _ s u b
where CPre_wind is the pre-installation cost of the offshore wind component.
The expression for COperation_wind is as follows:
C O p e r a t i o n _ w i n d = ( C O & M T u r b i n e + C I n s u r a n c e _ w i n d ) T
where CO&MTurbine is the O&M cost of the offshore wind turbine; CInsurance_wind is the insurance cost for the offshore wind component, which can be calculated by CO&MTurbine, and accounts for 12% of the offshore wind partial capital cost expenditures.
Consequently, the cost of electricity for the wind component, LCOEwind, can be expressed as follows:
LCOE wind = F C R · ( C ICC _ wind + C D _ wind ) AEP wind + ( C O & M T u r b i n e + C I n s u r a n c e _ w i n d ) AEP wind

2.2. Design Variables

As revealed by Equations (3)–(7), the blade rotor radius R and the rated power PrTurbine significantly influence the annual WTG power generation. According to Table 1, R and PrTurbine also impact the initial investment cost [22], thereby affecting the LCOE. The layout parameters of the WTGs and wave power generators determine the magnitude of the wake effect, which, in turn, affects the input wind speed of downstream units and thus reduces the AEPwind. Simultaneously, the layout parameters govern the extent of the masking effect, as illustrated by Equation (29). The masking effect reduces wave height and subsequently cuts down the O&M costs. After comprehensive consideration, the design variables are selected as the rotor radius R, the rated power PrTurbine, and the layout parameters (xT,yT), (xW,yW) of WTGs and wave energy generators.

2.3. Two-Layer Optimization Framework and Optimization Objective Function

The optimization objective of the offshore wind and wave energy co-generation system is to minimize its LCOE. This can be accomplished through two strategic approaches: boosting power generation and cutting costs. For the wind turbines, the layout design aims to minimize the impact of the wake effect, effectively maximizing wind energy capture; in terms of wind turbine parameter selection, for which it is necessary to pursue higher power generation capacity while keeping costs under control. Regarding the layout of the wave energy generators, the goal is to maximize the impact of the masking effect on offshore wind turbines while simultaneously reducing costs.
The determination of the optimization framework also takes into account the following factors: Firstly, in the current stage of implementing offshore wind and wave energy co-generation systems, due to factors such as technology maturity, resource characteristics, and power generation efficiency, the power generation capacity of wind energy is significantly larger than that of wave energy [13]. Therefore, ensuring larger wind energy capture is more conducive to reducing the LCOE of the co-generation system. Secondly, the height of the wave energy generators is much lower than the hub height of the offshore WTGs; so, the impact of wave energy generators on the WTGs’ wind energy capture can be neglected. Lastly, the optimal array of offshore WTGs is arranged perpendicular to the main wind direction theoretically, and the downstream WTGs in the wind farms are often located in the far wake of the upstream WTGs. The geometric parameters of the rotor have a negligible influence on this region [28], i.e., the parameters of WTGs have a relatively small impact on the layout of WTGs.
In conclusion, the optimization of the offshore wind and wave energy co-generation system is a complex multi-peak non-convex problem. By decoupling the problem during the computational solution, the computational cost can be reduced. Incorporating the considerations discussed above, a two-layer optimization framework is proposed:
(1)
The first-layer optimization objective is to minimize the LCOEwind. Since different WTG parameters correspond to different optimal turbine layouts, it is necessary to optimize the turbine parameters simultaneously during the first-layer optimization. The first-layer optimization variables are the WTG layout parameters, R and PrTurbine. The first-layer objective function, Yfirst, is as follows:
Y f i r s t min = min L C O E w i n d ( R , P r T u r b i n e , ( x T , y T ) ) s . t . ( x T i x T j ) 2 + ( y T i y T j ) 2 L T s a f e R min < R < R max P r T u r b i n e min < P r T u r b i n e < P r T u r b i n e max x T min < x T < x T max y T min < y T < y T max
where Rmax and Rmin represent the maximum and minimum impeller radius of the offshore WTG; PrTurbinemax and PrTurbinemin are the maximum and minimum rated powers; xTmax and xTmin are the maximum and minimum coordinates of the offshore WTG on the x-axis; yTmax and yTmin are the maximum and minimum coordinates of the offshore WTG on the y-axis, respectively; LTsafe is the minimum spacing for the safe operation of the offshore WTGs. The first constraint specifies that the minimum spacing between stationary offshore WTGs must be greater than 2D [29], where D = 2R. Therefore, the minimum safe spacing LTsafe of offshore WTGs is set to 3D.
(2)
The second-layer optimization objective is to minimize the LCOE, with the optimization variables being the layout parameters of wave energy devices, R and PrTurbine. Here, R and PrTurbine are optimized again to obtain the turbine parameters suitable for the co-generation system. After optimization, it is essential to confirm that the optimal turbine layout corresponding to the turbine parameters obtained from the second optimization remains the same as the optimal turbine layout derived from the first-layer optimization. and therefore, it is necessary to bring the optimal R and PrTurbine from the second optimization back to the first-layer optimization to verify that the layout of the wind turbine unit is the same as that obtained from the first-layer optimization. Consequently, the optimal R and PrTurbine from the second optimization need to be reintroduced into the first-layer optimization to verify whether the layout of the wind turbine units is consistent with that obtained from the first-layer optimization. The second-layer objective function, Ysecond, is as follows:
Y sec o n d min = min L C O E ( ( x W , y W ) , ( x T , y T ) R , P r T u r b i n e ) s . t . ( x W i x W j ) 2 + ( y W i y W j ) 2 L W s a f e ( x T i x W j ) 2 + ( y T i y W j ) 2 L W s a f e R min < R < R max P r T u r b i n e min < P r T u r b i n e < P r T u r b i n e max x W min < x W < x W max y W min < y W < y W max

3. ISOA-Based Optimization Solution

3.1. Seagull Optimization Algorithm (SOA)

In this study, the optimization method used is an improved seagull optimization algorithm (ISOA), which was implemented by the authors in MATLAB R2021b. The original seagull optimization algorithm (SOA) was introduced by Dhiman and Kumar in 2019 as a novel bio-inspired algorithm for solving computationally expensive optimization problems [30]. Dhiman and Kumar note that SOA’s main inspiration is “the migration and attacking behaviors of a seagull in nature”, which they mathematically model to emphasize exploration and exploitation in the search process. The following will first outline the core mechanisms of SOA, and then elaborate on the improvement strategies introduced in ISOA.
The seagull optimization algorithm is a heuristic optimization algorithm based on swarm intelligence that conducts global and local searches by simulating the migration and attack behaviors of seagulls. The specific steps of the algorithm are as follows:
  • Population initialization: Let the dimension of the optimization problem be S and the population size be N. The initial position of each search individual is randomly generated through a uniform distribution.
  • Fitness value evaluation and sorting: The fitness value of each search individual is calculated by the objective function, which reflects the quality of its solution. In each iteration, the individuals are sorted in ascending order for minimization problems or descending order for maximization problems based on their fitness value, and the individual with the optimal fitness is the optimal seagull, and the group converges to that position.
  • Global search in the migration phase: The migration phase consists of two sub-steps. Firstly, to prevent gull collision, the position of each individual is adjusted using the control factor fc. Secondly, the direction and distance between each individual and the optimal seagull are calculated, and the individual moves towards the optimal one.
  • Local search in the attack phase: The attack phase simulates the spiral-descent behavior of seagulls when capturing prey, and improves the quality of the solution through local fine search. In x, y, z space, the attack position of the seagull can be expressed as a function of the spatial coordinate parameters x, y, and z.

3.2. Improved Seagull Optimization Algorithm (ISOA)

Since the optimization of offshore wind and wave energy co-generation systems is a nonlinear, multi-peak and non-convex problem, SOA exhibits issues, specifically mismatched control factors and insufficient local and global search capabilities. To address the above problems, three improvements are made to SOA:
  • Non-linear adjustment strategy of control factor: In SOA, fc utilizes a linear decreasing strategy. Although this strategy aligns with the iterative trend of global search in the early stage and local convergence in the later stage, it fails to consider the non-uniformity of the population evolution process. Therefore, a nonlinear adjustment is applied to fc with the following formula [31]:
    f c ( t i t e r ) = f c min + ( f c max f c min ) e 1.5 t i t e r T max 4
    where fcmin and fcmax are the minimum and maximum values of the set fc.
  • Variation adjustment strategy: To address the drawback of the traditional SOA’s tendency to fall into local optimization, a Gaussian–Cauchy hybrid variation mechanism is proposed to enhance both global and local search capabilities. Kong et al. [32] indicates that the spiking characteristics of the Gaussian distribution can be utilized to conduct local fine searches in the neighborhood of the optimal solution, thereby enhancing local convergence accuracy. Lu et al. [33] suggests that the Cauchy distribution variance operator can increase population diversity, and its long-tailed characteristics can effectively escape from the local extrema. The position update formulas for the two variation adjustment strategies are as follows:
    H S b e s t ( t i t e r ) = H S b e s t ( t i t e r ) + H S b e s t ( t i t e r ) G a u s s ( 0 , 1 )
    H S b e s t ( t i t e r ) = H S b e s t ( t i t e r ) + H S b e s t ( t i t e r ) C a u c h y ( 0 , 1 )
    where HSbest(titer) is the optimal position.
    To leverage the advantages of both distributions, a variation factor ζ is introduced, whose value varies with the number of iterations. In the early stage of the algorithm, it mainly undergoes Cauchy variation, while in the later stage, it undergoes Gaussian variation. The position update formula with variation adjustment is as follows:
    H S b e s t ( t i t e r ) = H S b e s t ( t i t e r ) 1 + ζ ( t i t e r ) C a u c h y ( 0 , 1 ) + H S b e s t ( t i t e r ) 1 ζ ( t i t e r ) G a u s s ( 0 , 1 )
    where ζ(titer) is the variation factor of the titerth generation, and its update formula is as follows:
    ζ ( t i t e r ) = ζ max                                                                             t i t e r < T max / 4 ζ max t i t e r 2 ζ max ζ min / T max 2                T max / 4   t i t e r < 3 T max / 4 ζ min                                                                             t i t e r 3 T max / 4
    where ζmax and ζmin are the maximum and minimum values of the set variation factor, with ζmax = 1 and ζmin = 0. Before and after the mutation, the position with a better fitness value is selected as the optimal seagull position.
  • Multiple swarm strategy: To further enhance the comprehensive performance of SOA in layout optimization problems, a multiple swarm strategy is introduced based on the two improvements above [34].
    Firstly, the initial population is randomly and equally divided into three sub-populations (HS1, HS2, HS3), all of which adopt the nonlinear adjustment strategy of the control factor. HS1 employs the Gaussian–Cauchy mixed variation of Equation (41), HS2 adopts the Gaussian variation of Equation (39), and HS3 adopts the Cauchy variant of Equation (40). Secondly, staged population interactions are performed, with time thresholds T1, T2, and T3 (T1 < T2 < T3) set according to the optimization problem. When titer < T1, it is the independent evolution stage, during which each subpopulation iterates independently. When titerT2, it is the subpopulation interaction stage, in which the optimal seagulls in HS2 and HS3 randomly replaced the non-optimal individuals in HS1 according to the set replacement probability. Similarly, the same replacement operation is carried out in HS2 and HS3. When titer > T3, it is the perturbation enhancement stage, in which a random perturbation is applied to the optimal individual of each subgroup, and the perturbed individual replaces a non-optimal individual randomly selected from the original subgroup, activating the search potential of stagnant regions and strengthening the ability to escape from local optima.

3.3. Algorithm Implementation Process

As illustrated in Figure 1, the specific steps for optimizing the offshore wind and wave energy co-generation system using the improved seagull optimization algorithm are as follows: Initiate the algorithmic process, initialize the three populations (randomly and equally divide the initial population into three subpopulations) and the relevant algorithmic parameters, compute the fitness values of each search individual, and identify the optimal individual of each subpopulation. Subsequently, update the iteration number as titer = titer + 1 and update the control factors according to a specific nonlinear strategy. Then, different operations are executed based on the interval of the iteration number titer: If titer < T1, the three subpopulations are updated independently, optimizing the search using the improvement strategy during the update process, and subsequently adjusting and updating the variation in the optimal individuals of each subpopulation; if T1titer < T2, interactive updates are performed among the subpopulations, exchanging non-optimal individuals according to the predefined rules, and then adjusting and updating the variation in the optimal individuals of each subpopulation; if T2titer< T3, first conduct the same subgroup interaction update, followed by adjusting and updating the variation in the optimal individuals; if titerT3, first perform subgroup interaction updates, then randomly perturb the optimal individuals of each subgroup to replace the non-optimal individuals in the original group, and finally adjust and update the variation in the optimal individuals. After each operation, determine whether titer is less than or equal to the maximum number of iterations tmax. If this condition is met, return to continue the iteration; otherwise, output the optimal solution and terminate the algorithm.

4. Example Analysis

4.1. Wind and Wave Data in the South China Sea

In this study, the two-parameter Weibull distribution is employed to describe the wind conditions in the sea area. The moment estimation method is utilized to calculate the mean wind speed μv and the sample variance σv in the sea area [23]. Subsequently, Equations (43) and (44) are applied to obtain the two parameters [35]:
k = σ v μ v 1.086
c = μ v Γ 1 + 1 / k
where c denotes the scale parameter, reflecting the mean wind speed; k is the shape parameter, indicating the wind speed distribution.
Consequently, the probability density function can be formulated as follows:
f ( v ) = k c ( v c ) k 1 e ( v c ) k
where v denotes the wind speed.
Lu et al. [36] and Song et al. [37] report that, in engineering practice, the wave conditions in the studied sea area are commonly simplified as sinusoidal waves for analysis. Among these, the effective wave height is a crucial attribute for quantifying wave conditions [38]. Wu et al. [39] indicate that in practical engineering applications, the distribution of the effective wave height can be approximated as a Gaussian distribution:
f ( x ) = 1 2 π σ e ( ( x μ ) 2 2 σ 2 )
where µ is the mean of the relevant statistics and σ is the standard deviation of the statistics.
The studied sea area is located in the South China Sea, and its conditions can be referenced from the neighboring Yangdong offshore wind farm project. By processing the wind speed data in the sea area over the past ten years, the statistical data of the average wind speed and the occurrence probability of eight wind directions can be obtained, as depicted in Figure 2. It can be observed that the dominant wind direction in the study sea area is the northeast wind, and the average wind speed in this wind direction is the highest, followed by the east wind, southwest wind and north wind.
Based on relevant reports of the South China Sea, the average effective wave height in the study area is estimated to be Hs = 1.160 m [40], and the standard deviation of the effective wave height is approximately 0.469 m. During the optimization process, since the primary consideration is the impact of wind speed on the effective wave height, it is assumed that the magnitude of the effective wave height is directly proportional to that of the wind speed, and that the direction of wave propagation is consistent with the wind direction [41].

4.2. Analysis of Optimization Results

4.2.1. Analysis of the First-Layer Optimization Results

The first-layer optimization focuses on the layout and parameters of the WTGs. Firstly, the parameter settings for the case study are conducted as follows: The grid model is adopted for the layout optimization [42]. Twelve offshore WTGs of the same model are set up and arranged within a 5×5 grid model, with the layout area of 18D×18D and a minimum safety spacing of 3D between the units. The optimization objective is shown in Equation (36), and the wind conditions of the studied sea area are characterized by the data shown in Figure 2.
After the parameter settings are completed, the objective function is optimized and solved using the improved SOA algorithm. The parameters of the offshore wind turbine corresponding to the optimal solution are an impeller radius R = 94 m, a rated power PrTurbine = 7691 kW, and the optimal layout is depicted in Figure 3, with a corresponding LCOEwind = 0.6527 CNY/kWh. The green hollow circles in Figure 3 represent the selectable placement positions of wind turbines in the grid model determined according to the minimum safety distance. The optimal layout of turbine positions is shown as green solid circles in the legend. As illustrated in the figure, the optimal offshore wind turbine array presents the multiple interlaced topological structures. The structure fully considers the superposition effect of the wakes in different wind directions, with enhanced optimization for the dominant northeast wind direction. The turbines are vertically arranged along the northeast wind direction, minimizing the wake coverage between units.

4.2.2. Analysis of the Second Layer Optimization Results

The second layer of optimization centers on the relative layout of the WTGs and wave-energy-generating devices, along with the optimization of WTG parameters. The following are the supplementary example parameter settings: Twelve 250 kW oscillating float-type wave-energy-generating devices are selected and arranged within a 15×15 grid model. Only one wave-energy-generating device can be connected in parallel to each offshore WTG. To ensure the effectiveness of the masking effect, in combination with the experimental results obtained by Astariz et al. [43], the maximum spacing for the masking effect of the devices is set to 3D, and the affected area is defined as a sector with a 90° angle behind the incoming wave direction. To quantify the impact of the masking effect on the reduction in offshore wind turbine operation and maintenance costs, the coefficient β is set to 0.87 during the optimization process. The minimum safety distance between wave-energy-generating devices is set as D, and the remaining parameters are kept consistent with those in the first-layer optimization. The optimization objective is shown in Equation (37).
After the parameters settings are completed, the coordinates of the optimal layout of offshore WTGs shown in Figure 3 are used as inputs, and the objective function is optimized and solved with the improved SOA. The parameters of the offshore WTGs corresponding to the optimal solution are R = 96 m, PrTurbine = 7977 kW, and the optimal layout of the wave-energy-generating devices is shown in Figure 4, with the corresponding LCOE = 0.6561 CNY/kWh. The red hollow triangles in the figure denote the selectable placement positions of wave-energy-generating devices in the grid model, specified by the minimum safety distance. The optimal WEC layout is indicated by red solid triangles as shown in the legend. To fully leverage the masking effect, the wave energy generators are arranged upstream of the offshore wind turbine in the northeast direction, which is the main wave direction. Due to the capacity limitation of the offshore WTGs’ box-type transformers, only one wave energy generator is connected in parallel to each offshore WTG. This method can also reduce the cost of cable connection between the devices.
When compared with the WTG parameters obtained from the first-layer optimization, the optimal solution applicable to the co-generation system shows that R has increased by 2.13% and PrTurbine has increased by 0.20%. This demonstrates that the reduction in the O&M cost of offshore WTGs brought about by wave energy generators causes the selection of offshore WTGs to tend towards larger-sized units when optimizing the co-generation system.

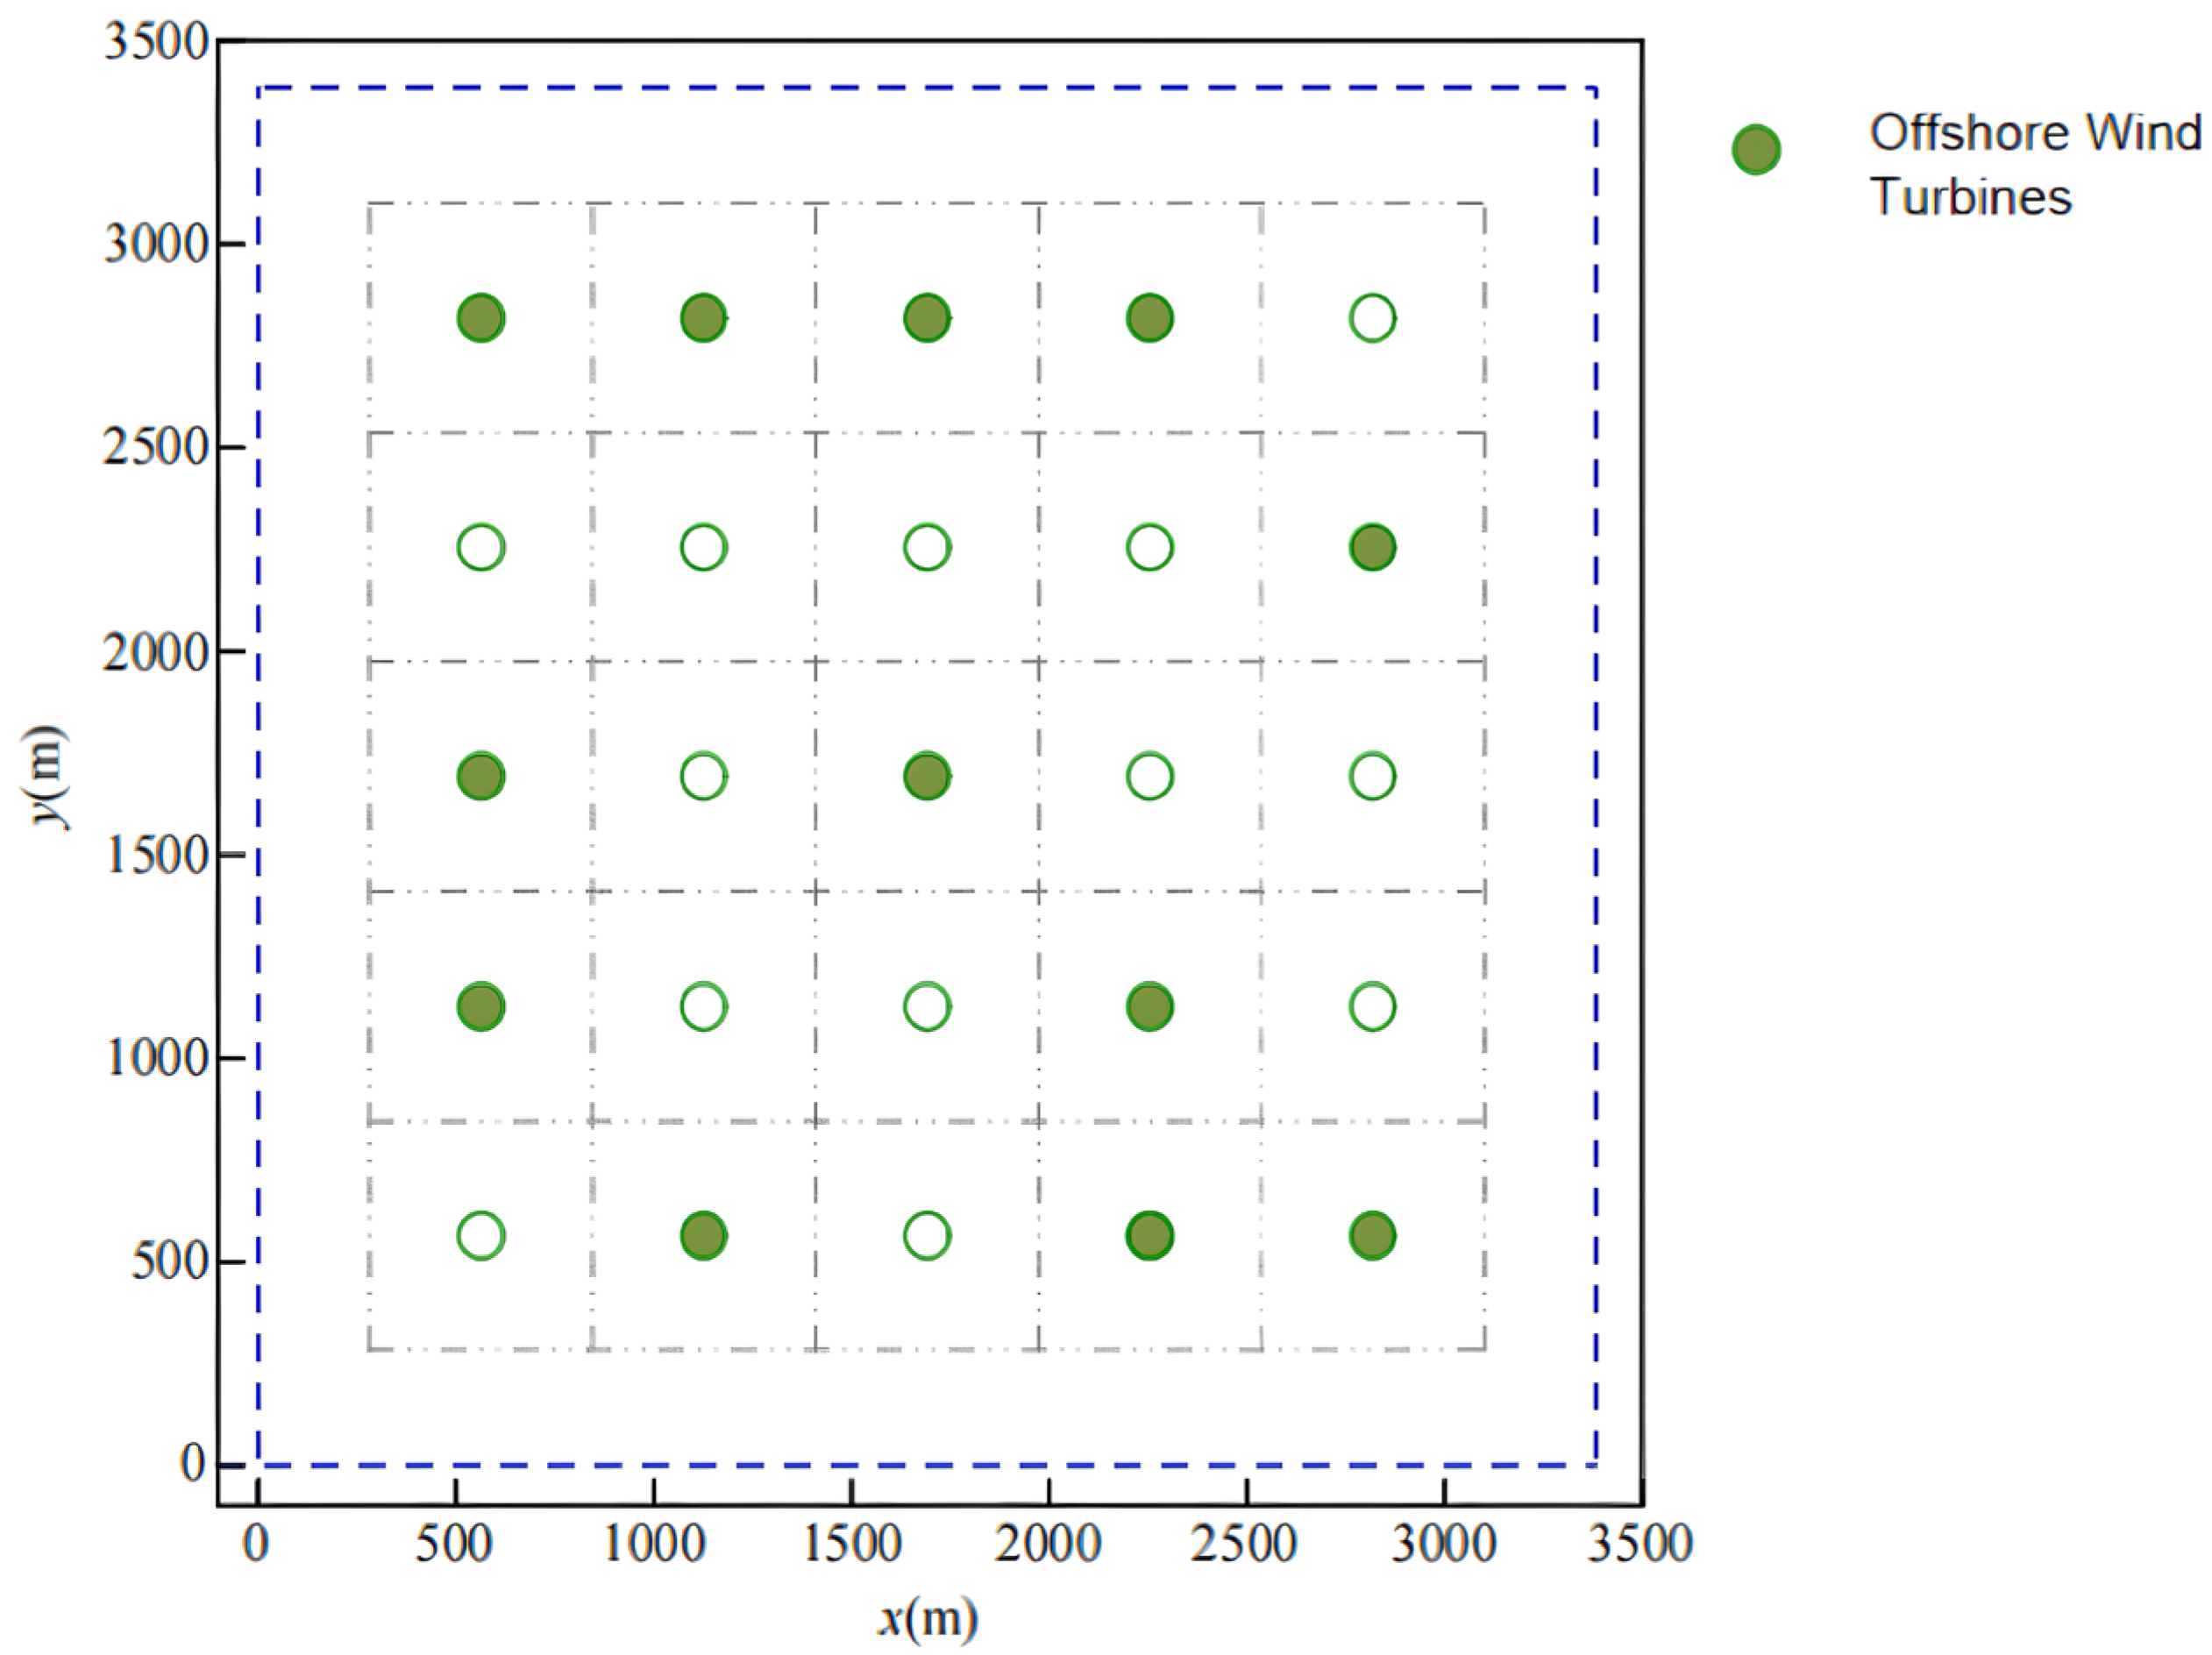
4.2.3. Analysis of Joint Optimization Results

The optimal WTG parameters applicable to the co-generation system, i.e., R = 96 m, PrTurbine = 7977 kW, are reintroduced to the first-layer optimization. The optimal layout of the WTGs is re-obtained using the improved SOA algorithm, and the resulting optimal turbine layout is shown in Figure 5.
A comparison between Figure 3 and Figure 5 reveals that the relative position of the WTG layout remains unchanged before and after the fine-tuning of the WTG parameters. This indicates that the WTG parameters have a minimal impact on the optimal layout, while the wind direction and wind speed are the primary influencing factors. It also validates the reliability and effectiveness of the two-layer optimization framework proposed in this study. Consequently, the overall optimal layout of the offshore wind and wave energy co-generation system is presented in Figure 6.
As depicted in Figure 6, to maximize the masking effect, when offshore WTGs are arranged independently or only two units are adjacent, the wave energy generation units are positioned upstream of the main wind direction. However, when multiple offshore WTGs are arranged adjacent to each other, the optimal location of the wave energy generation device is not directly upstream of the main wind direction. This approach capitalizes on the transfer effect of the masking effect between the devices.

4.3. Comparison of the Results of Different Algorithms

In heuristic optimization studies, result validation is typically carried out through convergence behavior analysis, performance comparison with baseline algorithms, and solution consistency checks across multiple runs. In this section, the reliability of the proposed improved seagull optimization algorithm (ISOA) is evaluated by comparing it against the standard SOA and the particle swarm optimization (PSO) algorithms, alongside an analysis of convergence curves and variable trajectories. These elements collectively demonstrate the robustness and effectiveness of the algorithm in solving the layout optimization problem.
The ISOA, the standard SOA, and the PSO algorithm are applied to solve the first-layer and second-layer optimization problems.
Figure 7 depicts the iterative process of LCOEwind in the first-layer optimization. As illustrated, the minimum LCOEwind value obtained by the ISOA is 0.6527 CNY/kWh, which is 0.67% lower than that of the SOA (0.6571 CNY/kWh) and 1.09% lower than that of PSO (0.6599 CNY/kWh). This result validates that the ISOA exhibits superior global and local search capabilities when solving the optimization problems of co-generation systems.
During the first-layer optimization, the iterative curves of R and PrTurbine are shown in Figure 8. The experimental data reveal that the optimal impeller radius obtained by the three algorithms is 94 m. Regarding the rated power, the ISOA, SOA and PSO yield optimal solutions of 7691 kW, 7640 kW and 7677 kW, respectively. Notably, when the iteration reaches approximately 120 generations, the corresponding R and PrTurbine curves of the ISOA exhibit significant fluctuations, accompanied by a decrease in the value of LCOEwind. This indicates that the algorithm successfully escapes from the local optimal solution, further verifying its superior global search performance.
Figure 9 illustrates the iterative process of LCOE in the second-layer optimization. The experimental data show that the lowest LCOE value obtained by the ISOA is 0.6561 CNY/kWh, which is 0.29% and 0.82% lower than that of the SOA (0.6580 CNY/kWh) and PSO (0.6615 CNY/kWh), respectively. This comparison result fully confirms the superiority of the ISOA in solving the optimization problem of the co-generation system.
The iterative curves of R and PrTurbine for the second-layer optimization are shown in Figure 10. The experimental data demonstrate that the ISOA, SOA and PSO obtain the optimal solutions for the impeller radius of 96 m, 94 m and 94 m, respectively, with a corresponding rated power of 7977 kW, 7328 kW and 7618 kW, respectively. It can also be observed from Figure 10 that the ISOA displays remarkable characteristics during the 100–200 generation iterations: both the R and PrTurbine curves show multiple significant fluctuations, indicating that the algorithm successfully breaks through multiple local optimal solutions during the optimization process, further validating its excellent global search capability.
Although the LCOE reduction achieved by the proposed algorithm is numerically 0.29%, such an improvement is not trivial from a system-level perspective. According to the IRENA, the global installed capacity of offshore wind and wave energy is expected to reach 2000 GW and 350 GW, respectively, by 2050 [5]. Assuming a 20-year project lifespan and an average capacity factor of 0.4, these systems would generate over 220,000 TWh of electricity cumulatively. Even a 0.29% decrease in LCOE—based on a baseline value of 0.09 USD/kWh—would correspond to an estimated global cost saving of more than 5.7 billion USD. Therefore, even marginal improvements in cost-efficiency at the design stage can yield meaningful long-term benefits when deployed at scale in capital-intensive marine energy projects.

5. Conclusions

Owing to the high complexity of the optimization problem of offshore wind and wave energy co-generation systems, the optimization effectiveness of existing methods remains suboptimal. To tackle this issue, firstly, a levelized cost of energy (LCOE) model based on the whole-life-cycle cost is proposed. Secondly, a two-layer optimization framework is utilized to decouple the optimization problem. Subsequently, multiple strategies are introduced to enhance the seagull optimization algorithm (SOA) for solving the optimization problem. The following conclusions are derived from the case analysis:
  • The two-layer optimization framework effectively decouples the multi-peak non-convex optimization problem of offshore wind and wave energy co-generation systems, reducing computational complexity, improving solution efficiency, and ensuring the synergistic optimization between wind turbines and the wave energy generators;
  • The superiority of the improved seagull optimization algorithm (ISOA) in solving the co-generation system optimization problem is verified through a comparison of the optimization results of the ISOA, the standard SOA and the particle swarm optimization (PSO) algorithm. In the case analysis, the minimum LCOE value obtained by ISOA optimization is 0.6561 CNY/kWh, which is 0.29% lower than that obtained by the standard SOA and 0.82% lower than that obtained by the PSO, respectively. Moreover, the ISOA escapes from local optimal solutions multiple times during the iterative process, demonstrating stronger global search capabilities and a lower tendency to fall into the local optima;
  • By comparing the optimization results considering only the WTG layout with those of the co-generation system, it is found that the WTG parameters (R and PrTurbine) suitable for the co-generation system are generally larger. For instance, in the case analysis, the value of R applicable to the co-generation system is 96 m, and the value of PrTurbine is 7977 kW, representing increases of 2.13% and 0.20% compared to 94 m and 7691 kW in the scenario considering only the WTG layout, respectively. This indicates that the wave energy generators effectively reduce the operation and maintenance costs of offshore WTGs through the masking effect, prompting the co-generation system to favor the selection of larger-sized WTGs.

Author Contributions

Conceptualization, X.Z. and X.F.; methodology, X.Z; software, X.Z.; validation, X.Z., H.W. and Q.H.; formal analysis, Y.W.; investigation, H.W.; resources, J.Y.; data curation, Q.H.; writing—original draft preparation, X.Z.; writing—review and editing, X.F and D.S.; visualization, H.W.; supervision, D.S.; project administration, D.S.; funding acquisition, D.S and J.Y. All authors have read and agreed to the published version of the manuscript.

Funding

This research is supported by the Natural Science Foundation of Changsha (kq2208288).

Data Availability Statement

Data are contained within the article.

Conflicts of Interest

The authors declare no conflicts of interest.

References

  1. Sun, P.; Jiang, Z.; Chen, Y.; Song, X.; Pang, Y.; Cai, B.; Xu, X.; Li, Y. Prospective development of eco-friendly offshore renewable energy technologies. Sci. China Technol. Sci. 2025, 55, 423–441. [Google Scholar]
  2. Song, D.; Yan, J.; Gao, Y.; Wang, L.; Du, X.; Xu, Z.; Zhang, Z.; Yang, J.; Dong, M.; Chen, Y. Optimization of floating wind farm power collection system using a novel two-layer hybrid method. Appl. Energy 2023, 348, 121546. [Google Scholar] [CrossRef]
  3. Yan, X.; Zhang, N.; Ma, K.; Wei, C.; Yang, S.; Pan, B. Overview of the current situation and trend of offshore wind power development in China. Power Gener. Technol. 2024, 45, 1–12. [Google Scholar]
  4. Liu, F.; Huang, Y.; Wang, Y.; Xia, E.; Qureshi, H. Short-term multi-energy consumption forecasting for integrated energy system based on interactive multi-scale convolutional module. Sci. Rep. 2024, 14, 21382. [Google Scholar] [CrossRef]
  5. IRENA. Future of Wind: Deployment, Investment, Technology, Grid Integration and Socio-Economic Aspects; International Renewable Energy Agency: Abu Dhabi, United Arab Emirates, 2019. [Google Scholar]
  6. Zhao, Y.; Ke, S.; Yun, Y.; Wang, S.; Li, Y.; Ren, H. Multiscale flow field evolution and loading characteristics of a new wind-wave co-generation floating platform float-column-float. J. Sol. Energy 2023, 44, 370–379. [Google Scholar]
  7. Saenz-Aguirre, A.; Saenz, J.; Ulazia, A.; Ibarra-Berastegui, G. Optimal strategies of deployment of far offshore co-located wind-wave energy farms. Energy Convers. Manag. 2022, 251, 114914. [Google Scholar] [CrossRef]
  8. Wen, Y.; Kamranzad, B.; Lin, P. Joint exploitation potential of offshore wind and wave energy along the south and southeast coasts of China. Energy 2022, 249, 123710. [Google Scholar] [CrossRef]
  9. Astariz, S.; Iglesias, G. Selecting optimum locations for co-located wave and wind energy farms. Part II A Case study. Energy Convers. Manag. 2016, 122, 599–608. [Google Scholar] [CrossRef]
  10. Ragab, A.M.; Shehata, A.S.; Elbatran, A.; Kotb, M.A. Numerical optimization of hybrid wind-wave farm layout located on Egyptian North Coasts. Ocean Eng. 2021, 234, 109260. [Google Scholar] [CrossRef]
  11. Astariz, S.; Perez-Collazo, C.; Abanades, J.; Iglesias, G. Co-located wave-wind farms: Economic assessment as a function of layout. Renew. Energy 2015, 83, 837–849. [Google Scholar] [CrossRef]
  12. Clark, C.E.; Miller, A.; DuPont, B. An analytical cost model for co-located floating wind-wave energy arrays. Renew. Energy 2019, 132, 885–897. [Google Scholar] [CrossRef]
  13. Wei, S.; Mu, S.; Liu, N.; Wang, Y. Non-simultaneous planning of offshore wind and wave power co-generation considering operation and maintenance requirements. Power Syst. Autom. 2021, 45, 57–65. [Google Scholar]
  14. Tao, S.; Xu, Q.; Feijoo, A.; Zheng, G. Joint Optimization of Wind Turbine Micrositing and Cabling in an Offshore Wind Farm. IEEE Trans. Smart Grid 2021, 12, 834–844. [Google Scholar] [CrossRef]
  15. Moreno, S.R.; Pierezan, J.; Coelho, L.d.S.; Mariani, V.C. Multi-objective lightning search algorithm applied to wind farm layout optimization. Energy 2021, 216, 119214. [Google Scholar] [CrossRef]
  16. Mone, C.; Hand, M.; Bolinger, M.; Rang, J.; Heimiller, D.; Ho, J. 2015 Cost of Wind Energy Review; National Renewable Energy Lab. (NREL): Golden, CO, USA, 2017. [Google Scholar]
  17. Song, D.; Zheng, S.; Yang, S.; Yang, J.; Dong, M.; Su, M.; Joo, Y.H. Annual energy production estimation for variable-speed wind turbine at high-altitude site. J. Mod. Power Syst. Clean Energy 2020, 9, 684–687. [Google Scholar] [CrossRef]
  18. Liu, J.; Song, D.; Li, Q.; Yang, J.; Hu, Y.; Fang, F.; Joo, Y.H. Life cycle cost modelling and economic analysis of wind power: A state of art review. Energy Convers. Manag. 2023, 277, 116628. [Google Scholar] [CrossRef]
  19. Song, D.; Xu, S.; Huang, L.; Xia, E.; Huang, C.; Yang, J.; Hu, Y.; Fang, F. Multi-site and multi-objective optimization for wind turbines based on the design of virtual representative wind farm. Energy 2022, 252, 123995. [Google Scholar] [CrossRef]
  20. Patel, R.P.; Nagababu, G.; Kachhwaha, S.S.; Surisetty, V.V.A.K.; Seemanth, M. Techno-economic Analysis of Wave Energy Resource for India. J. Indian Soc. Remote. Sens. 2022, 51, 371–381. [Google Scholar] [CrossRef]
  21. European Wind Energy Association. Wind Energy-The Facts: A Guide to the Technology, Economics and Future of Wind Power; Routledge: Abingdon, UK, 2012. [Google Scholar]
  22. Zhang, Z.; Sun, D.; Zhao, C.; Nian, H. An Improved Grid-Forming Control Strategy of Wind Turbine Generators with the Supercapacitor for Optimizing Primary Frequency Regulation Ability. IEEE Trans. Energy Convers. 2024, 40, 306–322. [Google Scholar] [CrossRef]
  23. Gong, W.; Li, W.; Zhang, G. A parameter estimation method for wind speed probability distribution based on Weibull distribution. Renew. Energy 2011, 29, 20–23. [Google Scholar]
  24. Tan, Z.; Zhang, L.; Chen, X.; Lv, Z.; Cai, W. Technical and economic study on offshore wind power collection system for large-capacity offshore units. Electr. Appl. 2021, 40, 64–71. [Google Scholar]
  25. Maienza, C.; Avossa, A.; Ricciardelli, F.; Coiro, D.; Troise, G.; Georgakis, C. A life cycle cost model for floating offshore wind farms. Appl. Energy 2020, 266, 114716. [Google Scholar] [CrossRef]
  26. Astariz, S.; Perez-Collazo, C.; Abanades, J.; Iglesias, G. Co-located wind-wave farm synergies (Operation & Maintenance): A case study. Energy Convers. Manag. 2015, 91, 63–75. [Google Scholar] [CrossRef]
  27. Bedard, R.; Hagerman, G.; Siddiqui, O. System Level Design, Performance and Costs-Oregon State Offshore Wave Power Plant. Tech. Rep. E21 EPRI Global WP 006 OR-Rev1. 2004. Available online: https://re-vision.net/wp-content/uploads/2020/08/System-Level-Design-Performance-and-Costs-Oregon-State-Offshore-Wave-Power-Plant.pdf (accessed on 23 April 2025).
  28. Vermeer, L.J.; Sørensen, J.N.; Crespo, A. Wind turbine wake aerodynamics. Prog. Aerosp. Sci. 2003, 39, 467–510. [Google Scholar] [CrossRef]
  29. Zilong, T.; Wei, D.X. Layout optimization of offshore wind farm considering spatially inhomogeneous wave loads. Appl. Energy 2022, 306, 117947. [Google Scholar] [CrossRef]
  30. Dhiman, G.; Kumar, V. Seagull optimization algorithm: Theory and its applications for large-scale industrial engineering problems. Knowl.-Based Syst. 2019, 165, 169–196. [Google Scholar] [CrossRef]
  31. Ding, R.; Zhou, Y. Introducing an improved gray wolf algorithm with Lévy flight and dynamic weights. Comput. Eng. Appl. 2022, 58, 74–82. [Google Scholar]
  32. Kong, Z.; Li, S.; Zhao, J. Improvement study of coral reef algorithm. J. Northeast. Univ. (Nat. Sci. Ed.) 2020, 41, 163–169. [Google Scholar]
  33. Lu, M.; Lu, H.; Hou, X.; Zhao, J.; Xu, J. A hybrid bird flocking and arithmetic optimization algorithm incorporating Cauchy variants. Comput. Eng. Appl. 2023, 59, 62–75. [Google Scholar]
  34. Li, M.; Wang, Y.; Jie, D. Optimal control of quadrotor self-resistant attitude based on multiple swarm dragonfly algorithms. Comput. Appl. Softw. 2022, 39, 328–334+349. [Google Scholar]
  35. Dong, M.; Li, Y.; Song, D.; Yang, J.; Su, M.; Deng, X.; Huang, L.; Elkholy, M.H.; Joo, Y.H. Uncertainty and global sensitivity analysis of levelized cost of energy in wind power generation. Energy Convers. Manag. 2021, 229, 113781. [Google Scholar] [CrossRef]
  36. Lu, W.; Lian, J.; Dong, X.; Liu, R. Influence of wave action on the radiant energy of offshore floating photovoltaic light. J. Hydropower Gener. 2023, 42, 35–42. [Google Scholar]
  37. Song, Z.; Yu, Z.; Hu, Y.; Liu, J. Research on primary frequency control strategy of offshore floating wind farm with high percentage of grid connection. J. Power Eng. 2023, 43, 92–101. [Google Scholar]
  38. Song, W.; Zhao, M.; He, Q.; Hu, A.; Zhang, F. Effective wave height prediction model with multi-factor local-global feature correlation. J. Shanghai Ocean. Univ. 2023, 32, 669–679. [Google Scholar]
  39. Wu, F.; Yang, J.; Yang, M.; Lin, B.; Liang, H.; Qiu, D. Output power prediction of wave power generation system based on convolutional gated loop unit. J. Sol. Energy 2024, 45, 682–688. [Google Scholar]
  40. Sun, Z.; Bian, M.; Ding, J.; Liu, J.; Zhang, H.; Xu, D. Study on the Wind and Wave Environmental Conditions of the Xisha Islands in the South China Sea. J. Mar. Sci. Eng. 2022, 10, 1459. [Google Scholar] [CrossRef]
  41. Li, T.; Shu, F.; Huang, L.; Wu, N.; Lin, L. Calculation of wind-wave characteristics in the northern South China Sea. Guangdong Meteorol. 2009, 31, 6–9. [Google Scholar]
  42. Kaya, B.; Oğuz, E. Investigation of layout optimization for offshore wind f arms and a case study for a region in Turkey. Ocean Eng. 2022, 266, 112807. [Google Scholar] [CrossRef]
  43. Astariz, S.; Iglesias, G. Co-located wind and wave energy farms: Uniformly distributed arrays. Energy 2016, 113, 497–508. [Google Scholar] [CrossRef]
Figure 1. Optimization flow of co-generation system based on improved seagull optimization algorithm.
Energies 18 02846 g001
Figure 2. Histogram of mean wind speed and wind direction probability in the study sea area.
Energies 18 02846 g002
Figure 3. Optimal layout of offshore wind turbines.
Energies 18 02846 g003
Figure 4. Optimal layout of wave energy generator.
Energies 18 02846 g004
Figure 5. Verification of optimal fan layout.
Energies 18 02846 g005
Figure 6. Overall optimal layout of the offshore wind–wave co-generation systems.
Energies 18 02846 g006
Figure 7. Convergence curves of LCOEwind with three algorithms.
Energies 18 02846 g007
Figure 8. Convergence curve of the design parameters of the first-layer optimized wind turbine.
Energies 18 02846 g008
Figure 9. Convergence curves of LCOE with three algorithms.
Energies 18 02846 g009
Figure 10. Convergence curve of the design parameters of the second-layer optimized wind turbine.
Energies 18 02846 g010
Table 1. Offshore wind turbine component cost modeling.
ComponentCost (in CNY)
Blade 9.37 R 2.986 + 139 , 200
Gearbox 47.82 P r T u r b i n e 1.296
Bearing 0.32 R 3.500 + 4.89 R 2.887 2.41 R 2.500
Hub 10.08 ( 2 R ) 2.450 + 144 , 847
Tower 4.07 π H R 2 0.978 + 453,300
Electrical System 0.68 P r T u r b i n e 1.608 + 6.72 P r T u r b i n e 1.529
Control System 8.76 R 2.735
Brakes 13.16 P r T u r b i n e
Hydraulic Cooling System 72.20 P r T u r b i n e
Nacelle Covers 76.34 P r T u r b i n e + 25 , 475
Other Parts 305.32 R 1.953 + 1367.75 R 19,185
Table 2. Offshore infrastructure cost model.
ComponentCost (in CNY)
Support Structure 1980 P r T u r b i n e
Installation 661.60 P r T u r b i n e
Washout Protection 263.96 P r T u r b i n e
Personnel Access Equipment 200 , 000
Disclaimer/Publisher’s Note: The statements, opinions and data contained in all publications are solely those of the individual author(s) and contributor(s) and not of MDPI and/or the editor(s). MDPI and/or the editor(s) disclaim responsibility for any injury to people or property resulting from any ideas, methods, instructions or products referred to in the content.

