Article

Integrated Analysis of Operator Response Capacity, Energy Policy Support and Infrastructure Robustness in Power Grid Resilience Under Severe Weather Events: Lessons from Malawi

by
Joyce Nyuma Chivunga
1,2,*,
Zhengyu Lin
1 and
Richard Blanchard
1
1
Centre for Renewable Energy Systems Technology, Loughborough University, Epinal Way, Loughborough LE11 3TU, UK
2
Department of Energy Resources Management, Malawi University of Science and Technology, Limbe P.O. Box 5196, Malawi
*
Author to whom correspondence should be addressed.
Energies 2025, 18(11), 2755; https://doi.org/10.3390/en18112755
Submission received: 19 April 2025 / Revised: 19 May 2025 / Accepted: 22 May 2025 / Published: 26 May 2025
(This article belongs to the Special Issue Resilience and Security of Modern Power Systems)

Abstract

:
With the multidisciplinary complexity of resilience challenges, holistic evaluation and enhancement have been the main concerns in resilience research. This paper addresses this gap by demonstrating the integrated analysis of operator response capacity, energy policy support and infrastructure robustness using Malawi’s cases. The three individual case studies were pooled, focusing on integrating their resilience indicators, identifying the resilience weaknesses and mapping their interdependencies to inform holistic integrated, holistic enhancement measures. A nuanced understanding of resilience was achieved by integrating indicators based on their respective capacities (preventive and anticipative, absorptive, adaptive, restorative and transformative) across the three resilience dimensions (operator, policy and infrastructure). Mapping relationships between indicators revealed crucial interdependencies and was essential for understanding the complex relationships that underpin resilience. This resulted in development of an integrated resilience framework (IRF) which provides guidelines for comprehensive and inclusive resilience evaluations, especially for weak and underdeveloped grids. The structure of the electricity supply and institutional challenges are at the centre of Malawi’s resilience challenges, aggravated by the non-implementation of the energy policy, which results from, among other reasons, political interference and financial constraints. The paper provides integrated solutions to the identified resilience challenges.

1. Introduction

A constant production and transmission of electricity is crucial to the functioning of society. Since most of the critical infrastructure has become dependent on the continuous allocation of electricity, it is essential that the grid operates consistently daily and is more resilient in case of an unusual event [1]. Resilient power systems should have a maximum diversity of supply sources and avoid reliance on limited power supplies. In addition, power systems should be sufficiently flexible to react rapidly to events and to alter working processes even in short times [2,3,4]. Further, priorities for supplying diverse loads should be well-known [5]. Furthermore, resilient systems should be efficient, diverse, and redundant and should not be exposed to risks or potential risks [6]. Moreover, security, accessibility, affordability, effective governance, policy, and regulatory instruments are all features of resilience [7].
Energy insecurity, low energy access and vulnerability of the electricity grid are some of the significant challenges that the power sector is facing in Malawi [8,9,10]. Energy insecurity and low energy access result from a combination of factors, including over-dependence on hydro-electric generation, underdeveloped energy infrastructure, financial constraints, governance issues, policy gaps, limited regional power interconnection and the challenges of serving a mainly growing population [11]. The vulnerability of the system is multifaced. On the one hand, there is an old infrastructure which dates to 1966. On the other hand, there is the same old system which is exposed to multiple disasters and being managed by the state-owned institution, which seems to have multiple operational challenges [11,12]. This discussion presents a multidisciplinary, multidimensional problem which is in line with the observations of Scott and others [13] that global challenges are a combination of different domains including economic, political, technical, social and organisational. Solving these problems therefore requires a joint approach, an integrated resilience framework (IRF), which is one of this study’s significant contributions.
Three case studies were conducted, each case study representing a resilience domain. To understand the operational capability of the grid operator, a qualitative study was conducted, the details of which are presented in [14]. It was established that the ability of the operator to respond to disasters effectively depends on infrastructure robustness and effective energy policy support. The infrastructure robustness was evaluated (unpublished work). Underdevelopment of the infrastructure, inadequate transmission and generation capacity, overreliance on hydro, and insufficient generation supply led to reduced system functionality, extended duration in degraded state, longer restoration times and extended load shedding after the 2022 Tropical Cyclone Ana (TCA) event. However, Chivunga [15] demonstrated the effectiveness of transmission line redundancy in improving network resilience, which is in line with [16,17]. The capacity of the national energy policy (NEP) to support PSR was evaluated by Chivunga and others [18]—which showed its inadequacy in promoting PSR due to non-implementation of the policy due to several challenges including financial constraints, incapacitation of the ministry of energy (MoE), lack of energy data and meaningful stakeholder coordination, poor policy administration, and politics. This resulted in the underdeveloped energy sector and institutional challenges.
Resilience has been classified based on the planning or operation domain. Power system resilience (PSR) has also been classified as operational and infrastructural [19]. Others classified resilience into infrastructure, operational and organisational [20]. PSR has also been divided into three segments: hard, soft and mixed resilience [21]. Hard resilience refers to the physical elements of functionality. In contrast, soft resilience refers to humane and social networks, which are crucial to understanding the impacts of disasters and the feasibility of emergency management schemes. Mixed resilience combines different resilience domain infrastructures to understand the systems, as it is challenging to figure out solutions to resilience problems when only observing parts individually. The ability to withstand and recover from disruptions is not merely a matter of strengthening physical structures but also involves organisational preparedness and policy cohesion [22].
Thus, the resilience analysis of complex systems requires multiple dimensions: technical, organisational, social and economic approaches [23]. Most explored in the literature are technical [19], organisational [24] and economical [25], all performed independently. Panteli and others [19] reviewed hardening and operational PSR measures and demonstrated the effectiveness of these measures in a case study. On the other hand, Rehak [24] presented an approach for evaluating and improving organisational resilience where factors that determine organisational resilience and the procedure for evaluating and improving organisational resilience were defined. Rose [25] reported the evolution of economic resilience focusing on definitions, quantification, timing, measurement, improvement and its cost. Although these independent studies provide in-depth and offer customised solutions, they may present a risk of bias and incompleteness. The studies were system-centric [19], purely organisational [24] or strictly economic [25]. There is the potential to solve one problem while unintentionally leaving another challenge unattended as the existence of multidimensional resilience challenges has been silent. For example, enhancing the physical structure while the operator lacks restorative, anticipative or preventive capabilities may still result in longer restoration times. Similarly, energy policies that do not promote infrastructure protection may be indirectly promoting system vandalism which predisposes the system to attacks. Therefore, there is a need to solve these problems interconnectedly to ensure a holistic solution. While a multidisciplinary interconnected resilience evaluation and enhancement is promising, it has not been explored. An integrated resilience analysis of organisational, technical and policy dimensions to show their interconnectedness is yet to be explored. By seeing how grid operators rely on policy support and infrastructure robustness, stakeholders can identify the critical points where operational improvements or policy changes might be most effective. Moreover, policymakers understand how their decisions and regulations impact the grid operators and infrastructure robustness, guiding more informed and targeted policymaking. Furthermore, infrastructure robustness supports grid operations and policy effectiveness; hence, power system planners can prioritise investments in infrastructure improvements.
This paper addresses the challenge by evaluating the resilience of Malawi’s transmission network under severe weather using an IRF. It highlights the importance of operator response, the contribution of policy in providing a conducive resilience environment, and the strength of the infrastructure to provide comprehensive resilience solutions. This paper demonstrates how multidisciplinary research was applied to analyse resilience comprehensively. Specifically, this paper shows the (i) integration of resilience indicators, (ii) mapping of their interdependencies, (iii) mapping of interconnected resilience weaknesses and enhancements, and (iv) integrated resilience analysis. This paper has been structured as follows. Section 2 presents the methodology. The discussion of results is presented in Section 3, highlighting the integration of resilience indicators is presented in Section 3.1, mapping of indicator interdependencies in Section 3.2, integration and mapping of resilience weaknesses and enhancements in Section 3.3 and Section 3.4, and an integrated resilience analysis and framework in Section 3.5 and Section 3.6. The paper is summarised in Section 4.

2. Methods

2.1. Background Studies

Based on the introduction, three case studies were conducted. Study 1 evaluated the capacity of the grid operator to respond to and manage the infrastructure during extreme events. Study 2 explored the NEP’s contribution to supporting PSR. Study 3 assessed the capacity of the transmission infrastructure to withstand severe events. In evaluating the operator’s response capability, over twenty organisational resilience indicators were used whose details can be found in [14]. Three or more indicators were used to measure each resilience capacity. Five resilience capacities, namely, preventive, anticipative, absorptive, adaptive and transformative were measured. Thematic analysis was used. Resilience weaknesses were identified in each capacity which informed the formation of resilience enhancement measures. The capacity was considered to have a low resilience if it had more resilience weaknesses than strengths. Identification of resilience weaknesses and strengths aligned with [24]. NEP’s contribution was evaluated because policies are considered drivers of resilience. Policy implementation was used to measure its support/commitment to promoting resilience because policy performance has been claimed by [26] to be an indicator of resilience. Since the scope of this study was the transmission system, only those areas of policy directly linked to the electricity sector were accounted for. Thus, policy targets were used to evaluate its effectiveness. Precisely, the status of electricity supply and technical targets such as generation expansion, diversification, and adequate capacity were used as infrastructure resilience support indicators. Legal and capacity building targets including developments, reviews, and enforcements were used to assess institutional resilience support. The policy was considered to support PSR if targets were met. However, the limitation in this was not having a threshold of target implementation which may introduce biases. Implementation challenges were identified, and potential solutions were suggested. Details of this study were presented in [18]. To evaluate the infrastructure’s robustness, the system performance during the 2022 TCA was analysed using reliability and time-dependent indicators in DigSILENT PowerFactory 2023 SP5 (x64) software. The details of infrastructure indicators are listed in Table 1. Reliability indicators explored the concept of transmission lines contribution to energy not supplied (TLENS) whose details were presented in [15]. In time-based indicators, a metric framework called AFLEPT (letters given for pronunciation), adapted from the FLEP metric which was proposed by Panteli [27] was used to evaluate the following:
  • A: measured Greek letter alpha α, the preventive capacity which evaluated the status of installed capacity (percentage of installed capacity that was generated and available generation location and capacity).
  • F: measured Greek letter Φ, the absorptive capacity which evaluates the rate at which operational and infrastructural indicators dropped.
  • L: observed the Greek letter Λ, the absorptive capacity which establishes how low the operational and infrastructural resilience indicators dropped.
  • E: assessed the Greek letter E, the adaptive capacity evaluating the duration that the system stays degraded.
  • P: analysed the Greek letter Π, the restorative / recovery capacity exploring the speed with which the system functionality is restored following a severe disruption.
  • T: evaluated the Greek letter Ƭ, the transformative capacity which observed any increases in the operational and infrastructural indicator following a severe event.
Following the analysis, infrastructural resilience challenges were identified and potential solutions were suggested.

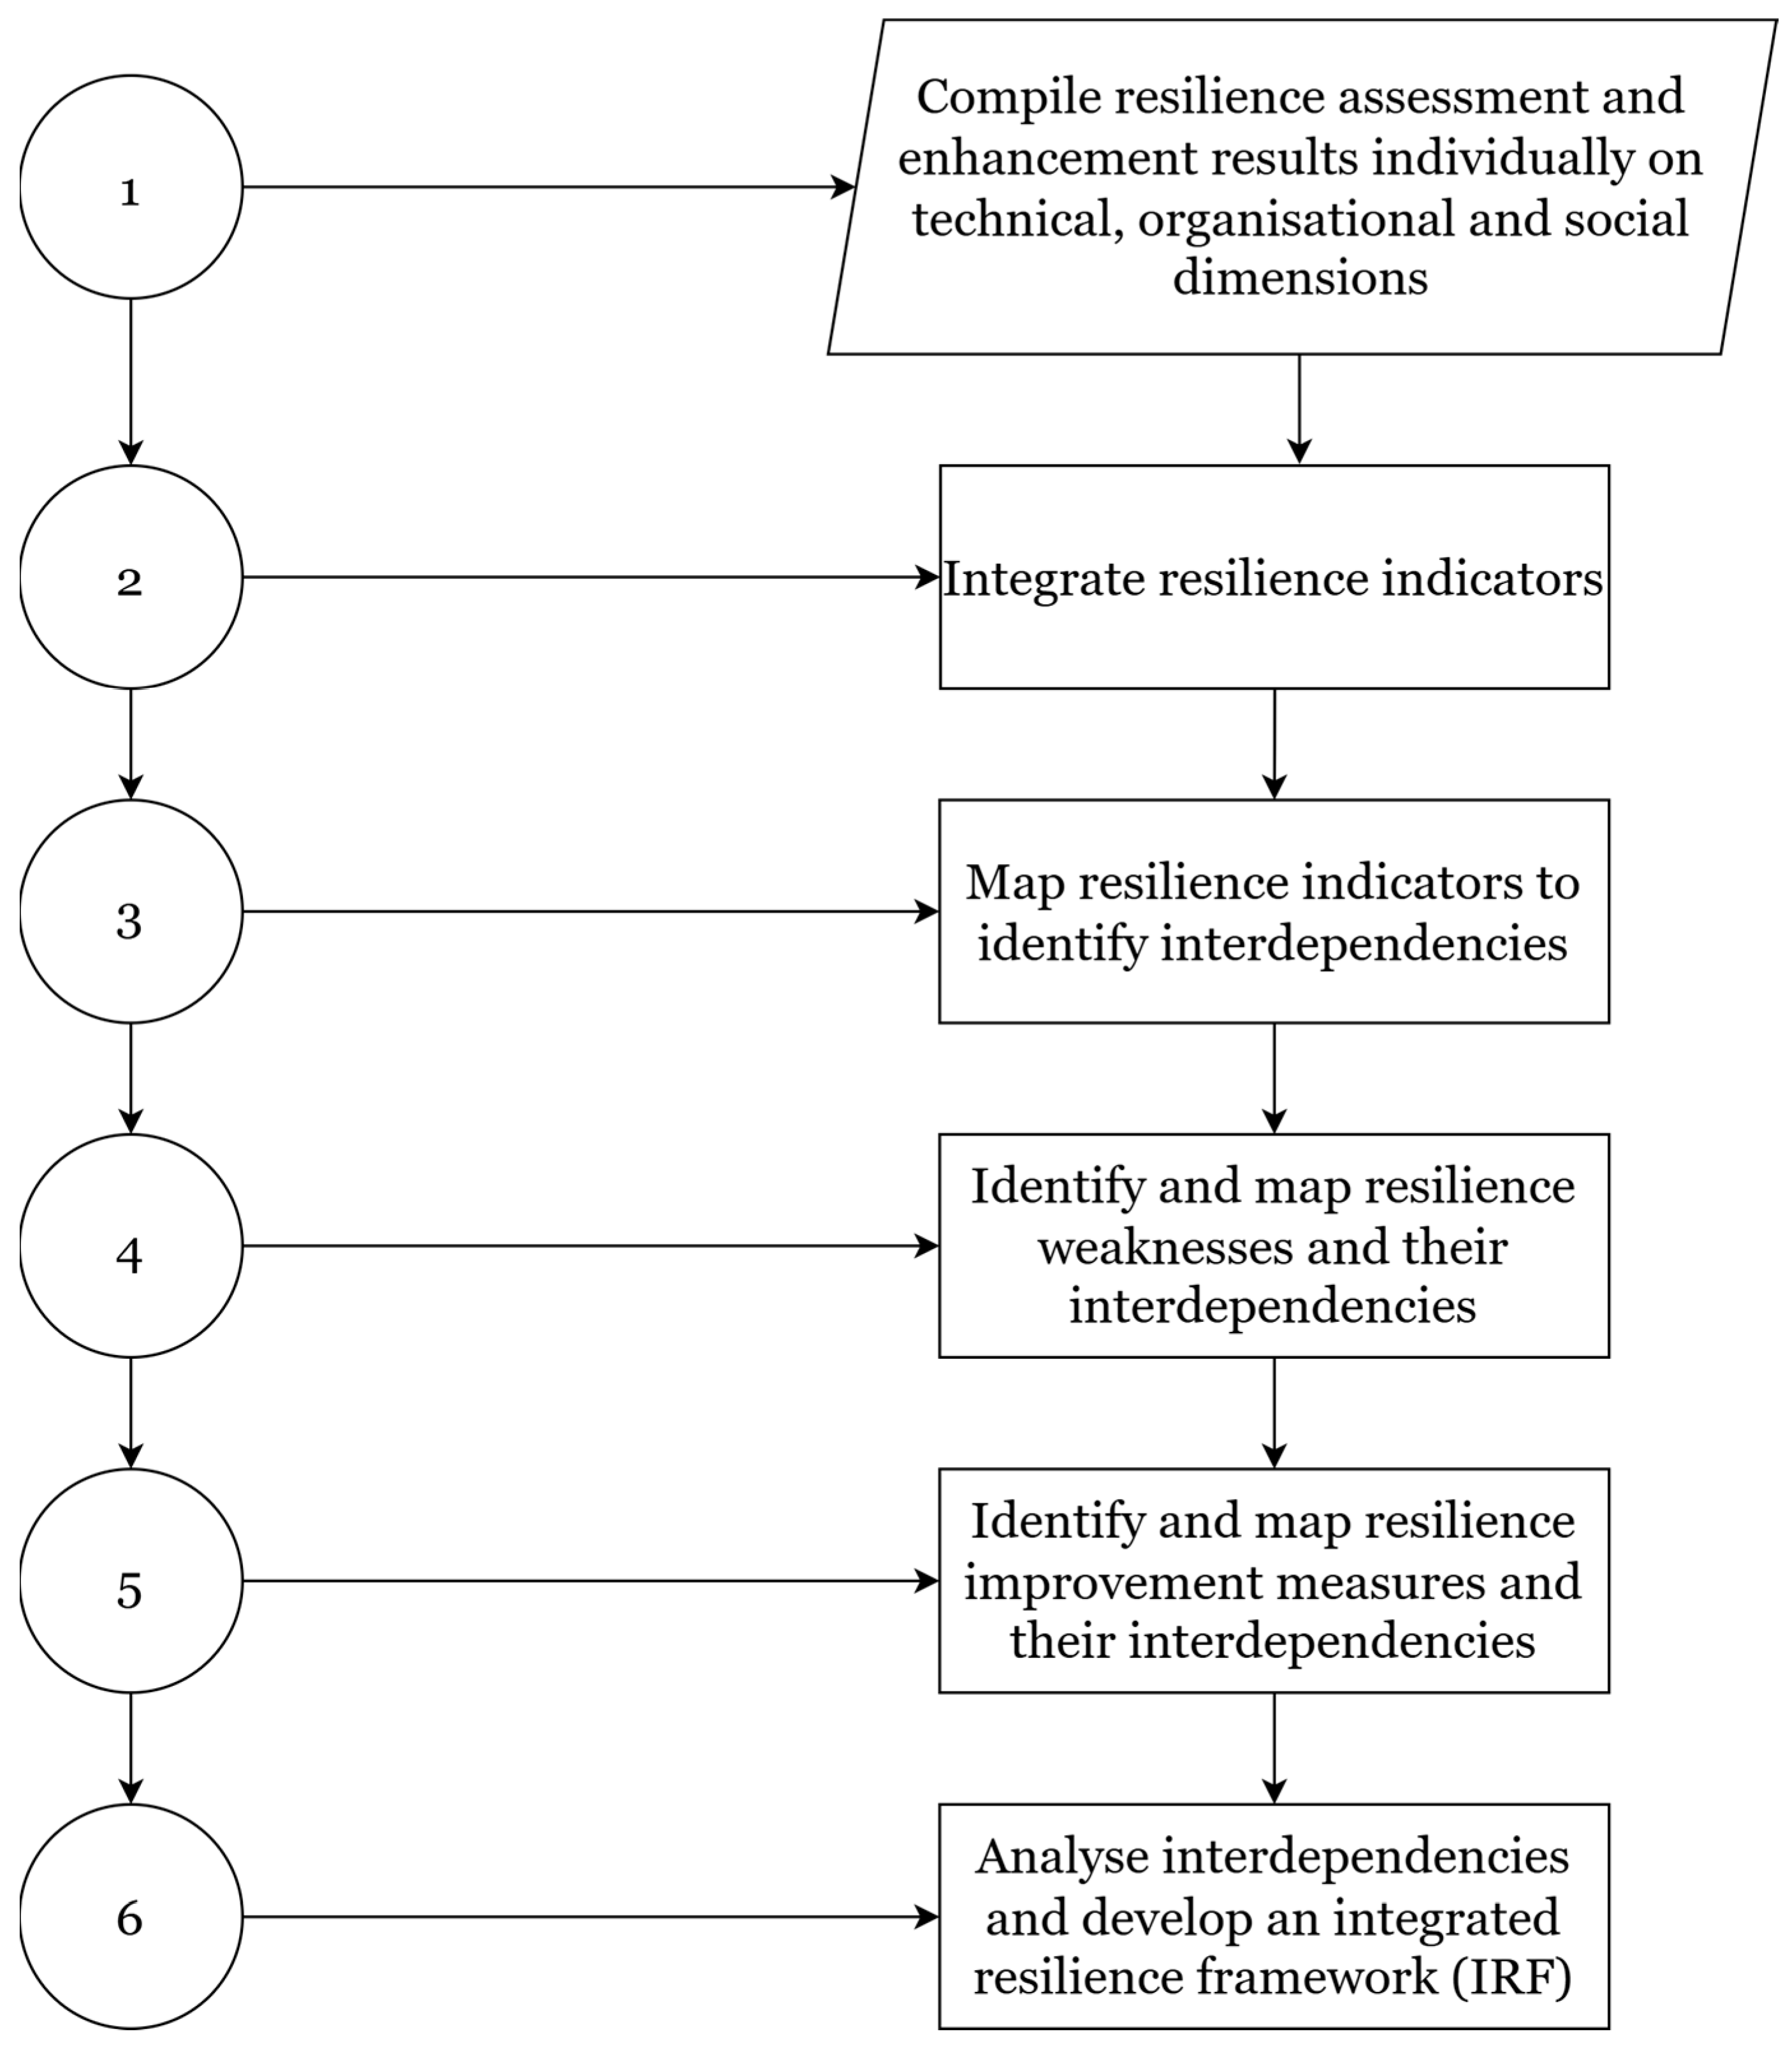
2.2. Integration Framework

Figure 1 outlines a methodology for integrated resilience analysis which leads to the development of an IRF. The process involves compiling assessment results from case studies described in Section 2.1, integrating their respective indicators, mapping interdependencies, identifying connected vulnerabilities and improvement measures, and analysing them to enhance overall resilience.

2.2.1. Compiling Study Cases and Grouping Other Indicators for Simplification

The first step in this methodology involved compiling resilience assessment and enhancement studies for the technical, organisational, and policy dimensions described in Section 2.1. Table 1 presents a list of indicators used in organisational and policy case studies. The similar indicators were grouped for simplicity. For example, the “status of installed capacity” was associated with the percentage of installed capacity generated and available generation location and capacity. In this table, only policy and infrastructure indicators were grouped. Organisational indicators were compared as they were.

2.2.2. Integration of Resilience Indicators

The resilience indicators from the three resilience dimensions (ResD) were integrated by collecting, standardising, and creating a unified framework to ensure compatibility and meaningful comparison. Standardisation of resilience indicators included categorising them into respective resilience capacities (ResC). Indicators were also interlinked according to their relationships across different ResD. Table 2 demonstrates this concept. R e s C 1 to R e s C n may range from preventive to transformative capacity.
R e s D 1 to R e s D n stand for different resilience dimensions that have been explored. In this study, R e s C 1 to R e s C 5 represented preventive and mitigative, absorptive, adaptive, restorative and transformative capacities while R e s D 1 to R e s D 3 stand for operator response, policy and infrastructure domains, respectively. Thus, R e s D 1 R e s C 1 , i represent organisational resilience indicators under the preventive and mitigative capacity which were linked or integrated into policy ( R e s D 2 R e s C 1 , i ) and infrastructure ( R e s D 3 R e s C 1 , i ) indicators under the same ResC. By standardising indicators, the relationships between different dimensions of resilience and how they collectively contribute to overall resilience could be understood.
Although this integrated framework was comprehensive, not all the indicators could be integrated across all dimensions, suggesting that not all qualitative indicators can be quantified. The indicators which could not be matched or related were represented by N/A (not applicable). For example, some organisational resilience indicators, such as risk transfer mechanisms under the anticipative capacity, could not be directly linked to any infrastructure robustness indicators and policy indicators. Similarly, under the preventive capacity, physical protection of infrastructure, access to finance and planning strategies could not be linked to any of the infrastructure indicators. However, if the policy was implemented such that the number of planned trainings were to be conducted, that could increase the preventive capacity of the operator on how the infrastructure could be protected. Also, planning strategies, which include resilience documentation, policies, guidelines and capacity-building plans were considered to be linked to developed, adopted and reviewed legal frameworks and energy law enforcement. It should be noted that the scope of indicator integration in Table 2 only includes indicators that were used in the case studies and not all the indicators in the existing literature.

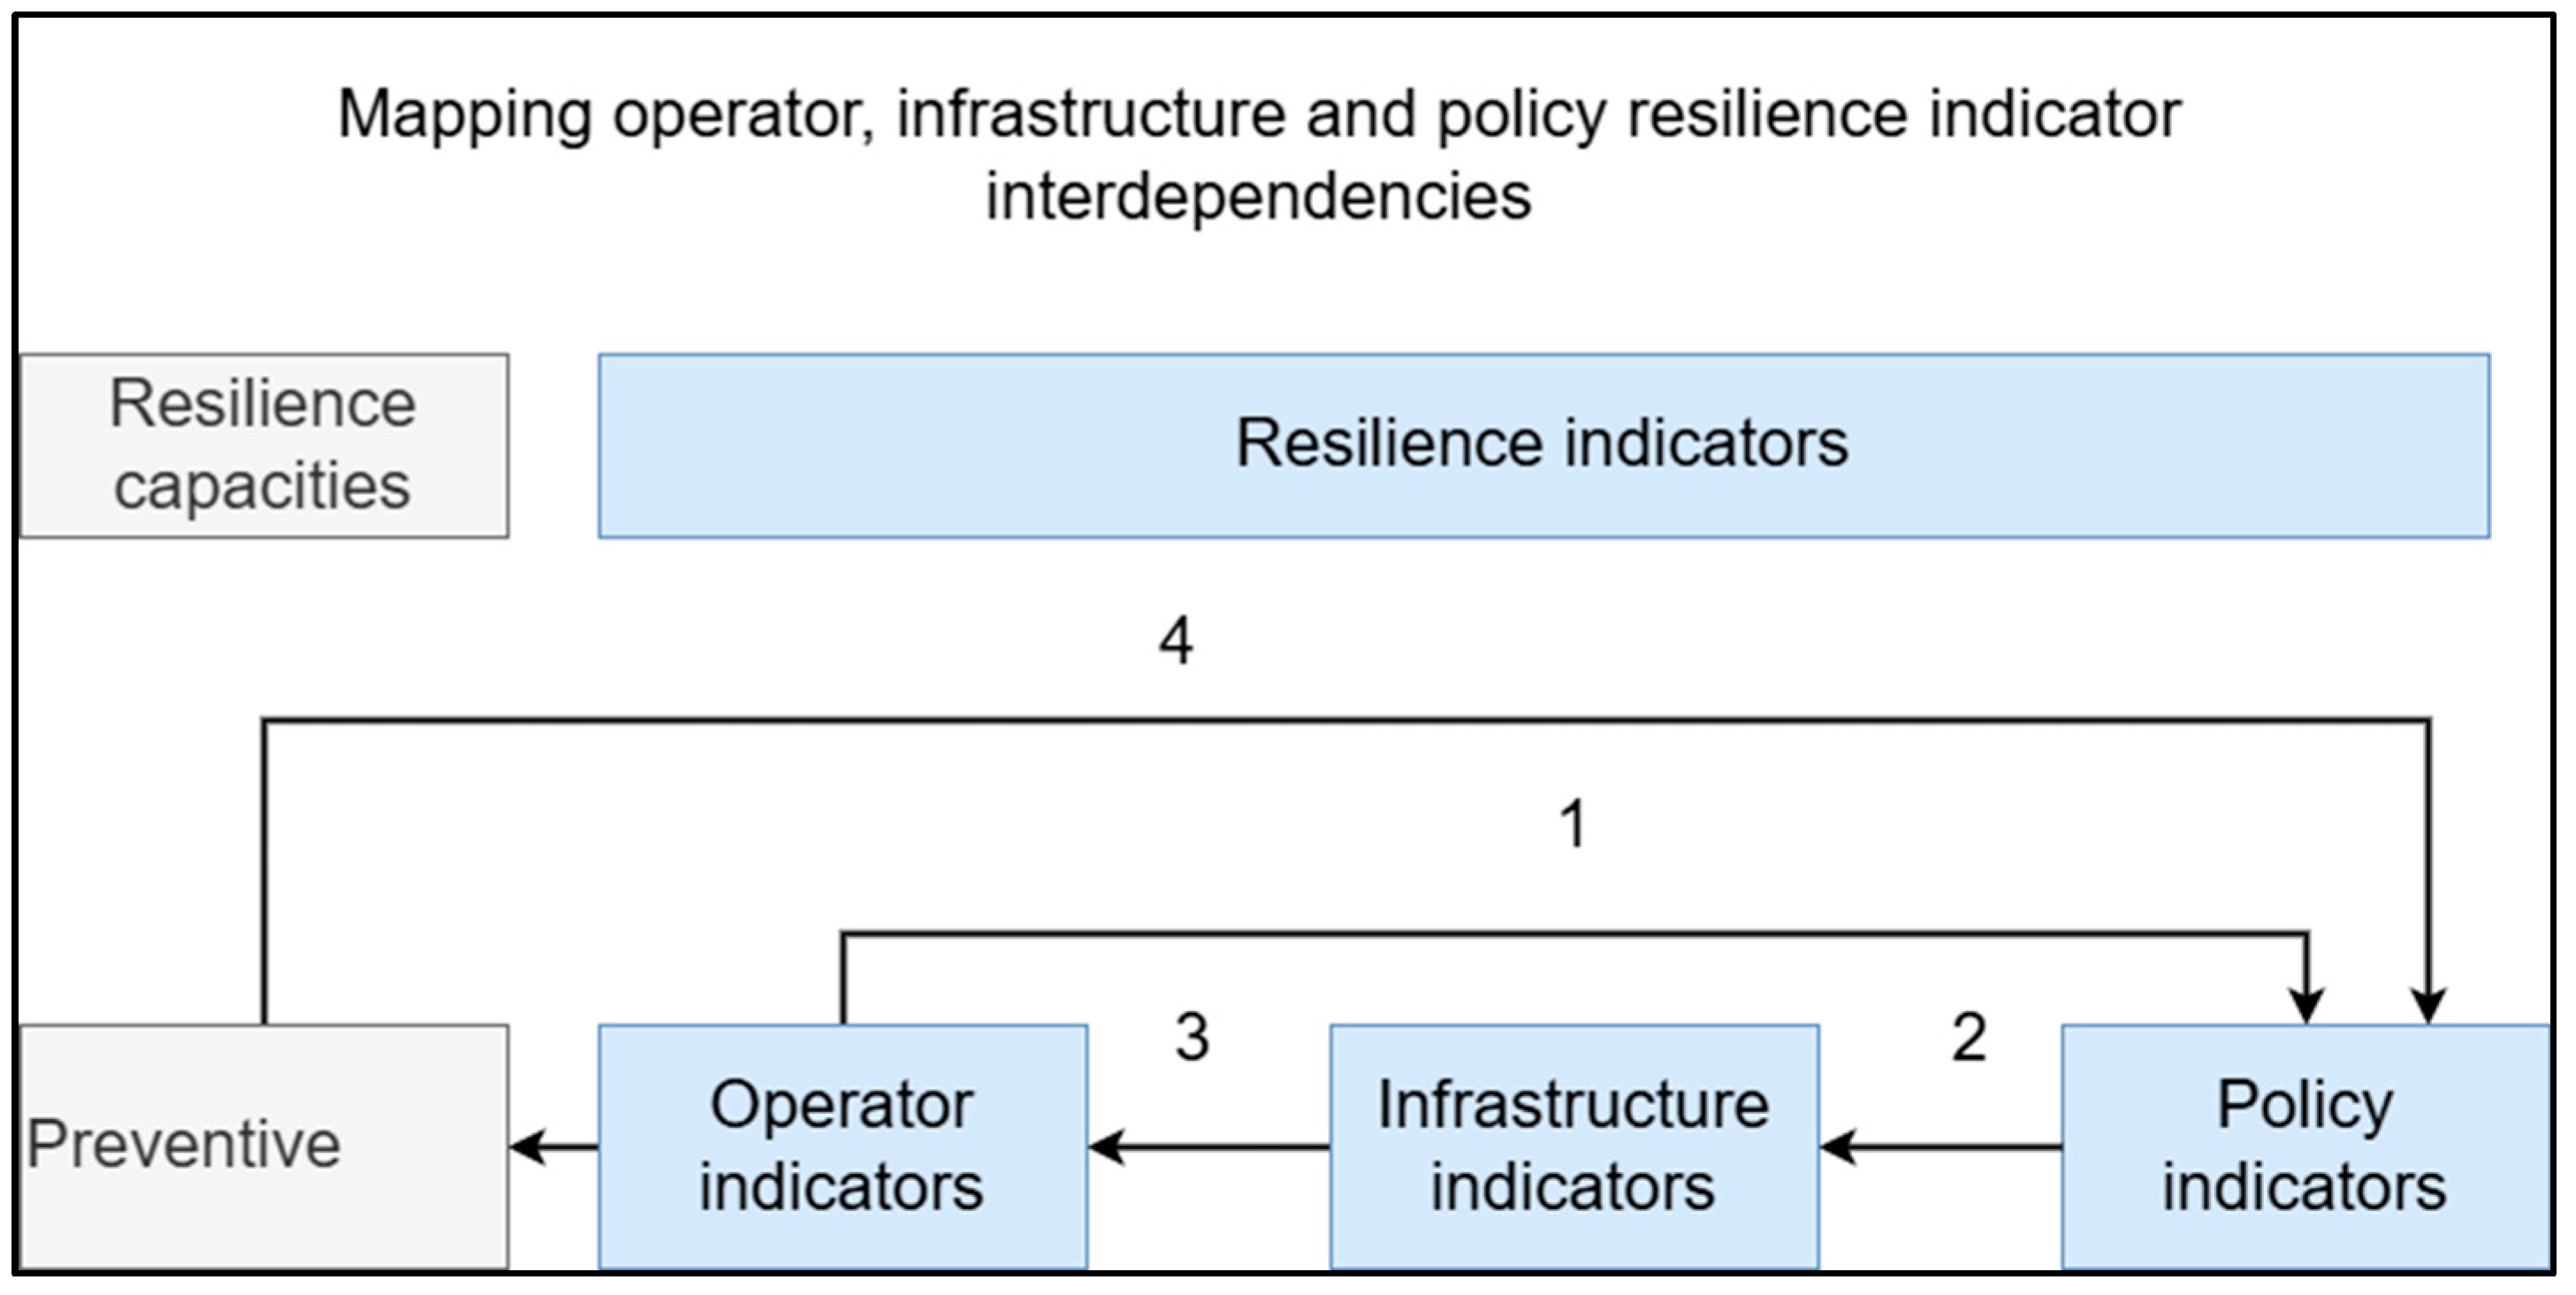
2.2.3. Mapping Resilience Indicators and Identifying Interdependencies

The integrated indicators were then mapped to identify interdependencies. The direction of the arrows indicates how the arrow’s source affects the arrow’s destination, thus showing the relationships between different indicators and highlighting how indicators from one dimension influence or depend on indicators from another. For example, in Figure 2, arrow 1 from operator to policy indicators shows how the existence of shock preparedness may be a manifestation of policy implementation. On the other hand, policy implementation may shape the electricity supply structure (arrow 2), thereby providing shock mitigation, e.g., through diversification (arrow 3), which may enhance the preventive capacity. Having an adequate level of preventive capacity may decrease the target for some policy indicators (arrow 4). Identifying these interdependencies was crucial for understanding the complex relationships underpinning resilience.

2.2.4. Identification and Mapping of Vulnerabilities and Improvement Measures and Identifying Their Interdependencies

This process involved pinpointing critical vulnerabilities and understanding how they were distributed and interlinked. Respective improvement measures were also extracted from individual studies and mapped. This visualisation helped to determine which improvement measures addressed multiple resilience dimensions. This analysis ensures that improvement measures are effective and do not create new vulnerabilities in other dimensions.

2.2.5. Analysis of Interdependencies

The interdependencies among the identified weaknesses and improvement measures. This involved a thorough analysis of how actions in one area affected resilience in others. Most importantly, this integrated analysis led to the development of an IRF for Malawi’s grid that can be applied to different critical infrastructures. The IRF can serve as a model for evaluating and enhancing critical infrastructure organisations across various sectors with customisation. In addition, the framework acts as a valuable tool for planning, operating and managing resilience within power systems, and it allows for a targeted approach to improving resilience. The identified resilience challenges in Malawi present integrated problems, underscoring the need for context-based integrated resilience enhancement, essential for creating a sustainable and resilient power system in Malawi. Integrated resilience enhancement, which can provide significant insights for policymakers, infrastructure managers and resilience practitioners, offers a promising yet underutilised approach to addressing these complex challenges. Based on the scope of this thesis, this section explores the potential of integrating infrastructure robustness (technical), grid operator response capacity (social), and NEP support (policy aspects) dimensions to solve comprehensive resilience problems.

3. Results and Discussions

3.1. Integrating Resilience Indicators

Integration of resilience indicators according to their respective resilience capacities across different resilience dimensions is shown in Table 3. The focus was on three resilience dimensions: technical, organisational, and policy. The emphasis in the organisational domain was on the grid operator, while the spotlight in the technical domain was on the grid infrastructure. The NEP was explored to evaluate the policy domain. Although this integrated framework was comprehensive, not all the indicators could be integrated across all dimensions, implying that not all qualitative indicators can be quantified. For example, some organisational resilience indicators, such as risk transfer mechanisms, could not be directly linked to their respective infrastructure robustness indicators but could be related to policy indicators. Nevertheless, although there was no direct integration, the next section will demonstrate how one resilience capacity influences another. A meaningful integration demands that the policy indicators talk to the operator and infrastructure indicators, demonstrating the need to adjust the policy to include specific resilience issues.

3.1.1. Preventive and Anticipative Capacity

The electricity supply structure revealed the installed capacity, presenting an unpreparedness for shocks due to insufficient reserves, thus showing operators’ inability to maintain electricity delivery during grid shocks. The lack of redundancy in transmission lines was evident in the operators’ failure to continue electricity delivery even with total generation capacity [14]. While capacity-building policy indicators could not be quantified using infrastructure resilience metrics, their effects were observed in the inadequate physical protection provided by the operator. Similarly, lenient laws on infrastructure vandalism negatively impacted the operator, making the infrastructure susceptible to vandalism, causing grid outages. However, the newly enacted Electricity Act of 2024 is punitive. Because resilience issues were not addressed in the policy, the operator did not see the need to comply with non-existent laws regarding resilience documentation. The anticipative indicators used in this analysis were qualitative and could not be quantified.

3.1.2. Absorptive Capacity

The electricity supply structure influenced the amount of capacity lost, as hydroelectric generators were vulnerable to hydrological disasters, especially given that the supply is almost entirely hydro-based. This supply structure also determined the capacity of the operator’s transmission resources and owned assets. The lack of diversified generation capacity, with reliance on hydro, exacerbated the impact of degradation: when Kapichila hydropower plant was washed away, the entire grid shut down due to the absence of a generation reserve. The operator did not own any assets. Off-grid solutions could have aided emergency response in areas where transmission lines were down, thus reducing the amount of active power lost. Humanitarian assistance and access to finance were not directly quantifiable in the technical domain and were not included in energy policy, highlighting the need for their inclusion in policy reviews.

3.1.3. Adaptive Capacity

Apart from the supply structure, the diversity of electricity sources and off-grid systems also influenced the resilience of the infrastructure managed by the operator, contributing to the prolonged recovery time after disturbances. The shortage of redundancy routes led to extended blackouts in some load centres during grid disturbances. The absence of mechanised repair equipment delayed the restoration of broken transmission lines. In some grids, such as the central and northern grids, the lack of a connected grid monitoring system has prevented timely fault reporting, increasing the duration of the degraded state. Capacity building and legal shortcomings in the policy affected operations, as these were considered not legally binding. This calls for guidelines on the legally acceptable duration of disturbances. The National Grid defines the acceptable disturbance duration [28]. Adaptive capacity, which relies on the ability to learn from experience, is crucial, and information plays a key role in its success. Although factors such as access to information, leadership, governance, and management structures could not be quantified using infrastructure resilience metrics, they reflected essential legal and capacity-building policy indicators.

3.1.4. Restorative Capacity

The absorptive capacity is the nucleus of resilience as it is the realisation of the effectiveness of preventive, anticipative, adaptive and transformative capacities [12]. By implication, the operator’s restorative capacity depends on almost all the other indicators. Most importantly, the operator’s ability to respond effectively depends on how robust the infrastructure is. Qualifying restoration indicators was challenging. However, the lack of policy implementation causes weak infrastructure and slower restoration/recovery rates. The absence of off-grid options slowed the restoration of electricity delivery due to damaged firm generation.

3.1.5. Transformative Capacity

Due to the non-implementation of the energy policy, there was no additional infrastructure to be managed by the operator, reducing the increase in installed capacity. By not implementing the energy access targets, consumption remained unchanged. Some structural rigidities, policies, regulatory frameworks and access to natural resources could not be quantified based on the scope of work, but these were manifestations of policy non-implementation.

3.2. Mapping Interdependencies

The arrows in Figure 3 show the relationships between different indicators and highlight how indicators from one dimension influence or depend on other indicators. The direction of the arrows in the map shows how the source of the arrow influences its destination, demonstrating how indicators from one resilience dimension impact or depend on those from another. By understanding the interdependencies, stakeholders can develop strategies that address all areas together rather than in isolation. That would prevent circumstances where enhancing one aspect does not lead to unplanned vulnerabilities elsewhere. For example, even if the grid is robust, the system might fail during a crisis if the grid operators are not trained well, or policies do not support quick responses. Strong policies can drive investments in infrastructure robustness and better training for grid operators. Thus, understanding interdependencies prevents resilience gaps by ensuring that resilience interventions in one area (e.g., redundancy measures) are complemented by aligned policies (e.g., financing for infrastructure development) and operator response capacity enhancement (e.g., through capacity building).

3.2.1. Preventive Capacity

These resilience features depend on the infrastructure’s status and the capacity of policy to support the operator. The operator’s preparedness is bidirectional. The infrastructure status of the electricity supply demonstrates how prepared the operator is for impending disasters. Still, it could also lead to installed infrastructure capacity that is in a good state, adequately maintained, diversified, balanced capacity mix, and protected against all attacks. Diversification, capacity mix, and law enforcement depend on the effective implementation of the energy policy.
The existence of resilience documentation in the grid operator’s organisation may need to be enforced by laws and regulations. Moreover, adequate solid legal instruments to deal with issues of infrastructure attacks such as vandalism, leeway encroachment and diversion from ordinary standards of powerline construction could be promoted by policy support. The policy could have guidelines on these issues and enforce them to guide grid operators on resilience practices. An effective preventive approach may also require meaningful collaboration between the infrastructure managers and policymakers. Preventive capacity depends on financial commitments, which the energy policy can define [29]. At the same time, the operator can directly finance the infrastructure by using its revenues to develop it.

3.2.2. Anticipative Capacity

This is a function of institutional policy support through capacity-building policy targets and some infrastructure aspects [6]. Training and capacity building ensure that staff have all the necessary expertise to tackle any threats to the safety of personnel and the infrastructure [30]. This includes threat awareness, development of resilience procedures, emergency response and risk management. The extent of the operator’s risk knowledge affected how impacts on the infrastructure were anticipated and how preparatory or response measures were overseen. Coverage of early warning systems and early activity by the operator impacted grid monitoring and response capability, resulting in extended recovery times because of underestimation of threat impact severity. Risk transfer mechanisms are a secure way to mitigate anticipated infrastructure loss. Although the risk was transferred to insurance companies, the book value of the network elements at the time of loss was generally higher than the transferred value. All these are grouped into disaster preparedness, which can define the network topology to mitigate the impacts of anticipated events.

3.2.3. Absorptive Capacity

At the centre of infrastructure resilience is its ability to endure the shocks, which reveals the level of preparedness and expectation and how past events were used as a learning point to build the infrastructure bigger, better and stronger [26]. The infrastructure’s ability to withstand grid shocks heavily depends on its robustness, which depends on implementing the energy policy’s infrastructure targets, such as capacity expansion, diversification and capacity mix [26,31,32]. A diverse, resilient infrastructure has adequate generation capacity, is redundant, and demonstrates robustness through its continued operation during disturbances. A robust infrastructure loses its functionality slowly and quickly returns to its original status. The lost capacity is not huge, and critical services are still supplied with electricity. All these demonstrate its resistance to shocks, which heavily depend on its physical state. This physical state, in turn, depends on the effective implementation of technical policy targets. The lack of technical implementation left the infrastructure weak and incapable of withstanding shocks. Implementing the policy gives the operator ownership of assets and internal resources. The lack of resources and assets reduces the operator’s response (restorative) power, increasing the amount of capacity lost or the rate at which the capacity is lost under disasters. In addition, the infrastructure is more vulnerable, which risks leaving grid-connected customers without electricity in times of grid distress.

3.2.4. Adaptive Capacity

The ability of the grid operator to exhibit intentional and planned decisions to achieve a required state even when conditions have changed or are about to change depends on the level of absorptive capacity [26]. Diversification reduces over-dependence on one power generation technology, affecting the operator’s adaptive capacity [33]. Policy support in governance, modifications, and awareness is essential for the operator to adjust infrastructure and operations in preparation for future disasters [34]. The lack of exposure to resilience threat information or the infrastructure’s situational awareness may inhibit proper learning from historical events, leading to prolonged infrastructure neglect. The speed at which data are quickly acquired and stored in secure locations to facilitate the management of disruptive events [35] also determines how the infrastructure is prepared for disasters. This information can be used for grid studies and well-informed policy formulation [36]. The extent of self-organisation to moderate future damages, observed in leadership, management, and governance structures, can also affect the duration the infrastructure stays degraded.

3.2.5. Restorative Capacity

The ability of the operator to restore the infrastructure as quickly as possible depends on the co-existence of all the other capacities [34]. The status of the installed capacity is as important as the level of preparedness by the operator in ensuring quick service restoration [37]. Even when the installed capacity is adequate or robust, and the operator is prepared for disasters or risk transfer mechanisms are in place, the network topology can sometimes make it difficult for the operator or maintenance crew to recover or restore system functionality as quickly as possible in terms of accessibility [38]. The ability to restore electricity supply following severe grid disturbances also depends on the available generation and transmission or redundant assets and the extent of damage or degradation rate. Leadership and governance issues also contributed to slower decision-making, translating into longer restoration times. Excess or redundant capacity would be easily used if the infrastructure were transformed. All the problems impacting the infrastructure or operator mentioned above are effects of not implementing the NEP, which resulted in vulnerable, weak and compromised infrastructure as well as an unprepared custodian of the network.

3.2.6. Transformative Capacity

This relies on institutional and infrastructural targets for policy implementation as NEP is one of the dimensions in evaluating the transformative resilience theory, where policy performance is considered one of the resilience indicators [26]. A transformed infrastructure portrays increased capacity, flexibility in governance structures, and enabling legal frameworks, to mention a few. Technical implementation changes the country’s energy landscape, giving it a complete and required transformation. The increased installed infrastructure builds the operator’s capacity to be improved.

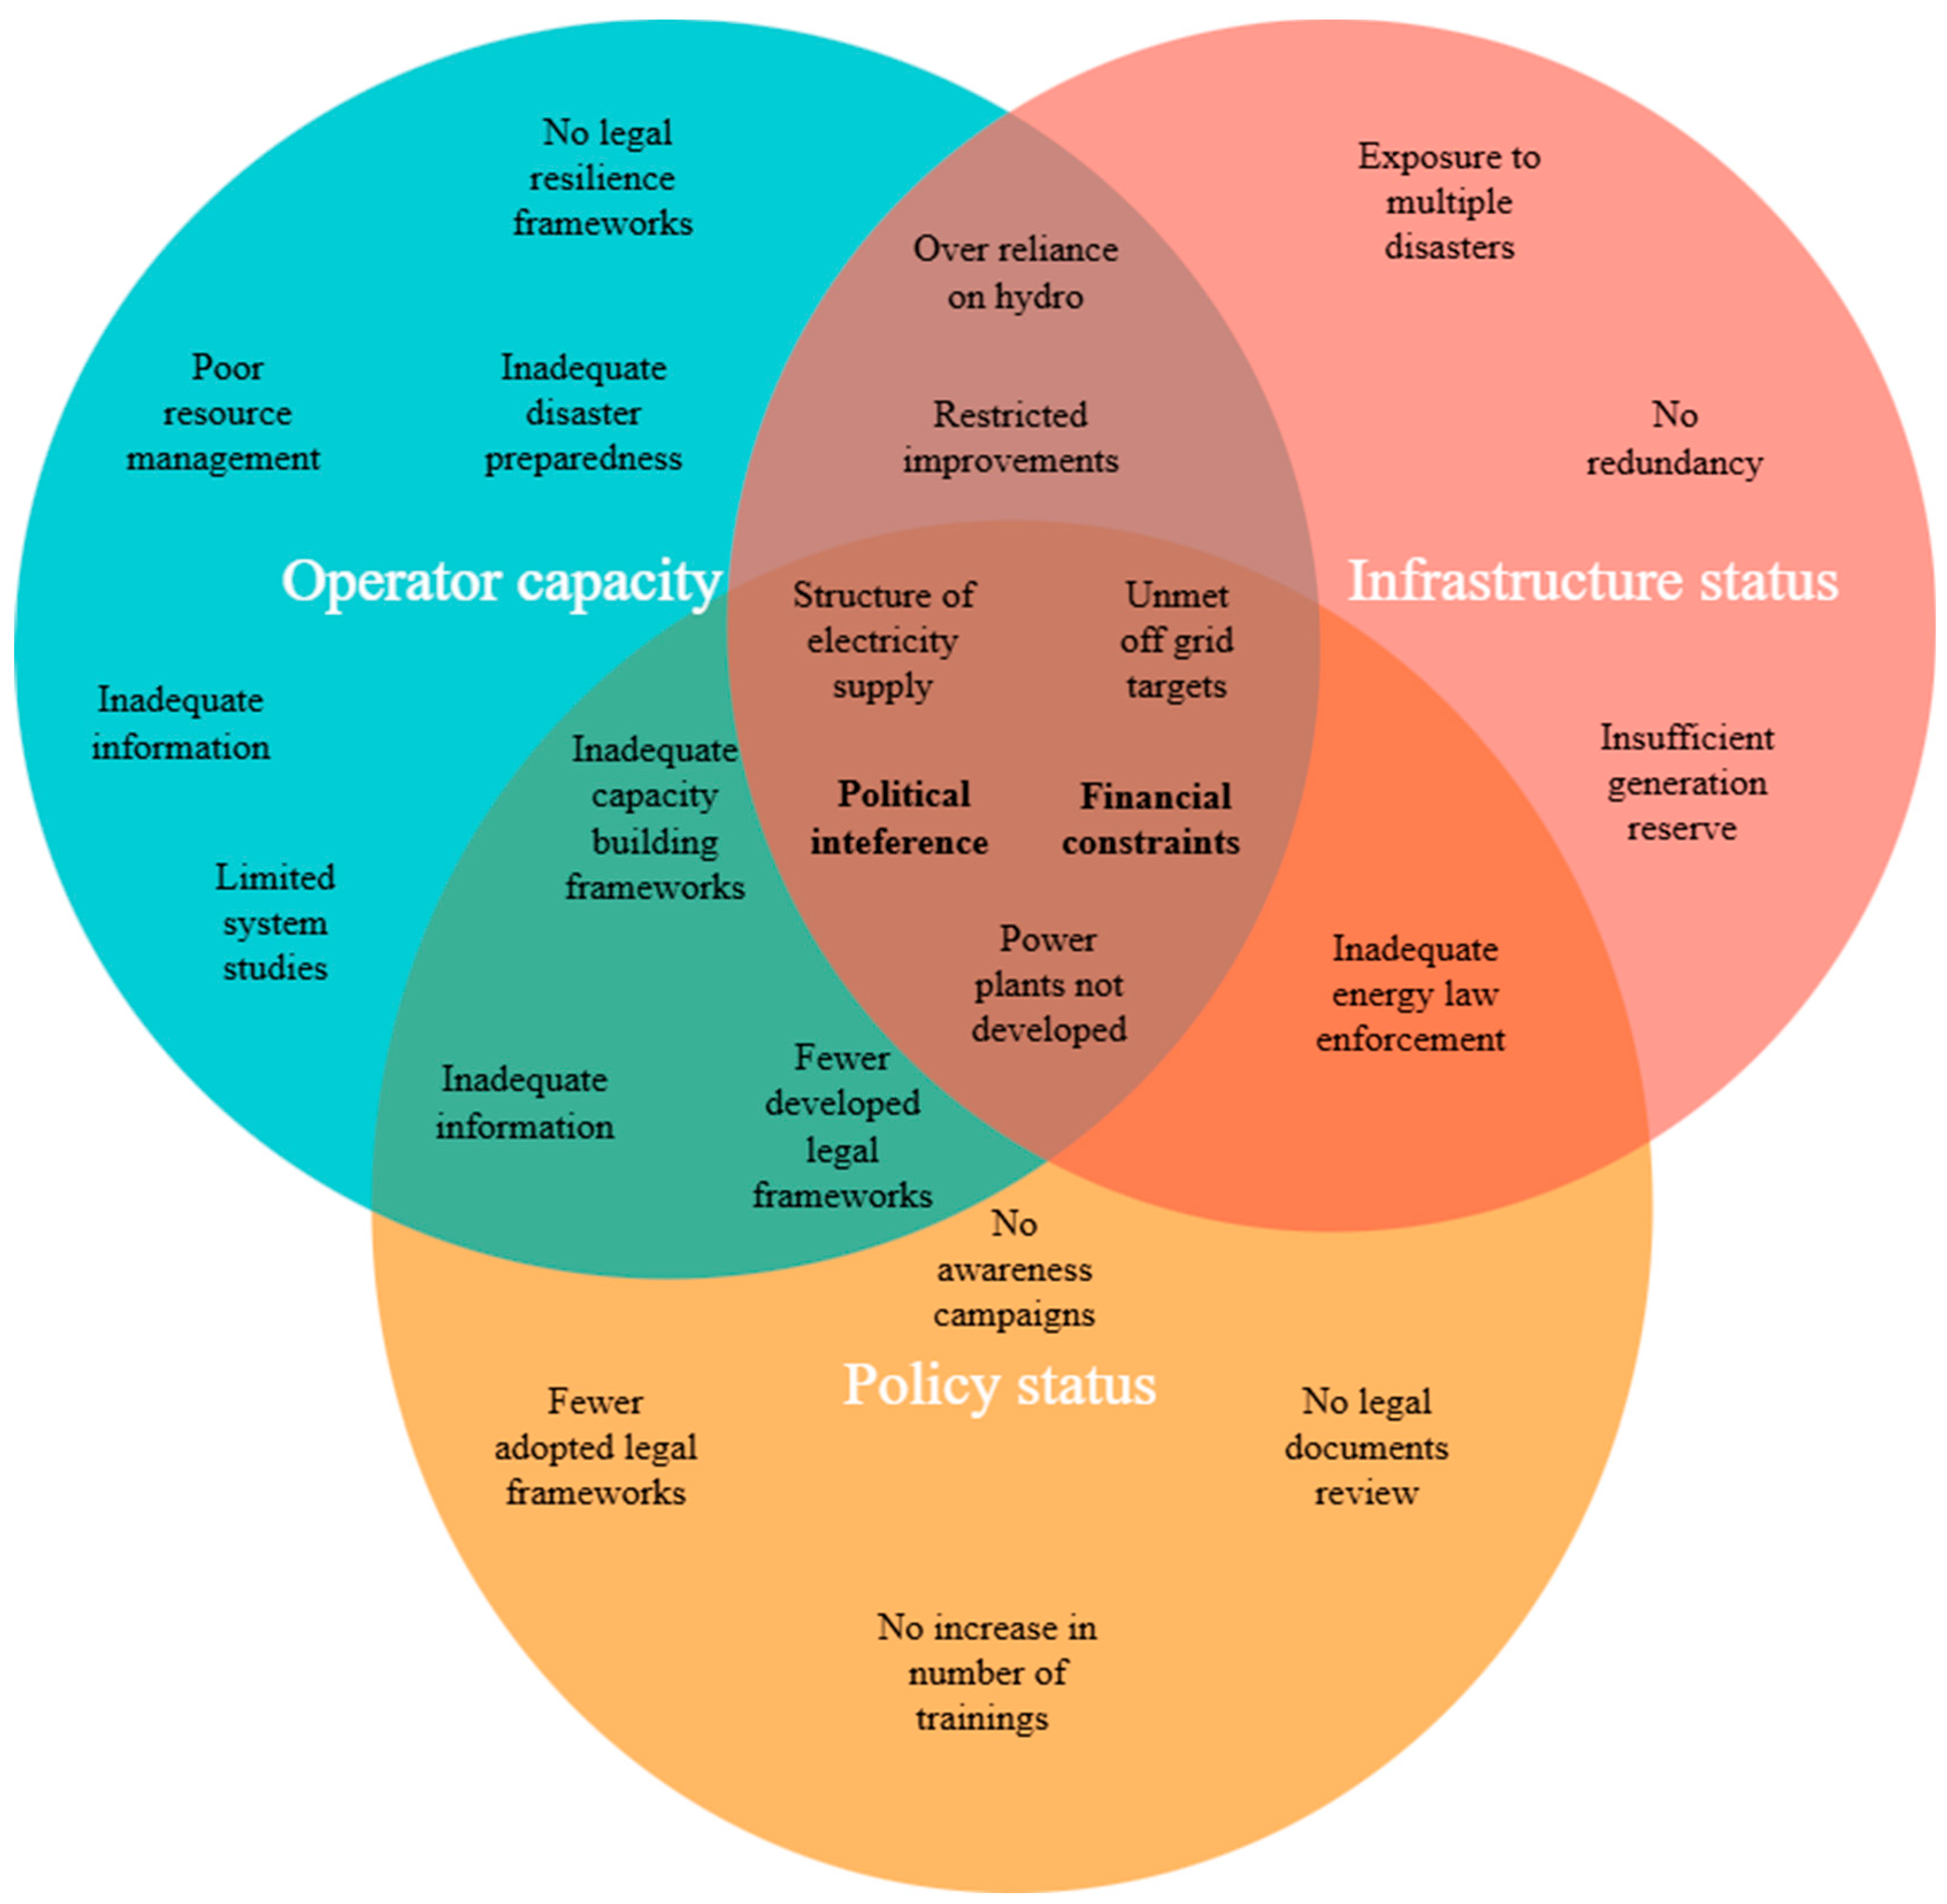
3.3. Mapping Integrated Weaknesses

The interconnection of resilience challenges as identified in the three case studies described in the introduction are presented in Figure 4. Apart from the individual weaknesses in respective dimensions, intersections were observed between (i) operator and infrastructure, (ii) operator and policy, (iii) infrastructure and policy and (iv) operator, policy and infrastructure.
The infrastructure is exposed to severe weather-related disruptions which pose an enormous and increasing threat to the nation’s electric power systems and the associated socio-economic systems that depend on reliable delivery of electric power [39]. Between 1934 and 2022, Malawi recorded over eight major droughts and 20 incidences of flooding [12]. These extreme disasters have been classified with different return times for mitigation purposes. The Malawi 2015 floods were classified as a 1 in 500-year event [40], while the 2016 drought was classified as a 1 in 35-year event [41]. While the 2022 TCA was associated with a 1 in 50-year return period [42], the 2023 tropical cyclone Freddy (TCF) could not be classified in terms of the return period. However, TCF reached the equivalent intensity of a category 5 hurricane at its peak [43]. There is a risk that if Malawi does not receive enough rain or experiences the two-year drought that was experienced in 1914 again, the Shire River could stop flowing, and there would likely be a power crisis [44]. Being an electricity system that almost wholly depends on hydro from the Shire River, this poses a significant risk to the electricity supply system. The 2015 and 2019 floods resulted in up to 14 days of downtime, where 109 min of complete shutdown were recorded in 2019 due to damaged generation, transmission, and distribution structures [12]. The 2022 TCA caused close to 48 h of national blackout due to lost power generation and transmission systems. Moreover, 129.6 MW hydropower generating plant was damaged [45,46], and many transmission towers along the Shire River were brought down, overwhelming the mitigation measures that were put in place [47].
This infrastructure is also underdeveloped with inadequate transmission and generation capacity as established in the case. The total installed capacity of the electricity generating company (Malawi) Ltd. (EGENCO) is approximately 441.5 MW, of which 87% is currently available [48]. Almost all EGENCO’s hydropower generation stations are located in the Southern region of Malawi along Shire River (the main outlet of Lake Malawi), except for a capacity of 4.5 MW, which is located in the Northern region on Wovwe River. In addition to the hydropower plants owned by EGENCO, Justin Christian Martin (JCM) Solar installed 80 MW of grid-connected solar PV plants at Nanjoka (60 MW) and Golomoti (20 MW). Recently, another 20 MW solar PV plant was added in Serengeti, Nkhotakota. The capacity of privately owned generators is difficult to ascertain, but according to a survey that was performed by the Community Energy and the Sustainable Energy Transition (CESET) in Ethiopia, Malawi and Mozambique in 2021, it was estimated that there were 30 community energy systems in Malawi, of which only 22 were active [49]. Malawi has a small electricity supply system as compared to its neighbours, which are 2700 MW for Mozambique [50], 1740 MW for Tanzania [51] and 3700 MW for Zambia [52]. In Malawi, an N-1/N-2 planning standard which must conform to all relevant voltage and the appropriate current limits, under all realistic system conditions is used for power system design, according to the grid code [53]. However, this is rarely followed which leaves most critical lines non-redundant.
Power system’s resilience weaknesses are multifaceted, often stemming from interconnected vulnerabilities across different dimensions, including operators, infrastructure, and policy domains, as shown in Figure 4. A common weakness between operators and infrastructure was an over-reliance on a single type of electricity generation. This was evident when the nation experienced sixteen months of extensive load shedding by the operator following the washing away of the Kapichila power plant, and the system did not return to its original status following the 2022 TCA. Diversification, in the form of the capacity mix, is a vital resilience feature in mitigating the impacts of shocks and responses [54]. Ref. [55] demonstrated the importance of diversification in building resilience. However, due to a gradual decrease in policy support, their approach compared technological and geographical diversification to mitigate market risks for investors. In areas where climatic risks are an issue, geographical diversification would be as important as technological diversification. The capacity mix helps with load shifting during grid emergencies. Both operator and infrastructure also suffered from restricted improvements following the 2022 grid shocks. Compromised system enhancements left the infrastructure vulnerable to disasters, while the operator faced challenges in delivering electricity. Although the six main transmission conductors that were brought down during the 2022 TCA represented only 8% of transmission conductors, these transmitted power to significant load centres that did not have substitute supply paths, leading to higher energy not supplied (ENS) to customers and extended duration of electricity outage. The National Grid [28] aims for ENS of 316 MWh/a such that companies lose money for an annual loss of supplies above the threshold value. Some transmission lines took up to approximately 25 days to be restored while the damaged power station took 16 months. Consequently, certain load centres were not supplied for the entire 25 days. The UK Standards of Performance set the speed at which power should be restored following a disruption, varying from 1 to 2 days in extreme weather [28,56].
Organisational and policy domains intersect in capacity building, legal frameworks, and information sharing. The absence of resilience-oriented capacity-building frameworks by policymakers was evident in the operator’s inadequate resilience-oriented training since training promotes institutional resilience [17,22]. The lack of specific legal frameworks or clauses allows Operators to discharge their duties carelessly, exacerbating physical infrastructure inadequacies and inherent weaknesses [57]. These infrastructure weaknesses are bidirectional. On one hand, the operator neglects proper maintenance, repairs, and development of the installed capacity. On the other hand, the infrastructure is old, inherently weak, has insufficient installed capacity, compromised network topology, and is exposed to multiple disasters.
While other operational weaknesses may not be interconnected, they directly affect how the infrastructure is managed during emergencies, underscoring the need to enhance infrastructure capacity [58]. It was observed in [14] that absence of legal resilience frameworks, disaster preparedness plans information, resources and system studies compromise the anticipative, preventive and restorative abilities of the operator, leading to delayed system restoration.
NEP’s failure to adequately support PSR was established in another case study [18]. Failure to review documents means that emerging issues that affect PSR are not accounted for in existing documents. Although the trainings to be conducted were not meant for operators only, failure to conduct planned trainings and awareness campaigns reduces the anticipatory and preventive skills which could directly or indirectly affect PSR. Not adopting legal frameworks is a risk to energy justice which may hinder proactive resilience measures. This is because legal frameworks grant the basis for guaranteeing fair and equitable access to electricity supply, as well as for developing approaches to handle possible disturbances and exposures in the power system. The lack of law enforcement affects the infrastructure through rampant vandalism, as there are no punitive laws or enforcement of existing laws [59]. The recently enacted Electricity Act of 2024 includes punitive laws. However, it is one thing to have the laws, but it is a different thing to enforce those laws.
Political interference and financial constraints are core shared challenges across all domains. Decision-making can be heavily influenced by political agendas rather than efficiency or necessity, compromising operational integrity and adaptability as political resources are essential [60]. As was established in [18], political and energy investment calendars do not match such that political leaders tend to abandon long-term energy projects as these do not reflect tangible outputs by the end of the political calendar, which affects the voting dynamics. Consequently, this affects the status of the electricity supply, e.g., capacity expansion. A lack of infrastructure development across all dimensions is evident. Financial constraints are pervasive, restricting the ability to invest in necessary upgrades, maintenance, and innovations that could enhance resilience and ensure sustainable and reliable operation. The findings from a case study [18] revealed that energy access, off-grid, and energy efficiency targets were not adequately met. Only 5 percent of the planned hydropower plant site development was commissioned. For the three coal-fired power plants that were planned to be fully operational by 2023, adding 620 MW to the national grid, only environmental impact studies for one were completed. Approximately 13 per cent of the proposed solar power plants were commissioned. Most activities that had not been completed within their planned time limits lacked financing [61]. Economic constraints are consistent with the findings of [62]. This highlights the cost of resilience. Investing more in the policy has been suggested as one of the resilience improvement techniques [63]. While resilience is expensive, its benefits are immeasurable.
The discussion in this section shows how interconnected resilience challenges are. This is consistent with Strachan and others [13] who showed that most global challenges are interconnected and multidisciplinary in nature. Therefore, solving these interconnected challenges requires an interconnected approach. In this context, these identified interconnected vulnerabilities form the basis for connected resilience enhancement discussed in Section 3.4, Section 3.5 and Section 3.6. This approach is superior to existing, conventional disjointed methods because it may offer a holistic, robust solution.

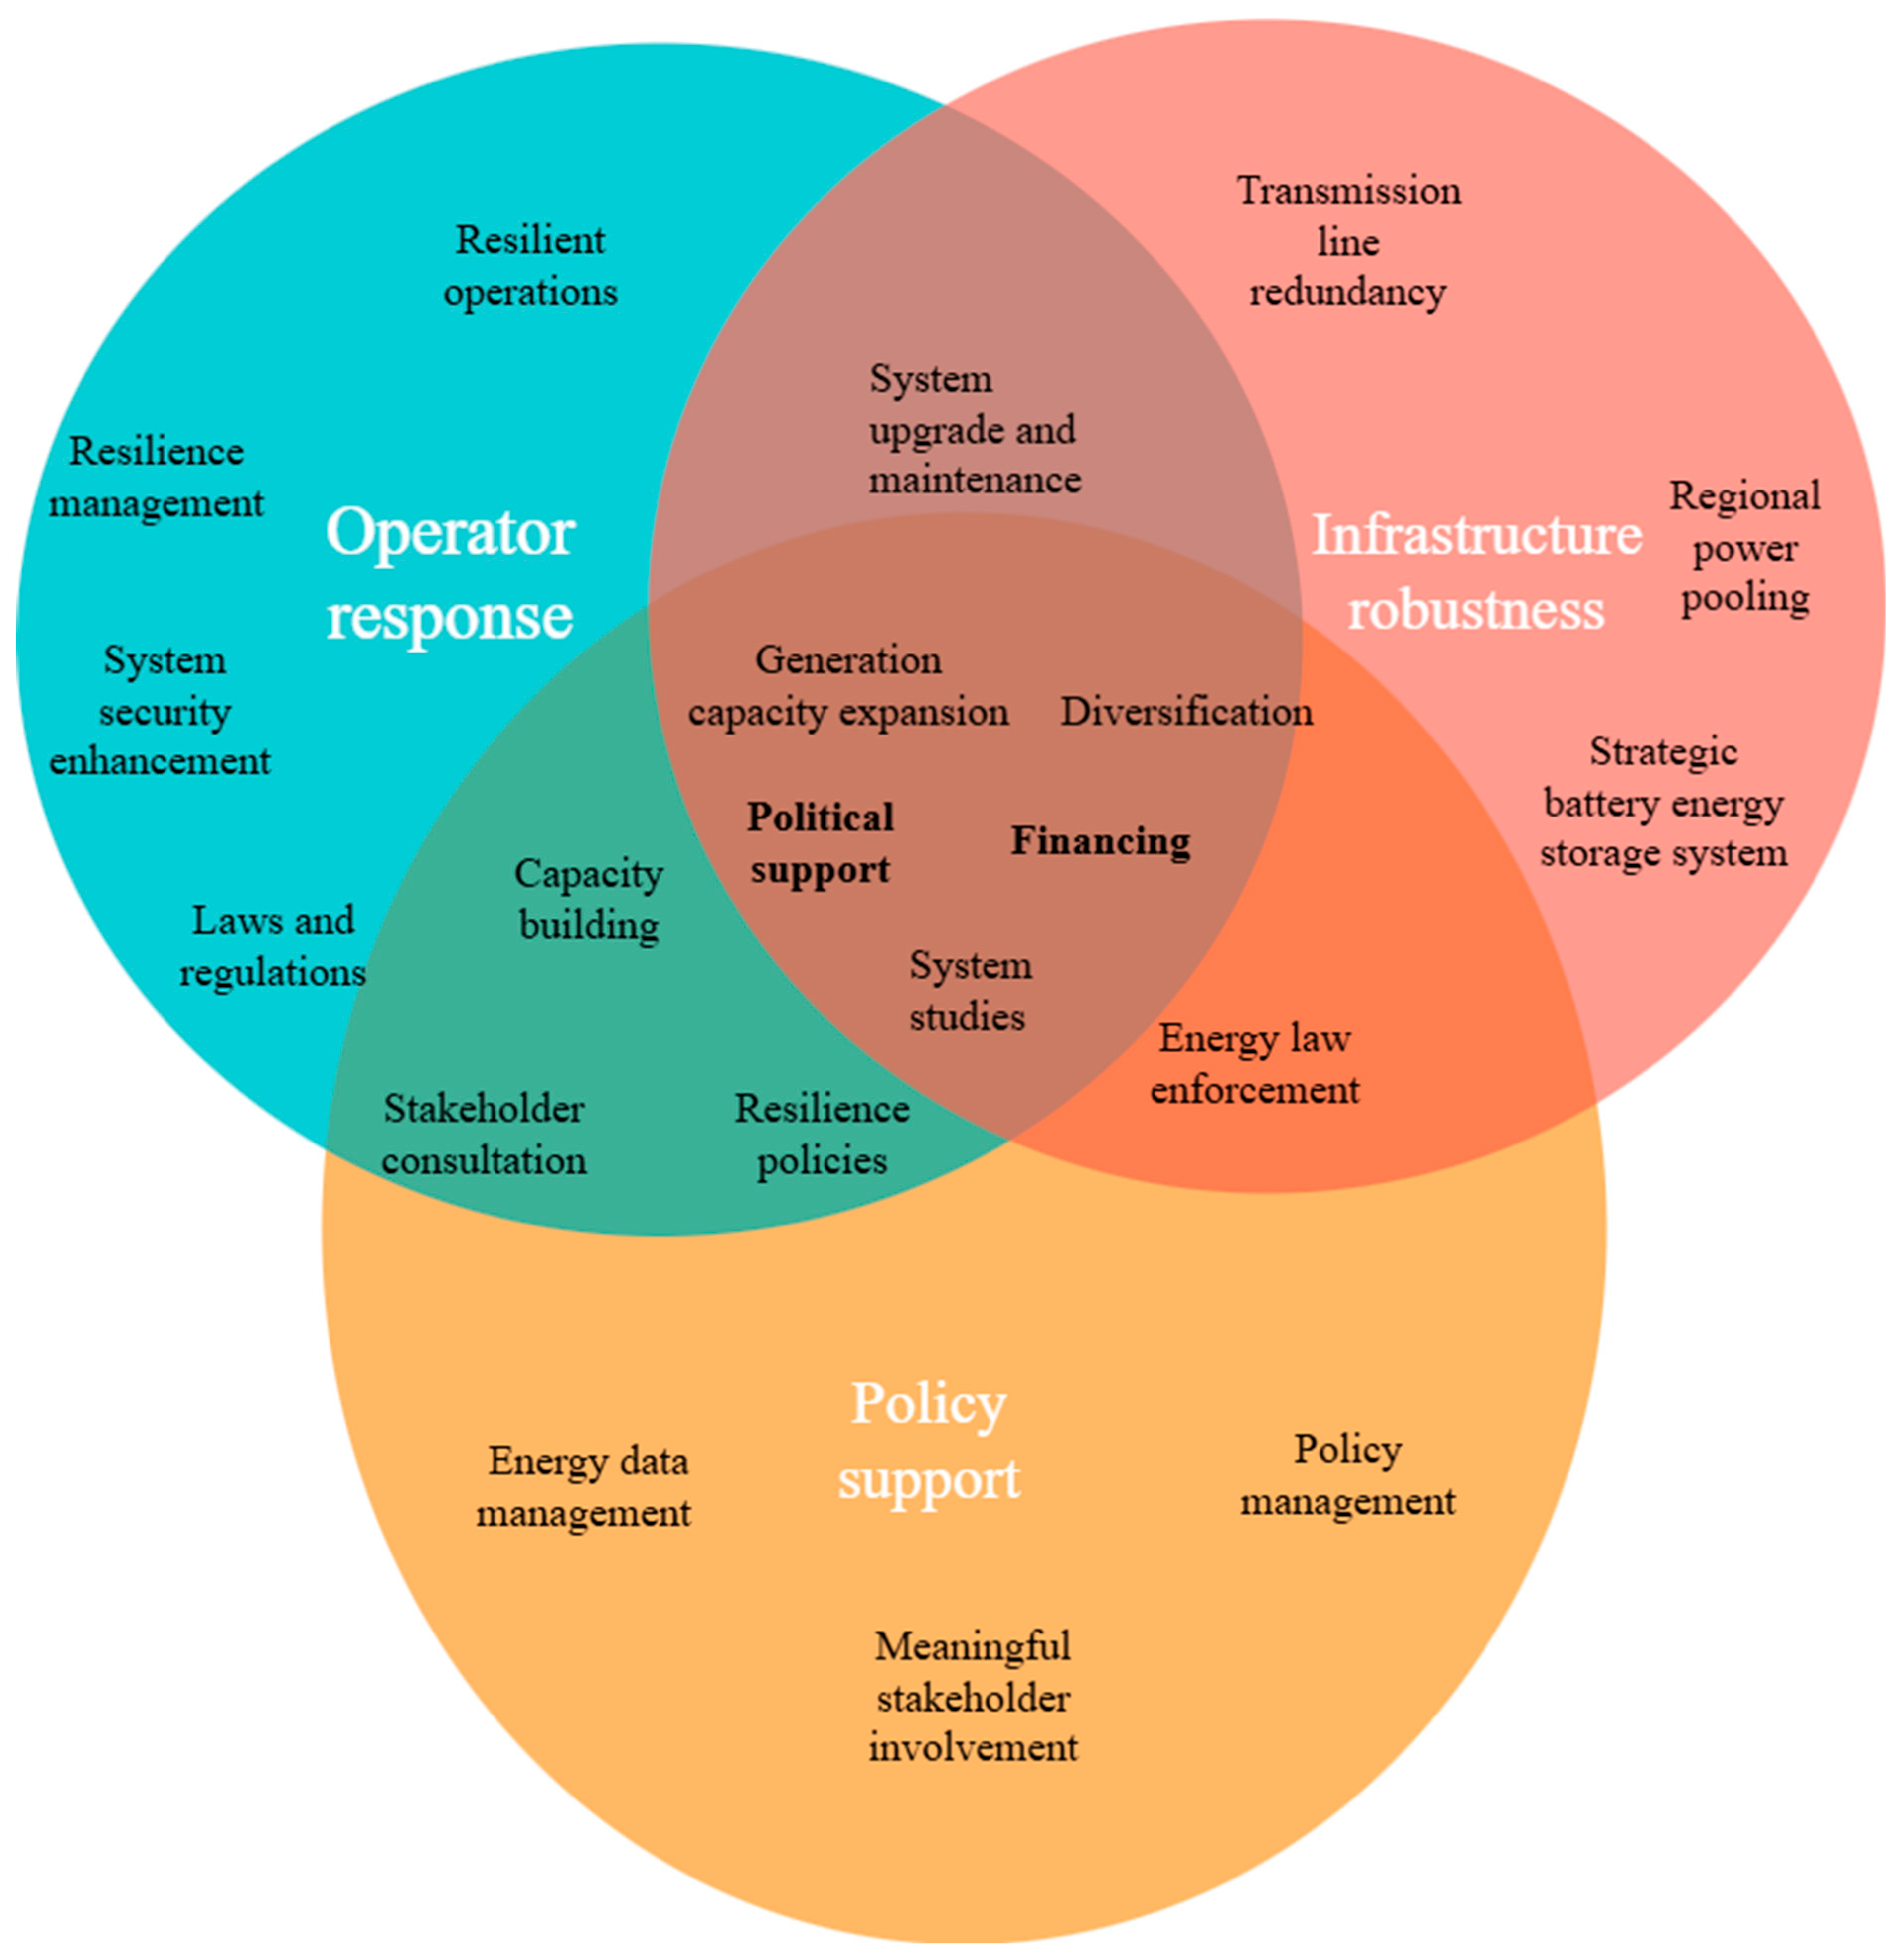
3.4. Integrating Resilience Improvement/Enhancement

Resilience improvement in the context of energy systems is a multifaceted endeavour that necessitates the interconnection of various measures across different dimensions [64,65]. For an infrastructure solely under the operator’s custody, the capacity of that operator to manage the infrastructure during grid emergencies depends on the infrastructure’s robustness [27]. This was also established in the case studies [14], underscoring the need for holistic resilience enhancement, which is demonstrated in Figure 5. Similarly, infrastructure robustness depends on policy support through effective policy implementation and improved operator response. Based on the infrastructure resilience challenges that were identified in the case studies, infrastructure robustness depends on transmission and generation capacity expansion, which heavily relies on effective policy implementation. In the case studies, transmission line redundancy [15], adequate generation reserve, and strategic placement of battery energy storage (BES) were explored for grid improvement. Generally, standard enhancement measures include diversification focusing on distributed energy resources (DERs), which reduces dependency on single sources and increases adaptability during disruptions. Distributed generation enhances generation reserve as well as emergency response [37,66,67]. Microgrids (MGs) take part in emergency response by supplying critical loads. System upgrades and maintenance are crucial for ensuring the infrastructure remains robust and capable of withstanding or quickly recovering from adverse events. System studies can inform these system upgrades. System studies can also inform policy formulations thereby ensuring clear, achievable and empirical-based targets. Capacity expansion and system studies help understand the evolving demands and potential vulnerabilities, allowing for proactive improvements.
Financing and political support are central to all these resilience dimensions, which serve as overarching determinants. Adequate financial resources are essential for initiating and sustaining resilience measures, from investing in advanced technologies and infrastructure upgrades to supporting policy initiatives and capacity-building programmes [29]. Political support ensures that regulatory frameworks and funding are aligned with resilience objectives, while capacity building empowers stakeholders with the knowledge and skills required to implement and sustain resilience strategies [33]. Thus, the interconnectedness of resilience improvement hinges on a holistic approach where financial support and political will underpin efforts across operators, infrastructure, and policy frameworks.
Collaboration between policymakers and infrastructure managers is essential to ensure comprehensive resilience planning [60,62]. Regular workshops and joint exercises may be necessary to build trust and improve coordination. Resilience policies are essential in guiding the operator’s resilience operations. On the contrary, energy laws directly improve the infrastructure by contributing to its physical protection—for example, punitive laws against infrastructure vandalism and encroachment. Overall resilience enhancement calls for a combination of multiple techniques, i.e., solving PSR weaknesses is not only about enhancing the infrastructure’s robustness but also ensuring policy support and the improved operator’s response. Comprehensive resilience, therefore, requires a multidisciplinary approach for systems to withstand and quickly recover [68,69].
Resilient operations are in line with [70,71,72]. Equipment prepositioning was used as a preventive control measure in [70] to improve distribution level resilience. During recent weather-related events in Malawi, the restoration of functionality was delayed due to logistical challenges. For example, the 132kV Kapichila to Mlambe transmission corridor was brought down, and repair works were delayed while moving emergency towers to fault locations. Aside from prepositioning equipment, response times could be reduced by subcontracting and decentralising some operations. Decentralisation was believed to be key in lowering systematic delays arising from office procedures. Moreover, although utilising available resources was equally important, optimising resources was also identified. This optimisation included having an optimised staff or repair vehicle-to-customer ratio. Faults took a long time to be cleared because the repair crew sometimes waited for that one repair vehicle-to-service other affected customers.
Resilience management in this work is defined based on the combined definitions of management and organisational resilience as provided by ISO 22316: 2017 [73]. It is described as coordinated activities to direct and control the ability of an organisation to absorb and adapt to a changing environment. The coordinated approach includes issues of leadership, management, resource mobilisation, governance structures, investment, effective implementation, evaluation, enhancement and effective communication [73]. Ensuring that the repair crew and vehicles can fully access the faulted infrastructure during grid disturbances is one of the resilience management approaches.
System security enhancement is critical as it helps timely detection of attacks thereby minimising restoration delays. Preventive AI-based techniques were used to demonstrate system security enhancement where power control signals and local measurement data were utilised to evaluate and control the transmission system in real time [74]. Malawi’s grid is prone to physical attack through vandalism and way-leave encroachment. Consequently, antivandal usage, installing security cameras in vandalism-prone areas, use of technologies to detect vandalism and encroachment mitigation were considered appropriate measures. In addition, proper regulatory instruments were key to deter system attackers. While most vandalism occurs to steal copper, in Malawi’s context, it has not just been about copper. It ranges from transformer oil to steel structures. Vandalism detection can identify suspicious activity and trigger alerts before significant damages occur. This can guarantee consistent infrastructure functionality, repair cost minimisation and overall security improvement.

3.5. Integrated Resilience Analysis

While an integrated, comprehensive approach to PSR is essential, energy policy support is superior to grid operator response and infrastructure resilience, as shown in Figure 6. Effective NEP support is pivotal in making the infrastructure robust through effective policy implementation [18]. It shapes the electricity supply structure by promoting diversification, redundancy, and generation reserves and ensuring physical protection through strong legal frameworks and resilience policies. These policies are instrumental in establishing a solid foundation for infrastructure, making it less prone to disruptions and more capable of withstanding various challenges. The grid operator, in turn, relies on this strengthened infrastructure to maintain continuous electricity delivery during grid disturbances [27]. Robust infrastructures experience fewer failures during extreme events and are at lower risk of cascading failures. These features prevent grid operator overload and panic-driven decisions. The inclusion of backup systems is one of the characteristics of enhanced infrastructure, which enables grid operators to reroute power or isolate quickly during grid disturbances, thereby enabling faster and more effective recovery. Further, robust grids have advanced situational monitoring tools, which allow proactive adjustments and help operators act preventively rather than reactively. Furthermore, resilient infrastructures often align with standardised emergency procedures, for example, the North American Electric Reliability Corporation (NERC). This facilitates preparedness and enhances quick response. While the operator depends on infrastructure robustness, improved operator response capacity enhances the infrastructure. An enhanced operator can advocate for upgrades, is less stressed and is free to concentrate on further improvements. However, an improved operator response alone does not replace weak infrastructure, and institutional support is needed to implement the proposed upgrades. Moreover, the operator’s ability to respond smoothly depends on institutional resilience, bolstered by supportive energy policies. As a state-owned entity, the operator’s independence in decision-making is significantly influenced by political support, well-structured energy laws, meaningful stakeholder consultations, and comprehensive capacity-building initiatives. Therefore, while operator response and infrastructure resilience are critical, the overarching influence of energy policy support ensures that these elements function effectively within a robust and resilient power system framework. Thus, an effective energy policy could be crafted in a manner which accounts for infrastructure robustness and operational needs to avoid grid failures. For example, an energy policy pushing for more grid-connected solar PVs could stress the grid if the network lacks load-balancing capacity and operators do not have the capacity to manage severe grid disturbances. Addressing this might involve a phased PV rollout, diversifying electricity generation, phased generation expansion, financial resource allocations to the energy sector to facilitate policy implementation and capacity building.
For effective policy implementation to take place, the identified policy implementation challenges which included financial constraints, inadequate resilience-building policies, policy administration challenges, politics, lack of proper coordination with key stakeholders, inadequate capacity of MoE, and lack of energy data, need to be addressed. Energy policy financing is critical in this integrated resilience-building approach. Although the grid operator is a state-owned unit which operates as a moneymaking unit to sustain its operations and capital budgets, the operator claimed that the revenue is not adequate to support capital expenditures, hence the need for the government’s support. In the budget deficit, the operator borrows from both local and Development Banks and the government act as a guarantor. Following TCA, the Malawi government acquired a World Bank grant to help with generation, transmission and distribution system restoration [75]. An adequate budget would facilitate the development of the entire energy sector. The 2019/2020, 2020/2021 and 2021/2022 energy sector budget allocations were approximately USD 23, 33 and 35 million, representing approximately 0.6–0.8% of GDP and 3% of the total budget [76]. There has not been an indication of the required budget. However, the Treasury usually provides budget ceilings to ministries, departments, and agencies. However, the World Bank [77] argued that Malawi’s energy transformation requires substantial capital, with a total funding requirement of USD 5.5 billion by 2030. Although USD 530.8 million has already been secured, a significant financing deficit of USD 4.95 billion remains. Dedicated funding mechanisms to ensure consistent and adequate financial resources for energy in the energy sector can include public–private partnerships, international grants, and exploring innovative financing options such as sustainable energy or green bonds. Recently, the World Bank [78] approved a $350 million grant for the Malawi government to develop the Mpatamanga hydropower project at the Mpatamanga Gorge on the Shire River in Southern Malawi.
Despite financial constraints, target setting could also be a challenge. Herten, Kantorová and Regenstein [79,80,81] proposed approaches for coming up with ambitious but attainable goals. Developing attainable targets highly depends on empirical evidence [80], thus the need for credible energy data. Kantorová [80] used probabilistic projections, which were also used by the United Nations population division, to define targets as a percentage of existing demand. The probability that at least a certain percentage of the target will be achieved was also evaluated. Although this probabilistic approach takes into consideration the baseline levels and historical rates of changes, the lack of data is a general concern for this approach. However, countries with limited data can be projected using experiences in other countries in the region, for example, the Southern Africa Development Commission (SADC). Another approach by Herten [79] was to be selective and choose a limited number of targets rather than be comprehensive. Having to deal with too much may result in partially achieved fragments. Following this approach, instead of having simultaneous targets, for example, of 1092 MW hydropower, 160 MW solar PV, 620 MW coalfired power plants and 30 mini grids development in the five-year policy cycle, the attainable approach would be concentrating on the 1092MW hydropower development so that all resources could be directed to one target. According to Regenstein [81], spreading the target across the policy duration is another practical approach to developing attainable targets. Thus, as opposed to having selected targets, the expected outputs would be evenly spread, assuming that the original figures were based on empirical data. Nonetheless, an appropriate statistical methodology can solve many target-setting challenges, which calls for a detailed study on energy policy goal setting since this study’s focus was to establish NEP’s contribution to supporting PSR.

3.6. The Integrated Resilience Framework

The integrated research framework (IRF) in Figure 7 summarises the case studies, emphasising the necessity of a holistic resilience analysis. Each study contributes to a detailed understanding of how multidisciplinary assessments can inform a cohesive approach to resilience, ensuring that policy support, infrastructure robustness, and operator capabilities are harmonised to create a resilient power system. An integrated, multidisciplinary resilience framework is essential for thoroughly evaluating and enhancing the resilience of power systems. This framework is divided into three essential parts—A, B and C.
Part A presents the power system’s resilience evaluation using a multidisciplinary approach, which has been discussed in the methods section. The arrows in this part indicate the motion or flow of events. This framework in part A can be adapted to different critical infrastructure elements requiring comprehensive resilience evaluation. The evaluated domains may be determined by assessing the problems affecting the critical infrastructures. For example, economic, social, infrastructure, operational and/or environmental domains could be combined. This is to ensure that the challenges are resolved holistically to avoid enhancing the resilience of one domain while unintentionally diminishing other domains. For instance, having a robust infrastructure may not translate to quick function restoration under severe disruptions if the operator has no response measures in place such as prepositioning of repair resources.
In this context, the evaluation of the technical domain involved analysing the resilience of the transmission network to impacts of the 2022 TCA. The IRF provides guidelines for quantitative resilience assessment. However, as there are no standard procedures, users may choose to use other established techniques. Nonetheless, when dealing with real power systems such as is the case with this research, the availability of accurate, reliable and adequate system data is critical. The critical approach, in this thesis was using industry software, which is used by the grid operator to be as close as possible to the actual power system performance. However, using different tools would be important for research, validation and for providing the operator with alternative tools. The definition of objectives is critical. For example, whether to establish the resilience status or identify weaknesses and recommend improvement measures. Criteria for identifying quantitative resilience indicators have been discussed in the literature. The chosen indicator should align with the system’s purpose (systems’ functionality), be tied to the system’s unique features (characteristics) and be easy to understand and apply (simplicity). In addition, indicators should detect meaningful changes (sensitivity), accurately measure the intended attribute (validity), and provide ease of obtaining data (accessibility). Further, resilience indicators should directly tie to system goals and stakeholders (relevance) and be reliable under varying conditions (robustness). Furthermore, selected indicators should produce consistent results when replicated (reproducibility) and be able to cover relevant system aspects (scope). Moreover, when choosing indicators, it should be established if data are available and can be obtained (availability). Finally, indicators should be cost-effective to measure (affordability) [26]. However, choosing indicators that align with those available is key in ensuring smooth assessments. The most important aspect is establishing the weaknesses which direct resilience enhancement recommendations.
A similar approach was followed to assess the capacity of the operator to manage the grid during disruptions. The success of organisational resilience studies depends more on the willingness of the organisations under study and employees to partake in the research. Determining which parameters to assess depends on the theories under study. In this context, the theories from PSR were adapted to organisational resilience, which led to the identification of resilience capacities. Literature provides different organisational resilience analysis approaches as discussed in [24,82,83,84,85,86]. One critical aspect noted in the literature is that although some studies used resilience thresholds, there is no indication of the basis of the thresholds. Thus, some analyses can be purely qualitative.
The most important outcome for NEP evaluation was establishing its status and its contribution to supporting PSR and identifying implementation challenges that hinder resilience.
Part B of the IRF is the integrated analysis, presented in this paper. The individual studies in part A were compiled/pooled and their associated indicators were integrated and mapped to identify relationships. The individual weaknesses are also mapped to establish dependencies which help in recommending holistic improvement measures. However, the approach on indicator integration and mapping is highly subjective and depends on researcher understanding of resilience concepts, which may introduce researcher bias. Regardless, the integration in this context was supported by established literature and expert judgement. An important element of this section is the identification of non-linear dynamic relationships which may exist in the resilience domain, which provides insights to power system planners, policymakers, infrastructure managers and resilience experts of critical issues that underpin resilience. Thus, although causal loop diagrams are not presented in this work, Ahmadi and others [87] demonstrated that causal loop diagrams are important in visualising the non-linear complex relationships in dynamic systems.
Part C of the IRF is the integrated solution for Malawi’s power system, based on the integrated analysis in part B. In this context, policy support, through its effective implementation is critical in resilience enhancement as discussed in Section 3.5. The arrows in this section demonstrate the relationships. Effective policy implementation could transform the status of electricity infrastructure, ensuring that the system is diverse, redundant and has adequate capacity. These features reduce the effects of shocks which enhance infrastructure strength. This improves operator response capacity. At the same time, the operator depends on robust infrastructure to effectively manage severe disruptions. Similarly, implementing policy facilitates institutional resilience, which empowers the operator. For example, making independent decisions regarding proactive resilience measures.
Although this integrated resilience enhancement may work for Malawi, based on available findings from case studies, it may need to be modified if it has to be applied for different reasons. Firstly, other grids may be operated by two or more operators. Secondly, different locations may have different resilience challenges. Finally, most studies use standard test systems as opposed to actual power systems. Another important shortcoming of this approach, which may need to be accounted for in future studies is the cost–benefit analysis of resilience enhancement. In addition, the extent to which policy can contribute to infrastructure resilience may need to be quantified. Nevertheless, the most important aspect is the concept of integration, which provides a platform for holistic resilience solutions and can be applied in infrastructures with similar developmental challenges such as in weak and underdeveloped networks.

4. Conclusions

This paper has demonstrated an integrated PSR analysis by pooling three case studies that were conducted in Malawi to (i) explore the capacity or contribution of NEP to support PSR, (ii) evaluate the ability of the grid operator to prepare for, respond to and manage the grid during extreme events and (iii) to analyse the capacity of the transmission network to withstand tropical cyclones. This approach is promising because it provides a platform for holistic and inclusive resilience solutions. Conventional methods of resilience enhancement which consider independent resilience domains risk providing solutions to one challenge while unintentionally creating vulnerabilities in another domain. As global challenges are multidimensional and contextual, this study provides an integrated analysis of challenges affecting the resilience of Malawi’s power sector, which informs holistic resilience enhancement. Despite the respective challenges faced by the operator, infrastructure and regulatory framework individually, the structure of electricity supply and institutional challenges are at the centre of resilience challenges aggravated by non-implementation of the energy policy, which results from, among other things, political interference and financial constraints. The structure of supply determines diversity, exposure, redundancy and adequacy of supply which are essential resilience features of robust systems. Policy implementation also enables institutional capacity such as being able to make independent decisions to undertake proactive resilience measures. One possible solution is to have an effective energy policy which has ambitious yet attainable targets and is adequately funded. At the same time, enhancing operational capability through resilience management systems and operations can be beneficial. Although the integrated resilience framework provides guidelines for holistic resilience evaluations, especially in weak and underdeveloped grids, it might need to be modified if it has to be adapted to other resilience studies.

Author Contributions

Conceptualization, J.N.C.; methodology, J.N.C.; software (DigSILENT PowerFactory 2023 SP5 (x64), J.N.C.; validation, R.B. and Z.L.; formal analysis, J.N.C.; investigation J.N.C.; resources, J.N.C.; data curation, J.N.C.; writing—original draft preparation, J.N.C.; writing—review and editing, R.B. and Z.L.; visualisation, J.N.C.; supervision, R.B. and Z.L.; project administration, R.B. and Z.L.; funding acquisition, R.B. All authors have read and agreed to the published version of the manuscript.

Funding

This research received no external funding.

Data Availability Statement

The data presented in this study are available on request from the corresponding author due to ethical reasons.

Acknowledgments

The authors would like to express their gratitude to the Electricity Corporation of Malawi (ESCOM) management, the Electricity Generating Company (Malawi) Limited (EGENCO), the Ministry of Energy (MoE), the Malawi Energy Regulatory Authority (MERA), and the Department of Disaster Management Affairs (DoDMA), for granting them access to conduct the case studies used in this paper. The authors would also like to thank all the participating organisations for granting the authors an opportunity to interview representatives from these organisations. The authors thank all the interview participants for their efforts in providing this study with the necessary information. Specifically, we would like to acknowledge the organisations’ contact persons: Julia Nchilamwela, Charles Kagona and Christopher Mapata of ESCOM, Saidi Banda of MoE, Chipiliro Khamula of DoDMA, Samuel Ndala of EGENCO, Kelvin Tembo of Malawi University of Business and Applied Sciences and Mussa Melesha of MERA. The authors would also like to thank the Commonwealth Scholarship Commission and Schlumberger Faculty for the Future Fellowship for granting the author financial assistance during her PhD studies, of which this work is a part.

Conflicts of Interest

The authors declare no conflicts of interest.

Abbreviations

The following abbreviations are used in this manuscript:
PSRPower system resilience
IRFIntegrated resilience framework
TCATropical Cyclone Ana
NEPNational energy policy
MoEMinistry of Energy
AFLEPTFramework for measuring preventive, absorptive, adaptive, restorative and transformative capabilities
FLEPFramework for measuring, absorptive, adaptive, and restorative capabilities
DigSILENTDigital simulation of electrical networks
PVPhotovoltaic
ResCResilience capacity
ResDResilience dimension
N/ANot applicable
CCIRCapacity and capability of internal resources
TCFTropical Cyclone Freddy
EGENCOElectricity generating company (Malawi) Ltd.
JCMJustin Christian Martin
MWMegawatt
CESETCommunity energy and the sustainable energy transition
ENSEnergy not supplied
MWh/aMegawatt hours per annum
UKUnited Kingdom
BESBattery energy storage
DERsDistributed energy resources
MGsMicrogrids
kVKilovolt
ISOInternational organisation for standardizations
AIArtificial intelligence
NERCNorth American electric reliability corporation
USDUnited states dollar
GDPGross domestic product
SADCSouthern African development community

References

  1. Singh, B.; Roy, P.; Spiess, T.; Venkatesh, B. Achieving Electricity Grid Resiliency. Centre Urban Energy 2015. Available online: https://www.torontomu.ca/content/dam/cue/pdfs/GridResileincyFinalReport.pdf (accessed on 4 August 2021).
  2. Ghiasi, M.; Dehghani, M.; Niknam, T.; Baghaee, H.R.; Padmanaban, S.; Gharehpetian, G.B.; Aliev, H. Resiliency/Cost-Based Optimal Design of Distribution Network to Maintain Power System Stability against Physical Attacks: A Practical Study Case. IEEE Access 2021, 9, 43862–43875. [Google Scholar] [CrossRef]
  3. Li, B.; Ofori-Boateng, D.; Gel, Y.R.; Zhang, J. A hybrid approach for transmission grid resilience assessment using reliability metrics and power system local network topology. Sustain. Resilient Infrastruct. 2021, 6, 26–41. [Google Scholar] [CrossRef]
  4. Lai, K.; Wang, Y.; Shi, D.; Illindala, M.S.; Zhang, X.; Wang, Z. A Resilient Power System Operation Strategy Considering Transmission Line Attacks. IEEE Access 2018, 6, 70633–70643. [Google Scholar] [CrossRef]
  5. Gao, H.; Chen, Y.; Xu, Y.; Liu, C.C. Resilience-Oriented Critical Load Restoration Using Microgrids in Distribution Systems. IEEE Trans. Smart Grid 2016, 7, 2837–2848. [Google Scholar] [CrossRef]
  6. Erker, S.; Stangl, R.; Stoeglehner, G. Resilience in the light of energy crises—Part I: A framework to conceptualise regional energy resilience. J. Clean. Prod. 2017, 164, 420–433. [Google Scholar] [CrossRef]
  7. Das, L.; Munikoti, S.; Natarajan, B.; Srinivasan, B. Measuring smart grid resilience: Methods, challenges and opportunities. Renew. Sustain. Energy Rev. 2020, 130, 109918. [Google Scholar] [CrossRef]
  8. Kanyuka, M. 2018 Malawi Population and Housing Census. National Statistical Office (NSO) 2019. Available online: https://www.nsomalawi.mw/census/2018 (accessed on 24 June 2021).
  9. Government of Malawi. Support to SE4ALL Country Actions Processes in Malawi: Action Agenda. Conrema 2017. Available online: https://conrema.org/wp-content/uploads/2019/01/AA_Malawi_FINAL-31Jan2017_clean.pdf (accessed on 28 June 2021).
  10. Government of Malawi. Malawi’s Vision: An Inclusively Wealthy and Self-Reliant Nation. National Planning Commission (NPC) 2020. Available online: https://malawi.un.org/sites/default/files/2021-01/MW2063-%20Malawi%20Vision%202063%20Document.pdf (accessed on 24 June 2021).
  11. Mafuta, W. An Overview of the Energy Situation in Malawi. In Proceedings of the Malawi National Energy Conference, Salima District, Malawi, 26–27 October 2023. [Google Scholar]
  12. Government of Malawi. Malawi 2019 Floods Post Disaster Needs Assessment (PDNA) Report. 2019. Available online: https://www.unicef.org/malawi/media/1756/file/Malawi%202019%20Floods%20Post%20Disaster%20Needs%20Assessment%20Report.pdf (accessed on 10 July 2021).
  13. Strachan, S.; Logan, L.; Marshall, S. Embedding Interdisciplinary Research-Based Education for Sustainable Development in Higher Education through Vertically Integrated Projects. In Proceedings of the 8th International Symposium for Engineering Education, The University of Strathclyde, Glasgow, UK, 1–2 September 2022. [Google Scholar]
  14. Chivunga, J.N.; Lin, Z.; Blanchard, R. Critical infrastructure organisational resilience assessment: A case study of Malawi’s power grid operator. Electr. J. 2024, 37, 107427. [Google Scholar] [CrossRef]
  15. Chivunga, J.N.; Longatt, F.G.; Lin, Z.; Blanchard, R. Transmission line redundancy for grid resilience enhancement: The concept of Transmission Lines contributing to Energy Not Supplied (TLENS) on Malawi’s transmission grid. Energy Rep. 2024, 12, 4670–4685. [Google Scholar] [CrossRef]
  16. Kushal, T.R.B.; Illindala, M.S. A Decision Support Framework for Resilience-Oriented Cost-Effective Distributed Generation Expansion in Power Systems. In Proceedings of the 2020 IEEE/IAS 56th Industrial and Commercial Power Systems Technical Conference (I&CPS), Las Vegas, NV, USA, 29 June–28 July 2020. [Google Scholar] [CrossRef]
  17. Panteli, M.; Mancarella, P.; Wilkinson, S.; Dawson, R.; Pickering, C. Assessment of the resilience of transmission networks to extreme wind events. In Proceedings of the 2015 IEEE Eindhoven PowerTech, Eindhoven, The Netherlands, 29 June–2 July 2015. [Google Scholar] [CrossRef]
  18. Chivunga, J.N.; Lin, Z.; Blanchard, R. Energy Policy as a Tool for Promoting Power System Resilience: Malawi’s Challenges and Potential Solutions; Springer: Cham, Switzerland, 2023; pp. 187–207. [Google Scholar] [CrossRef]
  19. Panteli, M.; Trakas, D.N.; Mancarella, P.; Hatziargyriou, N.D. Power Systems Resilience Assessment: Hardening and Smart Operational Enhancement Strategies. Proc. IEEE 2017, 105, 1202–1213. [Google Scholar] [CrossRef]
  20. Clarke, J.; Coaffe, J.; Rowlands, R.; Finger, J.; Hasenstein, S.; Siebold, U. Realising European Resilience for Critical Infrastructure. Tech Report 653260. European Commission 2016. Available online: https://cordis.europa.eu/project/id/653260/reporting (accessed on 9 November 2021).
  21. Hossain, E.; Roy, S.; Mohammad, N.; Nawar, N.; Dipta, D.R. Metrics and enhancement strategies for grid resilience and reliability during natural disasters. Appl. Energy 2021, 290, 116709. [Google Scholar] [CrossRef]
  22. Sovacool, B.K. Expert views of climate change adaptation in the Maldives. Clim. Change 2012, 114, 295–300. [Google Scholar] [CrossRef]
  23. Pagano, A.; Pluchinotta, I.; Giordano, R.; Fratino, U. Integrating “Hard” and “Soft” Infrastructural Resilience Assessment for Water Distribution Systems; Wiley: Hoboken, NJ, USA, 2018. [Google Scholar] [CrossRef]
  24. Rehak, D. Assessing and strengthening organisational resilience in a critical infrastructure system: Case study of the Slovak Republic. Saf. Sci. 2019, 123, 104573. [Google Scholar] [CrossRef]
  25. Rose, A.Z. Economic Resilience to Disasters. Community and Regional Resilience Institute 2009. Available online: https://www.researchgate.net/publication/239823919_Economic_Resilience_to_Disasters (accessed on 11 March 2024).
  26. Manyena, B.; Machingura, F.; O’Keefe, P. Disaster Resilience Integrated Framework for Transformation (DRIFT): A new approach to theorising and operationalising resilience. World Dev. 2019, 123, 104587. [Google Scholar] [CrossRef]
  27. Panteli, M.; Mancarella, P.; Trakas, D.N.; Kyriakides, E.; Hatziargyriou, N.D. Metrics and Quantification of Operational and Infrastructure Resilience in Power Systems. IEEE Trans. Power Syst. 2017, 32, 4732–4742. [Google Scholar] [CrossRef]
  28. National Grid. Metered Connections Guaranteed Standards of Service. n.d. Available online: https://www.nationalgrid.co.uk/customers-and-community/standards-of-performance (accessed on 28 March 2024).
  29. Republic of Zambia. National Energy Policy. 2019. Available online: https://www.moe.gov.zm/wp-content/uploads/2024/10/Zambia_The-National-Energy-Policy-2019.pdf (accessed on 5 January 2022).
  30. UK Defence & Security Exports. Securing Critical National Infrastructure: An Introduction to UK Capability. Department for Business and Trade 2023. Available online: https://assets.publishing.service.gov.uk/media/650d96112f404b000dc3d7c7/securing_critical_national_infrastructure_an_introduction_to_uk_capability.pdf (accessed on 17 July 2024).
  31. Handayani, K.; Filatova, T.; Krozer, Y.; Anugrah, P. Seeking for a climate change mitigation and adaptation nexus: Analysis of a long-term power system expansion. Appl. Energy 2020, 262, 114485. [Google Scholar] [CrossRef]
  32. Burillo, D.; Chester, M.V.; Pincetl, S.; Fournier, E.D.; Reyna, J. Forecasting peak electricity demand for Los Angeles considering higher air temperatures due to climate change. Appl. Energy 2019, 236, 1–9. [Google Scholar] [CrossRef]
  33. Kobayashi, Y. Enhancing Energy Resilience: Challenging Tasks for Japan’s Energy Policy. Centre for Strategic and International Studies 2014; pp. 1–19. Available online: https://csis-website-prod.s3.amazonaws.com/s3fs-public/140422_Kobayashi_EnhancingEnergyResilience_8.pdf (accessed on 8 June 2023).
  34. Fang, Y.; Wei, Y. Climate change adaptation on the Qinghai-Tibetan Plateau: The importance of solar energy utilization for rural household. Renew. Sustain. Energy Rev. 2013, 18, 508–518. [Google Scholar] [CrossRef]
  35. Rahi, K. Indicators to assess organizational resilience—A review of empirical literature. Int. J. Disaster Resil. Built Env. Environ. 2019, 10, 85–98. [Google Scholar] [CrossRef]
  36. Millard, D. The Role and Importance of Energy Statistics. International Energy Agency (IEA) 2015. Available online: https://unstats.un.org/unsd/energy/meetings/2016iwc/02importance.pdf (accessed on 22 January 2023).
  37. Arab, A.; Khodaei, A.; Eskandarpour, R.; Thompson, M.P.; Wei, Y. Three Lines of Defense for Wildfire Risk Management in Electric Power Grids: A Review. IEEE Access 2021, 9, 61577–61593. [Google Scholar] [CrossRef]
  38. Panteli, M.; Mancarella, P. The grid: Stronger, bigger, smarter? Presenting a conceptual framework of power system resilience. IEEE Power Energy Mag. 2015, 13, 58–66. [Google Scholar] [CrossRef]
  39. Homer, J.; Boenker, K.; Lippert, A.; Oikonomou, K.; Tapio, R.; Corsair, H. Considerations for Resilience Guidelines for Clean Energy Plans 2022. Available online: https://gmlc.doe.gov/ (accessed on 28 July 2022).
  40. Government of Malawi. Malawi 2015 Floods Post Disaster Needs Assessment (PDNA) Report 2015. Available online: https://www.gfdrr.org/sites/default/files/publication/pda-2015-malawi.pdf (accessed on 4 October 2021).
  41. Group, W.B.; Nations, U.; Union, E. Malawi Drought 2015-2016: Post Disaster Needs Assessment (PDNA); World Bank: Washington, DC, USA, 2016. [Google Scholar] [CrossRef]
  42. World Weather Attribution. Climate Change Increased Rainfall Associated with Tropical Cyclones Hitting Highly Vulnerable Communities in Madagascar, Mozambique & Malawi. World Weather Attribution 2022. Available online: https://www.worldweatherattribution.org/climate-change-increased-rainfall-associated-with-tropical-cyclones-hitting-highly-vulnerable-communities-in-madagascar-mozambique-malawi/ (accessed on 23 April 2025).
  43. JBA Event Response. Tropical Cyclone Freddy: February-March 2023. Available online: https://www.jbarisk.com/knowledge-hub/event-response/tropical-cyclone-freddy-february-march-2023/ (accessed on 23 April 2025).
  44. Msyani, E. Executive Exchange on Developing an Ancillary Service Market; Washington, DC, USA, 2013. Available online: https://usea.org/sites/default/files/event-/Malawi%20Power%20Sector.pdf (accessed on 28 July 2021).
  45. Chitawo, M.L. Diversifying Power Generation. In Proceedings of the Malawi National Energy Conference, Salima, Malawi, 26–27 October 2023. [Google Scholar]
  46. Maravi Express. Over K18bln Needed to Restore 32% of Power Lost from Kapichira Due to Cyclone Ana. 2022. Available online: https://www.maraviexpress.com/over-k18bln-needed-to-restore-32-of-power-lost-from-kapichira-due-to-cyclone-ana/ (accessed on 8 February 2022).
  47. Nation Online. A Dark, Disastrous Night After Storm Ana. Nation Online 2022. Available online: https://www.mwnation.com/a-dark-disastrous-night-after-storm-ana/ (accessed on 8 February 2022).
  48. Electricity Generation Company (Malawi) Limited—EGENCO. Generating Power for Generations. EGENCO n.d. Available online: https://www.egenco.mw/# (accessed on 9 January 2022).
  49. Hara, C. An Overview of Community Energy Systems in Malawi. CESET Project 2021. Available online: https://cesetproject.com/sites/default/files/An%20Overview%20of%20CES%20in%20Malawi_Nov21.pdf (accessed on 17 January 2024).
  50. Kambanda, C.; Mshana, R.L. Country Priority Plan and Diagnostic of the Electricity Sector: Mozambique. AfDB 2021. Available online: https://www.afdb.org/sites/default/files/2021/11/22/mozambique.pdf (accessed on 16 March 2025).
  51. World Bank. Improving Sustainability of the Power Sector and Accelerating Electricity Access: A Proposed WBG Roadmap 2024. Available online: https://documents1.worldbank.org/curated/en/099061424235032922/pdf/P17965415d283b02819dcb198dabea9914a.pdf (accessed on 16 March 2025).
  52. Chitandula, A.; Abuzayed, A.; Nyoni, K.J.; Vilalta, A.S.; Maliye, R.L.; Kabala, E.; Cheelo, C. Status Quo of the Energy System and Consumption in Zambia 2024. Camb. Open Engag. 2024, 1–35. [Google Scholar] [CrossRef]
  53. Malawi Energy Regulatory Authority. The Malawi Grid Code; Malawi Energy Regulatory Authority: Lilongwe, Malawi, 2022.
  54. Chivunga, J.N.; Lin, Z.; Blanchard, R. Power Systems’ Resilience: A Comprehensive Literature Review. Energies 2023, 16, 7256. [Google Scholar] [CrossRef]
  55. Sinsel, S.R.; Yan, X.; Stephan, A. Building resilient renewable power generation portfolios: The impact of diversification on investors’ risk and return. Appl. Energy 2019, 254, 113348. [Google Scholar] [CrossRef]
  56. National Grid. The Guaranteed Standards of Performance Customer Payment Scheme. 2023. Available online: https://www.nationalgrid.co.uk/downloads-view-reciteme/660296. (accessed on 28 March 2024).
  57. Anuta, O.H.; Taylor, P.; Jones, D.; McEntee, T.; Wade, N. An international review of the implications of regulatory and electricity market structures on the emergence of grid scale electricity storage. Renew. Sustain. Energy Rev. 2014, 38, 489–508. [Google Scholar] [CrossRef]
  58. Cantelmi, R.; Di Gravio, G.; Patriarca, R. Reviewing qualitative research approaches in the context of critical infrastructure resilience. Env. Environ. Syst. Decis. 2021, 41, 341–376. [Google Scholar] [CrossRef]
  59. Mc Entire, D.A. Disaster Response and Recovery: Strategies and Tactics for Resilience, 2nd ed.; Jon Willey & Sons: Hoboken, NJ, USA, 2021. [Google Scholar]
  60. Brynard, P.A. Policy implementation. Association of Southern African Schools and Departments of Public Administration and Management (ASSADPAM) 2009. Available online: https://journals.co.za/doi/epdf/10.10520/ejc-adminpub-v17-n4-a2 (accessed on 22 January 2023).
  61. The Ministry of Energy. The Status of the 2018 Malawi National Energy Policy. The Ministry of Energy: Lilongwe, Malawi, 2021. [Google Scholar]
  62. Makinde, T. Problems of Policy Implementation in Developing Nations: The Nigerian Experience. J. Soc. Social. Sci. 2017, 11, 63–69. [Google Scholar] [CrossRef]
  63. Guerra, O.J.; Tejada, D.A.; Reklaitis, G.V. Climate change impacts and adaptation strategies for a hydro-dominated power system via stochastic optimization. Appl. Energy 2019, 233–234, 584–598. [Google Scholar] [CrossRef]
  64. Nüchter, V.; Abson, D.J.; von Wehrden, H.; Engler, J.O. The Concept of Resilience in Recent Sustainability Research. Sustainability 2021, 13, 2735. [Google Scholar] [CrossRef]
  65. Delgado-Ramos, G.C.; Guibrunet, L. Assessing the ecological dimension of urban resilience and sustainability. Int. J. Urban. Sustain. Dev. 2017, 9, 151–169. [Google Scholar] [CrossRef]
  66. Biswas, S.; Singh, M.K.; Centeno, V.A. Chance-Constrained Optimal Distribution Network Partitioning to Enhance Power Grid Resilience. IEEE Access 2021, 9, 42169–42181. [Google Scholar] [CrossRef]
  67. Poudel, S.; Dubey, A. Critical Load Restoration Using Distributed Energy Resources for Resilient Power Distribution System. IEEE Trans. Power Syst. 2019, 34, 52–63. [Google Scholar] [CrossRef]
  68. Espinoza, S.; Panteli, M.; Mancarella, P.; Rudnick, H. Multi-phase assessment and adaptation of power systems resilience to natural hazards. Electr. Power Syst. Res. 2016, 136, 352–361. [Google Scholar] [CrossRef]
  69. Chen, C.; Wang, J.; Ton, D. Modernizing Distribution System Restoration to Achieve Grid Resiliency Against Extreme Weather Events: An Integrated Solution. Proc. IEEE 2017, 105, 1267–1288. [Google Scholar] [CrossRef]
  70. Taheri, B.; Safdarian, A.; Moeini-Aghtaie, M.; Lehtonen, M. Enhancing resilience level of power distribution systems using proactive operational actions. IEEE Access 2019, 7, 137378–137389. [Google Scholar] [CrossRef]
  71. Kamruzzaman, M.; Duan, J.; Shi, D.; Benidris, M. A Deep Reinforcement Learning-based Multi-Agent Framework to Enhance Power System Resilience using Shunt Resources. IEEE Trans. Power Syst. 2021, 36, 5525–5536. [Google Scholar] [CrossRef]
  72. Shen, L.; Tang, L.C. Enhancing resilience analysis of power systems using robust estimation. Reliab. Eng. Syst. Saf. 2019, 186, 134–142. [Google Scholar] [CrossRef]
  73. ISO 22316:2017; Security and Resilience: Organizational Resilience—Principles and Attributes. International Organisation for Standardization: Geneva, Switzerland, 2017.
  74. Sun, K.; Xiao, H.; Pan, J.; Liu, Y. VSC-HVDC Interties for Urban Power Grid Enhancement. IEEE Trans. Power Syst. 2021, 36, 4745–4753. [Google Scholar] [CrossRef]
  75. The Maravi Post. World Bank Pumps US$60m Towards Malawi’s Emergency Power Restoration. n.d. Available online: https://www.maravipost.com/world-bank-pumps-us60m-towards-malawis-emergency-power-restoration/ (accessed on 22 August 2023).
  76. Budget Statements, n.d. Available online: https://www.finance.gov.mw/index.php/our-documents/budget-statements (accessed on 17 March 2025).
  77. World Bank. National Energy Compact for Malawi. 2025. Available online: https://thedocs.worldbank.org/en/doc/fdcbd16b310a246ebb0fdbbfd50ca3a8-0010012025/original/M300-AES-Compact-Malawi.pdf. (accessed on 27 March 2025).
  78. World Bank. Malawi: World Bank Approves Grant Financing for Landmark 358.5 Megawatt Mpatamanga Hydropower Storage Project. World Bank Group 2025. Available online: https://www.worldbank.org/en/news/press-release/2025/05/15/malawi-afe-world-bank-approves-grant-financing-for-landmark-358-5-megawatt-mpatamanga-hydropower-storage-project (accessed on 17 May 2025).
  79. Van Herten, L.M.; Gunning-Schepers, L.J. Targets as a tool in health policy: Part I: Lessons learned. Health Policy 2000, 53, 1–11. [Google Scholar] [CrossRef]
  80. Kantorová, V.; New, J.R.; Biddlecom, A.; Alkema, L. Setting Ambitious yet Achievable Targets Using Probabilistic Projections: Meeting Demand for Family Planning. Stud. Fam. Plan. 2017, 48, 223–233. [Google Scholar] [CrossRef]
  81. Regenstein, E.; Boer, B.; Zavitkovsky, P. Establishing Achievable Goals: Recommendations for Improved Goal-Setting Under the Every Student Succeeds Act; Advance Illinois: Chicago, IL, USA, 2018. [Google Scholar]
  82. Stephenson, A.; Vargo, J.; Seville, E. Measuring and comparing organisational resilience in Auckland. Aust. J. Emerg. Manag. 2010, 25, 27–32. [Google Scholar]
  83. Le Masurier, J.; Wilkinson, S. Organisational Resilience: Researching the Reality of New Zealand Organisations. J. Bus. Contin. Emerg. Plan. 2008, 2, 258–266. [Google Scholar] [CrossRef]
  84. Miller, H.E.; Engemann, K.J. Threats to the electric grid and the impact on organisational resilience. Eur. J. Ind. Eng. 2015, 6, 1–16. [Google Scholar] [CrossRef]
  85. Hatton, T.; Brown, C.; Kipp, R.; Seville, E.; Brouggy, P.; Loveday, M. Developing a model and instrument to measure the resilience of critical infrastructure sector organisations. Int. J. Crit. Infrastruct. 2018, 14, 59–79. [Google Scholar] [CrossRef]
  86. Mcmanus, S.; Seville, E.; Brunsdon, D.; Vargo, J. Resilience Management: A Framework for Assessing and Improving the Resilience of Organisations; New Zealand. 2007. Available online: https://resorgs.org.nz/wp-content/uploads/2017/07/resilience-management-research-report-resorgs-07-01.pdf (accessed on 10 March 2022).
  87. Ahmadi, F.; Martinez, P.; Gledson, B.; Razavialavi, S. Exploring Causal Loops in Resilient Maintenance Operations of Built Assets: A Literature Review. In Proceedings of the European Conference on Computing in Construction, Crete, Greece, 14–17 July 2024; Volume 2024, pp. 152–158. [Google Scholar] [CrossRef]
Figure 1. Methodology for integrated resilience analysis of operator response, policy support and infrastructure preparedness.
Energies 18 02755 g001
Figure 2. Demonstration of indicator mapping.
Energies 18 02755 g002
Figure 3. Mapping the interconnectedness between different resilience indicators and dimensions.
Energies 18 02755 g003
Figure 4. Mapping resilience vulnerabilities.
Energies 18 02755 g004
Figure 5. Mapping resilience enhancement measures.
Energies 18 02755 g005
Figure 6. Dependence of the operator response and infrastructure on the effective implementation of the energy policy.
Energies 18 02755 g006
Figure 7. Integrated resilience framework (IRF).
Energies 18 02755 g007
Table 1. Grouping indicators into simple codes for simplicity.
Resilience DomainIndicatorGrouping
InfrastructurePercentage of installed capacity generatedStatus of installed capacity
Available generation location and capacity
Transmission network redundancy and connectionNetwork topology
Amount of hydro-electric generation capacity lost/hRate of degradation
Amount of active power consumption lost/h
Number of transmission lines brought down/h
Number of hydro-electric generators out of service/h
Amount of hydroelectric generation capacity lostAmount of capacity lost.
Amount of active power consumption lost
Number of transmission lines brought down
Number of hydro-electric generators out of service
Transmission lines’ contribution to energy not suppliedContribution of lines to energy not supplied
Duration of post-disturbance degraded state.Duration in a degraded state
Amount of hydro-electric generation capacity restored/hRecovery rate
Amount of active power consumption restored/h
Number of transmission lines that were brought down restored/h
Number of hydro-electric generators out of service, which restored/h
Recovery rate of hydro-electric generation capacity: degradation rate of hydro-electric generation capacity
Recovery rate of active power consumption: degradation rate of active power consumption
Recovery rate transmission lines brought down: degradation rate of transmission lines.
Recovery rate of hydro-electric generators: degradation rate of hydro-electric generators
Increase in the amount of hydroelectric generation capacity after restoration.Increase in installed capacity
Increase in the number of transmission lines after restoration.
Increase in the amount of active power consumption after restoration.Increase in demand
PolicyEnergy access targetsTechnical implementation
Off-grid targets
Coal-fired power plant development
Solar PV development
Hydropower development
Developed legal frameworksLegal implementation
Adopted legal frameworks
Legal documents reviewed
Energy law enforcement
Developed capacity-building frameworksCapacity building implementation
Awareness campaigns conducted
Increase in number of trainings
Table 2. Integration of resilience indicators across different resilience dimensions.
Resilience Capacities (ResC)Resilience Dimensions (ResD)
R e s D 1 R e s D 2 R e s D n
R e s C 1 R e s D 1 R e s C 1 , i R e s D 2 R e s C 1 , i R e s D n R e s C 1 , i
R e s C 2 R e s D 1 R e s C 2 , i R e s D 2 R e s C 2 , i R e s D n R e s C 2 , i
R e s C n R e s D 1 R e s C n , i R e s D 2 R e s C n , i R e s D n R e s C n , i
Table 3. Integration of resilience indicators across different resilience dimensions. N/A stands for indicators that do not apply to a particular dimension and resilience capacity.
Resilience CapacityResilience Indicators
Grid Operator InfrastructurePolicy
Preventive and mitigative Shock preparedness and mitigationPercentage of installed capacity generatedStructure of electricity supply
Available generation location and capacity
Transmission network redundancy, connection
Physical protection of infrastructure N/AIncrease in number of trainings
Access to finance N/A
Planning strategiesDeveloped legal frameworks
Adopted legal frameworks
Legal documents reviews
Energy law enforcement
Anticipative Extent of understanding of risk knowledge N/ADeveloped capacity-building frameworks
Awareness campaigns conducted
Coverage of early warning systems
Disaster preparedness and response plans Awareness campaigns conducted
Access to risk and early warning information Awareness campaigns conducted
Increase in number of trainings
Risk transfer mechanism N/A
Access to finance
Absorptive Capacity and capability of internal resources (CCIR) Amount of hydro-electric generation capacity lost/hrStructure of electricity supply
Hydropower development
Solar PV development
Coal-fired power plant development
Off-grid targets (e.g., mini-grids)
Asset ownership Transmission lines’ contribution to energy not supplied
Amount of active power consumption lost/hr
Number of transmission lines brought down/hrStructure of electricity supply
Number of hydro-electric generators out of service/hr
Amount of hydroelectric generation capacity lost. Hydropower development
Solar PV development
Coal-fired power plant development
Off-grid targets (e.g., mini-grids)
Amount of active power consumption lost
Number of transmission lines brought down
Number of hydro-electric generators out of service
Humanitarian assistance N/AN/A
Access to finance
Adaptive Diversification Duration of post-disturbance degraded stateStructure of electricity supply
Hydropower development
Solar PV development
Coal-fired power plant development
Off-grid targets (e.g., mini-grids)
Asset ownership (equipment to adjust production decisions)N/A
Exposure to informationDeveloped capacity-building frameworks
Awareness campaigns conducted
Increase in number of trainings
Any form of adjustment before or after a disaster Legal documents reviews
Energy law enforcement
Leadership, management, and governance structures
Availability of financial servicesN/AN/A
Access to finance
RestorativeN/AAmount of hydro-electric generation capacity restored/hrStructure of electricity supply
Hydropower development
Solar PV development
Coal-fired power plant development
Off-grid targets (e.g., mini-grids)
Amount of active power consumption restored/hr
number of transmission lines that were brought down restored/hrStructure of electricity supply
Number of hydro-electric generators out of service, which restored/hr
Recovery rate of hydro-electric generation capacity: degradation rate of hydro-electric generation capacityHydropower development
Solar PV development
Coal-fired power plant development
Off-grid targets (e.g., mini-grids)
Recovery rate of active power consumption: degradation rate of active power consumption
Recovery rate transmission lines brought down: degradation rate of transmission lines.
Recovery rate of hydro-electric generators: degradation rate of hydro-electric generators
Transformative Availability of infrastructure Increase in the amount of hydroelectric generation capacity after restoration.Hydropower development
Solar PV development
Coal-fired power plant development
Off-grid targets (e.g., mini-grids)
Increase in the amount of active power consumption after restoration.Energy access targets
Increase in the number of transmission lines after restoration.
Structural rigidities that make alteration of social systems difficult N/ADeveloped legal frameworks
Adopted legal frameworks
Legal documents reviews
Energy law enforcement
Policies, regulations, frameworks, programmes and projects Developed capacity-building frameworks
Developed legal frameworks
Legal documents reviews
Access to natural resources Hydropower development
Access to finance N/A
Disclaimer/Publisher’s Note: The statements, opinions and data contained in all publications are solely those of the individual author(s) and contributor(s) and not of MDPI and/or the editor(s). MDPI and/or the editor(s) disclaim responsibility for any injury to people or property resulting from any ideas, methods, instructions or products referred to in the content.

