Article

Increasing the Voltage—Sequencing Decarbonisation with Green Power and Efficiency †

1
EEP—Institute for Energy Efficiency in Production, University of Stuttgart, 70569 Stuttgart, Germany
2
REZ—Reutlingen Energy Center for Distributed Energy Systems and Energy Efficiency, Reutlingen University, 72762 Reutlingen, Germany
3
Fraunhofer Institute for Industrial Engineering IAO, 70569 Stuttgart, Germany
*
Author to whom correspondence should be addressed.
This article is an extended, adapted and revised version of its preprint published in the Dissertation “How can climate neutrality be achieved for industry? A multi-perspective analyses”; pp. 48–64.
Energies 2025, 18(11), 2752; https://doi.org/10.3390/en18112752
Submission received: 26 February 2023 / Revised: 21 April 2025 / Accepted: 9 May 2025 / Published: 26 May 2025
(This article belongs to the Special Issue Advances in Low Carbon Technologies and Transition Ⅱ)

Abstract

:
The industrial sector’s increasing electricity demand (direct and indirect), driven by the electrification of processes and the production of green hydrogen, poses significant challenges for achieving decarbonisation goals. While switching to renewable electricity and offsetting emissions appears straightforward, the gap between current generation capacities and projected demand remains substantial. This article analyses survey data from the Energy Efficiency Index of German Industry (EEI), revealing that manufacturing companies aim to reduce 22.1% of their 2019 emissions by 2025 and 27.3% by 2030, primarily through on-site measures. However, given the slow pace of renewable capacity expansion and the increasing electrification across sectors, it becomes evident that the envisaged green electricity share of 80% by 2030 will require far more capacity than currently planned. To address this challenge, the article introduces a decarbonisability factor to better assess on-site versus off-site measures, highlighting the need for a strategic sequencing of efficiency and renewable generation. To support decision-makers, the article calls for improved data collection and periodic reassessment to account for changing geopolitical and economic conditions.

Graphical Abstract

1. Introduction

1.1. Background

Over the past few years, an increasing number of countries and non-state actors, such as local authorities, cities, financial institutions and companies have declared their intention to eliminate their carbon (CO2) or even greenhouse gas (GHG) footprint to an extent at which they reach “net zero”, a state where remaining, respectively, unavoidable emissions are balanced out with means of compensation or removal [1,2,3,4]. Back in 2015, numerous initiatives were formed on all levels to coincide with the Paris Climate Agreement [5]. More than 2000 companies, for instance, joined the Science-Based Target Initiative (SBTi) to strive for the 1.5 °C goal [2]. Simultaneously, the European Commission launched the Horizon 2020 funding programme. Among other projects, the programme enabled the creation of the NetZeroCities (NZC) initiative to assist cities in their transformation to climate neutrality [6] and also the Covenant of Companies for Climate and Energy (CCCE) “seeking to help European companies to transition to the net zero economy” [7].
To achieve the goal of decarbonisation (i.e., net zero GHG emissions = climate neutrality), a variety of measures can be applied. Decarbonisation strategies are quite individual in their composition, as they largely depend on the specific circumstances, decision criteria, the envisaged scope and timelines, as well as the underlying motivation. Furthermore, they also often depend on geographical aspects [8].
The types of measures at hand can be divided into three major categories: reduction measures (energy efficiency, resource and material efficiency, process emission reduction), substitution measures (self-generation or purchase of renewable energies) and compensatory measures (emission allowances, certified emission reductions (CERs), and climate protection projects, as well as carbon capture, storage, and use (CCUS) and direct air carbon capture and storage (DACCS)) [9].
Buettner and Wang [9] (pp. 5–10, 14–15) assess each category of measures with respect to their one-off and ongoing effects, both in relation to economic (investment and operational costs), energy-related (effect on energy demand, need to acquire energy from external sources), and emission-related matters (effect on emissions output). They come to the conclusion that, in the short-term, it only appears quickest, easiest, and cheapest to focus on the purchase of clean energy and compensate for all remaining emissions [9] (p. 12). Recent data from the 2021/2022 winter survey of the Energy Efficiency Index of German Industry (EEI) [10] indicate that 78% of manufacturing companies want to decarbonise their Scope 2 emissions (indirect emissions from the energy purchased). Moreover, 77% of companies want to address their Scope 1 emissions (direct emissions arising from their vehicles and activities on their premises, both energy- and process-related) and 75% also want to address their Scope 3 emissions (indirect emissions of the up and downstream supply chains) [11]. Considering that, if each part of the supply chain addressed its Scope 1 and 2 emissions, there would be hardly any Scope 3 emissions left, and given the large risk of double counting of emissions [11], this article is focussing on Scope 1 and 2 emissions only. As the EEI data point out, not only are more companies opting for a Scope 2 emission reduction, but they are also more advanced in the implementation process. However, one must also acknowledge the industry’s overall electricity and energy demand in conjunction with Germany’s green/clean energy generation capacities [12], as well as recent price hikes [13,14] and overall high costs of electricity [15]. In addition, supply uncertainties [16], along with experiences of the gas crisis [17,18,19,20,21,22,23,24] and warnings of electricity demand overshoots in the industrial centres [25], make it quite clear that simply switching to another energy tariff might be easier said than done. The associated costs and their impact on companies’ resilience need to be carefully considered.
For several years, the primary path pursued in the context of the energy transition was the integration of power sectors, meaning the gradual electrification of all energy users and their supply with green (or clean) energy [26]. Where not feasible, power-to-x (P2X) should, for instance, convert electricity into hydrogen, allowing one to substitute natural gas needs [26,27,28] instead of only storing or even curtailing surplus electricity. Nonetheless, the issue with this proposition is that with each conversion, there are conversion losses [29], making the clean substitute fuel much pricier and less efficient than the status quo—on top of an insufficient renewable electricity generation capacity.
To put this in context, in 2019, about 35% of the energy used by German industry was natural gas, 10% was coal, and 6% were oil products. Combined, this is about 1.5 times as much as the industry’s electricity consumption (34%). Nevertheless, already back then, industry accounted for 45% of Germany’s final electricity demand (as well as for 35% of natural gas, 4% of oil products and 88% of coal, peat and oil shale consumption) [12]. Another obstacle is that each source of energy has its “sweet spot”, which refers to a purpose for which it is the most effective energy carrier [29]. For example, if one compares E10 fuel to standard fuel, the amount needed to cover a distance of 100 km is usually higher due to the difference in the calorific values of the fuels (as ethanol provides a bit less energy than pure petroleum) [30]. Similarly, depending on the type of process and the temperature needed, the combustion of a fuel may achieve the desired outcome with less energy input than electrification would (or the other way around). If one uses a P2X gas or hydrogen, the energy balance may be even worse (due to the conversion losses in its creation from green electricity). This is why, at present, electricity that cannot be fed into the grid and would be lost otherwise is the “best energy source” for P2X gas or hydrogen. This example underlines that there is no easy solution to decarbonising the industry’s energy needs, particularly considering that three-quarters of the energy is used to generate process heat (and cold) [31].
The expansion of renewable energy generation has been much behind schedule and far from meeting targets (for instance, providing 80% of Germany’s electricity via renewable sources in 2030) [32,33,34]. An important reason for this situation is that it takes on average 6–8 years for a wind turbine to go online from planning to energy generation due to bureaucratic planning rules and processes as well as capacity issues. Additionally, disputes with individuals and initiatives, long-lasting court cases and similar obstacles contributed to the much-too-slow progress on expanding the capacity and number of transmission lines and interconnectors [33,35]. Apart from increasing capacity, the latter expansion would also increase the robustness, resilience, and effectiveness of the overall grid and prevent surplus generation from being wasted and surplus loads from being shed. Essentially, these efforts have the potential to also lower spot market prices as demands could be served more easily and with fewer barriers. Even though the “Pact for Planning, Approval, and Implementation Acceleration”, passed by the German government in November 2023, has led to significantly quicker processes, the actual implementation pace also needs to keep up. Cost, competitiveness, material, and skilled labour availability remain issues [15,34,36,37,38].

1.2. Problem Statement and Research Gap: Assessing the Renewable Energy Demand

Another issue concerns how the required energy, notably the electricity baseline, is determined and on what basis. If the status quo in 2019 was to serve as a baseline, increased efficiency measures would reduce the overall electricity demand and therefore automatically lead to an increase in the share of renewable energy in the mix. However, if one intends to simultaneously achieve a substantial fuel switch in the transport sector (share of electricity in 2019: 2% [12]) to, for instance, 15 million electric vehicles, the electricity needs for the transport sector would increase fivefold (from 12 to approx. 60 terawatt hours (TWh) [39]) and could already eat up much of the energy efficiency savings across all sectors. If, at the same time, heat pumps were replacing gas-, oil- and coal-based heating systems, the electricity demand would grow by another 10% (from 270 to 298 TWh) [39]. The Energiewirtschaftliches Institut at the University of Cologne (EWI) estimates that the electricity demand of industry would grow by 21% (from 218 TWh to 263 TWh). The envisaged electrolyser capacity (10 GW, intended to produce 20 TWh of hydrogen (thermal energy equivalent)) by 2030 would require approximately 29 TWh of electricity [39] (p. 5).
In late 2019, the chemical industry giant BASF estimated that the decarbonisation of operations at their German Ludwigshafen site via electrification would probably triple its annual electricity demand (6.4 TWh), which already represents 1% of Germany’s overall electricity demand [40]. The chemical industry overall would need four times as much electricity as before [41]. In 2020, BASF announced the assessment of the CO2 footprint of all its sales products [42]. Moreover, in 2022, it first participated in tenders for offshore wind farms to support its goal of switching its 2021 power needs to fully renewable electricity by 2030, allowing it to reduce its GHG footprint by 25% by 2030 [43]. Next, BASF started construction of the “first demonstration plant for large-scale electrically heated steam cracker furnaces” that would allow it to reduce the emissions of one of the most energy-intensive processes (and foundation of many basic chemicals) by about 90% [44]. Nevertheless, this emission reduction would come at the cost of additional electricity needs (as indicated). Not all of the nearly 200,000 manufacturers are advancing at this speed, but what would happen if they were? Even though BASF is a large company in one of the most energy-intensive sectors [31], there is also the steel industry, which estimates that about 12,000 wind turbines would be necessary to generate sufficient electricity to produce hydrogen for green steel [45,46]. Also, further companies in this and other sectors, i.e., ArcelorMittal (steel), Covestro (chemicals), and Opterra (cement), are taking the lead to ensure “their” green power needs en route to net zero emissions are served [47,48,49].
Assessing the required additional renewable energy capacities to switch from fossil fuels to renewables is one thing (supply side); it is another to switch the energy demand to the ‘right form’ (i.e., processes from gas to electricity, or green electricity accepting conversion losses via P2X to gas or hydrogen), and yet another to decarbonise process-related emissions. The latter two may require a completely different process technology that by itself may emit less but could need different amounts of energy. Therefore, assessing the required clean energy needs gets harder layer by layer. To better understand the scope of this challenge, it is essential to examine what is currently known about companies’ plans and expectations regarding decarbonisation and clean energy needs.
Among the recent literature, there are several company surveys that have examined planned climate protection measures and CO2 reduction efforts. For example, the EIB Investment Survey 2021–2022 analyses how companies perceive climate risks and energy costs, what investments they make, and which factors influence their decisions. The data are based on an EU-wide survey of over 13,500 companies of various sizes and sectors [50]. The IHK Survey collects data from around 1000 companies regarding their climate protection measures [51]. A study by the Boston Consulting Group surveyed 1850 companies worldwide on their climate policies [52]. Furthermore, the KfW Climate Barometer 2024 reveals that half of German companies (51%) incorporate climate protection into their corporate strategy [53]. Additionally, a study by KPMG showed that 43% of surveyed German companies plan to invest ten percent or more of their annual revenue in the “green transformation” [54]. However, the available studies primarily focus on investments in renewable energies and energy efficiency without quantifying the resulting additional electricity demand in detail [55].
Further, there are several energy demand projections and bottom-up demand models addressing the future renewable energy requirements, e.g., Fleiter et al. [56] and Neuwirth et al. [57]. However, new estimates in mid-2021 acknowledged that demand forecasts up to this point were unrealistically low and did not take decarbonisation and fuel-switching efforts into consideration. They applied different means to estimate the approximate future needs, usually on the basis of top-down technology roadmaps [58,59].
However, these roadmaps do not necessarily reflect what is actually planned by energy consumers, including where and by when. Considering that industry accounts for nearly half of Germany’s 2019 electricity consumption, short- to medium-term renewable energy demands should be estimated based on companies’ planned actions.

1.3. Contribution and Research Approach

In order to close this research gap, our study proposes a bottom-up decarbonisation capability assessment framework. We aim to contribute to the understanding of industrial emission reduction pathways by (1) integrating green energy demand data from German manufacturing companies and enabling the combination of policy scenario simulations with dynamic optimisation models and (2) providing a multi-dimensional analysis of industrial emission reduction pathways.
It is therefore essential—and a key objective of this research—to:
(i)
to understand the actual demand for renewable energies;
(ii)
to determine where (by whom) they are needed;
(iii)
to estimate the approximate timeline—
to align capacity planning with the progress of decarbonisation. This approach mitigates the risk of gaps that typically arise from top-down estimations and ensures that actual demands can be met. This novel approach combines German/EU and industrial company policies to provide a more realistic estimation of climate targets and action gaps in the industrial sector. While similar approaches have been proposed in the context of the transportation sector [60], applying such a bottom-up methodology specifically to the industrial sector addresses a significant gap in the existing literature. By bridging this gap, the paper contributes to a more nuanced understanding of renewable energy demands and their implications for both policy and practice. To address this objective and illustrate our bottom-up approach, we analyse data from about 850 manufacturing companies, collected after the beginning of the COVID-19 pandemic in 2020.
Based on this, we formulate the following research questions:
  • What amount of greenhouse gas (GHG) reductions do German manufacturing companies aim to achieve by 2025, and what measures are planned to reach these targets?
  • What is the level of ambition set by these companies for GHG reductions by 2030, and how does it compare to the political sector targets for industry?
  • Do the renewable energy requirements, derived from the companies’ decarbonisation targets, align with the policy frameworks and expansion plans at the national level?
  • What gaps exist between the renewable energy needs of manufacturing companies and the projected availability according to political planning?
To answer these questions and assess the implementation potential of company-level targets, we proceed as follows: We will explain (1) what share of their 2019 greenhouse gas (GHG) emissions companies aim to decarbonise by 2025 (cf. Section 3.2.1) and (2) the means by which they plan to achieve this (cf. Section 3.2.2). Furthermore, we will (3) showcase what additional savings ambitions are envisaged for 2030 (cf. Section 3.3) and (4) provide an estimation of the impact and associated needs if companies were to implement their 2025 ambitions as indicated in the EEI (cf. Section 3.4). The article will also (5) discuss the implications of these findings for policymakers, financiers, the energy sector, and society (cf. Section 4.1). Building on (6) the concept of the “decarbonisability factor”, we will (7) finally propose a mechanism to facilitate energy system and decarbonisation capacity planning for the industrial sector (both cf. Section 4.3), aiming to “increase the voltage—through sequencing decarbonisation with green power and energy efficiency”.

2. Methodology

Our analysis follows a sequential exploratory approach, combining qualitative and quantitative data. The qualitative part draws on public data from professional discourse on decarbonisation within the manufacturing industry, including participating observations from interactions with German manufacturing companies in the context of decarbonisation. Additionally, professional press reports and committee work provide insights into potential weaknesses and oversights related to energy efficiency, decarbonisation efforts, and companies’ resilience in the energy and climate crisis.
The quantitative part builds on the results of the Energy Efficiency Index of German Industry (EEI) to examine the goals manufacturing companies set for themselves. Publicly communicated goals and challenges of decarbonisation efforts reflect internal organisational decision-making processes influenced by strategic considerations and the stakeholder environment. The identified categories and themes were then integrated into the framework of the EEI. EEI was introduced in 2013 and focuses on views, needs, opinions, observations, and experiences of all kinds (size, sector, energy intensity) of manufacturing companies in Germany [61].
The EEI data this article draws from are comprised of 857 observations gathered in May 2020 [62], which was in the midst of the first wave of the COVID-19 pandemic in Germany, and 864 observations gathered in November 2020 [63].
Each of the EEI’s semi-annual data collections has a specific focus on selected current issues. The 1st and 2nd data collection in 2020 looked at a series of issues around the topics of decarbonisation and energy, notably regarding Germany’s climate and energy goals [33]. In total, around 20 questions were posed to participants of the EEI. The survey collected information on various aspects, such as the sector, revenue, number of employees, and energy consumption. Additionally, it included a half-dozen thematic questions, such as the intended GHG reduction goals for 2025 and 2030, as well as the proportions of measures planned to achieve these self-determined targets. The quantitative data collection was conducted using a combination of online surveys (7%) and CATI (Computer-Assisted Telephone Interviewing) telephone surveys (93%).
Table 1 provides an overview of the sample by company size as defined by the European Commission [64]. Instead of reflecting the actual size distribution of manufacturing enterprises in Germany [65], we aimed for an approximately even distribution across company sizes for the EEI samples. As explained by Buettner et al. [61] (pp. 3–4), this approach allows us to make statements applicable to all company sizes.
Assuming that a company’s stance and planned actions regarding decarbonisation activities vary based on its energy intensity, the latter was calculated for each company (where possible) and classified into five intensity categories (not, less, moderately, energy-intensive, very energy-intensive) [61] (p. 4).
The ratio between a company’s energy use and revenue is used to calculate the “energy intensity” variable. The variable “energy use” represents the total energy demand of a company (converted) in MWh, while the variable “revenue” reflects the company’s revenue from the previous fiscal year, expressed in millions of euros [61].
Table 2 displays the distribution of observations across the five energy intensity classes. The lower a company’s energy intensity class, the higher its energy productivity, and vice versa. A key measure for raising energy productivity is increasing energy efficiency [61]. As less than twenty energy intensity observations fall into the fifth class, there are not enough cases (n ≥ 20) to include this class in the analysis survey data.
Achieving an even distribution across the 27 manufacturing sectors representing 198,000 companies was desired, but difficult to achieve. To facilitate the telephone survey, ‘core industries’ were defined, with the target of recruiting at least 24 companies per core industry. ‘Core industries’ are the eleven sectors that have most economic weight in Germany (NACE code in brackets, sorted by code): leather (15), wood and cork (16), paper (17), chemical (20) rubber and plastics (22), non-metallic minerals (23), basic metals (24), fabricated metals (25), electrical equipment (27), machinery and equipment (28) and motor vehicle (29) industries. For the sectoral analyses presented in this paper, only sectors with responses from at least 20 companies to the relevant question(s) were included [61] (p. 4).
Table 3 depicts what percentage of a sector’s total population (number of companies) participated. The percentage may seem to be greater than 100% in very small sectors, such as the “crude petroleum and natural gas” sector (06). In this case, all 13 responses refer to specific sites instead of each representing an entire company.
The results of micro sectors (N < 10) are considered (‘**’) if more than 50% of the sector participated in this study, while the results of small sectors (10 ≤ N < 100) are taken into account (‘*’) if at least 15% of the sector participated [61] (p. 4).

3. Results

The wish to take decarbonisation actions has increased considerably since 2019 [61]. The reasons why stakeholders are pursuing decarbonisation efforts are plentiful: increasing emission pricing, skyrocketing energy prices following the war in Ukraine, as well as severe weather events that threaten both the resilience and the output of the energy system. Along with other shocks, such as disrupted or vulnerable supply chains, they further feed the desire to increase the resilience of a company [9,66]. Decreasing dependence on these risk factors or diversifying risks can help reduce pressure on either a systems level (i.e., energy generation and grid infrastructure, origin of fuels) or on an individual level (i.e., reducing the demand, circularity thinking, local sourcing, self-generation of energy, energy storage) [9] (pp. 12–15). Since decarbonisation roadmaps are based on an initial assessment of the status quo and shape the path to achieve a certain outcome at a certain point in time, they exhibit three major limitations: (a) they are often linear in their growth plan; (b) they may lose their predictive power if some foundational factors change—demonstrating the difficulty of forecasting on the basis of past development patterns (i.e., technology disruption or fundamental change in process technology); and (c) they are dependent on the appropriate framework conditions being in place to facilitate the transformation (i.e., planning permission, legal framework, time from decision to going operational). Nevertheless, despite the value of technology roadmaps and system scenarios, what the end users actually plan to carry out, where, and by when, as well as what they may need to “pull it off” or which potentially marginal bottleneck may hinder achieving this goal, remains a black box. Hence, this article aims to assist in turning on the light in this black box.

3.1. The Year 2025 as a Key Milestone in Industrial Decarbonisation

Based on data from the second iteration of the EEI in late 2019, Buettner et al. [61] found that already then—ahead of the COVID-19 pandemic, the war and the energy crisis—there was a strong ambition to pursue the path of decarbonisation. Nearly 60% of the participating companies (of all sizes, sectors and energy intensities) indicated to work towards net zero emissions (p. 13). Of these, about two thirds indicated that they target achieving net zero by 2025 (about a third of these in 2025 alone). This corresponds to about 40% of all participating companies. Further target year peaks were found for the semi-decades 2030, 2035, 2040, 2045, and 2050 (pp. 15–16). Simultaneously, the concern arose that this desire would most likely be cooled off by insufficient capacities in various areas needed for the implementation of companies’ plans. Alerted by this situation and the apparent relevance of the year 2025, the first iteration of the EEI in May 2020 was tasked to establish the following:
  • Whether industry indeed structures decarbonisation in 5-year plans (or in short-term plans “to get it over with”);
  • What motives companies have to decarbonise;
  • On which basis they make their decarbonisation decisions;
  • Most importantly, by how much they plan to reduce their GHG emissions by 2025;
  • By which means (with respect to 2019 as the last full business year, which today often serves as the base year, given that it was the last “normal” year before the pandemic and the war hit).
In consideration of the research questions, this article will zoom in on the GHG reduction targets for 2025 (4) and the means to achieve them (5). The motivation (2) and the decision factors (3) are addressed in detail by Buettner et al. [67] and Buettner and König [68].

3.2. Companies’ GHG Reduction Targets and Measures for 2025

As the industry is very diverse, there cannot be a one-size-serves-all approach [61]. The range of possible interventions in different areas is vast and quite likely much broader than in other parts of the economy [9]. Sometimes, commonalities can be found across company size, sometimes with respect to the level of energy intensity, or most intuitively with respect to the sector. Therefore, this section zooms in on these perspectives while also providing insights into the overall average outcome of the sample. A drop in ambition levels compared to the second data collection of EEI in 2019 was expected, primarily because of the impact of the COVID-19 pandemic, but also because of the difference between asking companies for a net zero target year and asking for a specific GHG reduction level (distinguishing between marketing goal and estimate by when what can be achieved).

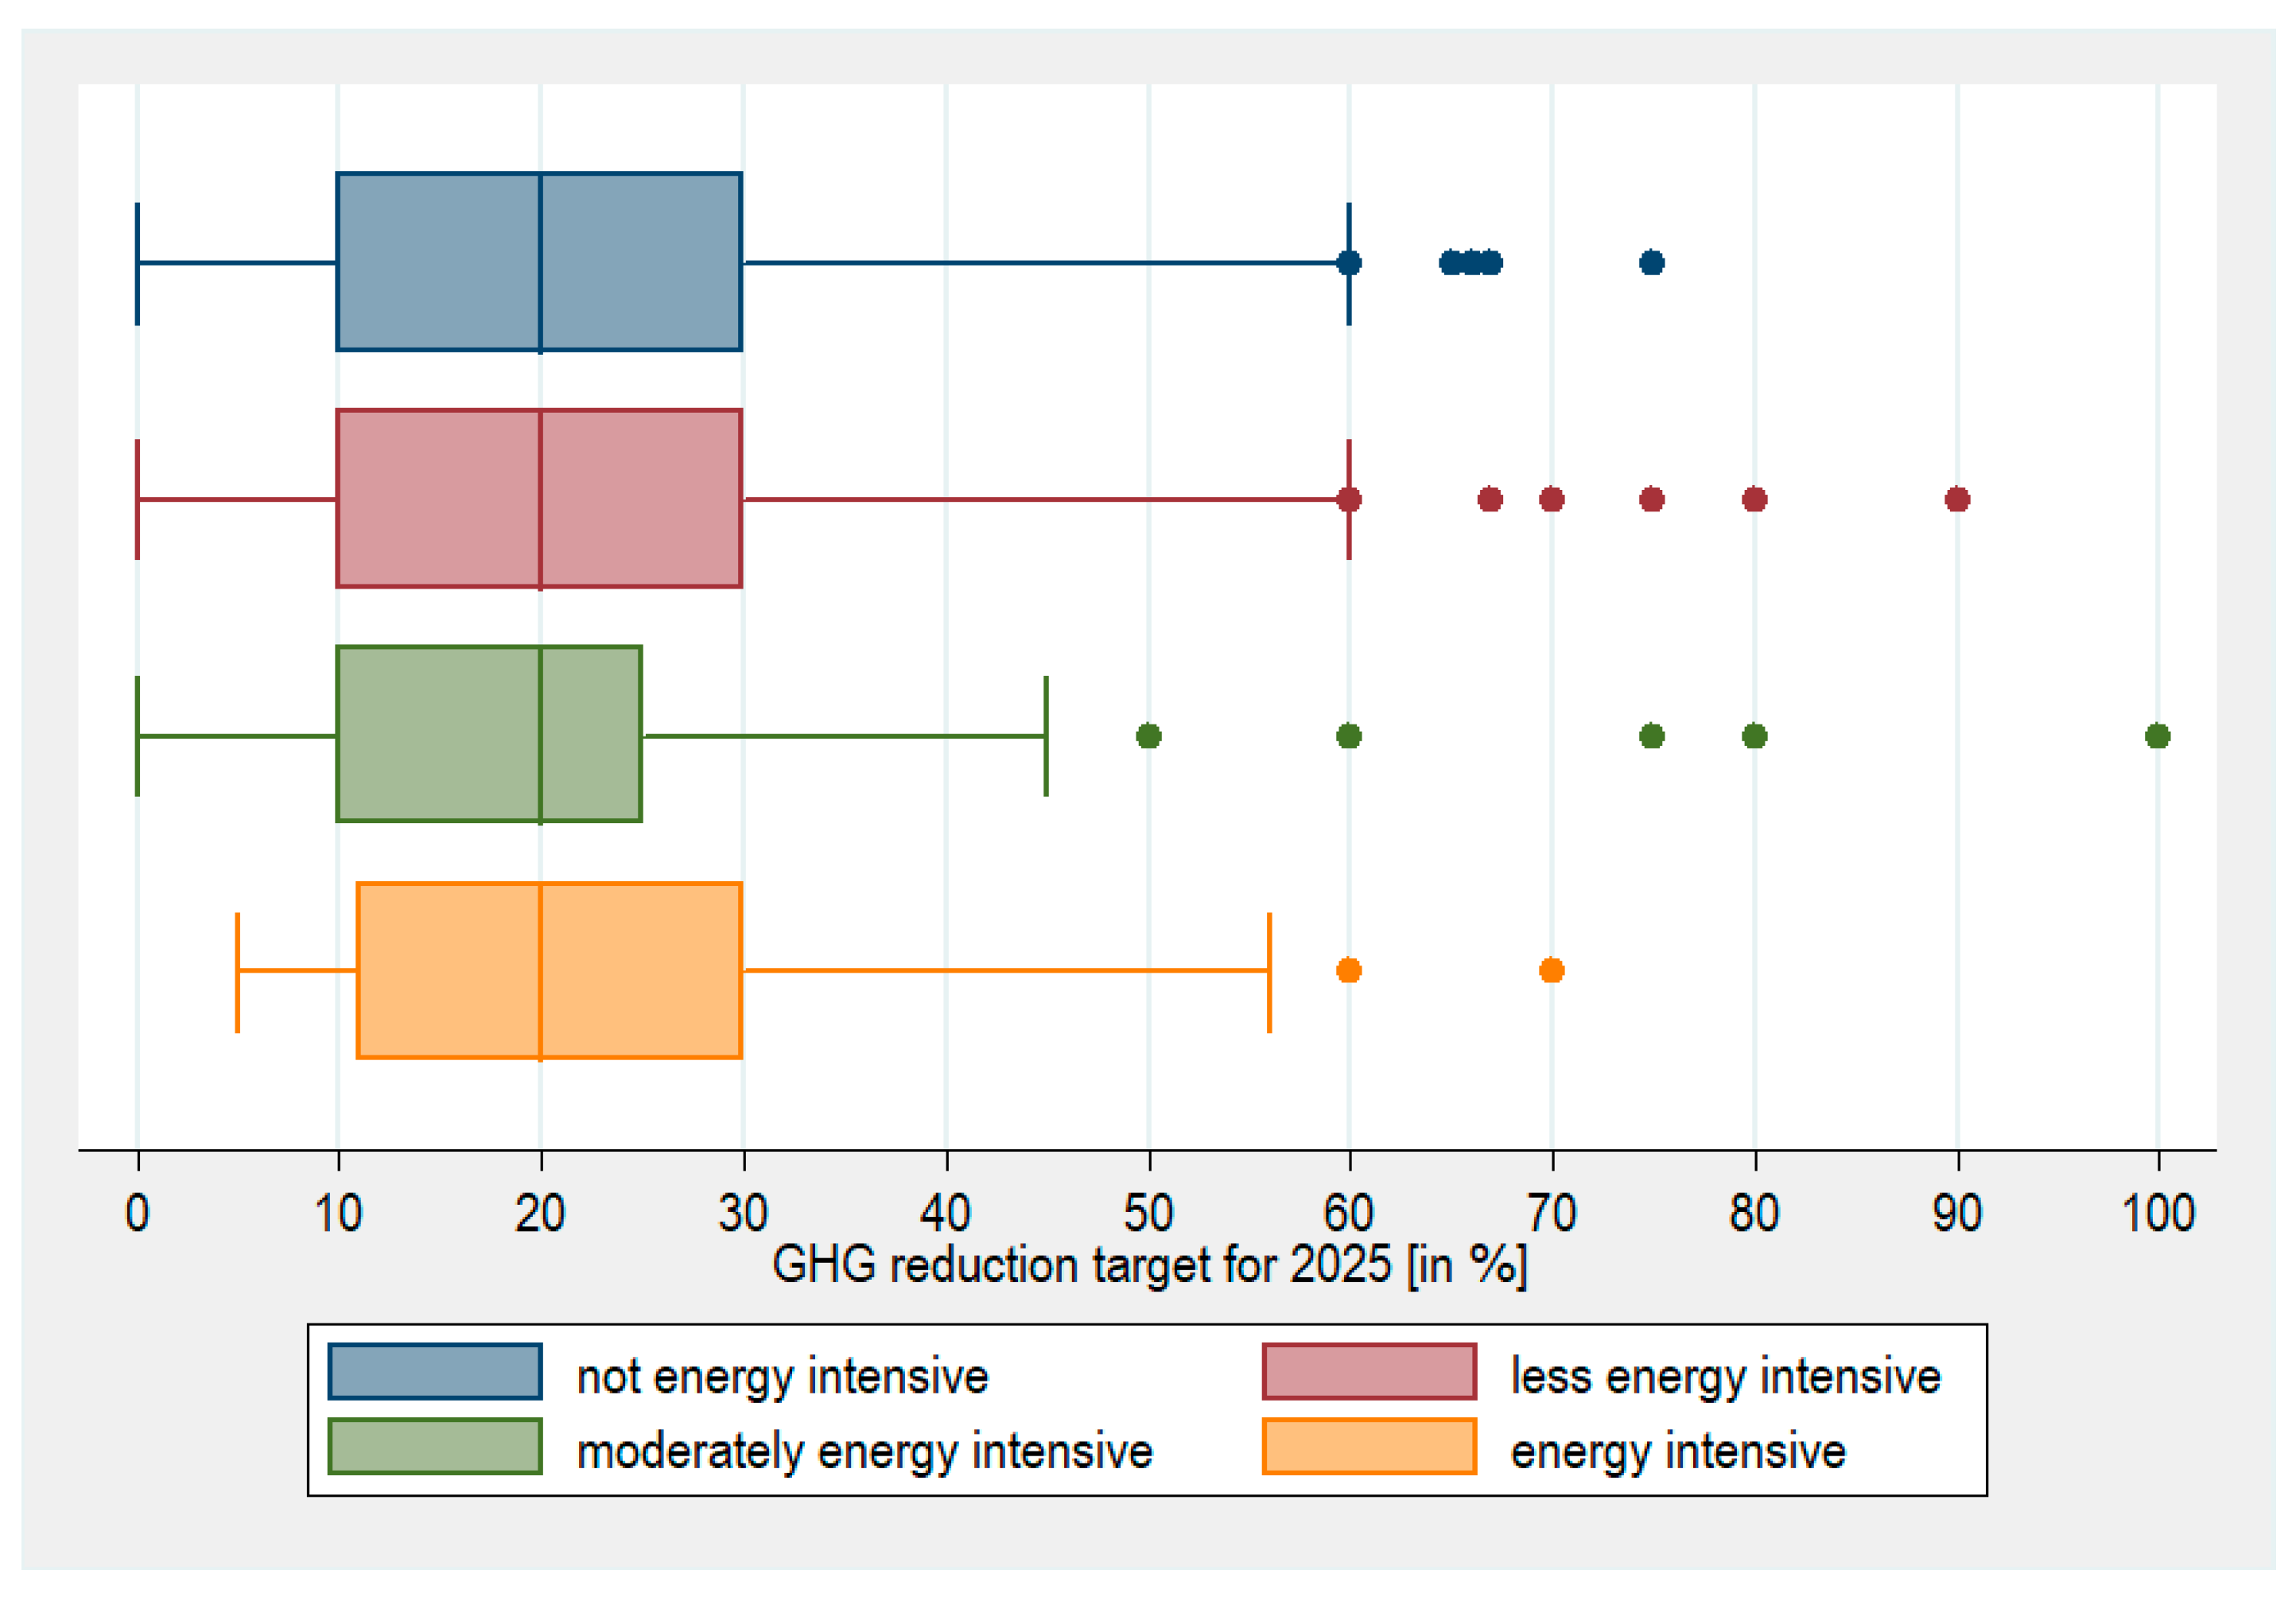
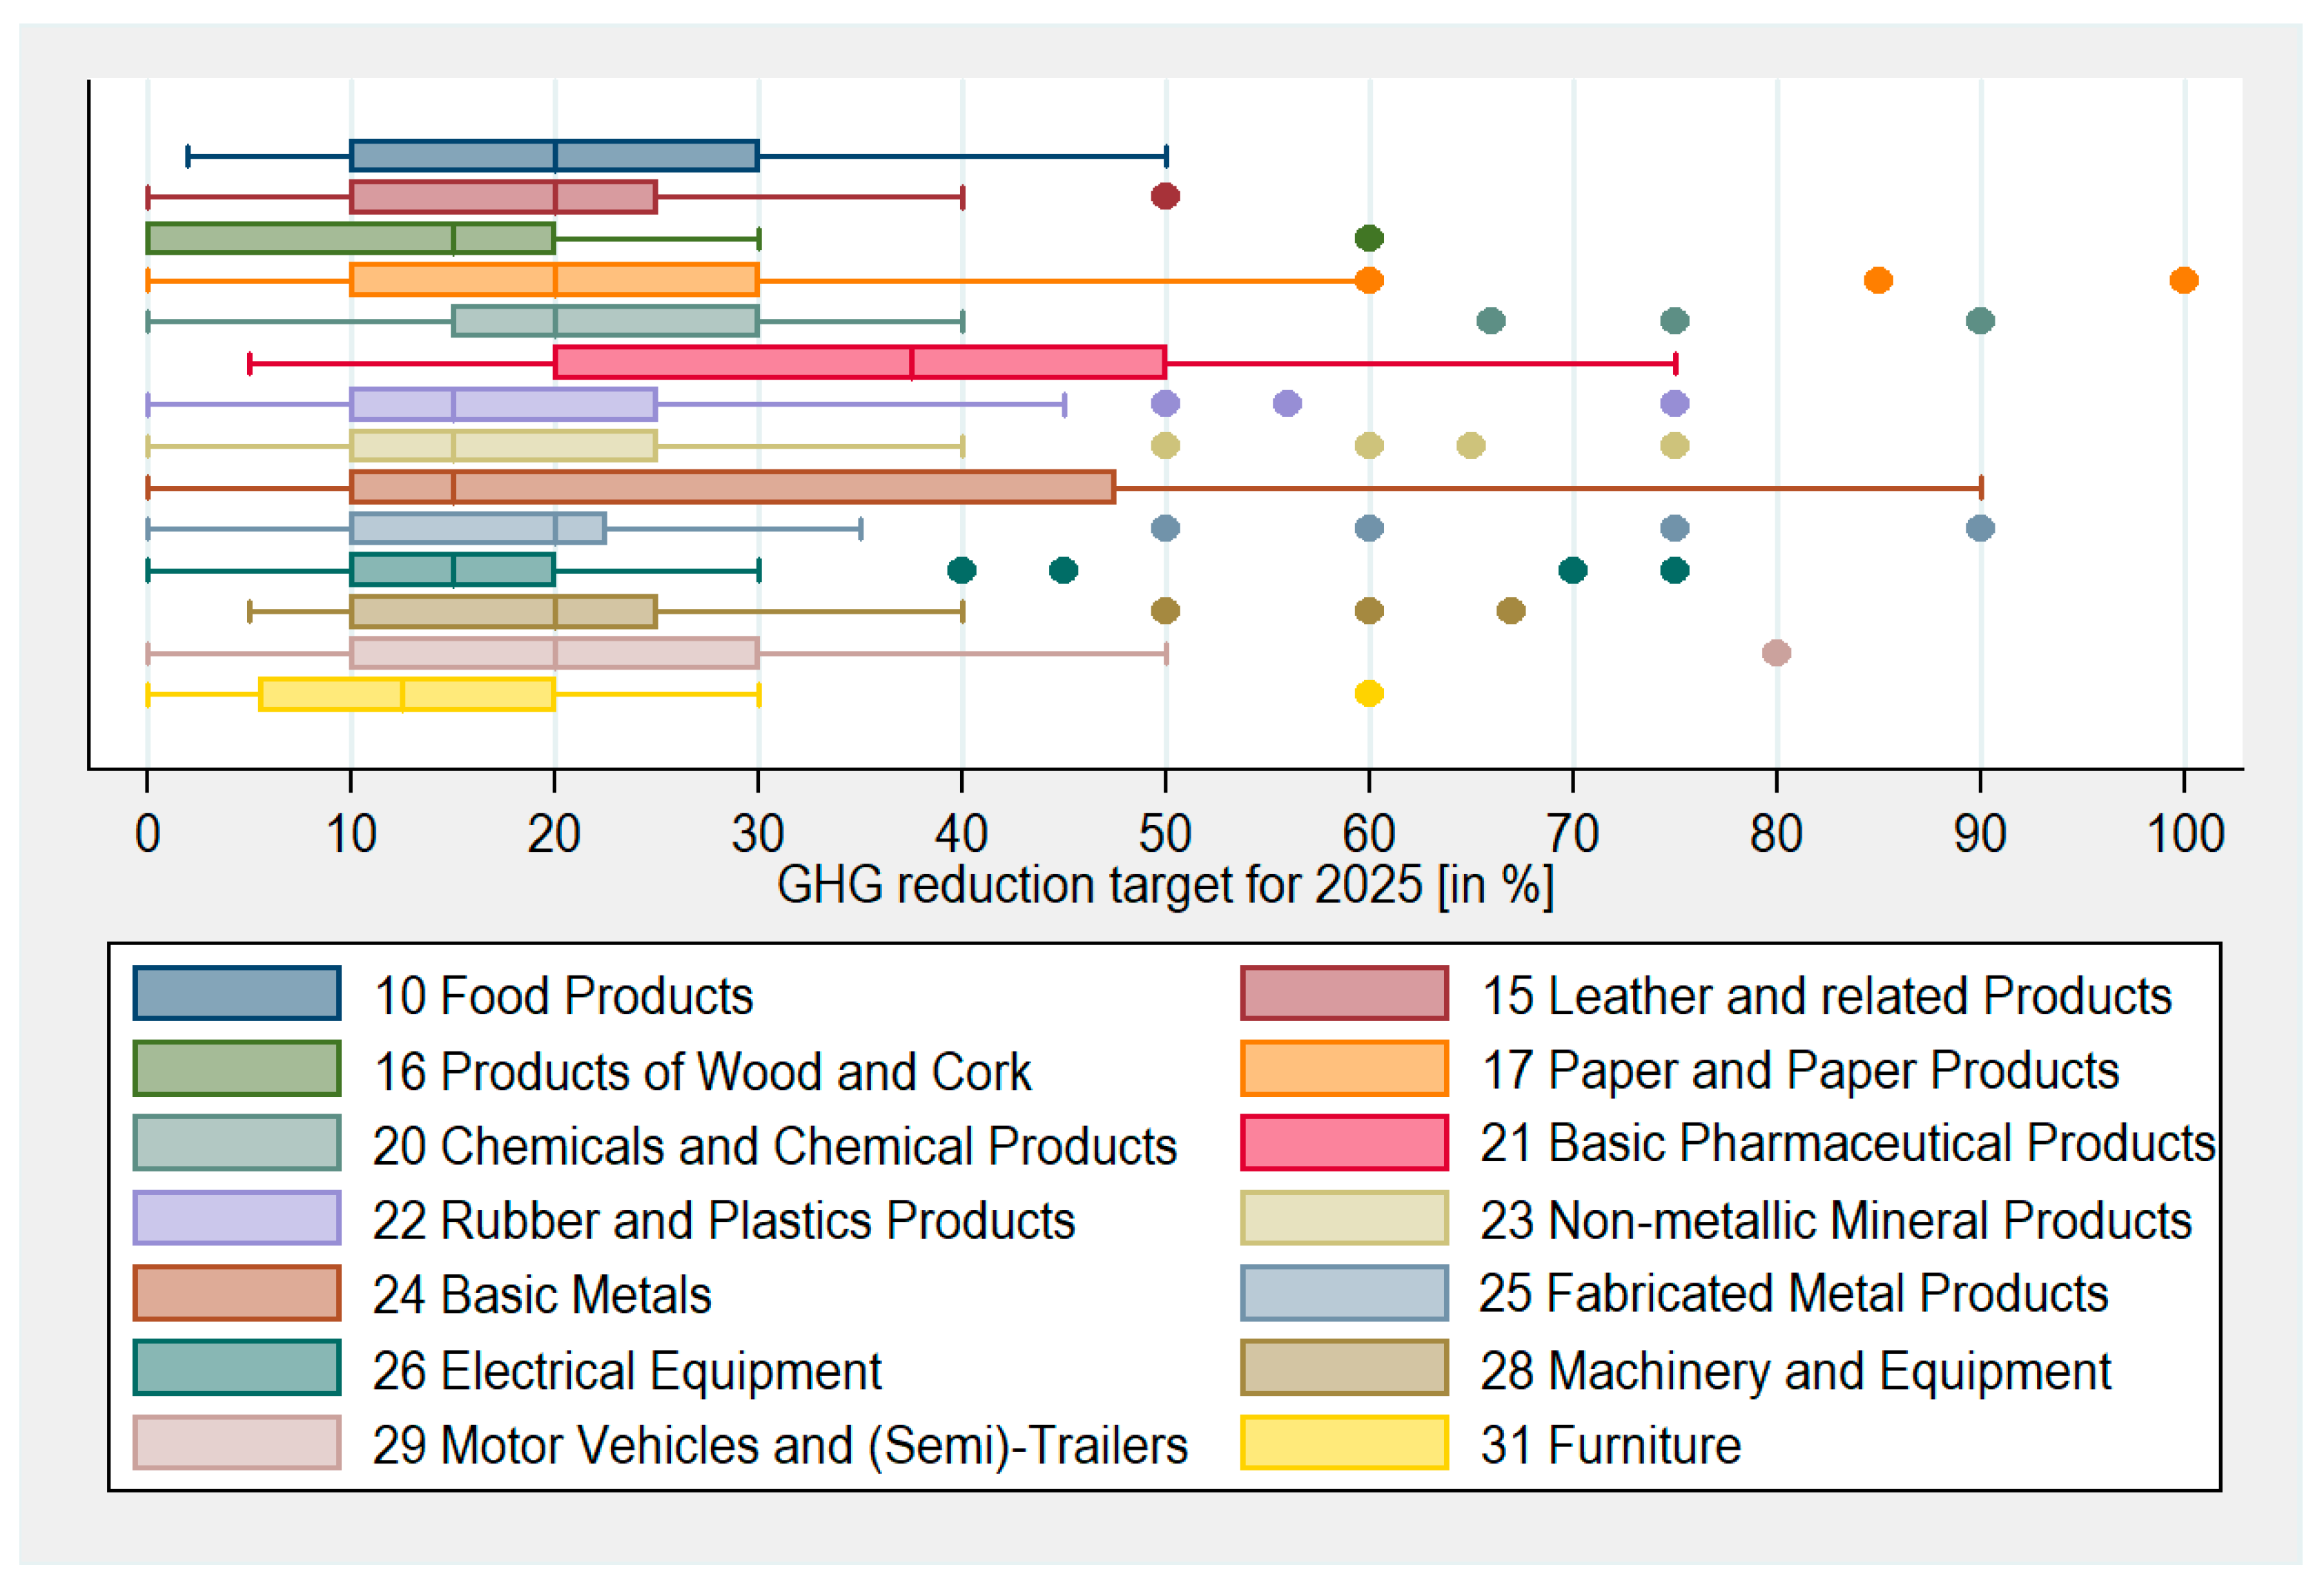
3.2.1. Bandwidth of Companies’ Decarbonisation Ambitions for 2025

Looking at the distribution of GHG reduction ambitions for 2025 (with respect to companies’ 2019 emission levels) by company size (cf. Figure 1), it can be seen that the median ambition level is similar for the smaller two company sizes, as well as for the larger two. However, when looking at the 75% quartile levels, the ambition rises with company size. It is evident and unsurprising that micro-, small- and medium-sized companies (MSMEs) are to a large extent less ambitious in their goals set, notably the micro companies. Particularly these companies usually do not have anyone in-house who has hands-on experience or focus on decarbonisation matters. Therefore, these companies would benefit most from third-party assistance [61].
Somewhat surprisingly, the envisaged decarbonisation targets for 2025 are almost on the same level for not-, less-, and energy-intensive companies (cf. Figure 2). Only the upper whisker of energy-intensive companies is lower and there are fewer outliers. This is not surprising, as achieving a high degree of decarbonisation is more challenging for energy-intensive companies, as energy and emissions belong to their “core processes”, while for not-energy-intensive companies that perhaps only need one energy carrier, it may be comparatively simple to decarbonise. However, in contrast to energy-intensive companies (where emission reduction often goes in line with energy cost reduction), their price driver is much smaller, as the energy cost share among total costs will be much smaller and hence also the focus on the topic—at least in context of day-to-day business. The (with exceptions) smaller upper quartile of moderately energy-intensive companies might be due to difficulties within the production context. Processes may just not be emission-intensive enough to justify very capital-intensive investments that would essentially also disrupt production, i.e., the cost–benefit ratio could, along with the shortage of skilled personnel, be an explanation for this.
The largest differences can be observed when looking at the targets of sectors (from which sufficient amounts of companies participated in this question). It stands out, that the wood, cork (16) and furniture (31) industries set the least ambitious targets, while many companies of the pharmaceutical industry (21) and the basic metals industry (24) set more ambitious targets. Nonetheless, the spread of companies’ goals is also the widest in these sectors (cf. Figure 3).
Due to the increasing pressures imposed on companies’ supply chains to also “do their part” and to reduce the embedded emission footprint of pre-products [8] (pp. 11–12), it is not surprising that the more ambitious half of companies set themselves more ambitious goals (cf. Figure 3, area to the right of/above the median). Specifically, the upper whisker of the basic metals industry is 15% points higher. However, the less ambitious half of all companies is nearly on the same level. This dynamic holds true to some extent (unless otherwise stated) for most dimensions showcased so far, meaning that most differences can be seen among the more ambitious halves of companies in their respective dimensions (above the median).
Figure 1. GHG reduction target for 2025 [in %], by company size.
Energies 18 02752 g001
Figure 2. GHG reduction target for 2025 [in %], by energy intensity.
Energies 18 02752 g002
Buettner et al. further analyse how the GHG reduction ambitions vary depending on what primarily motivates a company and based on which determinants the decarbonisation mix is decided upon [8,67].
Figure 3. GHG reduction target for 2025 [in %], by sector (n ≥ 20).
Energies 18 02752 g003

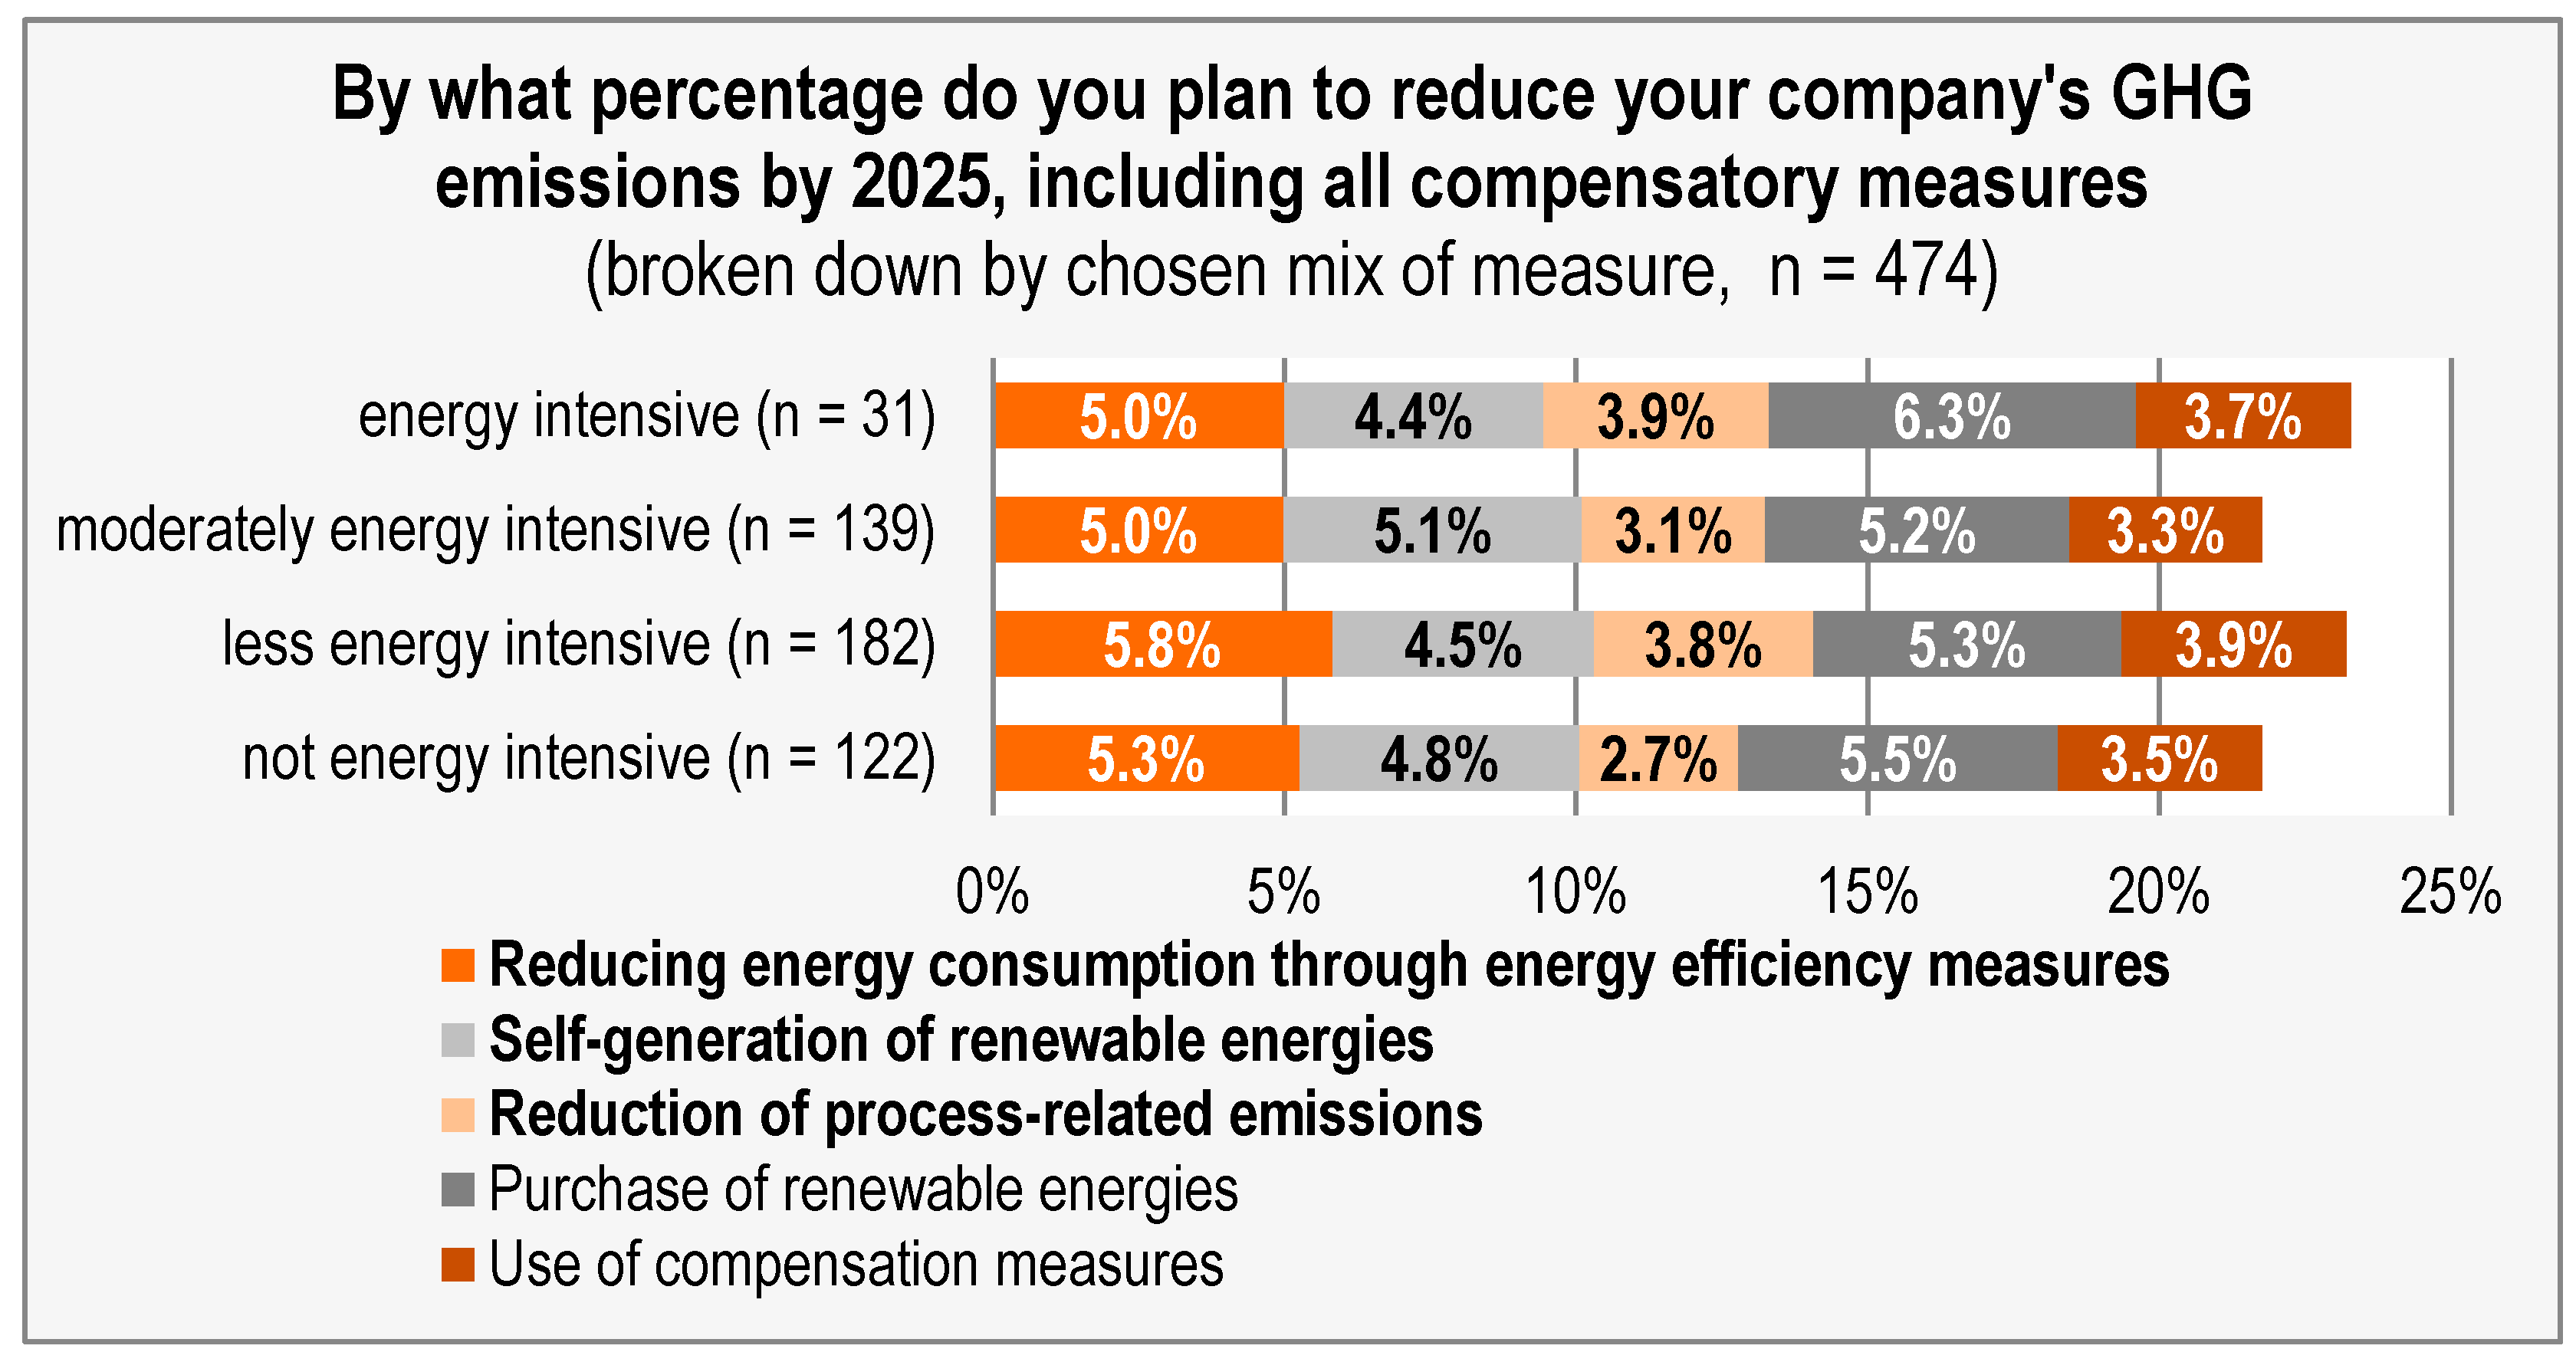
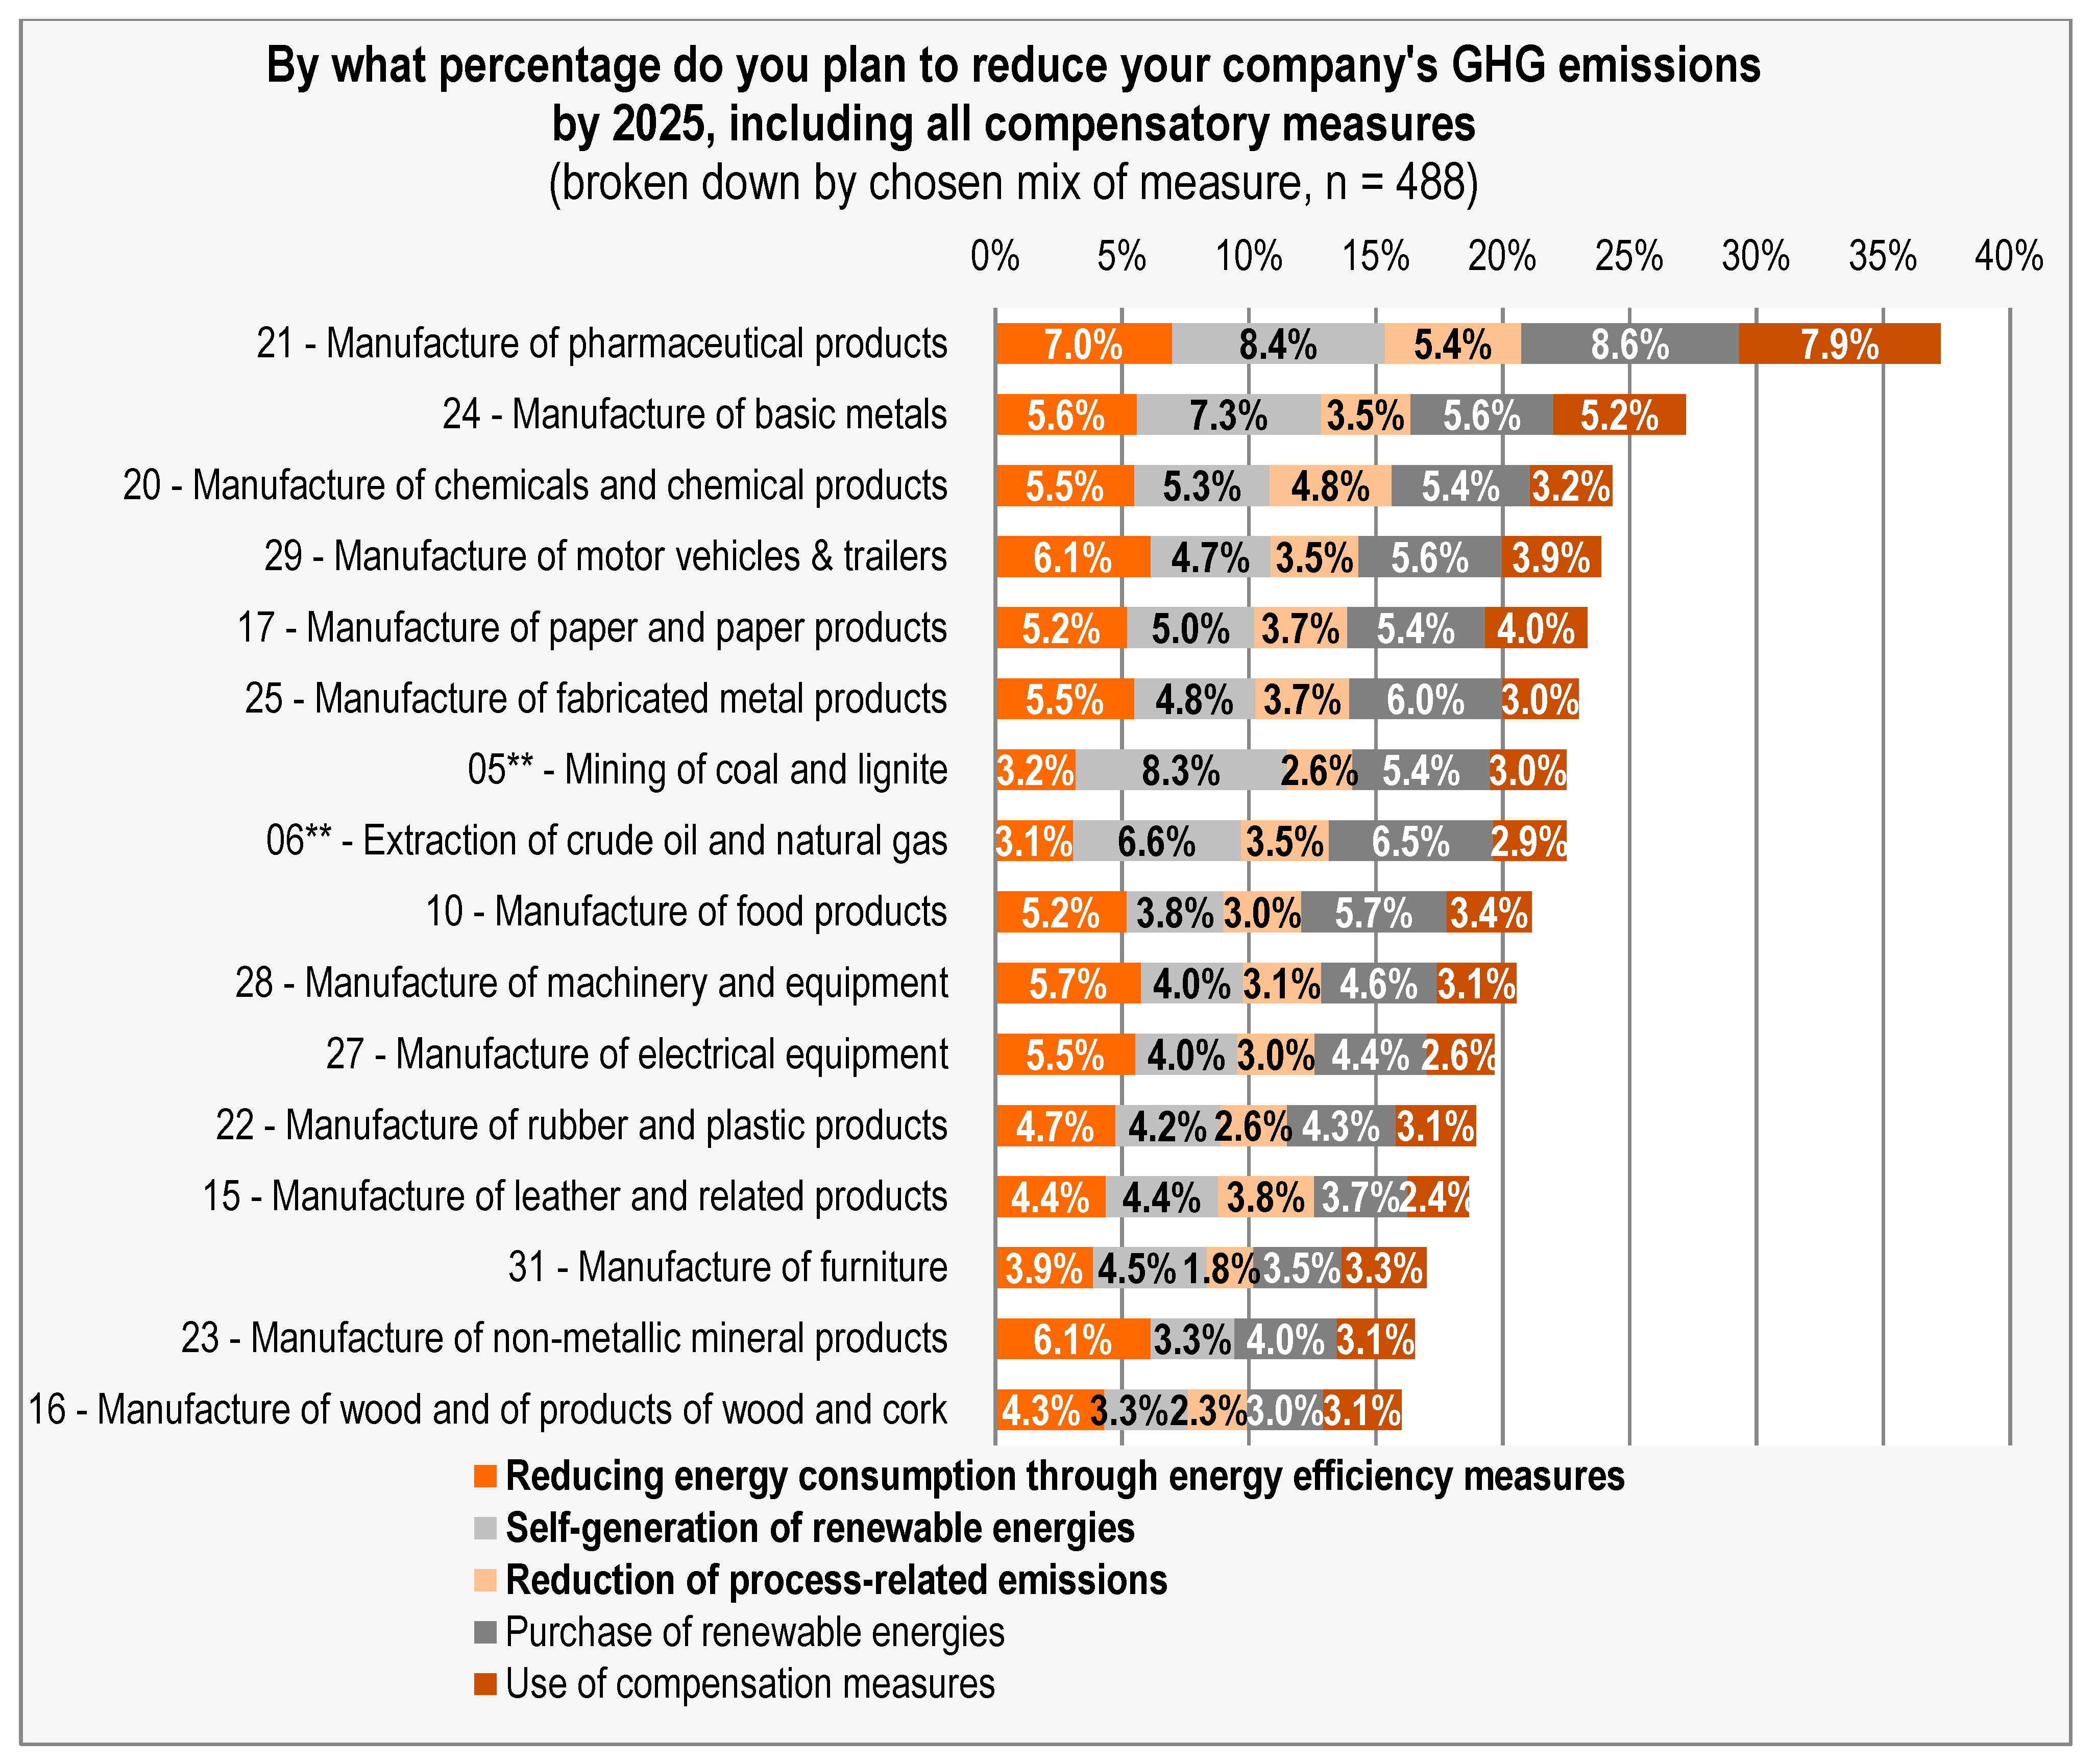
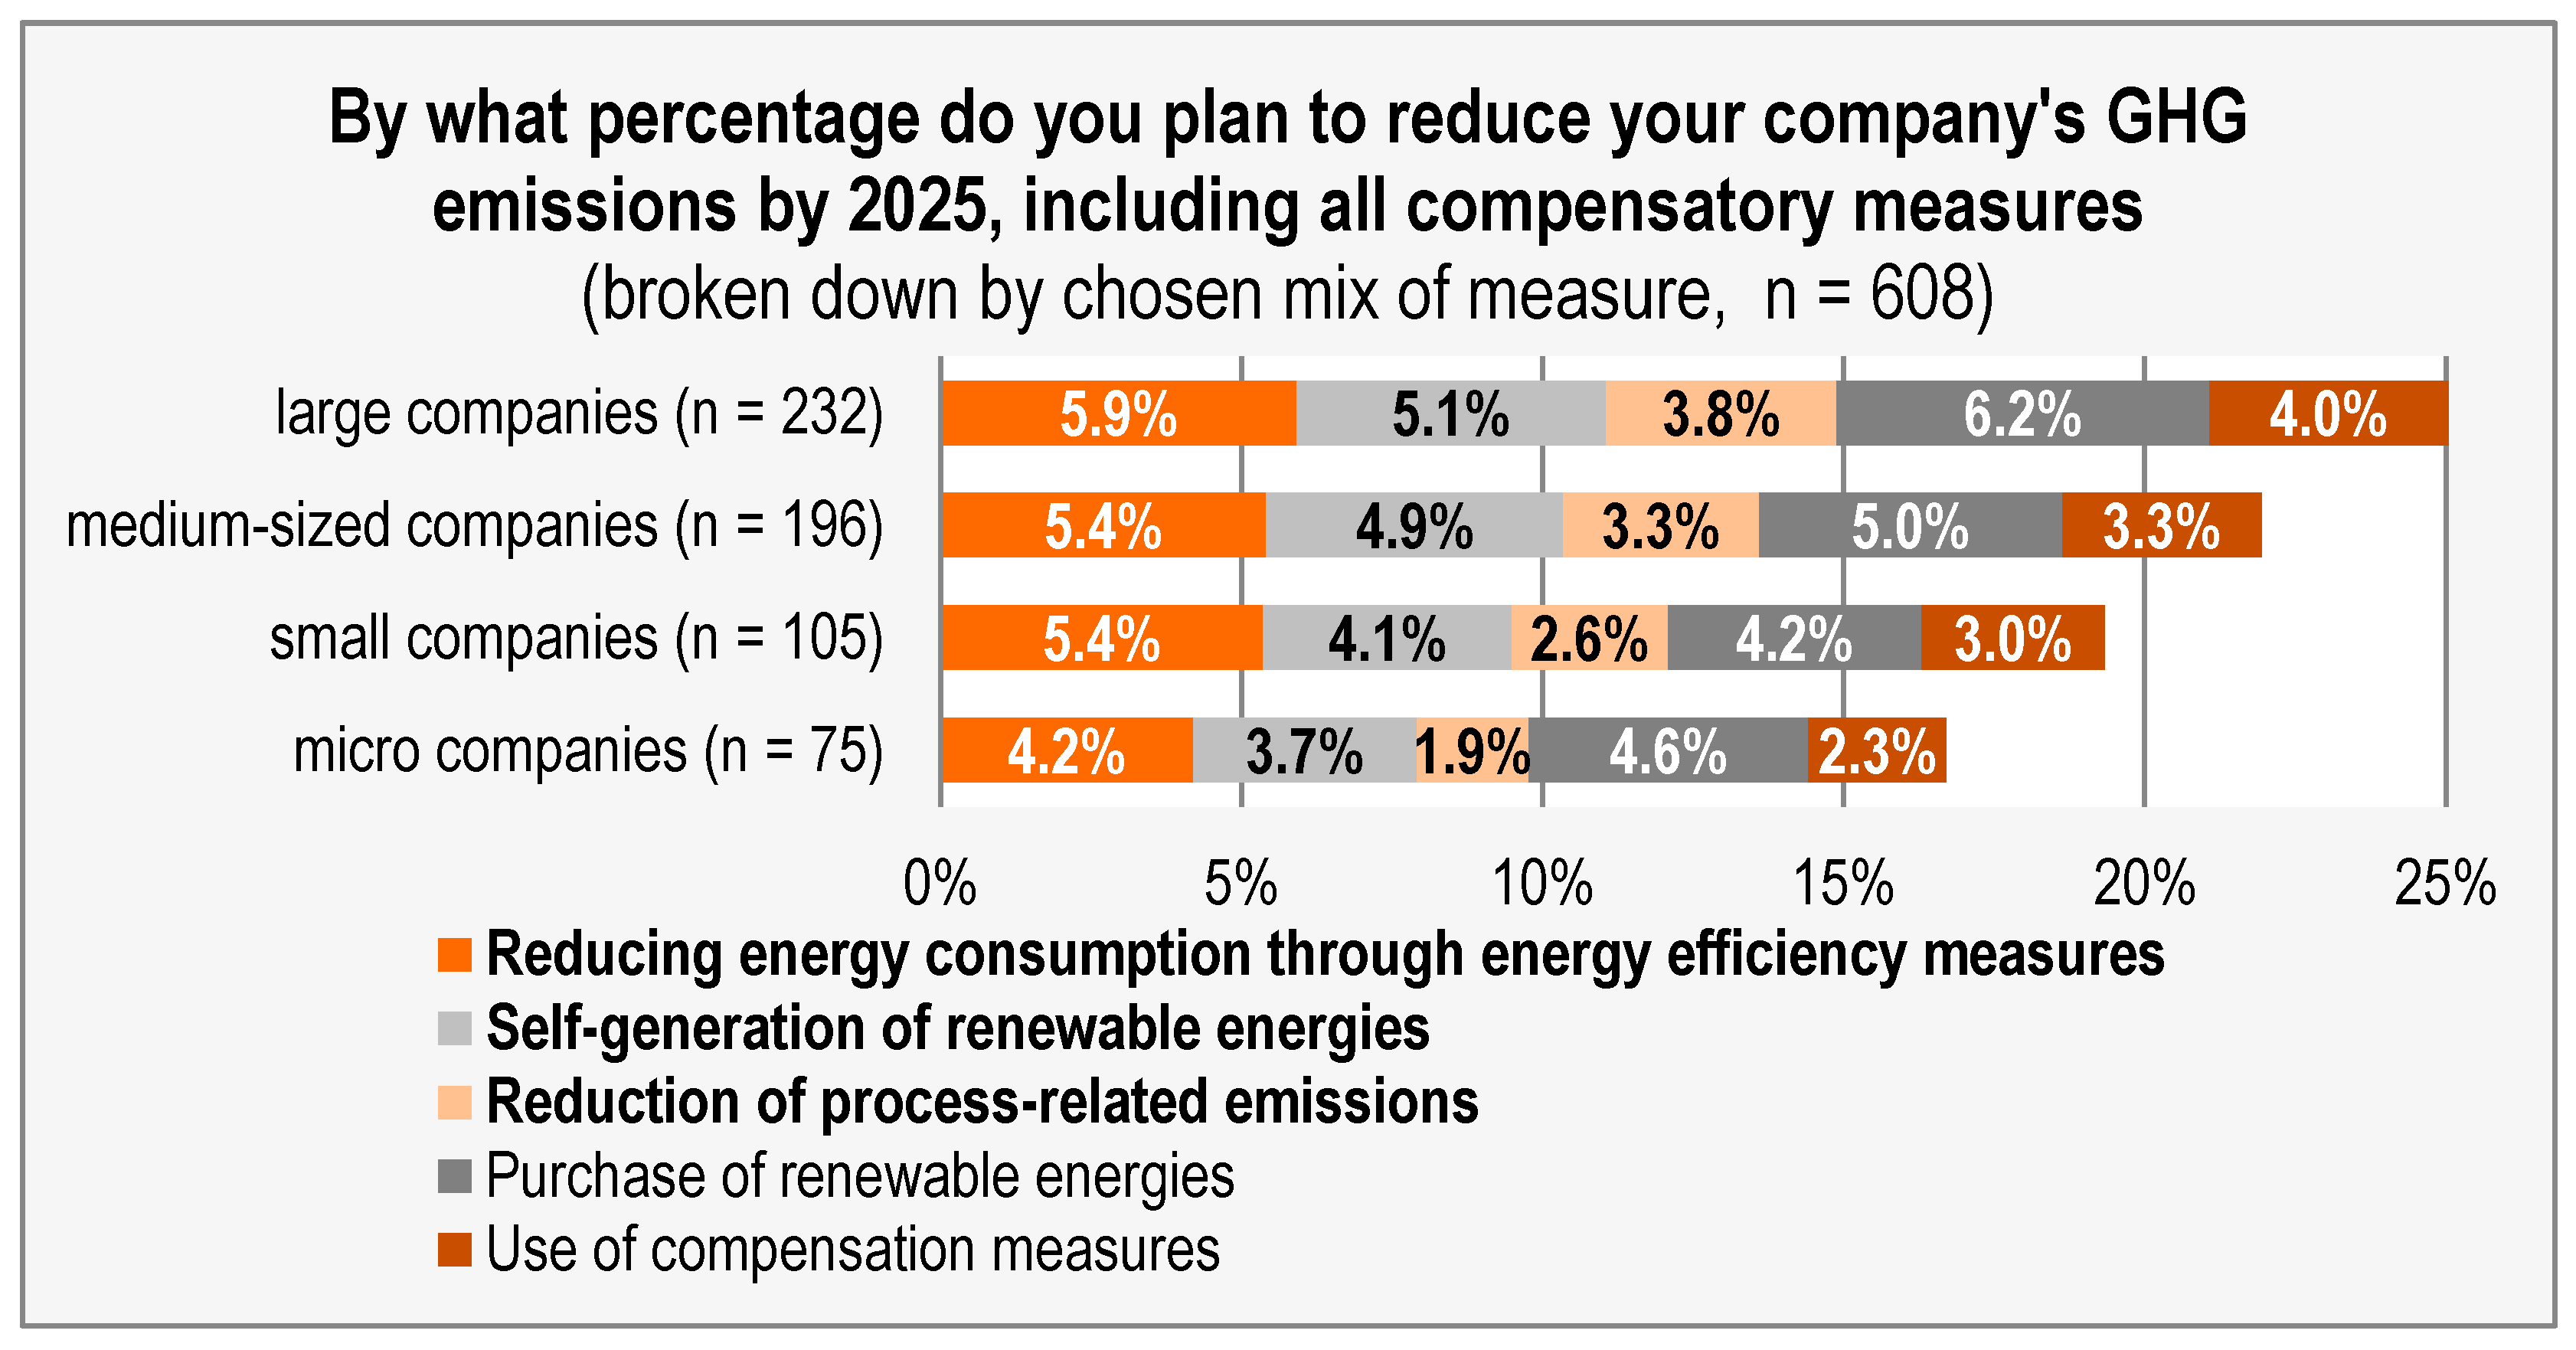
3.2.2. Planned Mix of Companies’ Measures to Achieve 2025 Decarbonisation Goals

To serve the overall goal of this article—to assess what is needed by when and by whom—this section is factoring in the mix of measures with which companies would like to achieve their GHG reduction targets for 2025.
Buettner and Wang [9] illustrate the merits of different decarbonisation measure types in detail. Measures can, in principle, be sorted into two dimensions:
  • What the measures “do”: reduction measures save energy, resources, and process emissions; substitution measures replace fossil energy sources with renewable energy sources; compensation measures do not avoid the emission but prevent them either from causing harm or compensate their effect by alternative means.
  • Where the measures “take place”: Measures that can be implemented on-site (energy efficiency measures, self-generation of renewables or process decarbonisation) give the company more control and also address the desire for resilience from hikes in energy, resource and emission prices or supply shocks. Off-site measures refer to the purchase of renewable energy and any type of off-site compensation. Off-site measures have in common that the company depends on someone else with respect to availability and prices. They cement the status quo in terms of resiliency or, in terms of compensation, increase dependence on a steady stream of viable compensation projects at a potentially increasing price and also the risk of bad press [69].
Figure 4 highlights how the 22.1% average savings ambition of companies participating in the EEI is disaggregated by measure type. It emerges that at the time of the data collection, companies embraced the notion of “efficiency first” (5.4% percentage points of their overall goal), closely followed by the notions of “purchase of renewable energy” (5.3%) and “self-generation of renewable energy” (4.7%). This illustrates that renewable energy is supposed to contribute 10% points overall to achieving the target. Considering that process decarbonisation can be quite complex and does not necessarily lead to energy savings, it is not surprising that a slightly higher proportion is attributed to compensatory measures (3.4% vs. 3.2%). In summary, companies intend to achieve on average 60% of their targets through measures implemented on-site (highlighted in bold in Figure 4).
Although the average ambition level increases with company size, the relative proportion of measures intended to achieve the GHG reduction remains almost identical, emphasising that the intention to address approximately 60% of the goal through on-site measures holds true (cf. Figure 5). Only in micro companies does it stand out that the purchase of renewable energy plays a larger role, possibly because such efforts are easier to implement compared to reducing emissions through other types of measures. Another possible explanation could be a lack of capital or space to install renewable generation on-site. However, this assumption is contradicted anecdotally given the numerous photovoltaic (PV) installations on company roofs in Germany (today—after the energy crisis hit).
The role of emission reduction through energy efficiency measures is highest among less energy-intensive companies (25.1%), possibly because the energy savings potential in this category promises significant savings while the measures are still relatively easy to implement. In contrast, for energy-intensive companies, the share of the reduction target to be achieved through the purchase of renewable energy is the largest (27%), likely due to the significantly higher energy demand that cannot be met through on-site generation (cf. Figure 6).
Irrespective of a company’s sector, the average proportion of intended on-site measures is between 55 and 67% of the company’s envisaged goal (cf. Figure 7). However, depending on the specifics of the sectors, the proportions may differ. For instance, the role of energy efficiency measures is smaller in the oil and gas as well as the mining sector, while renewable energy sources play a much larger role there. This is quite likely due to the type of machinery and vehicles used and due to the savings, which can be achieved via these activities in terms of emissions.
Figure 6. GHG reduction target for 2025, broken down by measure option [in %], energy intensity.
Energies 18 02752 g006
Figure 7. GHG reduction target for 2025, broken down by measure option [in %], by sector (n ≥ 20). ** micro sector (N < 10) with at least 50% of N participating.
Energies 18 02752 g007
The question that arises (and which was mentioned earlier) is whether companies have, in principle, picked up their pace in pursuing decarbonisation. If yes, this would be reflected in a steadily growing decarbonisation goal. Thus, one must observe whether the growth rate of ambition increases further or flattens after meeting the short-term goals. To facilitate answering this question, the second iteration of the EEI in 2020 asked for companies’ GHG reduction targets for 2030. Even though panel data would have been preferred to obtain the answers for both 2025 and 2030 from the same (set of) companies, the situation should be sufficiently homogenous to permit the comparison within their sub-categories.

3.3. Comparison of 2025 and 2030 GHG Reduction Targets

The average GHG reduction target for 2030 of companies participating in the EEI is 27.3% and thus “only” 5.2% higher than the average target for 2025. Although the data sets are not equivalent to panel data, the share of returning participants was about 38% in both data collections. With a 22.1% reduction, the sample’s average overall GHG savings ambition for the year 2025 appears quite considerable. Within the first half of the 2020s (2021–2025), companies aim to achieve an average of 4.4% GHG savings per year. However, for the second half of the 2020s (2026–2030) the additional ambition only amounts to another 1.1% GHG savings per year.
A closer look at the average targets by company size reveals that micro companies aim to end up at about the same reduction as small companies, and medium-sized companies at that of large companies in 2030. This suggests that the smaller small companies (micro) and the smaller large companies (medium-sized) have similar long-term ambitions to their larger equivalents (about 25% and 28%, respectively), but plan to achieve their targets with a less steep trajectory, meaning to spread measures out more over time, while the larger small (small) and larger large (large) companies aim to progress quickly (cf. Table 4). This might be a result of the anticipated learning curves, capital, internal capacity, and skilled personnel needed for the transition.
Likely due to the immediate pressure on energy-intensive companies to reduce their energy consumption and emissions (and the associated costs), they set the highest targets for 2025. However, the planned additional efforts for 2030 appear relatively modest (2.2%). In contrast, companies facing the least pressure (and with the easiest means to decarbonise) plan to make the most significant progress, aiming for both the highest GHG emission reductions and overall targets in the second half of the decade until 2030 (an increase of 10.1 percentage points to reach a 31.9% reduction; cf. Table 5).
Looking at Table 6, the data confirm the assumption that the average GHG reduction goals of companies differ considerably depending on their sector. Only sectors with at least 20 companies responding to this question in both data collections are listed in the table to limit random outcomes.
This highlights two possible explanations: Companies either want to address the issue head-on and then put it on the back burner, or their planning horizon does not permit them to estimate precise percentage goals for a year further ahead in time. Furthermore, there are also substantial differences on a sectoral basis. The goals of the rubber and plastics, automotive, and oil and natural gas industries increase substantially for the second half of the decade. Perhaps this divergence is due to the time span required for sophisticated changes in process technology and for arising benefits to kick in. On the other end of the spectrum, the ambitions of the pulp and paper, chemical, and basic metals sectors remain at roughly the same levels for 2030. One possible explanation for the latter point is that all three sectors are among the most energy-intensive ones, depending largely on gas. Subsequently, they may require a sufficient and reliable supply of hydrogen to achieve higher GHG savings. As for these sectors, the biggest gains appear to be only feasible via green hydrogen. For all sectors listed (apart from rubber and plastics), it is true that the growth of their decarbonisation ambitions appears to follow a limited growth function.
While, from a political perspective, it may be challenging to imagine how an almost 5% GHG reduction per year could be at all feasible, from a company viewpoint, such a target figure is not unheard of: The Science-Based Target Initiative (SBTi) reported, for instance, that 338 companies in their analysis “collectively reduced their annual emissions by 25% between 2015 and 2019—a difference of 302 million tonnes, which is equivalent to the annual emissions of 78 coal-fired power plants. This is true leadership and differs markedly from the global trend: over the same five-year period, global emissions from energy and industrial processes increased by around 3.4%” [70].

3.4. Putting Industry’s GHG Saving Goals in Political Context

The previous sections have provided insights into the spread and the average GHG reduction ambition. They also highlighted in general terms with which overall types of measures companies aim to achieve their goals. From other studies, we have learnt that the set goals are not unrealistic to achieve from a company perspective [2,70]. What we have not yet established is what these 22.1% and 27.3% targets actually mean. While using a recent “normal” business year (often 2019) as a basis makes sense from a business perspective, political targets usually refer back to another base year, 1990 [71].
In order to compare political and industry targets, it is necessary to identify the amount of GHG emissions the companies in the sample emitted in 2019. For the moment, we take the simplifying assumption that the sample is fairly representative of the industrial sector in Germany. In 2019, the German industry emitted circa 187 million tonnes of CO2 equivalents. In 1990, the industry’s emissions were at 284 million tonnes [72]. If the percentage goals for 2025 and 2030 were to be applied, the 187 million tonnes emitted in 2019 would be reduced by 22.1/27.3%, which corresponds to 41/51 million tonnes (cf. Table 7). Subtracting these reductions from the 2019 emissions leads to the remaining emissions for 2025 and 2030, respectively. The prospected 2025 and 2030 emissions then allow one to determine the targeted percentage reductions compared to the common policy base year of 1990. It is remarkable that this percentage is almost on the same level as Germany’s overall emission reduction target for 2030 at the time of data collection, which was 55% [73]. Nevertheless, the goal has since been increased to 65% [33]. If this goal was applied across the board, it would lead to a reduction down to 99 million tonnes by 2030. However, as of mid-2021, the sector targets under the Climate Protection Act list 140 million tonnes of remaining emissions as the target for the industrial sector. In other words, if the industry reached its self-determined targets for 2030, it would already meet Germany’s current sector targets for 2030 (cf. Table 7).
The implications of this are considerable for two reasons: Firstly, numerous articles and studies have highlighted that the climate change targets will be difficult to meet at the current pace of action [33]. With the goals determined, industry sets a strong self-determined signal. Accordingly, policymakers should focus on ensuring that the industry is able to fully reach its targets. Such a course of action would necessitate policymakers to engage with industry to identify potential prohibitors and to clear the path in contrast to prescriptive efforts to push industry to “try harder”. The second reason is much more concerning. In Section 3.3, we have established that industry plans to accomplish 80% of its decarbonisation efforts (contributing to the figures presented in Table 7) within the first half of the decade, which means by 2025. However, the problem is that due to the difficulties explained in Section 1, the average planning time and building and commissioning times for generation infrastructure, as well as wind parks, is beyond a half decade. Accordingly, nothing that is not already in the pipeline will be ready by 2025, unless planning processes, capacities, etc., are improved in the immediate future [33]. Although legislation has been passed to streamline and accelerate the planning and permission process, projects still need to go through this expedited procedure and then be implemented. This means it will take some time before a noticeable increase in the number of completed measures can be observed as a result of the simplified process [36,38]. To obtain a better understanding of how and where potential shortages might appear, it is necessary to apply the simplified procedure used to estimate the overall savings ambitions (cf. Table 7) on the subdivision of the savings targets as well.
In this regard, it is important to note that some measures can (only) impact energy consumption and energy-related emissions. Conversely, other types of emissions can only be tackled with process decarbonisation, CCUS, or compensatory projects. Offsetting GHG emissions is the only measure that can compensate for any type of emission (however, it cannot prevent emissions). As a result, a proportion of the emissions is energy-related and can only be addressed through the described means, and another proportion is process-related emissions. While the process-related proportion can be quite different across sectors, applying the general ratio, valid for industry as a whole, will be sufficient for the simplified estimation: of the 187 million tonnes of GHG emissions of industry, two-thirds are energy-related and one-third is process-related.
According to Destatis, industry’s total final energy consumption (energetic) in 2019 was 3336 petajoules (PJ), which is equivalent to 926.67 terawatt hours (TWh). In the same year, industry’s energy-related GHG emissions were at 125 million tonnes [74]. Dividing the emissions by the energy consumed leads to the industry’s average emission factor of 0.1349 tonnes of GHG emissions per TWh of energy consumption. If this factor is applied to the energy-related decarbonisation measures (energy efficiency, renewable energy), one finds the approximate amount of energy generation/savings needed to meet the proclaimed 2025 savings goal. It has to be noted that with each step taken in this estimation process, the deviation from reality may increase. Particularly in the context of final energy consumption, comparatively small deviations across data sources can lead to a substantial change in the emission factor.
Executing the operation suggests the need for 138 TWh in renewable energy capacity (self-generated and purchased, and not necessarily electricity), and 65 TWh in savings from energy efficiency measures by 2025. While keeping in mind that companies may wish to make use of a broad range of renewable energies, the estimated amounts are converted into on-shore wind turbines and photovoltaic panels for illustrative purposes. A modern wind turbine can generate 5–10 GWh per year. Using 7.5 GWh as a factor, this translates into 9.700 wind turbines. For an average photovoltaic panel, the annual electricity generation is about 0.17 MWh/m2 [75] and a forest stores approximately 6 tonnes of GHG emissions per hectare per year [76], leading to the figures in Table 8.
This much-simplified estimation highlights the magnitude of what would be required if companies’ self-determined contributions were translated into concrete measures by 2025.

4. Discussion

Similar to countries’ Intended Nationally Determined Contributions (INDCs), companies’ Intended Company-Determined Contributions (ICDCs), or simply their corporate goals, failing to adhere to them usually does not entail any consequences. However, knowing these intentions allows for an assessment of the potential aggregate impact if implemented and, from a system perspective, what would be needed from the system to enable companies to realise their goals and hold them accountable.

4.1. Implications for Energy Policy and Industrial Strategy

The EWI estimates that meeting the wind energy growth targets and the ambition of serving 80% of electricity demand in 2030 with renewable sources will require on average 5.8 wind turbines going online per day between 2023–2029 [39]. Between 2010 and 2021, on average 3.5 wind turbines went online per day [33]. If the estimated 9700 wind turbines to meet industry’s target were to be installed within five years (from the point of the data collection in 2020), 5.3 turbines would need to go online per day. The EWI estimates additional electricity needs for industry of 45 TWh. To produce 20 TWh of green hydrogen for industry, it is estimated that a further 29 TWh of electricity from renewable energy sources is required [39]. Comparing EWI’s depiction of the goals outlined in the coalition agreement (2021–2024) of Germany’s Ampel government (a three-party coalition of Social Democrats, Greens, and Liberals) with our estimate shows that the additional green energy needs of industry estimated by the EEI for 2025 would be on par with EWI’s numbers—however, only if all energy efficiency measures are applied (saving ~75 TWh), the 138 TWh of renewable generation are operational (cf. Table 8), and, crucially, it all happens within half the time. This is as the needs estimated by EEI are for 2025 and EWIs for 2030.
With the increasing electrification of industrial processes (leading to higher electricity consumption on the demand side) and the rising demand for green hydrogen (leading to higher electricity consumption on the supply side), the share of electricity in the industry’s energy mix will significantly increase from the approximately one-third it currently represents. Consequently, the industrial sector’s share of overall electricity consumption will become much higher compared to 2019 (45%) [12]. Alongside the intended expansion of heat pumps in residential buildings and the growth of e-mobility, this will substantially increase the overall electricity demand. Unless the expansion of renewable energy generation can keep pace with the growing demand, this will result in a reduced share of renewable electricity within the energy mix. In summary, achieving an envisaged 80% share of green electricity by 2030 would, when compared to the proportion of renewable electricity in total electricity generation in 2019, correspond to a figure far exceeding 100% in 2019 terms.

4.2. Implications for Monitoring and Scenario Modelling

The estimations presented have inherent limitations due to the simplifications and assumptions which had to be made along the way. To enhance the accuracy of these estimates, the following methodological improvements are suggested:
  • Sector weighting: calculate the proportion of each sector’s energy consumption relative to the entire industry and use this as a weighting factor for individual observations.
  • Size adjustment: apply a weighting factor reflecting the proportion of MSMEs within each sector, accounting for differences in ambition levels by company size.
While Figure 3 and Figure 7 and Table 6 illustrate the range of sectoral ambitions for 2025, their composition, and the sectors’ starting point for 2030, it remains unclear how relevant these sectors are for the German economy. For instance, if a sector with “low relevance” has high targets, this may result in a smaller positive impact compared to low ambition in a highly relevant sector. When questioning the relevance of a sector, one might intuitively consider economic weight as the determining factor. From a social perspective, it might be the number of jobs at stake, or, in terms of reach, the number of companies within the sector. In the roadmap study “Climate Neutral Production”, exactly this question was addressed, revealing that relevance largely depends on the context and focus [77]. As with any GHG reduction goal, GHG emissions are the central metric for evaluation. Therefore, the proportional share of a sector’s GHG emissions is key to assessing the necessary actions and the impact of any Intended Company-Determined Contributions (ICDCs). However, when assessing the potential impact of energy efficiency measures or the resources needed to facilitate a fuel switch, it also appears essential, as suggested in the previous paragraph, to consider the proportional share of a sector’s energy consumption.
As outlined in previous sections, the decarbonisation measure categories either target energy-related emissions (energy efficiency, self-generation, purchase of renewable energy) or process-related emissions (process decarbonisation, CCUS). To accurately assess reduction ambitions within these categories, it is also necessary to consider the proportion of each emission type within a given sector.
Based on the insights gained from the roadmap study for Baden-Württemberg, Table 9 provides an adapted overview of the German Manufacturing Industry, the focus of this article. Comparing the heatmap with the presented results, it is noteworthy that one of the sectors with the highest GHG reduction targets (basic metals) also accounts for one of the highest shares of both energy consumption and emissions (approximately a quarter each). In contrast, the sector with the highest ambitions for 2025, the pharmaceutical industry, accounts for less than 1% across all dimensions considered.
Although it might seem intuitive to focus on the core industries (marked in bold in Table 9), as they account for approximately three-quarters of energy consumption and GHG emissions, it is crucial to recognise that climate neutrality or a low-carbon economy can only be achieved if all sectors, stakeholders, and individuals contribute within their means. While decarbonising high-impact sectors yields the greatest absolute reductions, achieving net zero emissions requires addressing the remaining quarter as well.
Further research should aim to enhance the precision of the estimation approach to improve the accuracy of the required measures for companies to meet their ICDC targets. Additionally, expanding research on heatmaps, such as the one presented in Table 9, could support higher accuracy. Since the method applied in this article did not differentiate between forms of energy, it would be advantageous to disaggregate sectors’ energy consumption by energy type to obtain a clearer picture of the specific energy needs. However, it should be noted that of the two-thirds of industrial energy consumption not powered by electricity in 2019, it remains uncertain what share will be electrified during the decarbonisation process and what will be substituted by other renewable energies (such as biogas, hydrogen, renewable heat, etc.).
However, even if the figures estimated in this article with the simplified procedure are off by up to 50%, the forecasted generation capacities are quite likely not sufficient and, more importantly, come too late.
In order to reduce suffering from such supply risks, companies are well advised to undertake those measures, which are within their “control”—the on-site measures. Particularly, the common saying that the best unit of energy is the one not used holds true in this context. The more efficient end users become, the more impact each additional wind turbine or each photovoltaic or solar thermal energy panel will have. Moreover, planning permissions and shortages in installers, equipment, and energy experts all take their toll and constitute a potential, often a real, bottleneck in companies’ resilience and net zero plans. This dynamic further underscores the importance of efficiency, if not in general then in terms of the timeline (and the cost increases over time).

4.3. Decarbonisability and Mechanism Proposal

Given the risks and obstacles to companies’ resilience and net zero plans, it would be beneficial to determine each company’s decarbonisability factor [61] (p. 18). The latter describes the proportion of a company’s overall emissions that can be/is planned to be reduced through on-site measures for technical and space reasons, instead requiring off-site means. Awareness of decarbonisability factors would provide policymakers with a certain level of planning certainty regarding the required capacity growth both on-site (decarbonisability factor) and off-site (1—decarbonisability factor), as well as the associated planned measures and necessary enablers (somewhat comparable to a shopping list).
To improve the accuracy of transformation plans, policymakers should further complement their estimations, basing them not only on technology roadmaps but also on bottom-up information to gain an actual understanding of what exactly is needed when and by whom. This can either be carried out in a survey format, such as the EEI, provided a more precise estimation approach is developed, or a full data collection, similar to a census. For the latter, each company would be asked to fill in a confidential online questionnaire providing company size, sector, federal state, composition and amount of energy use (for larger companies, also energy- and process-related emissions). In addition companies would be asked how they intend to contribute to the country’s GHG target (in % by 2030). Information on the scopes in which the company pursues emission reductions, how advanced the company is in its decarbonisation, and where it needs help can further make such a tool serve as a two-way facilitator. Firstly, policymakers acquire a better understanding of the required infrastructure and the progress towards decarbonisation. Secondly, companies have a chance to indicate what they need to help achieve the societal climate goals. Policymakers can then address these with specific measures.
With sufficient participation, the questionnaire could be useful to assess from a demand-side perspective what is needed, when, by whom, and where. To master the climate and energy crisis successfully, all stakeholders, particularly policymakers, but also companies, need to “up their game” and quickly push ahead with decarbonisation, particularly through the application of energy efficiency measures and the parallel expansion of self-generation capacities.
Future research should not only focus on improving estimation capacity but also exploring the actual savings achieved by 2025. Geopolitical crises and their impacts on the global economy have, at present, shifted the focus away from climate action, respectively delaying companies’ target years [37,80]. This is despite the fact that many decarbonisation measures enhance companies’ cost-competitiveness in the long run, as well as their resilience and future readiness.

5. Conclusions

This article aimed to assess the renewable energy needs of German manufacturing companies, identify how much they plan to decarbonise by 2025 and 2030 and evaluate the implications for energy systems and policy. The findings not only provide insights into the industrial sector’s ambitions but also address challenges related to the capacity planning of renewable energy and the decarbonisation process.

5.1. Summary of Findings

This article addressed the following research questions: (1) the amount of greenhouse gas (GHG) reductions that German manufacturing companies aim to achieve by 2025 and 2030, (2) the measures planned to reach these targets, (3) the alignment of renewable energy requirements with policy frameworks, and (4) the gaps between companies’ renewable energy needs and the projected availability according to political planning. The findings indicate that the article successfully met these research objectives by providing a detailed analysis of company targets, planned measures, and the associated energy system requirements.
The analysis revealed that, on average, companies aim to reduce their greenhouse gas (GHG) emissions by 22.1% by 2025 and 27.3% by 2030 compared to their 2019 levels (c.f. Section 3.3). These goals are primarily achieved through on-site measures such as energy efficiency improvements and self-generation of renewable energy, which together make up around 60% of the decarbonisation plans (c.f. Section 3.2.2). While energy-intensive companies set more ambitious short-term goals, their additional ambitions for 2030 appear relatively modest (c.f. Section 3.3). In contrast, less energy-intensive companies plan for more significant progress by 2030, possibly due to easier implementation of decarbonisation measures.
Furthermore, the article introduces the concept of the “decarbonisability factor” to support more precise capacity planning, highlighting that not all emissions can be reduced on-site, necessitating off-site solutions (c.f. Section 4.3). The analysis underscores that bottom-up estimations are essential to accurately gauge the actual requirements of the industrial sector, as current top-down approaches fall short of reflecting real-world demands. Additionally, the article reveals a significant mismatch between the forecasted renewable energy capacities for 2030 and the actual needs for 2025, indicating that capacity expansion efforts must be accelerated.

5.2. Practical and Policy Implications

The findings suggest that policymakers need to focus on enabling companies to meet their self-determined targets rather than enforcing stricter regulations. Supporting companies with resources to increase energy efficiency and renewable energy use will be crucial. Additionally, a stronger focus on dual strategies—capacity expansion and demand reduction—is essential to meet the rising demand for electricity and hydrogen, as also suggested by the global stocktake, the central outcome of COP28 [81].
Local action is critically important, as the system may not be able to provide sufficient resources within the desired timeline. In this context, reducing demand, recycling, and making better use of waste are logical strategies to limit dependency on off-site provision, access, reliability, and affordability of the necessary resources [9,82].
It is not the lack of ambition that hinders industrial decarbonisation but rather the lack of means to achieve the set goals. This conclusion is further supported by a multi-dimensional analysis conducted by Buettner as part of his dissertation, which also incorporated the preprint version of this article and has since been expanded and updated herein [83]. While recent legislative efforts, such as the acceleration laws in Germany, have improved planning procedures, the economic situation and geopolitical developments still challenge the consistent implementation of decarbonisation measures [15,36,37,38].

5.3. Limitations and Future Research

Despite the comprehensive analysis, the article has some limitations. The use of survey data from the Energy Efficiency Index of German Industry (EEI) may not fully capture the diversity of company strategies. Further research should improve the estimation procedure along the lines suggested, validate the progress made by 2025 and periodically reassess the sector’s decarbonisation efforts to account for geopolitical changes and economic shifts. It would be beneficial to conduct repeated data collections every few years to validate progress and assess emerging needs. Additionally, future studies should develop more detailed bottom-up models that consider sector-specific energy needs and emission profiles.

5.4. Final Remarks

The insights gained from this article strongly suggest that current capacity planning approaches, which often rely on top-down estimations, need to be complemented by more precise bottom-up data to capture actual industrial needs. Given the considerable gap between the projected requirements for 2030 and the real demands emerging by 2025, proactive measures must be taken to accelerate the expansion of renewable energy capacities.
This article highlights the critical role of local action in achieving decarbonisation goals. The results underline that, while ambitious targets have been set, the real challenge lies in implementation, particularly given the need for extensive infrastructure upgrades. Combining efficiency measures with capacity expansion is crucial to ensure that the increased demand does not outpace renewable supply. Policymakers and industry leaders must collaborate to develop realistic, scalable solutions that bridge the gap between ambitions and practical implementation.
Although the findings relate specifically to German manufacturers, the approach and insights could also be applied in other UNECE countries. The ongoing data collection efforts within the Energy Efficiency Barometer of Industry, if response rates are sufficient, could support similar analyses internationally. To ensure continuous accuracy and relevance, data collection should be repeated periodically to track progress and address new challenges.

Author Contributions

Conceptualization, S.M.B.; methodology, L.S., J.D., S.M.B. and W.K.; validation, L.S. and S.M.B.; formal analysis, L.S., S.M.B. and J.D.; investigation, J.D. and S.M.B.; data curation, L.S., J.D. and. S.M.B.; writing—original draft preparation, S.M.B. and J.D.; writing—review and editing, S.M.B., M.G., J.D., L.S., W.K. and A.-L.K.; visualization, S.M.B., J.D. and L.S.; project administration, S.M.B.; funding acquisition, S.M.B. All authors have read and agreed to the published version of the manuscript.

Funding

This research received no external funding.

Data Availability Statement

The data presented in this study are available on request from the corresponding author. The data are not publicly available due to privacy issues.

Acknowledgments

The underlying research in form of the Energy Efficiency Index of German Industry (EEI, #EEIndex) would not have been possible without the continuous support of the Karl-Schlecht-Foundation and the Heinz und Heide Dürr Foundation, as well as the about 850 companies participating, and those reviewing this paper, particularly Artur Gergert, Janniko Czeschlik, Katharina Meyer, and Ali Kara. All conclusions, errors or oversights are solely the responsibility of the authors.

Conflicts of Interest

The authors declare no conflicts of interest.

Abbreviations

The following abbreviations are used in this manuscript:
CATIComputer-Assisted Telephone Interviewing
CCCECovenant of Companies for Climate and Energy
CCUSCarbon Capture, Storage and Use
CERsCertified emission reductions
CO2Carbon [dioxide]
DACCSDirect Air Carbon Capture and Storage
EEIEnergy Efficiency Index of German Industry
EEPInstitute for Energy Efficiency in Production
EIBEuropean Investment Bank
EWIEnergiewirtschaftliches Institut an der Universität zu Köln
GHGGreenhouse gas
GWGigawatt
GWhGigawatt hours
IHKIndustrie- und Handelskammer
ICDCIntended Company-Determined Contributions
INDCIntended Nationally Determined Contributions
KfWKreditanstalt für Wiederaufbau
MSMEsMicro-, small and medium-sized companies
MWhMegawatt hours
NZCNetZeroCities
P2XPower-to-x
PJPetajoule
PVPhotovoltaic
SBTiScience-Based Target Initiative
TWhTerawatt hours
UNECEUnited Nations Economic Commission for Europe
WhWatthours

References

  1. United Nations Framework Convention on Climate Change. Global Climate Action-NAZCA. Available online: https://climateaction.unfccc.int/ (accessed on 28 December 2022).
  2. Science Based Targets Initiative (SBTi) Companies Taking Action. Available online: https://sciencebasedtargets.org/companies-taking-action (accessed on 30 March 2025).
  3. Net Zero Tracker. Net Zero Tracker Beta. Available online: https://zerotracker.net/ (accessed on 30 March 2025).
  4. Climate Action Tracker. CAT Net Zero Target Evaluations. Available online: https://climateactiontracker.org/global/cat-net-zero-target-evaluations/ (accessed on 30 March 2025).
  5. United Nations Framework Convention on Climate Change. Paris Agreement. 2015. Available online: https://unfccc.int/sites/default/files/english_paris_agreement.pdf (accessed on 30 March 2025).
  6. Net Zero Cities. The NZC Project. Available online: https://netzerocities.eu/the-netzerocities-project/ (accessed on 30 March 2025).
  7. European Commission. Covenant of Companies for Climate and Energy. Available online: https://covenant-of-companies.ec.europa.eu/about_en (accessed on 27 November 2023).
  8. Buettner, S.M. Roadmap to Neutrality-What Foundational Questions Need Answering to Determine One’s Ideal Decarbonisation Strategy. Energies 2022, 15, 3126. [Google Scholar] [CrossRef]
  9. Buettner, S.M.; Wang, D. An Approach to Reducing the Greenhouse Gas Footprint in the Manufacturing Industry: Determinants for an Economic Assessment of Industrial Decarbonisation Measures; University of Stuttgart: Stuttgart, Germany, 2022. [Google Scholar] [CrossRef]
  10. EEP Energy Efficiency Index Winter Survey 2021/22-70 Percent of Companies Want to Offer Their Products in a Climate-Neutral Way (23 February 2022). Institute for Energy Efficiency in Production, University of Stuttgart. 2022. Available online: https://www.eep.uni-stuttgart.de/en/institute/news/news/Energy-Efficiency-Index-winter-survey-2021-22---70-percent-of-companies-want-to-offer-their-products-in-a-climate-neutral-way/ (accessed on 30 March 2025).
  11. World Resources Institute. Greenhouse Gas Protocol. FAQ. Available online: https://ghgprotocol.org/sites/default/files/standards_supporting/FAQ.pdf (accessed on 30 March 2025).
  12. IEA. World Energy Balances Highlights. Available online: https://www.iea.org/data-and-statistics/data-product/world-energy-balances-highlights# (accessed on 30 March 2025).
  13. Stratmann, K. Erste Unternehmen Kapitulieren vor Hohen Gas- und Strompreisen–Was die Politik nun Tun Will. Handelsblatt. 1 January 2022. Available online: https://www.handelsblatt.com/politik/deutschland/strom-und-gas-erste-unternehmen-kapitulieren-vor-hohen-gas-und-strompreisen-was-die-politik-nun-tun-will/27935982.html (accessed on 30 March 2025).
  14. Olk, J.; Stratmann, K. Warum Deutsche Firmen Jetzt vor der Deindustrialisierung Warnen. Handelsblatt. 7 September 2022. Available online: https://www.handelsblatt.com/politik/deutschland/energiekrise-warum-deutsche-firmen-jetzt-vor-der-deindustrialisierung-warnen/28662604.html (accessed on 30 March 2025).
  15. Stratmann, K. Unternehmen Fordern Konsequente Klimapolitik von Neuer Regierung. Handelsblatt. 10 March 2025. Available online: https://www.handelsblatt.com/politik/deutschland/energiewende-unternehmen-fordern-konsequente-klimapolitik-von-neuer-regierung/100111322.html (accessed on 30 March 2025).
  16. Blume, J.; Herwartz, C.; Kuchenbecker, T.; Stratmann, K.; Wermke, C.; Witsch, K. Nach der Gasknappheit Droht die Stromknappheit–Wie die Dürre Europas Versorgung Gefährdet. Handelsblatt. 15 August 2022. Available online: https://www.handelsblatt.com/politik/international/energie-nach-der-gasknappheit-droht-die-stromknappheit-wie-die-duerre-europas-versorgung-gefaehrdet/28600886.html (accessed on 30 March 2025).
  17. Redaktion Handelsblatt. Möglicher Gaslieferstopp: Wie sich die Industrie auf den Worst Case Vorbereitet. Handelsblatt. 28 April 2022. Available online: https://www.handelsblatt.com/unternehmen/industrie/energie-moeglicher-gaslieferstopp-wie-sich-die-industrie-auf-den-worst-case-vorbereitet/28282380.html (accessed on 30 March 2025).
  18. WDR. Wer Bekommt noch Gas im Ernstfall: Privathaushalte oder Industrie? WDR. 29 April 2022. Available online: https://www1.wdr.de/nachrichten/gasmangel-industrie-privathaushalte-prioritaet-100.html (accessed on 22 December 2022).
  19. Bücker, T. Notfallplan bei Lieferstopp: Wer als Erstes auf Gas Verzichten müsste. tagesschau. 30 March 2022. Available online: https://www.tagesschau.de/wirtschaft/verbraucher/gas-notfallplan-bundesnetzagentur-101.html (accessed on 22 December 2022).
  20. Hennes, W. Gefährliche Energieabhängigkeit. Erdgas: Was Deutschlands Industrie Droht, Wenn Russland Nicht Mehr Liefert. aktiv-online. 7 April 2022. Available online: https://www.aktiv-online.de/news/erdgas-was-deutschlands-industrie-droht-wenn-russland-nicht-mehr-liefert-16774 (accessed on 30 March 2025).
  21. Käckenhoff, T.; Eckert, V.; Steitz, C. As German Gas Rationing Looms, Industry Begs Exemptions. Reuters. 9 August 2022. Available online: https://www.reuters.com/business/energy/german-gas-rationing-looms-industry-begs-exemptions-2022-08-09/ (accessed on 30 March 2025).
  22. Noé, M. Multiaufsichtsrat Karl-Ludwig Kley “Gas erst bei den Privaten Abschalten, dann bei der Industrie“. Manager Magazin 5/2022. 27 April 2022. Available online: https://www.manager-magazin.de/unternehmen/industrie/karl-ludwig-kley-von-eon-und-lufthansa-ueber-gas-embargo-russland-und-handel-mit-china-a-2519cd38-0002-0001-0000-000201341036 (accessed on 30 March 2025).
  23. Roider, H. Gas: Empörung über Eon-Aussagen zum Gas-Vorrang. Energie & Management. 28 April 2022. Available online: https://www.energie-und-management.de/nachrichten/gas/detail/empoerung-ueber-eon-aussagen-zum-gas-vorrang-152812 (accessed on 30 March 2025).
  24. Schneider, J. Falls zu Wenig im Speicher ist-Wem Wird zuerst das Gas Abgestellt? zdfheute. 2 July 2022. Available online: https://www.zdf.de/nachrichten/politik/gas-versorgungsengpass-ukraine-krieg-russland-100.html (accessed on 22 December 2022).
  25. Dürr, F. Stromnetz am Anschlag: App warnt und ruft Baden-Württemberg zum Stromsparen auf. Stuttgarter Zeitung. 7 December 2022. Available online: https://www.stuttgarter-zeitung.de/inhalt.stromnetz-am-anschlag-app-warnt-und-ruft-baden-wuerttemberg-zum-stromsparen-auf.283685b8-3789-443c-b626-5da57cee3e22.html (accessed on 30 March 2025).
  26. Wissenschaftliche° Dienste. Dekarbonisierung und Sektorkopplung; Dokumentation WD 8-3000-064/18; Deutscher Bundestag: Berlin, Germany, 2018; p. 28. Available online: https://www.bundestag.de/resource/blob/565028/e7ff379935a919e8dd0d80b522b2352a/WD-8-064-18-pdf-data.pdf (accessed on 30 March 2025).
  27. Wissenschaftliche Dienste. Aktueller Begriff: Power to Gas; Nr. 10/12 (16. Mai 2012) Aktualisierte Fassung vom 11. Dezember 2012; Deutscher Bundestag: Berlin, Germany, 2012; p. 2. Available online: http://www.bundestag.de/blob/192428/c2cf809dd7287c6e8096c23caee03210/power_to_gas-data.pdf (accessed on 30 March 2025).
  28. Federal Ministry of Education and Research. How the Kopernikus Project P2X Converts Renewable Electricity into Plastics and Fuels, Gases and Heat. Available online: https://www.kopernikus-projekte.de/en/projects/p2x (accessed on 30 March 2025).
  29. Kasten, P.; Heinemann, C. Electricity-Based Fuels—The Future of PtX; Öko-Institut e.V.: Berlin, Germany, 2020; Available online: https://www.oeko.de/en/publications/electricity-based-fuels-the-future-of-ptx (accessed on 8 May 2025).
  30. NSW Government. Do I Get the Same Fuel Economy out of E10 as Regular Unleaded Petrol? E10 Facts. Available online: https://www.nsw.gov.au/driving-boating-and-transport/e10-fuel/e10-facts#toc-do-i-get-the-same-fuel-economy-out-of-e10-as-regular-unleaded-petrol (accessed on 30 March 2025).
  31. Statistisches Bundesamt (Destatis). Industrie, Verarbeitendes Gewerbe: Bedeutung der Energieintensiven Industriezweige in Deutschland. Available online: https://www.destatis.de/DE/Themen/Branchen-Unternehmen/Industrie-Verarbeitendes-Gewerbe/produktionsindex-energieintensive-branchen.html (accessed on 30 March 2025).
  32. Zajonz, M.; Wolff, K. Daten-Überblick: Vom Fossilen zum Ökostrom. ZDF. 21 December 2022. Available online: https://www.zdf.de/nachrichten/wirtschaft/erdgas-oekostrom-erneuerbare-energien-deutschland-daten-100.html (accessed on 26 December 2022).
  33. Stratmann, K.; Witsch, K. Stromlücke droht: Deutschland muss ab Sofort bis 2029 täglich Sechs neue Windräder Errichten. Handelsblatt. 28 December 2022. Available online: https://www.handelsblatt.com/unternehmen/energie/erneuerbare-energien-stromluecke-droht-deutschland-muss-ab-sofort-bis-2029-taeglich-sechs-neue-windraeder-errichten/28881822.html (accessed on 30 March 2025).
  34. dpa. Bundestag Beschließt mehr Tempo für Erneuerbare Energien. Handelsblatt. 3 March 2023. Available online: https://www.handelsblatt.com/politik/deutschland/energiewende-bundestag-beschliesst-mehr-tempo-fuer-erneuerbare-energien/29015988.html (accessed on 30 March 2025).
  35. dpa. Einzelhandel Beklagt Genehmigungsdauer für Solardächer und Ladesäulen. heise online. 20 January 2024. Available online: https://www.heise.de/news/Einzelhandel-beklagt-Genehmigungsdauer-fuer-Solardaecher-und-Ladesaeulen-9603742.html (accessed on 11 March 2024).
  36. dpa. Genehmigungen für Windräder stimmen Branche Optimistisch. Handelsblatt. 15 January 2025. Available online: https://www.handelsblatt.com/unternehmen/energie/erneuerbare-energien-genehmigungen-fuer-windraeder-stimmen-branche-optimistisch/100100900.html?utm_source=chatgpt.com (accessed on 30 March 2025).
  37. Witsch, B.F.K.; Hubik, F.; Wermke, I.; Müller, A.; Koenen, J. Immer mehr Konzerne Kappen Klimaziele–Was den Wandel Bremst. Handelsblatt. 12 June 2024. Available online: https://www.handelsblatt.com/unternehmen/energie/transformation-immer-mehr-konzerne-kappen-klimaziele-was-den-wandel-bremst-01/100040478.html (accessed on 30 March 2025).
  38. Müller, K. Es ist Schon viel Erreicht: Die Energiewirtschaft Steht bei der Transformation gut da. Handelsblatt Live. 31 January 2025. Available online: https://live.handelsblatt.com/es-ist-schon-viel-erreicht-die-energiewirtschaft-steht-bei-der-transformation-gut-da/ (accessed on 30 March 2025).
  39. Sprenger, T.; Schäfer, F. EWI-Analyse: Implikationen des Geplanten Zubaus Erneuerbarer Energien Gemäß Osterpaket und EEG 2023; Energiewirtschaftliches Institut an der Universität zu Köln (EWI) gGmbH: Köln, Germany, 2022; p. 14. Available online: https://www.ewi.uni-koeln.de/cms/wp-content/uploads/2022/12/221228_EWI-Analyse-Implikationen_Osterpaket_und_EEG_2023.pdf (accessed on 30 March 2025).
  40. Energie & Management. Dekarbonisierung bei BASF würde Strombedarf verdreifachen. Energie & Management. 4 November 2019. Available online: https://www.energie-und-management.de/nachrichten/handel/emission/detail/dekarbonisierung-bei-basf-wuerde-strombedarf-verdreifachen-133689 (accessed on 28 December 2022).
  41. Lenné, D. BASF-Chef zur Dekarbonisierung: Strombedarf Wird sich Vervierfachen. piqd. 13 December 2020. Available online: https://www.piqd.de/klimawandel/basf-chef-zur-dekarbonisierung-strombedarf-wird-sich-vervierfachen (accessed on 30 March 2025).
  42. Haupt, C. BASF Ermittelt CO2-Fußabdruck aller Verkausprodukte. BASF. 28 July 2020. Available online: https://www.basf.com/global/de/media/news-releases/2020/07/p-20-260.html (accessed on 30 March 2025).
  43. Joint News Release: Vattenfall and BASF Participate in Offshore wind Farm Tender Hollandse Kust West. BASF. 22 April 2022. Available online: https://www.basf.com/global/en/media/news-releases/2022/04/p-22-209.html (accessed on 30 March 2025).
  44. BASF. BASF, SABIC and Linde Start Construction of the World’s First Demonstration Plant for Large-Scale Electrically Heated Steam Cracker Furnaces. BASF News Release. 1 September 2022. Available online: https://www.basf.com/us/en/who-we-are/sustainability/whats-new/sustainability-news/2022/basf-sabic-and-linde-start-construction-of-the-worlds-first-demonstration-plant-for-large-scale-electrically-heated-steam-cracker-furnaces (accessed on 8 May 2025).
  45. Bignion, C.; Hülden, O. Die Herstellung von Stahl. Futura. 6 March 2021. Available online: https://www.futura-sciences.com/de/die-herstellung-von-stahl_1776/ (accessed on 30 March 2025).
  46. Wille, J. Wie Stahl grün Wird. Klimareporter. 18 November 2019. Available online: https://www.klimareporter.de/finanzen-wirtschaft/wie-stahl-gruen-wird (accessed on 30 March 2025).
  47. RWE and ArcelorMittal Intend to Jointly Build and Operate Offshore Wind Farms and Hydrogen Facilities, for Low-Emissions Steelmaking. Arcelor Mittal. 22 June 2022. Available online: https://corporate.arcelormittal.com/media/news-articles/rwe-and-arcelormittal-intend-to-jointly-build-and-operate-offshore-wind-farms-and-hydrogen-facilities-for-low-emissions-steelmaking-1 (accessed on 30 March 2025).
  48. Covestro and ENGIE Sign Supply Agreement for Green Power in Belgium. Covestro. 24 March 2021. Available online: https://www.covestro.com/investors/news/covestro-and-engie-sign-supply-agreement-for-green-power-in-belgium/ (accessed on 30 March 2025).
  49. Statkraft. Statkraft Supplies a Further 300 GWh of Green Power to Cement Manufacturer OPTERRA Since Beginning of April. Statkraft Newsroom. 20 April 2022. Available online: https://www.statkraft.com/newsroom/news-and-stories/2022/statkraft-supplies-Opterra-with-renewable-energy/ (accessed on 8 May 2025).
  50. Delanote, J.; de Souza Silva, F.N. EIB Investment Survey 2022: European Union Overview; European Investment Bank (EIB): Luxembourg, 2023. [Google Scholar] [CrossRef]
  51. Kindsmüller, A.; Werkle, G. Klimaschutz in Unternehmen im Rheinland. Ergebniszusammenfassung aus Einer Umfrage im März und April 2023; IHK Initiative Rheinland: Düsseldorf, Germany, 2023; Available online: https://www.ihk.de/blueprint/servlet/resource/blob/5898266/a517e5e761f8b8656b72d5ed63540d15/ihk-studie-klimaschutz-rheinland-data.pdf (accessed on 30 March 2025).
  52. Sailer, U. Klimaneutrale Unternehmen. Management, Steuerung, Technologien; Narr Francke Attempto Verlag: Tübingen, Germany, 2024; Volume 1134-2, p. 130. [Google Scholar]
  53. KfW Research. KfW-Klimabarometer 2024. KfW Bankengruppe. 26 November 2024. Available online: https://www.kfw.de/%C3%9Cber-die-KfW/Newsroom/Aktuelles/News-Details_830272.html (accessed on 30 March 2025).
  54. Climate Risks and Consequences of Climate Change 2023: Study on the Potential of German Industry and Solutions Based on Innovation and Changes to Portfolios; KPMG: Amstelveen, The Netherlands, 2023; Available online: https://hub.kpmg.de/en/climate-risks-and-consequences-of-climate-change-2023?utm_campaign=Klimastudie%20-%20sektor%C3%BCbergreifend (accessed on 30 March 2025).
  55. Wiertzema, H.; Svensson, E.; Harvey, S. Bottom–Up Assessment Framework for Electrification Options in Energy-Intensive Process Industries. Front. Energy Res. 2020, 8, 192. [Google Scholar] [CrossRef]
  56. Fleiter, T.; Rehfeldt, M.; Herbst, A.; Elsland, R.; Klingler, A.-L.; Manz, P.; Eidelloth, S. A methodology for bottom-up modelling of energy transitions in the industry sector: The FORECAST model. Energy Strategy Rev. 2018, 22, 237–254. [Google Scholar] [CrossRef]
  57. Neuwirth, M.; Fleiter, T.; Hofmann, R. Modelling the transformation of energy-intensive industries based on site-specific investment decisions. Sci. Rep. 2024, 14, 30552. [Google Scholar] [CrossRef] [PubMed]
  58. Flauger, J.; Knitterscheidt, K.; Witsch, K.; Stratmann, K. So gefährdet die Regierung mit falschen Prognosen Deutschlands Energiezukunft. Handelsblatt, 16 April 2021. Available online: https://www.handelsblatt.com/technik/thespark/die-oekostromluecke-so-gefaehrdet-die-regierung-mit-falschen-prognosen-deutschlands-energiezukunft/27093874.html?utm_source=chatgpt.com (accessed on 30 March 2025).
  59. Lichter, J. Der Aufbau der Wasserstoffwirtschaft in Deutschland. Herausforderungen und Lösungsansätze; Handelsblatt Research Institute: Düsseldorf, Germany, 2021; Available online: https://www.handelsblatt.com/downloads/27768652/3/wasserstoffstudie.pdf (accessed on 30 March 2025).
  60. Charly, A.; Caulfield, B. Transport emission modelling based on a bottom-up approach to facilitate sustainable transport planning. Sustain. Futures 2025, 9, 100435. [Google Scholar] [CrossRef]
  61. Buettner, S.M.; Schneider, C.; König, W.; Nulty, H.M.; Piccolroaz, C.; Sauer, A. How do German manufacturers react to the increasing societal pressure for decarbonisation? Appl. Sci. 2022, 12, 543. [Google Scholar] [CrossRef]
  62. EEP. Der Energieeffizienz-Index der Deutschen Industrie. Umfrageergebnisse 1. Halbjahr 2020; Institut für Energieeffizienz in der Produktion, Universität Stuttgart: Stuttgart, Germany, 2020; Available online: https://www.eep.uni-stuttgart.de/eei/archiv-aeltere-erhebungen/ (accessed on 30 March 2025).
  63. EEP. Der Energieeffizienz-Index der Deutschen Industrie. Umfrageergebnisse 2. Halbjahr 2020; Institut für Energieeffizienz in der Produktion, Universität Stuttgart: Stuttgart, Germany, 2020; Available online: https://www.eep.uni-stuttgart.de/eei/archiv-aeltere-erhebungen/ (accessed on 30 March 2025).
  64. European Commission. Commission Recommendation of 6 May 2003 Concerning the Definition of Micro, Small and Medium-Sized Enterprises (2003/361/EC). Off. J. Eur. Union 2003, L124, 36–41. Available online: https://eur-lex.europa.eu/legal-content/EN/TXT/?uri=CELEX%3A32003H0361 (accessed on 30 March 2025).
  65. Statistisches Bundesamt (Destatis). Unternehmen, Tätige Personen, Umsatz und Weitere Betriebs- und Volkswirtschaftliche Kennzahlen: Deutschland, Jahre, Unternehmensgröße, Wirtschaftszweige. Statistik für Kleine und Mittlere Unternehmen (48121-0002). Available online: https://www-genesis.destatis.de/genesis/online?operation=ergebnistabelleUmfang&levelindex=2&levelid=1653665551356&downloadname=48121-0002#abreadcrumb (accessed on 27 May 2022).
  66. UNECE. Building Resilient Energy Systems: Technical Considerations and Actions for Achieving Greater Energy Security, Affordability and Net-Zero in the ECE Region. United Nations Economic Commission for Europe. Committee on Sustainable Energy. 31st Session. CSE-31/2022/INF.2 rev 1. 2023. Available online: https://unece.org/sed/documents/2023/04/building-resilient-energy-systems-technical-considerations-and-actions (accessed on 30 March 2025).
  67. Buettner, S.M.; König, W.; Vierhub-Lorenz, F.; Gilles, M. What Motivates Companies to Take the Decision to Decarbonise? Preprints 2022, 2022100395. [Google Scholar] [CrossRef]
  68. Buettner, S.M.; König, W. Determining the ideal mix—(finding out) what range of measures is best for one’s business. In Proceedings of the ACEEE Summer Study, Digital, Washington, DC, USA, 13–15 July 2021; Available online: https://www.aceee.org/sites/default/files/pdfs/ssi21/panel-2/Buettner.pdf (accessed on 30 March 2025).
  69. Schneider, J. Negativpreis von Foodwatch: Goldener Windbeutel geht an Rewe-Produkt. ZDF, 14 December 2021. Available online: https://www.zdf.de/nachrichten/wirtschaft/goldener-windbeutel-2021-rewe-klimaneutral-100.html (accessed on 27 November 2022).
  70. From Ambition to impact: How Companies Are Reducing Emissions at Scale with Science-Based Targets; Science Based Targets: London, UK, 2020; Available online: https://sciencebasedtargets.org/resources/files/SBTiProgressReport2020.pdf (accessed on 30 March 2025).
  71. Umweltbundesamt (UBA). Indicator: Greenhouse Gas Emissions. Available online: https://www.umweltbundesamt.de/en/data/environmental-indicators/indicator-greenhouse-gas-emissions#at-a-glance (accessed on 30 March 2025).
  72. Umweltbundesamt (UBA). Entwicklung der Treibhausgasemissionen in Deutschland 2010–2019. Available online: https://www.umweltbundesamt.de/sites/default/files/medien/421/bilder/1_entwicklung_der_treibhausgasemissionen_in_deutschland_0.jpg (accessed on 23 August 2022).
  73. The Federal Government of Germany. Climate Action Programme 2030. Available online: https://www.bundesregierung.de/breg-en/issues/climate-action (accessed on 30 March 2025).
  74. Drosihn, D. Übersicht zur Entwicklung der Energiebedingten Emissionen und Brennstoffeinsätze in Deutschland 1990–2020; Umweltbundesamt: Dessau-Roßlau, Germany, 2022; p. 9. Available online: https://www.umweltbundesamt.de/publikationen/uebersicht-zur-entwicklung-der-energiebedingten (accessed on 30 March 2025).
  75. eon. Durchschnittliche Photovoltaik-Leistung & PV-Erträge in Deutschland. Available online: https://www.eon.de/de/pk/solar/kwp-bedeutung-umrechnung.html (accessed on 30 March 2025).
  76. Stiftung Unternehmen Wald. Wie viel Kohlendioxid (CO2) Speichert der Baum bzw. der Wald. Available online: https://www.wald.de/waldwissen/wie-viel-kohlendioxid-co2-speichert-der-wald-bzw-ein-baum/ (accessed on 30 March 2025).
  77. Hertwig, M.; Werner, A.; Buettner, S.M.; Klingler, A.-L.; Schnabel, F.; Hölzle, K.; Rietdorf, C.; Kiemel, S.; Ebongue, Y.E.; Sadjjadi-Ortlieb, B.V.; et al. Roadmap Klimaneutrale Produktion: Handreichungen für die Transformation zur klimaneutralen Produktion in Baden-Württemberg; Umwelttechnik Baden-Württemberg: Stuttgart, Germany, 2024; Available online: https://www.umwelttechnik-bw.de/de/klimaneutralitaet#roadmap-studie (accessed on 30 March 2025).
  78. Statistisches Bundesamt (Destatis). Energieverbrauch der Unternehmen im Verarbeitenden Gewerbe 2019: Deutschland, Jahre, Nutzung des Energieverbrauchs, Wirtschaftszweige, Energiequellen (GENESIS-Tabelle 43531-0001). Available online: https://www-genesis.destatis.de/genesis/online?operation=table&code=43531-0001 (accessed on 30 March 2025).
  79. Statistisches Bundesamt (Destatis). Treibhausgas-Emissionen 2019: Deutschland, Jahre, Emissionsquellen, Treibhausgasarten, Wirtschaftsbereiche (GENESIS-Tabelle 85111-0005). Available online: https://www-genesis.destatis.de/genesis/online?operation=table&code=85111-0005 (accessed on 30 March 2025).
  80. EEP. Der Energieeffizienz-Index der Deutschen Industrie. Umfrageergebnisse 2. Halbjahr 2024; Institut für Energieeffizienz in der Produktion, Universität Stuttgart: Stuttgart, Germany, 2024; Available online: https://www.eep.uni-stuttgart.de/eei/archiv-aeltere-erhebungen/ (accessed on 30 March 2025).
  81. UNFCCC. COP28 Agreement Signals “Beginning of the End” of the Fossil Fuel Era. 13 December 2023. Available online: https://unfccc.int/news/cop28-agreement-signals-beginning-of-the-end-of-the-fossil-fuel-era (accessed on 30 March 2025).
  82. UNECE. Advancing Energy Resilience and Decarbonization Across the ECE Region: Analysis of Macro-Level Status quo and Action Points for the Industrial Sector. ECE/ENERGY/GE.6/2023/5. United Nations Economic Commission for Europe. Group of Experts on Energy Efficiency. Tenth Session. 2023. Available online: https://unece.org/sed/documents/2023/10/working-documents/advancing-energy-resilience-and-decarbonization-across-ece (accessed on 12 February 2024).
  83. Buettner, S.M. How Can Climate Neutrality Be Achieved for Industry? A Multi-Perspective Analysis. Ph.D. Thesis, Eberhard-Karls-Universität Tübingen, Tübingen, Germany, 2023. [Google Scholar] [CrossRef]
Figure 4. GHG reduction target for 2025, broken down by measure option [in %].
Energies 18 02752 g004
Figure 5. GHG reduction target for 2025, broken down by measure option [in %], company size.
Energies 18 02752 g005
Table 1. Sample composition by company size (n2020/1 = 857, n2020/2 = 864).
Company SizeNumber of EmployeesRevenue in Million EURTotal Population (N)Observations (n)Percentage of Sample
2020/12020/22020/12020/2
Micro0–9≤2124,90411310713.2%12.4%
Small10–49>2 to ≤1052,28215419518.0%22.6%
Medium50–249>10 to ≤5015,28227926232.6%30.3%
Large>249>50530031130036.3%34.7%
Total 197,768857864100%100%
Table 2. Sample composition by energy intensity (n2020/1 = 653, n2020/2 = 676).
Energy Intensity ClassEnergy Intensity Interval
(in Wh/EUR)
ObservationsPercentage
2020/12020/22020/12020/2
Not energy-intensive0 to <1015114123.1%20.9%
Less energy-intensive10 to <10024324237.2%35.8%
Moderately energy-intensive100 to <100019821530.3%31.8%
Energy-intensive1000 to <10,00044696.7%10.2%
Very energy-intensive≥10,0001792.6%1.3%
Total 653676100.0%100.0%
Table 3. Sample composition by sector (n2020/1 = 856, n2020/2 = 861).
NACE
Code
SectorTotal
Population
(N)
Observations
(n)
Percentage
n (N)
2020/12020/22020/12020/2
05 **Mining of coal and lignite~84~~
06 **Extraction of crude petroleum and natural gas51311260.00%220.00%
08Other mining and quarrying143812130.83%0.90%
10Manufacture of food products26,89731270.12%0.10%
11Manufacture of beverages243519160.78%0.66%
12Manufacture of tobacco products628712.90%11.29%
13Manufacture of textiles463718190.39%0.41%
14Manufacture of worn apparel330614110.42%0.33%
15Manufacture of leather and related products137134322.48%2.33%
16Manufacture of wood and of products of wood and cork, except furniture; manufacture of articles of straw and plaiting materials12,94439490.30%0.38%
17Manufacture of paper and paper products155853363.40%2.31%
18Printing and reproduction of recorded media10,98624270.22%0.25%
19Manufacture of coke and refined petroleum products89131314.61%14.61%
20Manufacture of chemicals and chemical products328048521.46%1.58%
21Manufacture of basic pharmaceutical products and pharmaceutical preparations55426314.69%5.60%
22Manufacture of rubber and plastic products709064540.90%0.76%
23Manufacture of other non-metallic mineral products990844440.44%0.44%
24Manufacture of basic metals237442411.77%1.73%
25Manufacture of fabricated metal products, except machinery and equipment44,10664750.15%0.17%
26Manufacture of computer, electronic and optical products793521230.26%0.29%
27Manufacture of electrical equipment603666561.09%0.93%
28Manufacture of machinery and equipment n.e.c.15,96472740.45%0.46%
29Manufacture of motor vehicles, trailers and semi-trailers276949601.77%2.17%
30Manufacture of other transport equipment127615241.18%1.88%
31Manufacture of furniture10,82629240.27%0.22%
32Other manufacturing19,98530380.15%0.19%
Total197,8318568610.43%0.44%
** micro sector (N < 10) with at least 50% of N participating, ~ figures not disclosed in official statistics due to small sector size and associated confidentiality issues.
Table 4. GHG reduction ambitions 2025–2030 by company size, base 2019.
2019202520302025–2030n2025n2030
micro company016.8%25.1%8.2%7538
small company019.3%24.5%5.1%10580
medium-sized company022.0%28.4%6.4%196135
large company025.2%28.3%3.1%232162
Overall0%22.1%27.3%5.2%610415
Note: Cells in columns 2025 and 2030 are color-coded on a shared scale from red (lowest) to green (highest) to reflect ambition over time. Column “2025–2030” uses a separate color scale to highlight additional reductions planned in that interval. Bold values indicate the highest ambition per column and the overall average.
Table 5. GHG reduction ambitions 2025–2030 by energy intensity, base 2019.
2019202520302025–2030n2025n2030
not energy-intensive021.8%31.9%10.1%12267
less energy-intensive023.2%28.2%4.9%182126
moderately energy-intensive021.8%26.8%5.1%139106
energy-intensive024.3%26.4%2.2%3127
Overall0%22.1%27.3%5.2%610415
See note in Table 4 for explanation of color scale and formatting.
Table 6. GHG reduction ambitions 2025–2030 by sector (n ≥ 20), base 2019.
2019202520302025–2030n2025n2030
27—Manufacture of electrical equipment019.8%23.0%3.2%3522
17—Manufacture of paper and paper products023.6%23.3%−0.3%3621
20—Manufacture of chemicals and chemical products024.3%24.1%−0.2%3826
28—Manufacture of machinery and equipment020.7%25.4%4.7%5637
23—Manufacture of non-metallic mineral products021.7%26.1%4.4%3320
25—Manufacture of fabricated metal products023.0%26.4%3.4%4437
24—Manufacture of basic metals027.2%28.7%1.5%3220
06—Extraction of crude oil and natural gas022.5%32.5%10.0%88
29—Manufacture of motor vehicles and (semi-)trailers023.9%32.5%8.6%3929
22—Manufacture of rubber and plastic products018.9%36.6%17.7%4525
Overall0%22.1%27.3%5.2%610415
See note in Table 4 for explanation of color scale and formatting.
Table 7. Converting industry targets from 2019 to 1990 base year.
CO2 Equivalents (in Million Tonnes)1990201920252030
Absolute and Policy Target Emissions for Industry284187 140
Absolute if measures are implemented as planned 146136
Absolute savings of planned measures+970−41−51
%-change compared to 201952%0−22.1%−27.3%
%-change compared to 19900−34%−49%−52%
Political Target (overall) −65%
Table 8. Impact estimation of 2025 saving targets.
Measurein %in Mio t CO2-eq.in TWhca. Equivalent to
Energy Efficiency5.4%10.2~75
Self-generation of renewable energies4.7%8.8~65380 km2 photovoltaic
Reduction of process-related emissions3.2%6.0
Purchase of renewable energy5.3%9.9~739700 wind turbines
Compensation3.4%6.3 10,000 km2 forest
Other0.1%0.0
Estimated total GHG savings Industry22.1%41~138/~75
Table 9. Heatmap highlighting the weight of individual industry sectors as a proportion of the overall German industry, by energy consumption and emissions [base 2019].
German Manufacturing Industry [in 2019]Energy
Consumption [78]
Total GHG
Emissions [79]
CO2 emissions
(Energy-Related)
CO2 Emissions
(Process-Related)
The individual sectors’ weight [in %]
of the total manufacturing industry
in %in %in %in %
05/06/08—Mining and quarrying1.88%3.56%4.45%0.13%
10/11/12—Production of food, beverages and tobacco6.26%4.86%5.67%0.05%
13/14/15—Textiles, clothing, leather and leather goods0.46%0.65%0.78%0.00%
16—Products of Wood and Corks2.34%4.30%5.50%0.00%
17—Manufacture of paper and paper products6.73%6.28%8.05%0.01%
18—Printing and reproduction of recorded media0.41%0.27%0.27%0.26%
19—Manufacture of coke and refined petroleum products10.08%13.86%16.68%4.36%
20—Manufacture of chemicals and chemical products28.73%14.66%14.98%11.96%
21—Manufacture of pharmaceutical products0.61%0.38%0.48%0.01%
22—Manufacture of rubber and plastic products2.23%1.03%1.28%0.12%
23—Manufacture of non-metallic mineral products7.46%16.92%10.22%42.98%
24—Metal production and processing/Basic Metals22.39%26.87%24.00%39.15%
25—Manufacture of fabricated metal products2.35%1.32%1.51%0.50%
26—Manufacture of computer, electronic and optical products0.75%0.34%0.30%0.11%
27—Manufacture of electrical equipment0.71%0.33%0.35%0.02%
28—Manufacture of machinery and equipment1.96%0.93%1.17%0.04%
29—Manufacture of motor vehicles and (semi-)trailers3.77%2.43%3.07%0.10%
30—Manufacture of other transport equipment0.32%0.17%0.20%0.05%
31/32—Manufacture of furniture and other goods0.56%0.85%1.04%0.14%
Total100%100%100%100%
Aggregated weight of the 11 core industries (highlighted bold above)78.70%75.11%70.18%94.89%
Note: Color gradient (blue to red) visualizes relative sector weights within each column (lowest to highest). Bold indicates the 11 “core industries” with the highest economic relevance in Germany. Italic marks sector aggregates where individual data points were not available.
Disclaimer/Publisher’s Note: The statements, opinions and data contained in all publications are solely those of the individual author(s) and contributor(s) and not of MDPI and/or the editor(s). MDPI and/or the editor(s) disclaim responsibility for any injury to people or property resulting from any ideas, methods, instructions or products referred to in the content.

