Abstract
A new type of power system with a high proportion of renewable energy sources (RES) penetration has become a global development trend. Meanwhile, the marketization reforms of the electricity market pose challenges to traditional energy. A multi-energy model including a wind turbine (WT), photovoltaic (PV) energy, energy storage (ES), and a thermal power system is proposed in this paper, participating in a joint market mechanism for energy and frequency regulation ancillary services. Unlike existing joint markets, this paper considers the market coupling clearing of various energy sources and the uncertainty of RES generation. Specially, a mechanism for the participation of storage and thermal power units in the frequency regulation ancillary service market is designed. Finally, a practical 118-node case study is provided to validate the impact of renewable generation uncertainty on the participation of multi-energy coupled systems in joint and single energy markets. Compared to the single electricity energy market, the simulation results show that the model can reduce the impact of RES uncertainty on ES generation and increase the cleared electricity quantity of thermal power units by 16%. Moreover, the model also increases the market revenue of thermal power units and storage by 30% and 44%, respectively.
1. Introduction
1.1. Motivation
As the concept of building an environmentally friendly power system has gained widespread recognition globally, governments around the world continue to introduce new policies to promote the development of RES [1], achieving significant progress [2]. The growth trend of renewable energy (RE) is gradually replacing the role of traditional fossil fuel power plants (FFPs), and the proportion of RES in energy supply is increasing [3].
To reduce carbon emissions produced by FFP, many countries and regions have implemented or strengthened carbon trading systems [4], compelling FFPs to bear the corresponding carbon emission costs. This also means that traditional power markets, which are highly dependent on FFPs, are facing new operational challenges. Furthermore, considering the intermittency and unpredictability of RES generation [5], the demand for frequency regulation services in power systems has also increased. However, with the rapid development of energy storage technology, these issues have been effectively alleviated [6]. Energy storage systems can not only meet the needs of power systems for frequency regulation but can also help balance the uncertainty of RES generation, ensuring the continuity and stability of power supply.
1.2. Literature Review
The uncertainty of RES generation poses significant risks to the operation of power systems. Currently, the probabilistic scenario method is often used to model the uncertainty of RES. Li et al. [7] uses probability distribution functions to describe the uncertainty of WT and PV outputs. In [8], the authors used a scenario generation method to model the uncertain resource behavior in a microgrid multi-objective planning problem. Ali et al. [9] use the normal distribution function and the Weibull probability distribution function to model the uncertainty of PV and WT output, respectively. Yang et al. [10] proposes a model to calculate the WT output probability interval based on WT forecast results to evaluate the reliability of the power system.
Nowadays, a lot of research on solving the uncertainty of RES output has led to the improvement of control methods. Chhipa et al. [11] and Djebbri et al. [12] use artificial intelligence for optimization techniques for MPPT control and supervisory strategies based on fractional order model reference adaptive control (FO-MRAC) design for controlling power transmission in multi-source renewable energy systems, respectively. These similar studies, although able to handle RES uncertainty outputs well, are to be further explored for effective methods in participating in the electricity market. To smooth the uncertainty of WT and PV outputs, an effective method is to incorporate other energy generation. To smooth the uncertainty of WT and PV outputs, an effective method is to incorporate other energy generation methods. In [13], a joint system composed of WT, PV, and ES was developed to study the revenue impact of storage coupled with different renewable energies in the day-ahead market. The proposed methodology results reveal that the average yearly net revenue of the hybrid PV–wind–storage power plant can increase by 4% compared to the standalone operation of the wind and solar PV power plants. To mitigate the adverse effects of WT output power and electricity price volatility on WT profitability in the power market, Yang et al. [14] propose a mechanism for WT to participate in the spot electricity market bidding system with the help of shared storage facilities, which makes the net income increase by CYN 32,194 and CYN 14,526, respectively. Bashir et al. [15] considers the uncertainty of RES energy and the electric load of microgrids, proposing a stochastic method for a microgrid including WT, PV, and ES to participate in the power market, enhancing system flexibility. At 100% penalty, an optimal capacity of 12 kWh produces more than 80% of the optimal revenue or a 60% increase compared to no batteries. Couto et al. [16] proposes a method for the temporal–spatial complementation of WT and PV energy to reduce the overall variability and extreme values of the power system’s net load. The above literature explores the mechanisms of multi-energy coupling participation in the power market from different perspectives. However, few studies comprehensively consider the coupling of thermal power, WT and PV output uncertainty, and ES scheduling in market participation.
Currently, more and more power generators, in addition to participating in the above-mentioned energy markets for profit, are beginning to focus on transactions in auxiliary service markets [17,18]. Li et al. [19] propose a method to optimize peak modulation and frequency regulation in auxiliary service markets by dynamically dividing independent ES zones. Using a two-level nested optimization quadratic power allocation method, grid-side independent ES begins to generate profits by participating in auxiliary service markets and relieving grid stress. Wang et al. [20] presents a dual-layer optimization joint model for energy and primary frequency regulation markets, where the upper layer considers battery degradation to maximize ES profits and the lower layer simulates the joint market clearing process. Compared with the energy-only market, the joint optimization of the energy storage system can significantly increase its operating profit by 26.5%. Khjasteh et al. [21] proposes an energy constraint model and throughput concept, establishing an ES scheduling model and ES lifecycle model in the joint energy and auxiliary service markets, causing it to be possible to increase 25% of usage lifetime by a 3.75% reduction. In [22], considering primary and secondary frequency service constraints, an optimal linear scheduling model for synchronous generators and ES methods participating in the joint energy and auxiliary service markets is proposed, resulting in an increase in battery capacity accounts by 4.68% of the total system capacity, while the total frequency reserve and total cost in the system decrease by 13.21% and 2.96%, respectively. Zhang et al. [23] establishes a dual-layer market transaction decision model for ES stations participating in the joint energy and frequency regulation auxiliary service markets to achieve optimal revenue for ES stations. The above studies establish transaction mechanism models for different power generators to participate in energy and auxiliary services, especially frequency regulation auxiliary service markets. However, the subjects studied are mostly ES stations, and there is no comprehensive consideration of the market model under the joint participation of multiple power generators in both energy and frequency markets. In summary, a comparison between the literature and the ideas in this paper is done, as shown in Table 1.

Table 1.
The comparison between references and this paper.
1.3. Contributions
This paper aims to address the issues by establishing a WT–PV–thermal–ES multi-energy coupling participation market mechanism. The proposed scheme will further explore the participation of multi-energy coupling in energy and frequency markets and the impact of RES generation uncertainty. The contributions of this paper are as follows:
- (1)
- The scenario reduction method is used to handle the uncertainty of WT and PV output. The interval optimization method is used to study the impact of RES handling uncertainty on market clearing.
- (2)
- A model of joint market clearing involving WT, PV, thermal power, and ES is proposed. Previous research mostly only considered the coupling of two to three energy outputs participating in the market.
- (3)
- The paper studies the bidding and revenue situation of multi-energy coupling bodies in the joint clearing of energy and frequency regulation auxiliary service markets.
The rest of this paper is organized as follows. In Section 2, the market framework is described, and the RES uncertainty model is established. Then, the model of WT–PV–thermal–ES participation in the joint clearing of energy and frequency regulation auxiliary services markets is introduced in Section 3. In Section 4, an analysis is conducted through examples. Finally, in Section 5, conclusions and future works are presented.
2. Problem Description
2.1. The Structure of Proposed Market
Given that the majority of bidding activities in the electricity spot market usually take place in the day-ahead market, this paper focuses on the day-ahead market environment [24]. Electricity, as a commodity, not only includes the quantity of energy but also its quality. Therefore, the types of transactions in the electricity market are mainly divided into two categories: energy services and auxiliary services. The quality of electric power is affected by factors such as fault recovery speed, voltage stability, and frequency stability. To address the shortage of contracted electricity and changes in short-term load demands, market participants bid for energy services in the energy market. In the auxiliary services market, such as the frequency regulation market, participants bid for frequency regulation services to ensure the quality of electric power. When these two types of electric power transactions occur simultaneously, they have an interdependent relationship [25]. Therefore, establishing a comprehensive bidding and settlement model is essential.
The market model established in this paper is shown in Figure 1. The energy entities participating in the market include WT units, PV units, thermal power units, and ES. These energy entities transmit electricity to the grid and participate in the spot market for information transmission. After the market clearing is completed at the power trading center, a safety check with the grid is conducted.
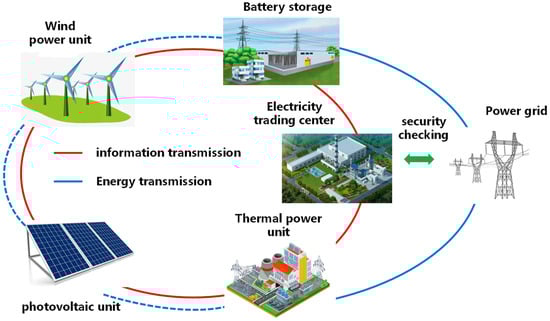
Figure 1.
Framework of WT–PV–thermal–ES participation in the joint market.
2.2. Uncertainty Modeling for RES Generation
The uncertainty in the output of WT is primarily due to the inherent intermittency of wind speed. Previous research has shown that wind speed follows a Weibull distribution [26,27], and the wind speed distribution formula is as follows:
where represents the scale parameter, reflecting the average wind speed of the wind farm. denotes the shape parameter. signifies the given wind speed (m/s).
The relationship between wind speed and forecasted power output for WT is as follows:
where represents the rated output power of the turbine. represents the forecasted output power of the turbine. represents the cut-in wind speed. represents the cut-out wind speed.
The output of PV mainly depends on the solar irradiance and the settings of the photovoltaic panels. Assuming the solar radiation for the PV system is known, the actual electrical power output of the PV system can be calculated as follows:
where represents the forecasted power output from solar energy. represents the solar radiation intensity (W/m2). denotes the standard state sunlight intensity, set at 1000 W/m2. represents the conversion efficiency of the PV modules. represents the installation azimuth of the PV modules. signifies the efficiency of the PV inverter. represents the PV line correction factor.
Assume a set of N random variables for to where the sample size is set at M. The sampling strategy adopted in this paper is Latin hypercube sampling [28], where the midpoint is deliberately chosen as the sample value from the possible range of each variable, and the m sample value of is
When dealing with systems involving multiple variables, the sample matrix generated by the aforementioned method neglects the inter-correlations among the random variables, possibly reducing the accuracy of the sampling results. Therefore, this paper uses Cholesky decomposition to optimize the order of the elements of the sample matrix to obtain the scenario set.
For each period’s generated scenarios , since the generated scenarios follow a normal distribution, some scenarios that do not conform to the power generation rules, such as scenarios with a power output less than zero, will be generated. Thus, to identify representative scenarios, it is necessary to further reduce the aforementioned generated scenarios as follows, and the framework is shown in Figure 2.
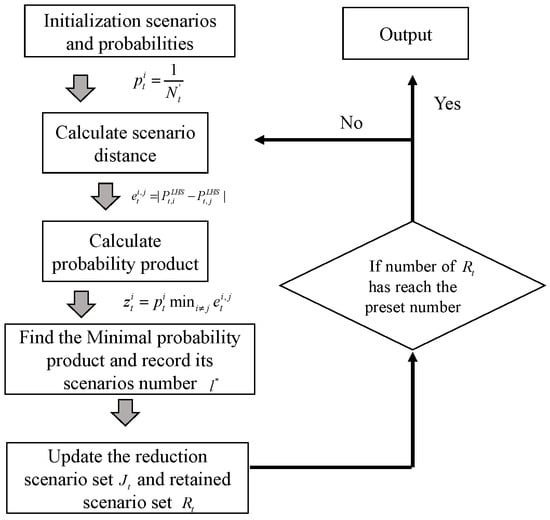
Figure 2.
Framework of scenarios reduction.
- (1)
- Initialize, set the final target number of scenarios . For the initial scenarios , each with equal probability,Set the initial reduction scenario as and the initial retained scenario as ; both sets record the scenario numbers for reduction and retention.
- (2)
- Calculate the distance between any two scenarios and in , where ; the calculation formula is as follows:
- (3)
- For any scenario , there will be a scenario with the minimum distance to it; calculate the probability product using the following formula:
- (4)
- Among the scenarios , find the smallest and record its scenario number as follows:
- (5)
- Update the reduction scenario set and the retained scenario set .
- (6)
- Determine whether the number in set has reached the preset number . If so, stop the reduction and record the optimal representative scenarios; otherwise, continue with step (2).
The final scenario reduction results in 5 sets of WT and PV output scenarios, as shown in Figure 3 and Figure 4, respectively.
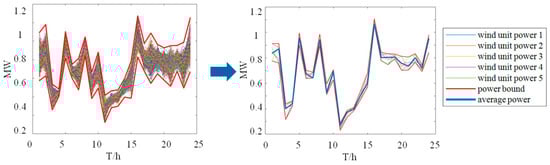
Figure 3.
Uncertain scenarios generation and reduction in WT.
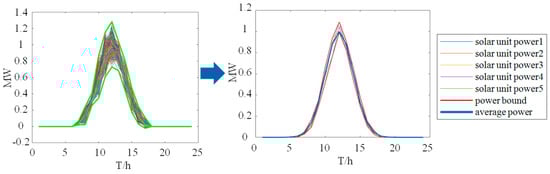
Figure 4.
Uncertain scenarios generation and reduction in PV.
2.3. Model Assumptions and Methodological Limitations
- (1)
- Model assumptions
- Probability distribution of scenery output: it is assumed that scenery output follows a normal probability distribution to simplify the computational process and to enable the generation of a representative set of scenarios by random sampling or parsing methods.
- Harmonization of parameter distributions: for each wind and PV generation site, it is assumed that their output characteristics are described by a fixed set of statistical parameters (e.g., mean, variance). These parameters are estimated based on historical data, but are not dynamically adjusted for seasons, weather, or other external factors.
- Perfect information assumption: in the market clearing process, all participants are assumed to have perfect forecast information, i.e., they know all scenarios of wind and light output. However, in reality, forecasts are always subject to errors, so this assumption is not entirely realistic.
- (2)
- Methodological limitations
- Limited representativeness: although the main patterns of scenario output can be captured through scenario generation, it is not possible to exhaust all possibilities due to the limitations of computational resources and technical means. As a result, the final set of selected scenarios can only provide an approximate description and may miss some extreme but important cases.
- Neglecting correlation: to simplify the modeling, we usually assume that the wind and solar outputs between individual generation nodes are independent of each other. In reality, geographic proximity or similar meteorological conditions are often correlated, and this simplification may lead to an underestimation of system risk.
3. The Joint Market Clearing Model of Multi-Energy
In this section, the joint clearing of the energy and frequency regulation ancillary service market with multi-energy participation is modeled. First, a model of joint WT–PV–ES and thermal power unit participation in the clearing of the electric energy market, which is common in the current market, is constructed. Subsequently, the scenario of RES output uncertainty is further considered. Finally, the method of thermal power and storage participation in the frequency regulation ancillary service market is added, and the joint participation mechanism is constructed.
3.1. Objective Function for the Joint Market
The proposed model is optimized to minimize the generation costs in a joint market, which includes the generation costs of thermal power units and ES in the energy and frequency regulation auxiliary service markets, startup and shutdown costs of thermal power units, and penalties for discarded WT and PV power. The objective function is as shown in (10)–(15).
3.2. Constraints for Multi-Energy Participation in the Energy Market
For RES output, the upper and lower limit after scenario reduction is used as the maximum value of output prediction, respectively. On the one hand, scenario cuts can reduce the number of scenarios to be considered while preserving data characteristics. By generating the most representative scenarios and then taking the bounds, it accelerates the speed of market clearing calculation. On the other hand, by generating as many scenarios as possible for reduction, it has better robustness to RES output uncertainty in market coupling clearing. The constraints for multi-energy participation in energy markets are shown in (16)–(30).
- (1)
- Thermal power unit constraints: constraint (16) states thermal unit declared capacity constraints. The upper and lower limits of unit output constraints are shown in (17). The ramp rate constraints for thermal units are shown in (18). The constraints of startup and shutdown for units are shown in (19)–(22).
- (2)
- RES constraints: the upper and lower limits on charging and discharging power for ES are shown in (23) and (24).
- (3)
- ES constraints: constraint (25) states the charging and discharging state constraint. Constraints (26) and (27) state the ES capacity constraint. Constraints (28) and (29) state the WT and PV power output constraints. The system balance constraint is shown in (30).
3.3. Constraints for Multi-Energy Participation in the Frequency Regulation Ancillary Service Market
Constraints for thermal power units and ES in frequency regulation ancillary services market, as indicated in (31)–(36), include frequency regulation capacity and mileage constraints.
Besides the above constraints, the proposed model in this paper also needs to meet the following power flow constraints:
where denotes the line flow between nodes m and n. denotes the flow transmission limit between nodes m and n. represents the reactance between nodes m and n. and represent the phase angles at nodes m and n at time t, respectively.
4. Results and Discussion
4.1. Parameter Setting
This paper employs a 39-node system to analyze the proposed model. Moreover, this paper refers to the parameter settings of 118 nodes in reference [29] and applies them to the case study of this paper. The system base power is set at 100 MVA, which includes 10 thermal power units. The generation bids for these units range from 200 RMB/MWh to 500 RMB/MWh, and the minimum start–stop duration is set at 2 h. Additional parameter settings are shown in Table 2. Moreover, the system incorporates four ES devices, each with a capacity of 60 MW. The maximum charging and discharging power of these ES units is 20 MW/h, with charging bids at 150 RMB/MWh and discharging bids at 500 RMB/MWh; other parameter settings are detailed in Table 3. Regarding renewable energy generation, two WT and two PV units are installed, with WT located at nodes 2 and 8 and PV at nodes 20 and 22, respectively. As for the curtailment penalty model for wind and solar, the penalty coefficient is set at 1000 RMB/MW.
Table 2.
The parameters of thermal units in energy market.
Table 3.
The parameters of ES in energy market.
For parameters in the frequency regulation auxiliary service market, the mileage bids for the 10 thermal power units are uniformly priced at 18 RMB/MW, with capacity bids set at 12 RMB/MW; further parameter settings can be found in Table 4. Regarding the ES devices, the frequency regulation capacity ratio for the four units is set at 0.5; additional parameters are detailed in Table 5. The setup for wind and solar remains unchanged from previous descriptions.
Table 4.
The parameters of thermal unit in frequency regulation ancillary service market.
Table 5.
The parameters of ES in frequency regulation ancillary service market.
4.2. Analysis of Market Clearing Results
4.2.1. Analysis of Joint Market Clearing Results
Figure 5 and Figure 6 illustrate the clearing results for WT, PV, thermal, and ES in the joint market. It can be seen that in the electric energy market, thermal units and RES dominate almost the entire market winning bids. In this case, the system power balance is maintained by adjusting the thermal unit output cleared power. Particularly, WT and PV in RES have the cleared power varying with the power output due to nearly zero cost output. However, in the frequency regulation auxiliary service market, ES accounts for almost all of the cleared power due to its fast response characteristics.
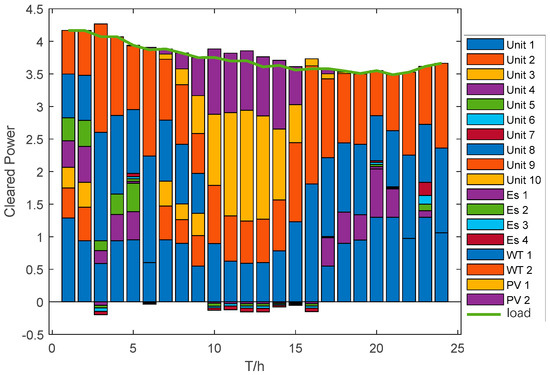
Figure 5.
Clearing results of energy market.
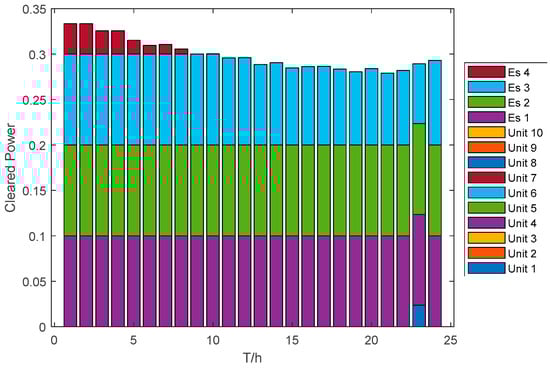
Figure 6.
Clearing results of frequency regulation ancillary service market.
Figure 7 highlights the minimal participation of thermal units in frequency market competition, primarily providing auxiliary service at 23:00. Their activity in the energy market inversely correlates with wind and solar output fluctuations. During the peak solar output hours from 9:00 to 15:00, thermal units withdraw from market bids, allowing for the exclusive absorption of renewable energies.
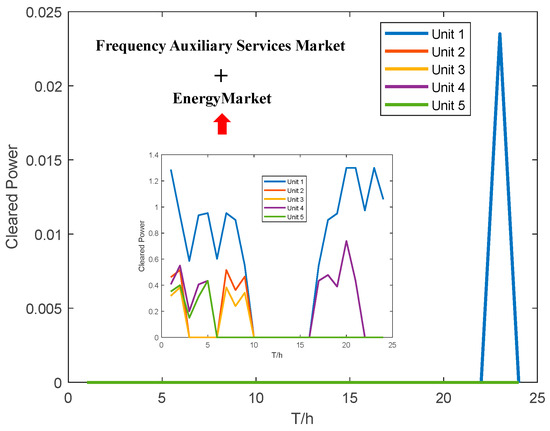
Figure 7.
Cleared power of the thermal units in the joint market.
Figure 8 details the ES units’ bids in the joint market, which participate more actively in the frequency regulation market due to their rapid response capabilities, avoiding costs associated with the startup and shutdown of thermal units and securing higher profits.
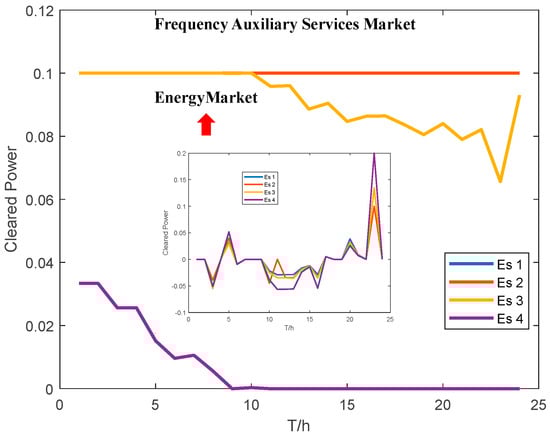
Figure 8.
Cleared power of ES in the joint market.
4.2.2. Clearing Price Comparisons at Different Scenarios
Considering the uncertainty of wind and solar outputs, four scenarios are established, with scenarios ranging from both minimum and maximum outputs to the individual extremes of each. Node prices in both the joint and the single energy markets under these scenarios are depicted in Figure 9a,b. Scenario 3 shows similar prices across the board, in which the red line is the change in the same node of the clearing price, while the orange line is the change in some nodes of the clearing price. In other scenarios, capacity reallocated to the frequency regulation market results in higher peak clearing prices due to the higher capacity units stepping in. Figure 10 shows that the auxiliary market prices are lower in Scenario 3 due to less participation in the energy market, whereas in other scenarios, competitive pressures later drive up the prices.
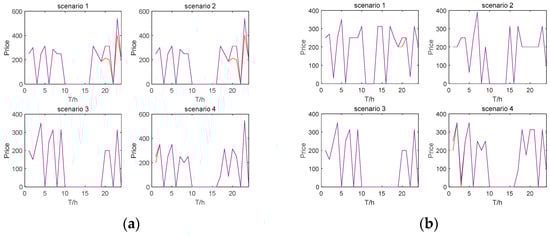
Figure 9.
(a) Clearing price in joint market at different scenarios; (b) Clearing price in single energy market for different scenarios.
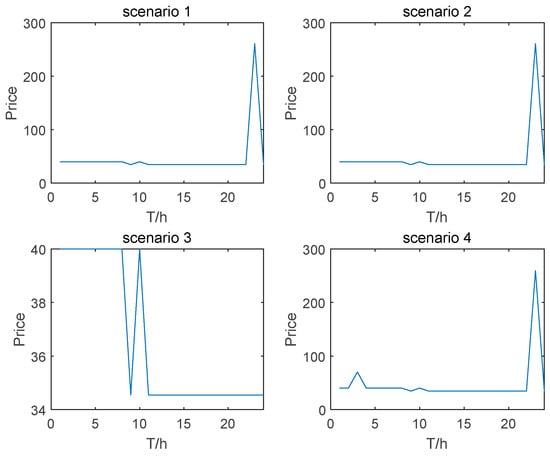
Figure 10.
Clearing price of frequency regulation ancillary service market for different scenarios.
4.2.3. Comparison of Bidding Results at Different Scenarios
Figure 11 shows the clearing amounts of ES in both the joint market’s energy segment and the single energy market. It is observed that compared to the joint market, the ES clearing power in the single market is more susceptible to wind and solar outputs, displaying greater volatility. Thus, it is inferred that the joint market can mitigate the impacts of uncertainty in wind and solar outputs on ES performance. Figure 12 displays the clearing power of ES in the frequency regulation auxiliary service market under various scenarios. It is evident that ES experiences greater volatility in scenarios with lower wind outputs (Scenarios 1 and 2), with a minimum output of 26.6 MW compared to 27.9 MW in Scenarios 3 and 4. Thus, ES is more suitable for bidding when wind power variability is lower.
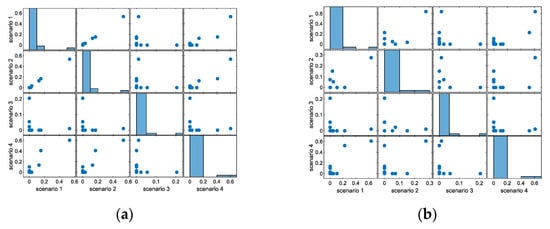
Figure 11.
(a) Cleared power of ES for joint market for different scenarios; (b) Cleared power of ES for single energy market for different scenarios.
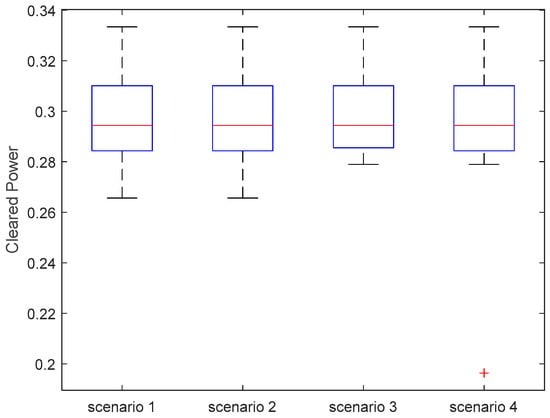
Figure 12.
Cleared power of ES in frequency regulation ancillary service market for different scenarios.
Figure 13a,b depict the clearing power of thermal units in both the joint and single energy markets. In Scenario 2, compared to the maximum clearing power of 244 MW in the single market, the thermal units reach 283 MW in the joint market, an increase of 16%. Therefore, by joining the joint market and allowing ES to capitalize on its rapid response capabilities in the frequency regulation market, higher profits are made possible for traditional thermal units.
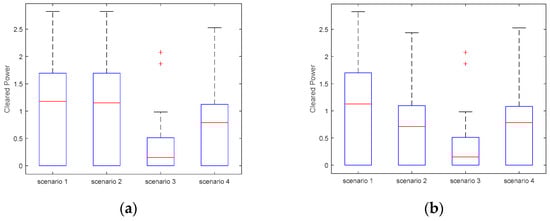
Figure 13.
(a) Cleared power of thermal unit for joint market for different scenarios; (b) Cleared power of thermal unit for single energy market for different scenarios.
4.2.4. Comparison of Profit Results at Different Scenarios
Figure 14a,b compare the utilization rates of wind and solar in both the joint and single energy markets under different scenarios. Calculations show that the average utilization rates for WT and PV in the joint market are 0.96 and 0.73, respectively. In the single energy market, these rates are 0.94 and 0.75. Compared to the single market, the joint market enhances the utilization of WTs while slightly reducing the utilization of PVs. According to the price analysis, the inclusion of frequency regulation services introduces peak pricing in the energy market. Coupled energy systems seeking larger profits must increase their output at peak times, which leads to incompatibility with concentrated ES output during midday.
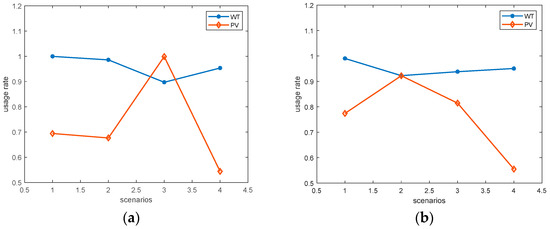
Figure 14.
(a) RES usage rate for joint market for different scenarios; (b) RES usage rate for single energy market for different scenarios.
Further calculations of the profits for ES and thermal units in the joint and single energy markets are shown in Figure 14 and Table 6. The addition of the frequency regulation services market significantly increased ES’s profits, with the average profit in multiple scenarios increasing from USD 52,321 to USD 92,653, an average increase of 44%. Moreover, both minimum and maximum profits have increased. This indicates that the ES profit is enhanced with the addition of the joint market. As ES started to compete in the frequency regulation market, this also provided market space for thermal units in the energy market, which led to an increase in their average profit from USD 24,098 to USD 34,559, an increase of 30%. But its maximum and minimum profits did not change significantly. This indicates that the inclusion of the joint market is raising the average value of the thermal unit’s profit. Therefore, compared with the single energy market, the joint market model provides more profit opportunities for market participants as more power generation entities and market mechanisms join in the power market reform.
Table 6.
Comparison of generation profit in joint market and single energy market.
5. Conclusions
Especially under the uncertainty of RES generation, how to utilize these mechanisms to benefit the participating multi-generating entities poses a challenge. Therefore, this paper proposes a joint operation model of a multi-energy system participating in both energy and frequency regulation markets considering RES uncertainties. Firstly, the RES output uncertainty scenarios are obtained with scenario reduction, followed by designing a model for the joint clearing of WT, PV, thermal, and ES in both energy and frequency regulation markets. Further analysis based on RES uncertainty examines its impact on market clearing in both the joint and single energy markets. Finally, the effectiveness of the proposed method compared to the single energy market is verified through case studies, providing support for multi-energy participation in the market.
The main limitation of the current proposed methodology is the single consideration of the participation of multi-type unit declaration strategies in both types of markets. However, it does not consider the impact of how factors such as FM control are taken into account in FM, and therefore, further improvements are needed to apply it in practice. Based on the method proposed in this paper, future considerations will involve more types of generating entities and the design of market clearing mechanisms under the participation of more market mechanisms.
Author Contributions
Conceptualization, W.H.; Validation, W.H.; Formal analysis, Y.L.; Investigation, M.Z.; Data curation, Y.L., T.W. and M.Z.; Writing—original draft, W.H.; Writing—review & editing, Y.L. All authors have read and agreed to the published version of the manuscript.
Funding
This research was funded by the National Natural Science Foundation of China under Grant 52407080 and by Scientific Research Fund of Hunan Provincial Education Department Grant. 22C0587. The APC was funded by Scientific Research Fund of Hunan Provincial Education Department Grant 21B0864.
Data Availability Statement
The original contributions presented in this study are included in the article. Further inquiries can be directed to the corresponding author.
Conflicts of Interest
Author Tao Wang was employed by the company Power China Zhongnan Engineering Co., Ltd. The remaining authors declare that the research was conducted in the absence of any commercial or financial relationships that could be construed as a potential conflict of interest.
References
- Jałowiec, T.; Wojtaszek, H. Analysis of the RES Potential in Accordance with the Energy Policy of the European Union. Energies 2021, 14, 6030. [Google Scholar] [CrossRef]
- Marneris, I.G.; Ntomaris, A.V.; Biskas, P.N.; Baslis, C.G.; Chatzigiannis, D.I.; Demoulias, C.S.; Oureilidis, K.O.; Bakirtzis, A.G. Optimal participation of RES aggregators in energy and ancillary services markets. IEEE Trans. Ind. Appl. 2022, 59, 232–243. [Google Scholar] [CrossRef]
- Alexopoulos, D.K.; Anastasiadis, A.G.; Vokas, G.A.; Kaminaris, S.D.; Psomopoulos, C.S. A review of flexibility options for high RES penetration in power systems—Focusing the Greek case. Energy Rep. 2021, 7, 33–50. [Google Scholar] [CrossRef]
- Wang, R.; Wen, X.; Wang, X.; Fu, Y.; Zhang, Y. Low carbon optimal operation of integrated energy system based on carbon capture technology, LCA carbon emissions and ladder-type carbon trading. Appl. Energy 2022, 311, 118664. [Google Scholar] [CrossRef]
- Soares, T.; Carvalho, L.; Morais, H.; Bessa, R.J.; Abreu, T.; Lambert, E. Reactive power provision by the DSO to the TSO considering renewable energy sources uncertainty. Sustain. Energy Grids Netw. 2020, 22, 100333. [Google Scholar] [CrossRef]
- Wang, W.; Yuan, B.; Sun, Q.; Wennersten, R. Application of energy storage in integrated energy systems—A solution to fluctuation and uncertainty of renewable energy. J. Energy Storage 2022, 52, 104812. [Google Scholar] [CrossRef]
- Li, Y.; Yang, Z.; Li, G.; Zhao, D.; Tian, W. Optimal scheduling of an isolated microgrid with battery storage considering load and renewable generation uncertainties. IEEE Trans. Ind. Electron. 2018, 66, 1565–1575. [Google Scholar] [CrossRef]
- Chen, X.; Dong, W.; Yang, Q. Robust optimal capacity planning of grid-connected microgrid considering energy management under multi-dimensional uncertainties. Appl. Energy 2022, 323, 119642. [Google Scholar] [CrossRef]
- Ali, M.; Abdulgalil, M.A.; Habiballah, I.; Khalid, M. Optimal scheduling of isolated microgrids with hybrid renewables and energy storage systems considering demand response. IEEE Access 2023, 11, 80266–80273. [Google Scholar] [CrossRef]
- Yang, X.; Yang, Y.; Liu, Y.; Deng, Z. A reliability assessment approach for electric power systems considering wind power uncertainty. IEEE Access 2020, 8, 12467–12478. [Google Scholar] [CrossRef]
- Chhipa, A.A.; Vyas, S.; Kumar, V.; Joshi, R.R. MPPT optimisation techniques and power electronics for renewable energy systems: Wind and solar energy systems. Int. J. Swarm Intell. 2022, 7, 141–167. [Google Scholar] [CrossRef]
- Djebbri, S.; Ladaci, S.; Metatla, A.; Balaska, H. Fractional-order model reference adaptive control of a multi-source renewable energy system with coupled DC/DC converters power compensation. Energy Syst. 2020, 11, 315–355. [Google Scholar] [CrossRef]
- Gomes, J.G.; Jiang, J.; Chong, C.T.; Telhada, J.; Zhang, X.; Sammarchi, S.; Wang, S.; Li, J. Hybrid solar PV-wind-battery system bidding optimisation: A case study for the Iberian and Italian liberalised electricity markets. Energy 2023, 263, 126043. [Google Scholar] [CrossRef]
- Yang, X.; Fan, L.; Li, X.; Meng, L. Day-ahead and real-time market bidding and scheduling strategy for wind power participation based on shared energy storage. Electr. Power Syst. Res. 2023, 214, 108903. [Google Scholar] [CrossRef]
- Bashir, N.; Irwin, D.; Shenoy, P. A probabilistic approach to committing solar energy in day-ahead electricity markets. Sustain. Comput. Inform. Syst. 2021, 29, 100477. [Google Scholar] [CrossRef]
- Couto, A.; Estanqueiro, A. Exploring wind and solar PV generation complementarity to meet electricity demand. Energies 2020, 13, 4132. [Google Scholar] [CrossRef]
- Li, K.; Wei, L.; Fang, J.; Ai, X.; Cui, S.; Zhu, M.; Wen, J. Incentive-compatible primary frequency response ancillary service market mechanism for incorporating diverse frequency support resources. Energy 2024, 306, 132339. [Google Scholar] [CrossRef]
- Matamala, C.; Badesa, L.; Moreno, R.; Strbac, G. Cost allocation for inertia and frequency response ancillary services. IEEE Trans. Energy Mark. Policy Regul. 2024, 2, 328–338. [Google Scholar] [CrossRef]
- Li, J.; Zhang, J.; Mu, G.; Li, C.; Yan, G.; Zhu, X.; Jia, C. Dynamic partitioning method for independent energy storage zones participating in peak modulation and frequency modulation under the auxiliary service market. Appl. Energy 2024, 361, 122922. [Google Scholar] [CrossRef]
- Wang, X.; Ying, L.; Wen, K.; Lu, S. Bi-level non-convex joint optimization model of energy storage in energy and primary frequency regulation markets. Int. J. Electr. Power Energy Syst. 2022, 134, 107408. [Google Scholar] [CrossRef]
- Khojasteh, M.; Faria, P.; Vale, Z. Energy-constrained model for scheduling of battery storage systems in joint energy and ancillary service markets based on the energy throughput concept. Int. J. Electr. Power Energy Syst. 2021, 133, 107213. [Google Scholar] [CrossRef]
- Khojasteh, M.; Faria, P.; Vale, Z. Scheduling of battery energy storages in the joint energy and reserve markets based on the static frequency of power system. J. Energy Storage 2022, 49, 104115. [Google Scholar] [CrossRef]
- Zhang, G.; Wang, D.; Bo, W.; Liu, Z.; Zhao, Y.; Guo, R.; Shi, J. Trading Strategy of Energy Storage Power Station Participating in the Joint Electric Energy and Frequency Modulation Ancillary Service Market. In International Conference on Power and Electrical Engineering; Springer Nature: Singapore, 2023; pp. 317–327. [Google Scholar]
- Gea-Bermúdez, J.; Das, K.; Koduvere, H.; Koivisto, M.J. Day-ahead market modelling of large-scale highly-renewable multi-energy systems: Analysis of the north sea region towards 2050. Energies 2020, 14, 88. [Google Scholar] [CrossRef]
- Cheng, X.; Lin, J.; Liu, F.; Qiu, Y.; Song, Y.; Li, J.; Wu, S. A coordinated frequency regulation and bidding method for wind-electrolysis joint systems participating within ancillary services markets. IEEE Trans. Sustain. Energy 2022, 14, 1370–1384. [Google Scholar] [CrossRef]
- Xia, S.; Luo, X.; Chan, K.W.; Zhou, M.; Li, G. Probabilistic transient stability constrained optimal power flow for power systems with multiple correlated uncertain wind generations. IEEE Trans. Sustain. Energy 2016, 7, 1133–1144. [Google Scholar] [CrossRef]
- Wang, M.Q.; Gooi, H.B. Spinning reserve estimation in microgrids. IEEE Trans. Power Syst. 2011, 26, 1164–1174. [Google Scholar] [CrossRef]
- Bourcet, J.; Kubilay, A.; Derome, D.; Carmeliet, J. Representative meteorological data for long-term wind-driven rain obtained from Latin Hypercube Sampling–Application to impact analysis of climate change. Build. Environ. 2023, 228, 109875. [Google Scholar] [CrossRef]
- IIT Index of Data [EB/OL]. [2020-06-10]. Available online: http://motor.ece.iit.edu/Data (accessed on 10 April 2024).
Disclaimer/Publisher’s Note: The statements, opinions and data contained in all publications are solely those of the individual author(s) and contributor(s) and not of MDPI and/or the editor(s). MDPI and/or the editor(s) disclaim responsibility for any injury to people or property resulting from any ideas, methods, instructions or products referred to in the content. |
© 2024 by the authors. Licensee MDPI, Basel, Switzerland. This article is an open access article distributed under the terms and conditions of the Creative Commons Attribution (CC BY) license (https://creativecommons.org/licenses/by/4.0/).