Abstract
A fuel injector plays a crucial role in an internal combustion engine, and the occurrence of cavitation inside the injector may affect the engine’s spray, atomization, and combustion efficiency. In this study, a micro-turbojet engine equipped with a micro-orifice fuel injector was developed that operated under low injection pressure (Pinj), that is, at a low Reynolds number (Re). Given the paucity of cavitation studies conducted under such conditions, the current study experimentally and numerically investigated the cavitation and spray characteristics of water and kerosene in a micro-orifice injector with a diameter of 0.3 mm. The results indicated that the water and kerosene exhibited no cavitation, cavitation, supercavitation, and hydraulic flip. However, the discharged jet was unaffected by internal flows, and the jet angles remained nearly constant, indicating that the cavitation in micro-orifice injectors at a low Re is less important than that at a high Re. Because cavitation in micro-orifice injectors under a low Re has no positive effects on the atomization and spray, determining the geometry of a micro-injector is essential. The injector with a length-to-diameter (L/D) ratio of 3 exhibited an approximately 25% higher discharge coefficient (Cd) than those of injectors with L/D ratios of 6 and 8 and, thus, is recommended for injectors in micro-turbojet engines.
1. Introduction
Fuel injectors play crucial roles in liquid fuel spray combustion applications, such as liquid rocket engines, gas turbines, and diesel engines. Numerous studies on liquid fuel injectors [1,2,3,4,5] have revealed that their internal flow characteristics, especially their cavitation characteristics, strongly affect the external spray and atomization of the discharged jet. As the fluid passes through the vena-contract area of a nozzle injector, the dynamic pressure increases and the static pressure decreases. If the static pressure is lower than the vapor pressure of the liquid, bubbles form in the fluid; this phenomenon is called cavitation. Supercavitation represents the most intense form of cavitating flow, with the entire nozzle area potentially being filled with bubbles. When these bubbles reach the outlet, the downstream ambient air flows into the nozzle, resulting in a phenomenon called hydraulic flip. Sou et al. [6] visualized the cavitation characteristics of a liquid jet by using an acrylic nozzle under various conditions. They showed that the cavitation in this nozzle could be classified into four regimes, namely, no cavitation, developing cavitation, supercavitation, and hydraulic flip. Cavitation can have beneficial and adverse effects [1,2]. It can promote primary jet breakup and fuel atomization, thereby improving combustion efficiency and reducing the amounts of pollutants caused by the jet process. However, cavitation can also reduce the fuel mass flow and combustion efficiency. Moreover, it can cause material erosion and even injector failure [7].
Cavitation is affected by aspects such as the length-to-diameter (L/D) ratio of the injector nozzle [8,9], the injector’s geometry [10,11,12,13,14,15], ambient pressure [16,17,18], and the properties of the fuel [19,20,21]. Many researchers have experimentally investigated these effects. For example, Ro et al. [9] determined the effects of the L/D ratio on the cavitating flow inside a nozzle orifice and the spray angle. Their results indicated that when the L/D ratio was increased, the discharge coefficient increased. In the hydraulic flip region, decreased because of a reduction in the exit section area. Moreover, the spray angle was affected by the cavitation number and Reynolds number. Kiaoulias et al. [10] evaluated the effects of the orifice inlet geometry on the injector pressure drop and jet breakup length. Their results indicated that adopting a larger orifice diameter resulted in a smaller pressure drop across the injector. Although the sharp-edged orifice inlet geometry exhibited a large pressure drop and a considerable jet breakup length at a small L/D ratio, the chamfered orifice inlet geometry was not considerably influenced by the L/D ratio at smaller orifices and exhibited greater jet breakup lengths at larger orifices. Prasetya et al. [18] investigated the effects of ambient pressure on cavitation and the spray angle. Their results showed that an increase in the ambient pressure hindered cavitation and increased the spray angle. The modified cavitation number can be used to quantitatively evaluate the onset and development of cavitation, and the jet spray angle can be predicted using their proposed correlations. He et al. [21] visualized the cavitating flow and spray characteristics of five blended fuels. Their results indicated that the addition of gasoline to diesel fuel increased the overall spray angle and spray fluctuations. As the injection volume was increased, the injection rate curve was initially flat and then became steep; this phenomenon was related to cavitation at the vortex line in the nozzle. Pratama et al. [22] investigated the internal flow of a gasoline-direct-injection injector and visualized the injector’s near-nozzle spray. Their results indicated that a thinner hydraulic flip led to a higher discharge coefficient; a lower turbulence intensity, which resulted in marginally worse atomization; a marginally narrower spray angle; and a more uniform spray velocity distribution.
Because of increases in the processing power of computers and the reliability of numerical models, numerical simulation has become a feasible method for investigating flow phenomena. Cavitating flow is a complex, turbulent, and multiphase flow. Appropriate numerical models are required to accurately predict these complex phenomena. Direct numerical simulation (DNS) is suitable for investigating cavitation phenomena at small turbulence scales. However, because of its high computational demands, it is only suitable for simulations of relatively small fluid fields and relatively small numbers of bubbles. Therefore, the Reynolds-averaged Navier–Stokes approach has been widely adopted with appropriate numerical models for simulating cavitation phenomena. Jia et al. [23] simulated the cavitating flow in a nozzle by using multiphase mixture and full cavitation models. Their results indicated that cavitation evolution affected the liquid sheet’s thickness, the spray velocity at the nozzle outlet, the spray angle, and the Sauter mean diameter of droplets. In the supercavitation regime, the extension of cavitation to the nozzle outlet can improve fuel atomization. Sadegharani et al. [24] investigated the effects of the injection pressure and nozzle L/D ratio on the fluid velocity distribution and cavitation behavior during diesel atomization. As the L/D ratio was increased, the cavitation number, wall friction, and flow resistance increased, whereas the discharge coefficient, spray velocity, spray angle, and spray velocity at the nozzle exit decreased. A nozzle with a smaller L/D ratio resulted in a wider spray area and finer droplets. Biçer and Sou [25] modified the simplified Rayleigh–Plesset equation by considering critical pressure and examined the applicability of the modified equation to turbulent cavitating flows in a fuel injector nozzle. Their model exhibited a strong ability to simulate turbulent recirculation flow, re-entrant jets, and cloud cavitation shedding. Ghorbani et al. [26] studied the effect of upstream pressure on cavitating flows inside a microchannel and the resulting spray structures. Their results indicated that an increase in the number of cavitation bubbles led to a decrease in the discharge coefficient. Mithun et al. [27] proposed a compressible three-phase cavitation model for simulating the effect of in-nozzle cavitation on liquid atomization. Their simulation results exhibited good agreement with their experimental data, and their model could predict details that were not readily observable in the experiments. Simpson and Ranade [13] studied the effects of orifice geometry parameters on cavitation behaviors. Of the investigated geometry parameters, orifice thickness had the strongest effects on the initiation and extent of cavitation. They found that the pressure ratio required to initiate cavitation varied by a factor of 10 over various L/D ratios. They also discovered that a sharp-edged inlet was more likely to trigger cavitation than a round-edged inlet, leading to erosion at the orifice inlet. Cristofaro et al. [28] simulated a cavitating flow in a micro-throttle flow channel. Their model applies a pressure-based compressible solver to the filtered Navier–Stokes equations, and the rates of evaporation and condensation are calculated using the simplified Rayleigh–Plesset equation. The aforementioned model successfully predicted the effects of liquid viscosity on the mass flow, velocity profile, vapor cavity distribution, and pressure peaks. Urazmetov et al. [29] investigated two high-pressure water jet nozzles and estimated the relationships between the nozzle geometry and flow pattern, as well as the wall shear stress. An increase in the inlet pressure resulted in an increase in the maximum wall shear stress. The nozzle edge strongly influenced the maximum wall shear and cavitation. Bambhania and Patel [30] evaluated the accuracy of different turbulence, cavitation, and multiphase models for describing cavitating flow. Their evaluation indicated that, of the investigated models, the k–ω shear stress transport (SST) turbulence model with the Zwart–Gerber–Belamri (ZGB) cavitation model and volume-of-fluid (VOF) multiphase model exhibited the lowest error. The aforementioned authors also investigated the effects of the pressure difference and nozzle geometry on cavitation. The discharge coefficient was discovered to decrease after the initiation of cavitation and reach a minimum value at supercavitation. Pietrykowski and Karpiński [31] analyzed the process of hydrodynamic cavitation with water flowing through an orifice. They discovered that the cavitation zone and volume fraction of the gas phase reached their maxima at an orifice diameter of 2 mm. They also observed that a linear change in diameter yielded the largest volume fraction of the gas phase per power unit. Li et al. [32] developed a modified cavitation model to investigate the cavitating flow characteristics of orifice plates under high-pressure conditions. Their results indicated that their model has a high potential for use in the prediction of the cavitation characteristics of throttling devices, such as nuclear power safety valves and aircraft engine nozzles.
Micro-turbojet engines have been widely used in various applications, such as unmanned aerial vehicles, cruise missiles, and emergency power generation with small power generation systems. In most currently available micro-turbojet engines, fuel is primarily vaporized using vaporizer sticks, which have many drawbacks, including providing an unbalanced fuel supply, incomplete vaporization, and nonuniform temperature distribution [33]. In the current study, a micro-turbojet engine with a combustor equipped with a micro-orifice fuel injector was developed. For such an engine, the diameter of the fuel injector (D) should be small, and the pressure of the fuel injector () should be low (i.e., a low Re number). The majority of relevant studies have investigated the cavitation and spray characteristics of micro-orifice injectors under high-pressure conditions and large-orifice injectors under low-pressure conditions. Under such conditions, Re is usually large (exceeding 10,000), and the flow is turbulent. In this operating environment, cavitation may enhance liquid breakup at the nozzle exit and increase the spray angle, which is useful for spraying. In the present study, an engine was developed with a D of 0.3 mm, a of up to 1 MPa, and a combustor pressure (back pressure, ) of up to 0.3 MPa. The resulting ranged from 1590 to 4800 for kerosene fuel and from 3000 to 9500 for water; these values are considerably smaller than those reported in the majority of relevant studies. In addition, the flows that were observed were transitional to turbulent. Few studies have analyzed the characteristics of cavitation and spray at a low . In addition, because of the limitations of electrical discharge machining in practical fabrication, micro-orifice injectors typically form round-edged inlets and taper angles. Therefore, in this study, the simultaneous effects of L/D ratios, taper angles, and micro-injectors with round-edged inlets on the characteristics of cavitation and spray were investigated.
The present study experimentally and numerically investigated the cavitation and spray characteristics of water and kerosene fuel flowing through micro-orifice injectors under low-pressure conditions. Numerical simulations were conducted using ANSYS Fluent 2020 R2 commercial computational fluid dynamics software.
The rest of this paper is organized as follows. In Section 2, the experimental setup of a micro-orifice injector is described. In Section 3, a numerical model is outlined. In Section 4, the experimental results are discussed and compared with the numerical results to assess the reliability of the proposed numerical model. The numerical results for kerosene fuel and water are also discussed. In Section 5, suggestions for the design of micro-turbojet engines are outlined.
2. Experimental Setup
The experimental setup employed in this research is illustrated in Figure 1. This setup was used to investigate the cavitation characteristics of water flowing through micro-orifice injectors, and the experimental results were used to validate the developed numerical model. A water tank pressurized with nitrogen gas was used to supply water to an injector. An ultrasonic flowmeter (Bronkhorst ES-113I, Ruurlo, The Netherlands), installed between the water tank and the injector, measured the fluid velocity to calculate the water flow rate, with the measurement uncertainty being 0.8%. It measures the average velocity along the path of an emitted ultrasound beam by averaging the difference in the measured transit time between the pulses of ultrasound propagating into and against the direction of flow. The water jet from the injector was then sprayed vertically downward into a collection tank pressurized with nitrogen gas. The injection pressure from the water tank and back pressure inside the collection tank were measured using a pressure transducer (TSMC P51-10barS, Taiwan), with the measurement uncertainty being 0.5%. was adjusted from 0.2 to 1.0 MPa, and was adjusted from 0.1 to 0.3 MPa. The pressure transducer was equipped with a strain gauge to measure the force acting on it. This strain gauge underwent deformation, and this deformation resulted in a variation in voltage. Pressure measurements were conducted on the basis of the degree of variation detected in the voltage. The signals emitted by the pressure transducer and flowmeter were collected and analyzed using a data-acquisition system (NI USB-6363, Hungary) with a resolution of 16 bits and a maximum sampling rate of 2 MS/s. Pressure sensors with a measurement range of 0–10 barg were used, with a corresponding output voltage of 1–5 V. The ultrasonic flowmeter exhibited a measurement range of 0–1500 mL/min, with a corresponding output voltage of 0–10 V. These measured values, which corresponded to respective output analog signals, were linear. Consequently, pressure (P) was calculated as , where is the output voltage of the pressure transducer. In addition, the flow rate was calculated as , where is the output voltage from the ultrasonic flowmeter. The total uncertainty observed in the measured volume flow rate primarily originated from the uncertainty of the ultrasonic flowmeter and pressure transducer, which was estimated to be 0.94% [34].
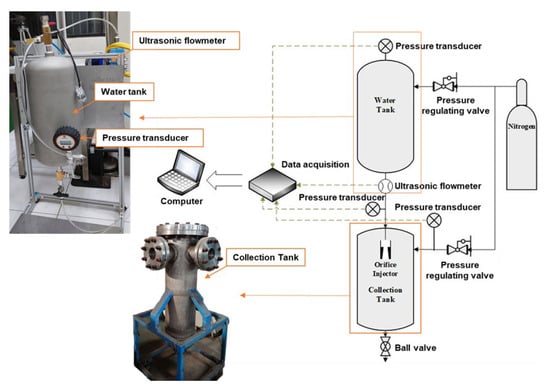
Figure 1.
A schematic of the experimental setup.
Three micro-orifice injectors with L/D ratios of 3, 6, and 8 were fabricated; they had a diameter of 0.3 mm and lengths of 0.9, 1.8, and 2.4 mm, respectively. These injectors were fabricated through electrical discharge machining, and their geometries were inspected using an electron microscope. Because of the limitation of this type of machining [35,36], the injector with an L/D ratio of 3 had a slightly round-edged inlet, and the inner diameters of the injectors were not constant (Figure 2); the taper angles were 0.26°, 0.4°, and 0.62° for L/D ratios of 3, 6, and 8, respectively.
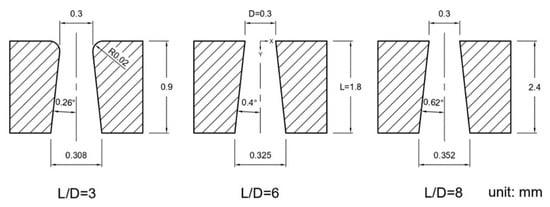
Figure 2.
A schematic of the three test injectors.
Four dimensionless parameters, namely, the discharge coefficient , cavitation number , Reynolds number , and Ohnesorge number , were used to examine the characteristics of cavitation and hydraulic flip.
The value of was calculated as follows:
where Q, , , and are the actual (measured) volume flow rate through the injector, the cross-sectional area of the injector, the density of the fluid, and the pressure difference between and , respectively.
The value of was calculated as follows:
where is the vapor pressure of the working fluid.
The value of was calculated as follows:
where and are the velocity and viscosity of the fluid, respectively.
The value of , which relates viscous to surface tension forces, was calculated as follows:
where is the surface tension of the working fluid.
Table 1 and Table 2 list the experimental conditions and properties, respectively, of the working fluids used in this study. The kerosene fuel comprised 95% kerosene and 5% lubricating oil.

Table 1.
Experimental conditions.
Table 2.
Properties of working fluids.
3. Numerical Model
The investigated fluids were water and kerosene fuel. The numerical computation domain was based on the experimental setup employed in this study so that the numerical results could be compared with the experimental results to determine the reliability of the developed numerical model.
In the numerical model, the ZGB equation was adopted with a transition SST turbulent model to simulate the cavitation and jet characteristics of fluids moving through micro-orifice injectors under low injection pressure. This turbulent model is based on the combination of SST k-ω transport equations with two other transport equations: one for intermittency and one for transition onset criteria. In this study, a transition SST turbulent model was implemented because the flow field involved transition flow. Previous studies on micro-injectors have also implemented transition SST turbulent models. For example, Qiu et al. [37] implemented a transition SST model, and Jin et al. [38] implemented a K-Omega SST model.
The current study examined how , , the L/D ratio, and Re affect the cavitation and spray characteristics of water and kerosene fuel in micro-injectors. The fluids were assumed to be ideal, and the nondissolvable gas effect was not considered. A ZGB cavitation model encompassing the surface tension and saturated vapor pressure of the liquid was used for calculation. According to Bambhania et al. [30] and Kumar et al. [39], ZGB cavitation models can accurately predict cavitation under the assumption of an ideal fluid.
3.1. Assumptions and Computational Domain
The fluid flow was assumed to be a multiphase incompressible turbulent flow. The primary phase was continuous air (for kerosene fuel) or nitrogen (for water) with constant density and viscosity. The operating fluid and cavitation bubbles were regarded as dispersed secondary phases. The cavitation bubbles were assumed to all have the same diameters, and cavitation was assumed to not affect the flow temperature. A schematic of the two-dimensional computation domain is displayed in Figure 3. The operating fluid entered the injector inlet from the top with a uniform flow and was sprayed out vertically from the injector outlet. Investigations were performed for three micro-orifice injectors with L/D ratios of 3, 6, and 8. The diameter of the injector inlet was 0.3 mm, and the diameters of the injector outlet were marginally different from 0.3 mm because of the taper angle; the outlet diameters were 0.308, 0.325, and 0.352 mm for L/D ratios of 3, 6, and 8, respectively (Figure 2). The upstream and downstream from the injector inlet and outlet were 5 and 2 mm, respectively.
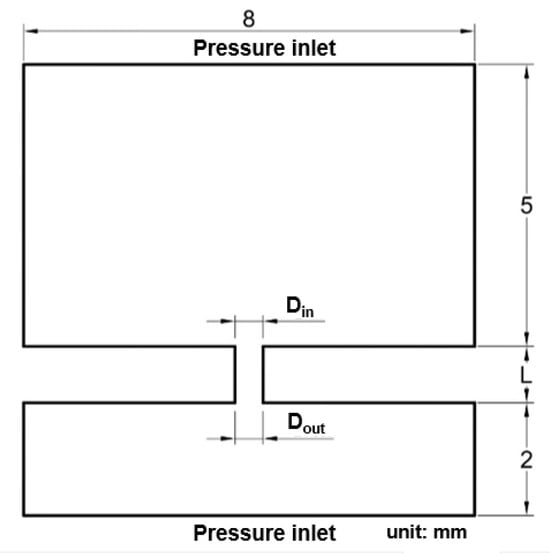
Figure 3.
A schematic of the two-dimensional computational domain.
3.2. Governing Equation
The mixture model was adopted in this study to simulate a multiphase mixture. The continuity equation for a flow mixture is expressed as follows:
where and are the density and mass-averaged velocity of the mixture, respectively. These parameters are, respectively, expressed as follows:
where , , and are the volume fraction, density, and velocity of phase k, respectively, and n is the total number of phases. The momentum equation for a flow mixture can be expressed as follows:
where is the body force, is the viscosity of the mixture, and is the drift velocity for the second phase (phase k) of the mixture. The term is expressed as follows:
The energy conservation equation for a mixture is as follows:
where is the enthalpy of species j in phase k, is the diffusive flux of species j in phase k, and is the effective conductivity. The effective conductivity is expressed as follows:
where is the turbulent thermal conductivity obtained from the adopted turbulence model. The ZGB equation [40] was used in this study to determine whether cavitation occurs. In addition, the liquid–vapor mass transfer and bubble dynamics must be considered when cavitation occurs. Under cavitation, mass transfer is governed by the vapor transport equation, which is given as follows:
where is the vapor volume fraction, is the vapor density, is the vapor-phase velocity, and and are mass transfer source terms associated with the growth and collapse of vapor bubbles, respectively. The bubble dynamics equation is as follows:
where is the bubble radius and is assumed to be 10 – 6 m, is the liquid surface tension coefficient, is the liquid density, is the liquid kinematic viscosity, and and are the bubble surface pressure and local far-field pressure, respectively. According to the ZGB model, when the local far-field pressure is less than the saturated steam pressure, the following equation is valid:
Otherwise, the following equation is valid:
where is the volume fraction of nucleation sites and is assumed to be 5 × 10⁻⁴, is the evaporation coefficient and is assumed to be 50, and is the condensation coefficient and is assumed to be 0.01.
3.3. Turbulence Model
The transition SST turbulence model provided by FLUENT was employed in this study. The transport equation for this model is as follows:
The transition sources and are defined as follows:
where S is the strain rate, is an empirical correlation that controls the length of the transition region, and , , and are constants. The mass fraction can be calculated as follows:
The relative velocity is defined as the velocity of the secondary phase p relative to the primary phase q and can be calculated as follows:
The relation between the drift velocity and relative velocity can be expressed as follows:
For additional details regarding the derivation of these equations and the units of the variables, please refer to the ANSYS Fluent Theory Guide [41].
3.4. Boundary and Initial Conditions
Regarding the boundary conditions, the top and bottom sides of the computation domain were set as the pressure inlet and outlet, respectively, and the other boundaries were set to be nonslip walls (Figure 3). Initially, the computation domains above and below the injector outlet were filled with water and air (or nitrogen), respectively.
The second-order upwind scheme was used to solve the momentum equation and turbulent kinetic energy, the QUICK scheme was used to determine the volume fraction, and the PISO algorithm was used for pressure–velocity coupling. The residuals for the relevant equations had to be less than 10−3.
3.5. Numerical Calculation Validation
As presented in Figure 4, triangular unstructured grids were applied to the fluid domain. The mesh located on the flow channel of the micro-orifice injector, wall, and micro-orifice injector exit was refined. A grid independence test was conducted to ensure that the grid number did not artificially affect the computational results. Five meshes with different numbers of grids were tested, that is, meshes with 0.5 million, 0.84 million, 1.2 million, 1.7 million, and 6.8 million grids. Figure 5 depicts the volumetric flow rate of the injector at an L/D ratio of 3 and a Pback value of 0.15 MPa with hydraulic flip for various grid numbers. The left longitudinal coordinate represents the volumetric flow rate, whereas the right longitudinal coordinate represents the relative error of the numerical results to the experimental value. The relative errors were determined to be 10.41%, 0.55%, 0.45%, 0.32%, and 0.25% for the meshes with 0.5 million, 0.84 million, 1.2 million, 1.7 million, and 2.7 million grids, respectively. The relative errors for the various grid numbers were not significantly different, except for the mesh with 0.5 million grids; therefore, a mesh with 0.84 million grids was adopted in all subsequent simulations.
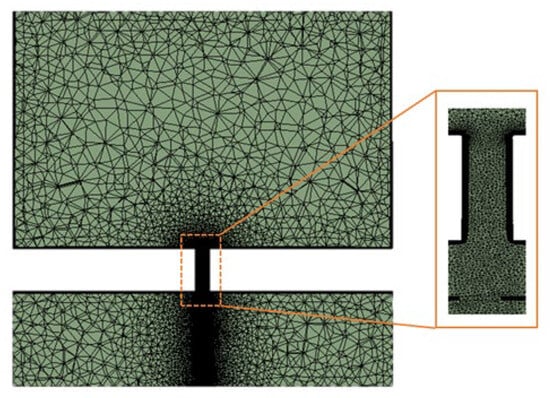
Figure 4.
Computational domain mesh.
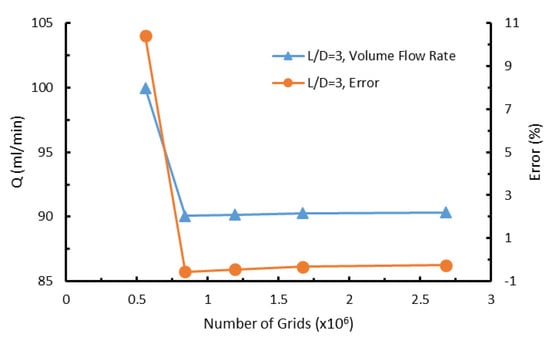
Figure 5.
Grid-independent validation.
4. Results and Discussion
4.1. Model Validation
Generally, the flow rate under various pressures can be verified using Cd and the pressure required for hydraulic flip. The value of Cd can be obtained as follows: [2], where Cc is the contraction coefficient, and k is the cavitation number. Therefore, the magnitude of Cd reflects the degree of area reduction in the flow field in the tube due to cavitation. When the upstream pressure is large enough, hydraulic flip occurs after the cavitation length reaches the nozzle length, and Cd sharply drops. Hence, a comparison of numerical results to the experimental pressure that induces hydraulic flip enables the determination of whether the cavitation length predicted by a numerical model is the same as the experimental result. Ebrahimi et al. [42] and Casoli et al. [43] numerically calculated upstream and downstream pressure differences and flow rates and compared their results to experimental values to verify the numerical models.
In this study, the developed numerical model was verified by comparing the predicted water volume flow rate and predicted hydraulic flip occurrence with the experimental results obtained for L/D values of 3, 6, and 8. The ZGB equation and transition SST turbulence model were applied, and the numbers of grids for L/D values of 3, 6, and 8 were 838,000, 723,000, and 780,000, respectively. Figure 6 illustrates the relationship between and when was 0.15 MPa. An increase in induced an increase in until a certain point, after which decreased and then increased again with a further increase in . Hydraulic flip causes a decrease in [8,9,20]. The experimental and simulation results exhibited identical trends. The values were 0.55, 0.65, and 0.65 MPa when hydraulic flip occurred under L/D ratios of 3, 6, and 8, respectively. The differences in between the simulation and experimental results were mostly smaller than 10%. This result confirmed that the developed numerical model and the selected number of grids were effective for the quantitative analysis of the values, cavitation, and hydraulic flip phenomena of micro-orifice injectors.
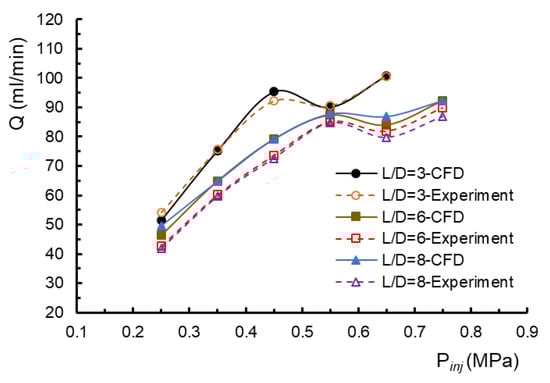
Figure 6.
Relation between and at = 0.15 MPa.
4.2. Results of Research on Water
4.2.1. Experimental Results for Flow Rate Characteristics
Figure 7 displays the experimental relationship between and under different L/D and values when the investigated fluid was water. Initially, an injector with an L/D ratio of 2 was fabricated and tested, and hydraulic flip occurred at a very low value with this injector. The results of Sou et al. [44] also indicated that hydraulic flip occurs at a low flow rate for a short nozzle (L/D ratio of 2). Thus, the injector with an L/D ratio of 2 was not included in the subsequent experiments and analyses. Figure 7 indicates that at different values, an increase in induced an increase in until a certain point, after which decreased and then increased again with a further increase in . This result is similar to those obtained in previous studies [8,9,20]. Hydraulic flip caused a decrease in , and the working fluid was not attached to the injector wall but was injected through the reduced exit area. At the same value, decreased as increased because of the small pressure difference between and , as expected. Because of the slightly round-edged inlet and the shortness of the injector with an L/D value of 3, this injection resulted in higher values than did those with L/D values of 6 and 8 at the same and values.
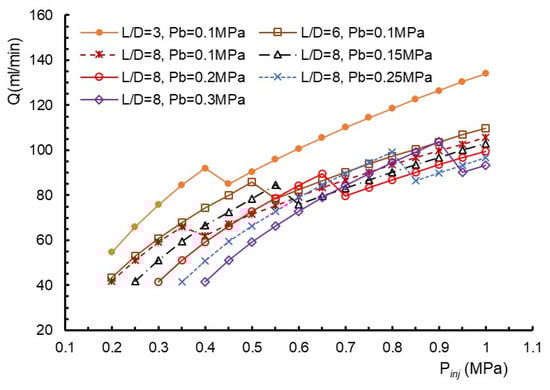
Figure 7.
Relation between and at different L/D and .
Figure 7 also indicates that the and values required for the occurrence of hydraulic flip depended on the L/D and values, as presented in Table 3. When was larger, a larger was required to achieve hydraulic flip. Thus, achieving hydraulic flip with a larger is more difficult. Cavitation and thus hydraulic flip are inhibited at high back pressure [16,17,18]. For values higher than 0.15 MPa, of the examined injectors, the injector with an L/D ratio of 3 required the highest and values for hydraulic flip, followed by the injectors with L/D ratios of 6 and 8. For values of 0.1 and 0.15 MPa, the injector with an L/D ratio of 6 required the highest and values for hydraulic flip. The cavitation characteristics of the injectors did not exhibit a regular dependence on the L/D ratio.
Table 3.
The and required for the occurrence of hydraulic flip.
The occurrence of hydraulic flip in an orifice injector depends on the parameters of the injector’s geometry, such as the L/D ratio, inlet geometry, and taper angle of the injector. For a long injector, a relatively large injector length is required for supercavitation to occur; thus, the probability of hydraulic flip is relatively low. The flow can be separated from the wall more easily for a sharp-edged inlet than for a round-edged (chamfered-edge) inlet; thus, hydraulic flip occurs easily for a sharp-edged inlet [10,12,13]. An injector with a large taper angle behaves similarly to a divergent nozzle, and the probability of hydraulic flip is thus high [14,15]. The injectors with L/D ratios of 3, 6, and 8 had a round-edged inlet, sharp-edged inlet, and sharp-edged inlet, respectively; lengths of 0.9, 1.8, and 2.4 mm, respectively; and taper angles of 0.26°, 0.4°, and 0.62°, respectively. The geometries of these injectors and the difficulty of hydraulic flip are summarized in Table 4. Hydraulic flip did not exhibit a regular dependence on the L/D ratio, which may be attributable to the combined effects of these three factors.
Table 4.
The geometries of the investigated injectors and their difficulty for hydraulic flip.
4.2.2. Characteristics of the Discharge Coefficient
Fluids flowing through an injector may undergo cavitation and viscous losses, which cause a decrease in the flow rate. A discharge coefficient is usually defined to account for such losses. is the ratio between the actual and theoretical volume flow rates through an injector. Figure 8 shows the relationship between and for L/D ratios of 3, 6, and 8 under a of 0.1 MPa. Similar results to those displayed in Figure 8 were obtained at other values. The parameter exhibited little variation with in the cavitation region, sharply decreased with an increase in as hydraulic flip occurred, and was nearly constant in the hydraulic flip region. Many experimental studies [9,15,18,20] have indicated that decreases in the cavitation region. The injectors investigated in these studies had orifices with considerably larger diameters (diameters between 1.1 and 1.8 mm) than those examined in the present study (diameter of 0.3 mm). Thus, the values in the aforementioned studies were considerably larger than 10,000. Fox et al. [11] used an injector with an orifice diameter of 0.4 mm for their cavitation studies, and consequently, the values in their study were predominantly less than 10,000. The aforementioned authors found that was approximately constant in the cavitation region. The value has a crucial effect on , as described in the following text.
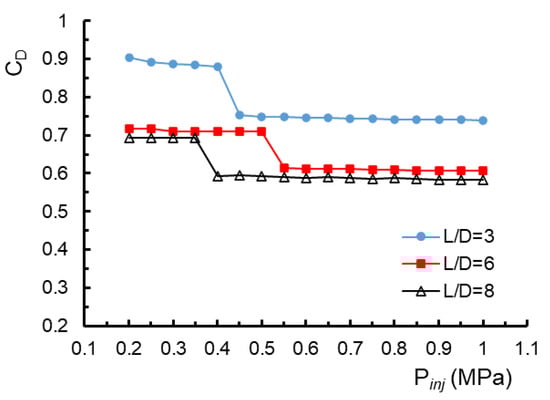
Figure 8.
Relation between and for L/D = 3, 6, and 8 at = 0.1 MPa (water).
The occurrence of cavitation inside an injector reduces the cross-sectional flow area and increases the flow resistance, thereby resulting in a decrease in . As cavitation increases, the flow resistance further increases, and thus, further decreases. Moreover, head loss occurs when a fluid flows inside an injector. When is small, the flow is in the laminar or transition region, in which viscous loss is crucial. The viscous loss coefficient decreases as increases. Thus, when is small, viscous and cavitation losses have the dominant effects on the flow rate. The combined effects of these losses may result in an approximately constant value. When is higher than 10,000, the flow is in the turbulent region, in which the viscous loss coefficient is small and approaches a constant value as increases. Because the cavitation loss increases with , decreases. When hydraulic flip occurs, the cross-section of the exit of the injector is further narrowed, which results in a sharp decrease in .
Figure 8 also indicates that decreased as the L/D ratio was increased. In this study, a small L/D ratio indicated a short nozzle and thus low viscous loss inside the injector, which resulted in a high flow rate. The values for an L/D ratio of 3 were considerably higher than those for L/D ratios of 6 and 8. This result may be attributable to the slightly round-edged inlet of the injector with an L/D ratio of 3. The results of Kiaoulias et al. [10] and Simplon and Ranade [12] indicated that was higher for a chamfered inlet than for a sharp-edged inlet.
Figure 9 depicts the relationship between and when L/D was 6 and was varied. Similar trends to those in Figure 9 were observed for L/D ratios of 3 and 8. varied slightly in the cavitation region, sharply decreased when hydraulic flip occurred, and remained constant in the hydraulic flip region. had a weak effect on . However, the results of Tharakan and Rafeeque [17] and Yu et al. [18] indicate that is affected by in the cavitation region. Cavitation is inhibited from occurring when is high, which results in lower cavitation loss and thus a higher as increases. In the two aforementioned studies, was varied from 0 to 4.1 MPa. This large variation in caused a large variation in cavitation loss and thus . Because the variation in was small (0.1–0.3 MPa) in the present study, varied only slightly with .
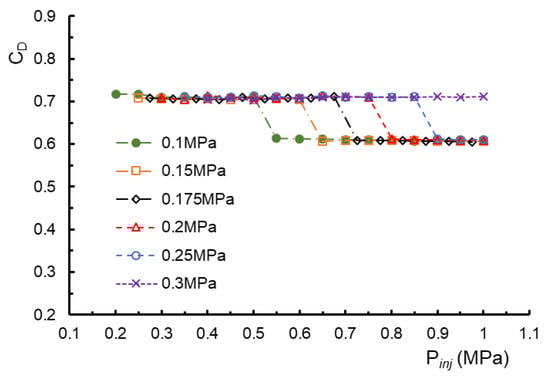
Figure 9.
Relation between and for L/D = 6 at different .
4.2.3. Numerical Results for the Internal Flow Pattern and Spray Angle
Figure 10, Figure 11 and Figure 12 display the internal flow patterns and discharged jets for the injectors with L/D ratios of 3, 6, and 8, respectively, under a of 0.15 MPa and different values. No cavitation, developing cavitation, supercavitation, and hydraulic flip were observed in sequence as was gradually increased, which is similar to the results in the literature [8,9,16]. These internal flow patterns are related to the L/D ratio. Cavitation development was weak when was small (e.g., 0.35 MPa), and the cavitation thickness was lower for an L/D value of 3 than for L/D values of 6 and 8, possibly because of the round-edged inlet of the injector with an L/D value of 3. However, hydraulic flip was achieved at a lower (0.55 MPa) when the L/D ratio was 3 than when it was 6 or 8 because of the short nozzle of the injector with an L/D ratio of 3. The cavitation characteristics for an L/D ratio of 6 were similar to those for a ratio of 8. For injectors with these L/D ratios, after the initiation of cavitation, the cavitation length initially increased rapidly with and then increased gradually with a further increase in . Compared with the injector with an L/D ratio of 6, that with an L/D ratio of 8 was longer and had a larger taper angle. Therefore, the injector with an L/D ratio of 8 exhibited hydraulic flip at a lower value (0.60 MPa) than did that with an L/D ratio of 6 (0.65 MPa).
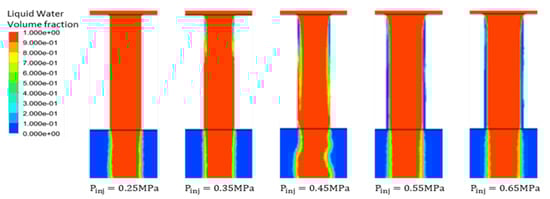
Figure 10.
Internal flow patterns and discharged jets for L/D = 3 at = 0.15 MPa.
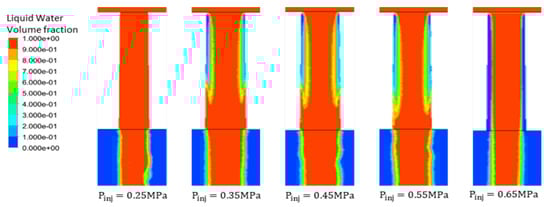
Figure 11.
Internal flow patterns and discharged jets for L/D = 6 at = 0.15 MPa.
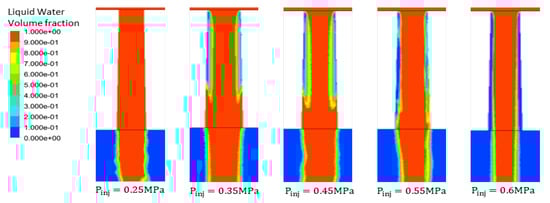
Figure 12.
Internal flow patterns and discharged jets for L/D = 8 at = 0.15 MPa.
The occurrence of cavitation inside an injector may strongly influence the spray behavior and atomization in the injector. Many studies [6,8,9,16] have indicated that the spray angle increases with in the cavitation region and reaches a maximum value in the supercavitation region. As the hydraulic flip region is entered, the spray angle decreases sharply and remains approximately constant after the occurrence of hydraulic flip. However, in the present study, the spray angle remained approximately constant from the no-cavitation region to the supercavitation region, and the jet diameter decreased marginally after the occurrence of hydraulic flip. The spray angle is related to liquid jet atomization. As a liquid jet passes through the orifice of an injector, a large shear force and high turbulence are required to break the jet into smaller droplets and cause it to atomize. When liquid jet atomization is enhanced, the spray angle increases. According to Ohnesorge’s chart [45], a high value is required for liquid atomization at the discharge orifice, especially when the Ohnesorge number is low. The water jets investigated in this study had an value of 0.0068 and values between 3000 and 9500. These Reynolds numbers are insufficient for the atomization of water jets. Consequently, the spray angle remained approximately constant as increased. These results indicate that the cavitation observed in micro-orifice injectors at a low is less important than that observed at a high . In addition, cavitation does not enhance water breakup at the nozzle exit, and it does not increase the spray angle. Therefore, it does not have a positive effect on the characteristics of atomization and spray.
4.3. Numerical Results for Kerosene Fuel
Figure 13 displays the relationship between and at L/D ratios of 3, 6, and 8 under a of 0.1 MPa when kerosene fuel was considered. Similar trends to those displayed in Figure 13 were observed under other values. increased with until a certain point, after which it marginally decreased or remained approximately constant and then increased again with a further increase in . The marginal decrease in or approximately constant value was caused by hydraulic flip. In contrast to the value of kerosene fuel, that of water decreased sharply when hydraulic flip occurred (Figure 6). This difference was probably caused by the vapor pressure of kerosene fuel being lower than that of water.
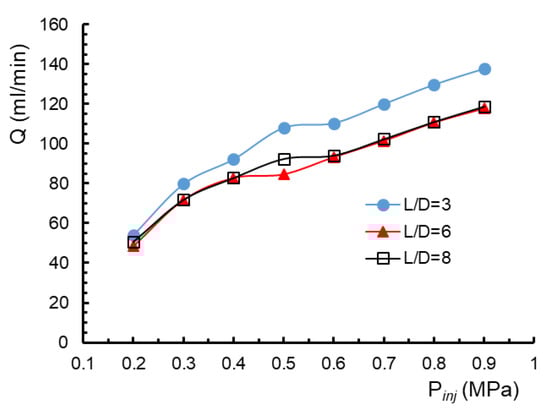
Figure 13.
Relation between and for L/D = 3, 6, and 8 at = 0.1 MPa.
Figure 14 illustrates the relationship between and at L/D ratios of 3, 6, and 8 under a of 0.1 MPa for kerosene fuel. Similar results to those depicted in Figure 14 were obtained under other values. marginally increased with , moderately decreased with a further increase in until hydraulic flip occurred, and then remained approximately constant after the occurrence of hydraulic flip. The marginal increase in with occurred because the kerosene fuel was under the no-cavitation condition. The values for an L/D ratio of 3 were higher than those for an L/D ratio of 6 or 8 because of the slightly round-edged inlet of the injector with an L/D ratio of 3. Figure 15 illustrates the relationship between and under different values for an L/D ratio of 6. Similar trends to those displayed in Figure 15 were obtained under L/D ratios of 3 and 8. did not vary considerably as changed either before or after hydraulic flip. Thus, had a weak effect on , indicating that the effect of (combustor pressure) on the design of the micro-turbojet combustor did not need to be accounted for.
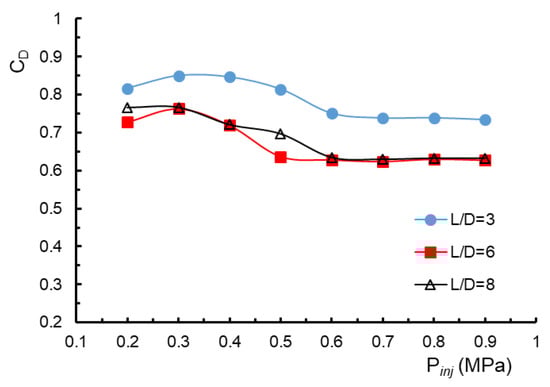
Figure 14.
Relation between and for L/D = 3, 6, and 8 at = 0.1 MPa (kerosene).
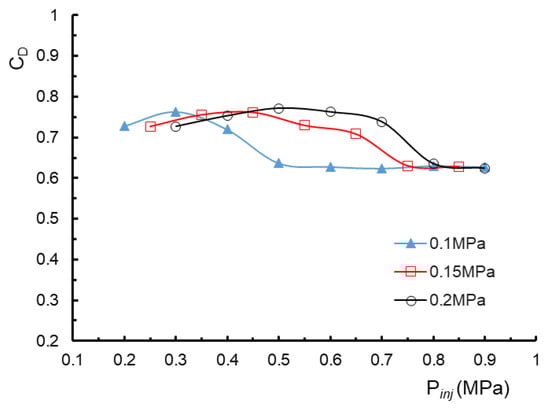
Figure 15.
Relation between and under different for L/D = 6.
Figure 16 shows the flow patterns and discharged jets inside the injector with an L/D ratio of 6 under a value of 0.15 MPa and different values for kerosene fuel. Similar to the results obtained for water, this figure indicates that kerosene fuel exhibited no cavitation, developing cavitation, supercavitation, and hydraulic flip in sequence as increased. A higher value was required for the occurrence of cavitation and hydraulic flip when kerosene was used rather than water. In the no-cavitation region, the Re values of kerosene fuel were low, ranging from 1590 at = 0.2 MPa to 2780 at = 0.35 MPa. Thus, the flow was in the laminar or transition region. In these regions, the viscous loss coefficient is high and decreases as (or Re) increases. Consequently, increased with , as illustrated in Figure 14. In the cavitation region, viscous and cavitation losses had the dominant effects on the flow rate, and the combined effect of these losses caused a marginal decrease in . Figure 16 indicates that the spray angle was approximately constant from the no-cavitation region to the supercavitation region, and the jet diameter decreased slightly as hydraulic flip occurred. The spray angles of the water jets were closely related to and , and a high value was required for the atomization of these jets. Kerosene fuel had an value of 0.02 and values of 1590–4800. Thus, the values were insufficient for the atomization of kerosene fuel jets. Overall, these results indicate that cavitation does not enhance the breakup of kerosene fuel at the nozzle exit. In addition, it does not increase the spray angle. Therefore, it has no positive effect on the characteristics of atomization and spray. In air-blast atomizers, a fuel micro-injector is used to supply fuel and mix the air for combustion. Because cavitation does not enhance liquid breakup in the injector, this drawback should be considered in the design of air-blast atomizers.
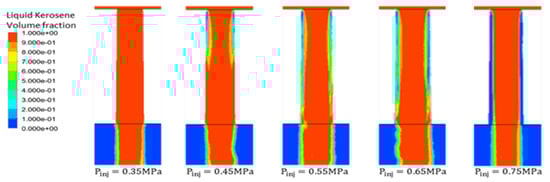
Figure 16.
Internal flow patterns and the discharged jets for L/D = 6 at = 0.15 MPa under different .
The results obtained for kerosene fuel were generally similar to those obtained for water. However, some differences were discovered in the cavitation characteristics of kerosene fuel and water. Because kerosene fuel has a lower vapor pressure than water, a higher value was required for kerosene fuel than water to cause a sufficiently low pressure at the vena-contract area inside the injector. Consequently, cavitation and hydraulic flip occurred with greater difficulty in kerosene fuel than in water, as displayed in Figure 7 and Figure 16. Table 5 presents the cavitation numbers for water and kerosene fuel when hydraulic flip occurred, given L/D ratios of 3, 6, and 8 and various values. A smaller value indicates that a higher value is required to achieve hydraulic flip. The values for kerosene fuel were smaller than those for water.
Table 5.
Cavitation number (K) for water and kerosene as hydraulic flip occurred.
The cavitation length and cavitation thickness of kerosene fuel were also smaller than those of water (Figure 17). Figure 17a displays the cavitation lengths of water and kerosene fuel under a value of 0.45 MPa, a value of 0.15 MPa, and an L/D ratio of 6. Moreover, Figure 17b depicts the cavitation thicknesses of water and kerosene fuel under supercavitation conditions given a value of 0.15 MPa and an L/D ratio of 6. The cavitation length of water ( = 0.8) was larger than that of kerosene fuel ( = 0.5). The volume fraction distributions along the injector width () at the middle of the injector () for water and kerosene fuel are illustrated in Figure 18. The volume fractions of water and kerosene fuel were 100% at the center of the injector ( 0), and these fractions began to decrease from approximately 0.15 toward the injector wall ( 0.5) because of cavitation. The volume fractions of water and kerosene fuel became 90% at approximately 0.25 and 0.33, respectively. The cavitation thickness for water was larger than that for kerosene fuel.
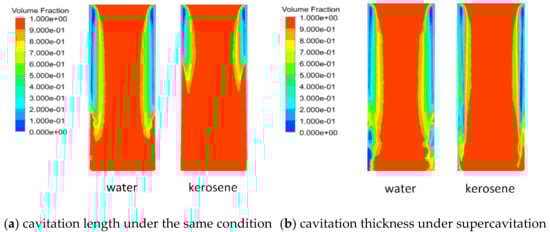
Figure 17.
Comparison of cavitation length (a) and thickness (b) for water and kerosene.
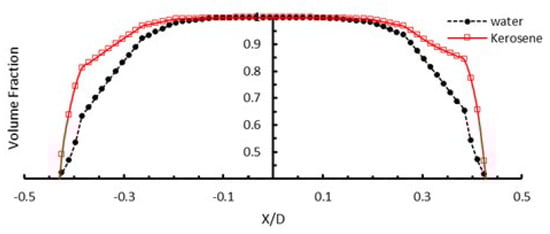
Figure 18.
Volume fraction distributions along at for water and kerosene.
Cavitation decreases the cross-sectional flow area and increases flow resistance, thereby causing a decrease in the flow rate. Moreover, viscous loss occurs inside an injector. Because the cavitation length and cavitation thickness of kerosene fuel were smaller than those of water, the cavitation loss was smaller for kerosene than for water. However, the viscous loss of kerosene fuel was higher than that of water because kerosene fuel has higher viscosity. Consequently, the discharge coefficients of kerosene fuel and water did not differ considerably.
Generally, the round-edged inlet of an injector reduces the cavitation effect and increases the values of and required for hydraulic flip; the taper angle of an injector reduces the injection pressure required for hydraulic flip; and the L/D ratio of an injector affects the flow rate and required for hydraulic flip. According to the results of this study, cavitation in micro-orifice injectors does not contribute to liquid breakup or spray at a low . Therefore, determining the geometry of micro-orifice injectors is essential. Micro-orifice injectors with small L/D ratios have a round-edged inlet and a small taper angle. As presented in Figure 14 and Table 5, of all investigated injectors, that with an L/D ratio of 3 exhibited the highest and lowest K, indicating that this injector provided the maximum quantity of kerosene fuel with the lowest likelihood of hydraulic flip. Thus, micro-injectors with an L/D ratio of 3, rather than 6 and 8, are recommended for the development of micro-turbojet engines.
5. Conclusions
This study experimentally and numerically investigated the cavitation and spray characteristics of micro-orifice injectors at the low of 0.2–1.0 MPa for L/D ratios of 3, 6, and 8 and at a of 0.1–0.3 MPa. The values ranged from 1590 to 4800 for kerosene and from 3000 to 9500 for water. A spray test was conducted for experimentation, and the experimental results were used to verify the proposed numerical model. In this numerical model, the ZGB equation was adopted with a transition SST turbulent model to simulate cavitation in a micro-injector. A comparison of the experimental and numerical results revealed that the numerical model reasonably predicted cavitation phenomena.
Both water and kerosene exhibited no cavitation, cavitation, supercavitation, and hydraulic flip. Hydraulic flip reduced Cd, as has also been reported in the literature. Because the vapor pressure of kerosene fuel is lower than that of water, cavitation and hydraulic flip occurred with greater difficulty in kerosene fuel. In addition, the cavitation length and cavitation thickness of kerosene fuel were smaller than those of water. Moreover, the occurrence of cavitation in the injectors was not regularly dependent on the L/D ratio because of the combined effects of the inlet geometry, length, and taper angle of the injectors.
Because the values of water and kerosene were not large enough to induce atomization in the discharged jet, the spray angles remained nearly constant from the no-cavitation to the hydraulic flip regions, indicating that cavitation in micro-orifice injectors at a low Re has no positive effect on the characteristics of atomization and spray. Therefore, the choice of a micro-orifice injector at a low Re primarily depends on the geometry of the injector rather than on its cavitation characteristics. Micro-orifice injectors with a small L/D ratio have a round-edged inlet and a small taper angle due to their electrical discharge machining in practical fabrication, which increases the and required for hydraulic flip. Therefore, the injector with an L/D ratio of 3 is recommended for the development of micro-turbojet engines.
In air-blast atomizers, a fuel micro-injector is used to supply fuel and mix the air for combustion. Because injector cavitation does not enhance liquid breakup or increase the spray angle, this drawback should be considered in the design of air-blast atomizers. In addition, because has a weak effect on , the effect of (combustor pressure) on the design of micro-turbojet combustors does not need to be considered.
Author Contributions
Conceptualization, K.O.; Methodology, T.-Y.C. and C.-C.Y.; Software, T.-Y.C., C.-C.Y. and K.O.; Validation, K.O.; Formal analysis, T.-Y.C. and C.-C.Y.; Investigation, T.-Y.C.; Data curation, C.-C.Y.; Writing—original draft, T.-Y.C.; Writing—review & editing, K.O.; Visualization, C.-C.Y.; Supervision, K.O. All authors have read and agreed to the published version of the manuscript.
Funding
This research received no external funding.
Data Availability Statement
The data supporting this study’s findings are available from the corresponding author upon reasonable request.
Conflicts of Interest
The authors declare that they have no known competing financial interests or personal relationships that could have appeared to influence the work reported in this paper. This research did not receive any specific grants from funding agencies in the public, commercial, or not-for-profit sectors.
References
- Bergwerk, W. Flow Pattern in Diesel Nozzle Spray Holes. Proc. Inst. Mech. Eng. 1959, 173, 655–660. [Google Scholar] [CrossRef]
- Nurick, W.H. Orifice Cavitation and Its Effect on Spray Mixing. J. Fluids Eng. 1976, 98, 681–687. [Google Scholar] [CrossRef]
- Suh, H.K.; Lee, C.S. Effect of Cavitation in Nozzle Orifice on the Diesel Fuel Atomization Characteristics. Int. J. Heat Fluid Flow 2008, 29, 1001–1009. [Google Scholar] [CrossRef]
- Chemloul, N.S. Experimental Study of Cavitation and Hydraulic Flip Effects on Liquid Jet Characteristics into Crossflows. J. Appl. Fluid Mech. 2012, 5, 33–43. [Google Scholar]
- Jung, K.; Khil, T.; Yoon, Y. Effects of Orifice Internal Flow on Breakup Characteristics of like-Doublet Injectors. J. Propul. Power 2006, 22, 653–660. [Google Scholar] [CrossRef]
- Sou, A.; Hosokawa, S.; Tomiyama, A. Effects of Cavitation in a Nozzle on Liquid Jet Atomization. Int. J. Heat Mass Transf. 2007, 50, 3575–3582. [Google Scholar] [CrossRef]
- Asi, O. Failure of a Diesel Engine Injector Nozzle by Cavitation Damage. Eng. Fail. Anal. 2006, 13, 1126–1133. [Google Scholar] [CrossRef]
- Abderrezzak, B.; Huang, Y. Investigation of the Effect of Cavitation in Nozzles with Different Length to Diameter Ratios on Atomization of a Liquid Jet. J. Therm. Sci. Eng. Appl. 2017, 9, 031014. [Google Scholar] [CrossRef]
- Ro, S.; Kim, B.; Park, S.; Kim, Y.B.; Choi, B.; Jung, S.; Lee, D.W. Internal Cavitating Flow and External Spray Behavior Characteristics According to Length-to-Width Ratio of Transparent Nozzle Orifice. Int. J. Automot. Technol. 2020, 21, 181–188. [Google Scholar] [CrossRef]
- Kiaoulias, D.N.; Travis, T.A.; Moore, J.D.; Risha, G.A. Evaluation of Orifice Inlet Geometries on Single Liquid Injectors Through Cold-Flow Experiments. Exp. Therm Fluid Sci. 2019, 103, 78–88. [Google Scholar] [CrossRef]
- Fox, T.A.; Stark, J. Characteristics of Miniature Short-Tube Orifice Flows. Proc. Inst. Mech. Eng. Part C J. Mech. Eng. Sci. 1989, 203, 351–358. [Google Scholar] [CrossRef]
- He, Z.; Guo, G.; Tao, X.; Zhong, W.; Leng, X.; Wang, Q. Study of the Effect of Nozzle Hole Shape on Internal Flow and Spray Characteristics. Int. Commun. Heat Mass Transfer 2016, 71, 1–8. [Google Scholar] [CrossRef]
- Simpson, A.; Ranade, V.V. Modelling of Hydrodynamic Cavitation with Orifice: Influence of different orifice designs. Chem. Eng. Res. Des. 2018, 136, 698–711. [Google Scholar] [CrossRef]
- Kim, B.; Park, S. Effect of Orifice Inlet Roundness on Internal Flow and External Spray Characteristics in Enlarged Nozzle with Single-Passage. Exp. Therm Fluid Sci. 2019, 109, 109875. [Google Scholar] [CrossRef]
- Omelyanyuk, M.; Ukolov, A.; Pakhlyan, I.; Bukharin, N.; El Hassan, M. Experimental and Numerical Study of Cavitation Number Limitations for Hydrodynamic Cavitation Inception Prediction. Fluids 2022, 7, 198. [Google Scholar] [CrossRef]
- Yu, B.; Fu, P.F.; Zhang, T.; Zhou, H.C. The Influence of Back Pressure on the Flow Discharge Coefficients of Plain Orifice Nozzle. Int. J. Heat Fluid Flow 2013, 44, 509–514. [Google Scholar] [CrossRef]
- Tharakan, T.J.; Rafeeque, T.A. The Role of Backpressure on Discharge Coefficient of Sharp Edged Injection Orifices. Aerosp. Sci. Technol. 2016, 49, 269–275. [Google Scholar] [CrossRef]
- Prasetya, R.; Sou, A.; Wada, Y.; Yokohata, H. Effects of Ambient Pressure on Cavitation in the Nozzle and the Discharged Liquid Jet. J. Fluid Sci. Technol. 2019, 14, JFST0005. [Google Scholar] [CrossRef]
- Payri, R.; Salvador, F.J.; Gimeno, J.; Venegas, O. Study of Cavitation Phenomenon Using Different Fuels in a Transparent Nozzle by Hydraulic Characterization and Visualization. Exp. Therm Fluid Sci. 2013, 44, 235–244. [Google Scholar] [CrossRef]
- He, Z.; Shao, Z.; Wang, Q.; Zhong, W.; Tao, X. Experimental Study of Cavitating Flow Inside Vertical Multi-Hole Nozzles with Different Length–Diameter Ratios Using Diesel and Biodiesel. Exp. Therm Fluid Sci. 2015, 60, 252–262. [Google Scholar] [CrossRef]
- He, Z.; Hu, B.; Wang, J.; Guo, G.; Feng, Z.; Wang, C.; Duan, L. The Cavitation Flow and Spray Characteristics of Gasoline-Diesel Blends in the nozzle of a High-Pressure Common-Rail Injector. Fuel 2023, 350, 128786. [Google Scholar] [CrossRef]
- Pratama, R.H.; Huang, W.; Moon, S.; Wang, J.; Murayama, K.; Taniguchi, H.; Arima, T.; Sasaki, Y.; Arioka, A. Hydraulic Flip in a Gasoline Direct Injection Injector and its Effect on Injected Spray. Fuel 2022, 310, 122303. [Google Scholar] [CrossRef]
- Jia, M.; Xie, M.; Liu, H.; Lam, W.-H.; Wang, T. Numerical Simulation of Cavitation in the Conical-Spray Nozzle for Diesel Premixed Charge Compression Ignition Engines. Fuel 2011, 90, 2652–2661. [Google Scholar] [CrossRef]
- Sadegharani, H.; Haghshenasfard, M.; Salimi, J. Numerical Study on the Effect of Cavitation on Flow and Diesel Fuel Atomization Characteristics. Chem. Eng. Technol. 2013, 36, 474–482. [Google Scholar] [CrossRef]
- Biçer, B.; Sou, A. Application of the Improved Cavitation Model to Turbulent Cavitating Flow in Fuel Injector Nozzle. Appl. Math. Modell. 2016, 40, 4712–4726. [Google Scholar] [CrossRef]
- Ghorbani, M.; Sadaghiani, A.K.; Yidiz, M.; Koşar, A. Experimental and Numerical Investigations on Spray Structure under the Effect of Cavitation Phenomenon in a Microchannel. J. Mech. Sci. Technol. 2017, 31, 235–247. [Google Scholar] [CrossRef]
- Mithun, M.G.; Koukouvnis, P.; Karathanassis, I.K.; Gavaises, M. Simulating the Effect of In-Nozzle Cavitation on Liquid Atomisation Using a Three-Phase Model. In Proceedings of the 10th International Symposium on Cavitation (CAV2018), Baltimore, MD, USA, 14–16 May 2018; Katz, J., Ed.; ASME Press: New York, NY, USA, 2018. [Google Scholar]
- Cristofaro, M.; Edelbauer, W.; Koukouvinis, P.; Gavaises, M. Influence of Diesel Fuel Viscosity on Cavitating Throttle Flow Simulations under Erosive Operation Conditions. ACS Omega 2020, 5, 7182–7192. [Google Scholar] [CrossRef]
- Urazmetov, O.; Cadet, M.; Teutsch, R.; Antonyuk, S. Investigation of the Flow Phenomena in High-Pressure Water Jet Nozzles. Chem. Eng. Res. Des. 2021, 165, 320–332. [Google Scholar] [CrossRef]
- Bambhania, M.; Patel, N.K. Numerical Modeling of the Cavitation Flow in Throttle Geometry. J. Appl. Fluid Mech. 2022, 16, 257–267. [Google Scholar] [CrossRef]
- Pietrykowski, K.; Karpiński, P. Simulation Study of Hydrodynamic Cavitation in the Orifice Flow. Appl. Comput. Sci. 2022, 18, 31–41. [Google Scholar] [CrossRef]
- Li, Q.; Zong, C.; Liu, F.; Xue, T.; Zhang, A.; Song, X. Numerical and Experimental Analysis of the Cavitation Characteristics of Orifice Plates under High-Pressure Conditions Based on a Modified Cavitation Model. Int. J. Heat Mass Transfer 2023, 203, 123782. [Google Scholar] [CrossRef]
- Fuchs, F.; Meidinger, V.; Neuburger, N.; Reiter, T.; Zündel, M.; Hupfer, A. Challenges in Designing very small Jet Engines-Fuel Distribution and Atomization. In Proceedings of the 16th International Symposium on Transport Phenomena and Dynamics of Rotating Machinery, Honolulu, HI, USA, 10–15 April 2016. [Google Scholar]
- Rahmatian, M.A.; Tari, P.H.; Mojaddam, M.; Majidi, S. Numerical and Experimental Study of the Ducted Diffuser Effect on Improving the Aerodynamic Performance of a Micro Horizontal Axis Wind Turbine. Energy 2022, 245, 123267. [Google Scholar] [CrossRef]
- Janmanee, P.; Muttamara, A. A Study of Hole Drilling on Stainless Steel AISI 431 by EDM Using Brass Tube Electrode. Int. Trans. J. Eng. Manag. Appl. Sci. Technol. 2011, 2, 471–481. [Google Scholar]
- Pramanik, A.; Basak, A.K.; Littlefair, G.; Debnath, S.; Prakash, C.; Singh, M.A.; Marla, D.; Singh, R.K. Methods and Variables in Electrical Discharge Machining of Titanium Alloy—A review. Heliyon 2020, 6, e05554. [Google Scholar] [CrossRef]
- Qiu, T.; Song, X.; Lei, Y.; Liu, X.; An, X.; Lai, M. Influence of inlet pressure on cavitation flow in diesel nozzle. Appl. Therm. Eng. 2016, 109, 364–372. [Google Scholar] [CrossRef]
- Jin, Z.J.; Gao, Z.X.; Li, X.J.; Qian, J.Y. Cavitating flow through a micro-orifice. Micromachines 2019, 10, 191. [Google Scholar] [CrossRef]
- Kumar, A.; Ghobadian, A.; Nouri, J.M. Assessment of cavitation models for compressible flows inside a nozzle. Fluids 2020, 5, 134. [Google Scholar] [CrossRef]
- Zwart, P.; Gerber, A.; Belamri, T. A Two-Phase Model for Predicting Cavitation Dynamics. In Proceedings of the ICMF 2004 International Conference on Multiphase Flow, Yokohama, Japan, 30 May–4 June 2004; pp. 1–11. [Google Scholar]
- Ansys Fluent Theory Guide; Chapter 18. Available online: https://dl.cfdexperts.net/cfd_resources/Ansys_Documentation/Fluent/Ansys_Fluent_Theory_Guide.pdf (accessed on 9 January 2024).
- Ebrahimi, B.; He, G.; Tang, Y.; Franchek, M.; Liu, D.; Pickett, J.; Springett, F.; Franklin, D. Characterization of high-pressure cavitating flow through a thick orifice plate in a pipe of constant cross section. Int. J. Therm. Sci. 2017, 114, 229–240. [Google Scholar] [CrossRef]
- Casoli, P.; Scolari, F.; Rundo, M. Modelling and Validation of Cavitating Orifice Flow in Hydraulic Systems. Sustainability 2021, 13, 7239. [Google Scholar] [CrossRef]
- Sou, A.; Hosokawa, S.; Tomiyama, A. Cavitation in Nozzles of Plain Orifice Atomizers with Various Length-to-Diameter Ratios. At. Sprays 2010, 20, 513–524. [Google Scholar] [CrossRef]
- Reitz, R.D. Atomization and Other Breakup Regimes of a Liquid Jet. Ph.D. Thesis, Princeton University, Princeton, NJ, USA, 1978. [Google Scholar]
Disclaimer/Publisher’s Note: The statements, opinions and data contained in all publications are solely those of the individual author(s) and contributor(s) and not of MDPI and/or the editor(s). MDPI and/or the editor(s) disclaim responsibility for any injury to people or property resulting from any ideas, methods, instructions or products referred to in the content. |
© 2024 by the authors. Licensee MDPI, Basel, Switzerland. This article is an open access article distributed under the terms and conditions of the Creative Commons Attribution (CC BY) license (https://creativecommons.org/licenses/by/4.0/).