Abstract
Accurately evaluating the effectiveness of the energy consumption “dual control” policy can effectively solve serious the current environmental pollution and promote ecological civilization. However, researchers have rarely considered the impacts on the regional “resource curse” of the energy consumption “dual control” policy. A dynamic computable general equilibrium model (CGE) was built to evaluate the impacts on the regional “resource curse” of the energy intensity control and total energy control policy. The results showed the following. (1) The energy consumption “dual control” policy changes the supply-and-demand relationship of factors and reduces the crowding-out effect of humans and capital. (2) The energy consumption “dual control” policy has restrained GDP growth, and the total output and total investment have declined. However, the impact in regions without the “resource curse” is remarkable. (3) The energy consumption “dual control” policy has a significant inhibitory effect on major pollutants and carbon emissions. (4) The energy consumption “dual control” policy has played a positive role in breaking the regional “resource curse”. The areas with a high and low “resource curse” have become smaller, and the areas without the “resource curse” have increased significantly. The following suggestions are made: (1) increase the flexibility of the “dual control” policy of energy consumption, (2) establish an energy consumption budget management system, and (3) accelerate the establishment of a carbon footprint management system.
1. Introduction
The regional “resource curse” reflects the inverse relationship between resource endowment and regional economic growth, where resources hinder economic development and become a curse factor. However, resources themselves are not resistant to economic growth. The research shows that the transmission mechanism between natural resources and economic growth led to the “resource curse”. Humans, investment, education and institutions are significant factors. Previous research mainly focused on the existence, transmission path and countermeasures of the “resource curse” but rarely linked them with the method of using resources and the guidance of government policies, which led to neglecting the role of the government in resource exploitation and consumption.
Arguments in favor and against energy policy are abundant in China and all around the world. Decarbonization has incentive the green development (Mignone, 2023) [1]. The energy consumption “dual control” policy is believed to be a useful way to force industrial transformation and upgrades under the restraint of both carbon emissions and the regional economy because of urban agglomerations (Yanmei Li, 2018) [2]. The energy consumption “dual control” policy adopts a combination of total energy consumption control and intensity control, giving priority to energy efficiency and strictly controlling the energy consumption intensity. The cost of using energy makes producers pay more attention to resource intensification, reflects the intergenerational equity of using energy, and is also conducive to reductions in major pollutant emissions. Since 2021, China’s energy consumption policy has become more controversial, and some high-energy-consuming industries, such as the steel and chemical industries, have been restricted and stopped to a certain degree. Burgeoning consumption and finite energy have prompted more concerns about energy sustainability (Ali Hashemizadeh, 2024) [3]. With increases in urbanization, controlling energy consumption has great meaning for carbon emissions (Aiting Xu, 2024) [4]. Although the support for the energy supply in the key industrial sectors and price stabilization by the government have been increased (Yanxia Zhang, 2018) [5], how to improve the support capacity of the energy supply is still a huge challenge for China.
The energy consumption “dual control” policy involves all social and economic aspects, and its impact on regional development must be comprehensively appraised in combination with economic development, energy conservation and emission reductions. The growth rate of energy consumption and the associated structure mainly affect carbon emissions (Hongtao Zhu, 2024) [6]. However, the evaluation mechanism of the “resource curse” is not perfect, which seriously restricts the adjustment and guidance function in relation to regional development by the energy consumption “dual control” policy. What is the impact of the “dual control” policy on China’s regional economic development, emission reductions, and environmental systems? How to adjust the way of using energy, accelerate regional development, and promote emission reduction, and, thus, avoid the regional “resource curse” by the energy consumption “double control” policy, is not only the focus of research but also an important basis for economic structural transformation and high-quality regional development.
Quantifying energy policy is crucial for sustainable development (Tong Zou, 2024) [7]. Based on general equilibrium theory, the CGE model can effectively appraise the impacts of policy changes on the economy. By using the module in each part to establish the connection among all participants, the CGE model is flexible enough to evaluate public policy, and with a wide spectrum of parameters and mass data dynamic processing, the CGE model has a stronger adaptability for analyzing the impacts of China’s energy policy. The CGE model can consider the direct and indirect effects of policy changes across the entire economy, providing an analysis of the impacts of policy changes on energy efficiency, green energy transition, technology progress, tax reform and electricity market-oriented reform (Huibin Du, 2020; Basanta K. Pradhan, 2022; Xingang Zhao, 2024; Cristian Mardones, 2024; Zhiyuan Gao, 2024) [8,9,10,11,12]. Thus, we built a dynamic CGE model, adopted energy consumption “double control” policy scenarios, and appraised the impacts on China’s economic and environmental systems. With the dynamic CGE model, this study evaluated the impacts on regional growth and environmental improvements in China’s “resource curse” policy of energy consumption. The suggestions provide a preliminary discussion on energy policy for government decision making during the economic transition.
The remainder of this study is as follows: in the second part, a dynamic CGE model is constructed; in the third part, we appraise the impacts on regional economic growth and the environmental system of the energy consumption “resource curse” policy; and, in the fourth part, we offer a summary and make policy recommendations.
2. Related Literature Review
Since the 1990s, the phenomenon of the “resource curse” has occurred frequently in developing countries and regions, and the “resource curse” has attracted the attention of the academic community and become a famous economic paradox (Sachs, 1999) [13]. Since then, “resource curse” theory has gradually become the focus of research (Auty, 2001) [14]. Previous research focused on the transmission mechanism of the “resource curse”, the substitution variables of resource dependence and so on. When the economy is dependent on resource inputs, it will crowd out other factor inputs, resulting in a crowding-out effect (Funk Charle, 2020; Bonet-Morón Jaime, 2020) [15,16]. The excessive prosperity of the resource industry has attracted a large amount of investment, squeezed out other industries, and rapidly increased the cost of human resources (Hua Wei, 2020) [17]. During the formation of the “resource curse”, rent-seeking, corruption, and backward laws and systems are considered to be important incentives for the “resource curse” (ChiSwian Wong, 2021; Leonard Alycia al., 2022; Ajide Kazeem Bello, 2022; Sun Xiaohua, 2022) [18,19,20,21]. China has formed a series of research on regional verification of the “resource curse” and transmission mechanism by using different indicators (Kangning Xu, 2006; Shuai Shao, 2011; Xiangyu Yu, 2019) [22,23,24]. Meanwhile, resource imports, the spillover effects, technological innovation and government behavior are regarded as important reasons for the “resource curse” (Yawei Xue, 2019; Wenyao Zhao, 2019; Qingzi Huang, 2021) [25,26,27].
With an increase in the phenomenon of the “resource curse”, the rule and policy have also become important factors. And the quality of policy affects and determines the role of resource endowment. In some countries or regions with imperfect institutions, the resource policy and institution determine whether resource endowments can promote economic growth, while improvements in rules will change the path of economic growth and stimulate the potential advantages of resource endowments for economic growth. Therefore, improving the quality of institutional design is an effective way to break the “resource curse” (Ruoyu Xiong, 2020) [28], and the path dependence may lead to the phenomenon of “resource curse” (Zhenqiao Liang, 2019) [29]; therefore, the quality of designed policies is particularly important.
The “dual control” policy on energy consumption forces industrial transformation and upgrades by controlling energy consumption. Therefore, energy regulation policy will produce emission reduction effects due to the energy structure and energy substitution (Ang, 1999) [30]. Considering the heavy dependence on energy in China, the distortion of the industrial structure is an important factor leading to the rise in energy intensity (Xiaobo Shen, 2021) [31]. For one thing, energy consumption, GDP growth and carbon emissions have a significant correlation (Giovanni, 2014) [32], and an increase in total energy consumption will directly lead to an increase in carbon emissions, especially the environmental pollution elasticity of China, which is relatively high as a result of energy consumption (Dingbang Cang, 2020) [33], and China’s energy structure, which is dominated by coal, is an significant cause of serious environmental pollution (Limei Ma, 2014) [34]. As a country with high energy consumption, technological progress is the main driving factor to achieve the “3060” emission reduction target (Peng Zhou, 2021) [35]. Technological improvements and environmental governance can force energy structure changes, which significantly inhibits coal consumption and reduces environmental pollutants. For another, emission reduction potential is the basis for total energy consumption and intensity control (Yande Dai, 2015) [36]. Total energy consumption and reductions in energy consumption per unit of GDP complement each other (Yiming Wei, 2011) [37]. The low carbonization of China’s industrial system is driven by the improvement and optimization of the energy structure. Due to the substantial proportion of energy consumption, the efficiency of energy use is highly affected by the industrial structure (Wei Zhang, 2016) [38]. Although countries all around the world have different energy transformation paths, the driving mechanisms are similar. The impact of economic aggregates on energy demand is through high-energy-consuming industries, and changes in economic structure are the main driving force (Fan Ying, 2021) [39]. Strengthening the regulation of high-energy-consuming industries is the key choice to achieve the goal of total energy consumption control (Xinye Zheng, 2019) [40]. At the same time, energy price fluctuations affect economic growth, but they can also effectively improve energy efficiency (Mian Yang, 2021) [41].
The “14th Five-Year Plan” is a critical period for China to achieve the goal of peaking carbon emissions (Hong Li, 2017) [42]. In pursuit of high-quality development, growth rate expectations will be reduced, and more attention should be paid to supply-side structural reforms (Zhibiao Liu, 2020) [43]. In order to achieve the carbon peak and carbon neutrality goal, China must find the source of emission reductions and environmental pollution. It should be analyzed with the key factors affecting development by the optimal control method (Xu Shichun, 2012) [44], and the composite guidance method, combining government regulation and market mechanisms, can achieve emission reduction goals (Minjun Shi, 2021) [45]; therefore, reasonable and effective policies are more conducive to improving China’s emission reductions (Zhenhua Zhang, 2021) [46].
In general, the research on the “resource curse” has formed a relatively complete theoretical system, and the related research is focused more on the existence of the “Dutch disease”, the factor crowding-out effect, and the rent-seeking and transmission mechanism of the “resource curse”, but less attention is paid to the energy consumption “dual control” policy of China. The dual control policy on energy consumption restricts the development of high-energy-consuming industries, promotes the transformation of the industrial structure towards diversification, reduces dependence on a single resource, and, thus, avoids the occurrence of the “resource curse”. At the same time, the dual control policy of energy consumption promotes technological innovation and equipment upgrades in enterprises, improves energy efficiency, reduces the consumption of natural resources, helps break resource path dependence, and promotes sustainable economic development. Controlling the total amount and intensity of energy consumption helps to reduce carbon emissions, achieve low-carbon development and avoid the ecological damage caused by excessive resource exploitation.
3. The Dynamic CGE Model
3.1. Overview of the Dynamic CGE Model
This study constructs a dynamic CGE model that incorporates production, consumption, pricing, income–expenditure, energy, and environmental modules.
The government, the departments, and the consumers are defined as key subjects, and labor, capital, and energy are chosen as the keys in production. The relationship of each module in the model is shown in Figure 1.
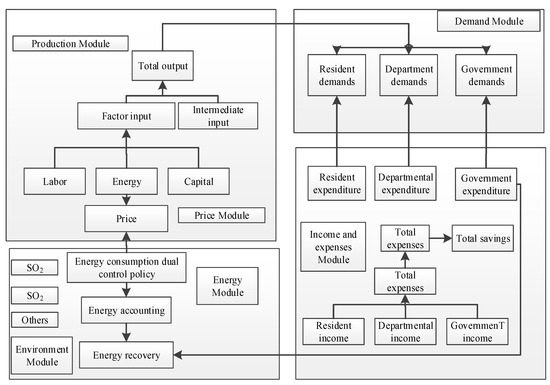
Figure 1.
Relationships among modules in dynamic CGE model.
This study combines the energy consumption “dual control” policy with economic development to form a comprehensive analysis framework of the CGE model. We transform the basic modules of the traditional CGE model and highlight the impact on different regions, entities and accounts. Driven by the energy consumption “dual control” policy, the model regulates the main energy consumption behavior and affects the regional total output.
3.2. The Main Modules of the Dynamic CGE Model
- (1)
- Production Module
The production module captures the production activities across different sectors using a Constant Elasticity of Substitution (CES) production function. The functional form is specified as follows:
The production function is as follows:
where is the output of sector are capital, labor, and energy inputs, respectively, is a scale parameter, are the output elasticity for capital, labor, and energy, and is the substitution elasticity.
- (2)
- Consumption Module
The consumption module comprises the demands of the households, the sectors and the government. Aggregate market demand is the total consumption of households, sectors and the government.
The total consumption function is as follows:
where is the total consumption, is the household consumption, is the sector consumption and is the government consumption.
Household consumption is described by utility maximization, which obeys the CES function.
The utility function of the household is as follows:
where is the utility of the household consumption, is the output elasticity of the household consumption, is the substitution elasticity of the household consumption.
- (3)
- Price Module
The price module determines the equilibrium prices for goods, labor, capital, and energy. The price is derived from factor prices. The price function is as follows:
where is the price; are the prices of capital, labor, and energy, respectively; are the output elasticity for capital, labor and energy, respectively; is the substitution elasticity.
- (4)
- Income–Expenditure Module
The income–expenditure module describes the income and expenditure structures of households, sectors, and the government.
Household income comprises the income, capital income, and transfer payments. The function is as follows:
where is the wage rate, is the return on capital, are the labor and capital inputs, and is government transfer payments.
Sector income consists of sales revenue and returns on investment. The function is as follows:
Government income includes tax revenue and other fiscal income. The function is as follows:
where is government income, is tax revenue, is other fiscal income.
- (5)
- Energy Module
The energy module includes the energy consumption of coal, oil, natural gas and renewable energy. The energy production function is as follows:
Among them, is the consumption of synthetic energy; are the consumption of coal, oil, natural gas and renewable energy; is the comprehensive technical level of energy; are the technical coefficients of different energy; and is the elasticity of energy substitution.
- (6)
- Environmental Module
The environmental factors include SO2, CO2, wastewater and industrial solid waste as key indexes of the environment system. CO2 emissions are obtained by energy consumption, and the formula is as follows:
in which is carbon emissions; is energy consumption; is unit of resource carbon content; is for carbon sequestration; is the rate of oxidation.
The function equation of includes:
where is emissions, is energy consumption, is the conversion rate, is sulfur content, is desulfurization rate.
Wastewater comes from industry and households, about 30% and 70%, respectively. Industrial solid waste emissions mainly come from the industrial sector.
3.3. Basic Data and Key Parameter of the Dynamic CGE Model
The social accounting matrix (SAM) reflects the degree of quantitative correlation and interaction between various economic entities in a certain period, and it intuitively reflects the changes in the government, sectors and residents.
The main sources of data in the SAM table include the China Statistical Yearbook, China’s input–output table, “China Tax Yearbook” and government gazettes, as shown in Table 1.

Table 1.
Main data sources in SAM.
The foundation data of the CGE model came from the social accounting matrix (SAM) or other macroeconomic datasets, which describe the economic activities at a specific point in time. The basic data observed include various economic variables, such as production, consumption, investment, government expenditure, taxation, and trade flows. The data cycle and frequency used in the CGE model is annual, depending on the availability of data. For data that cannot be directly obtained, econometric methods or estimates from the authoritative literature are used.
The key parameters of the dynamic CGE mode are shown in Table 2.
Table 2.
Key parameters of the dynamic CGE model.
4. Simulated Results
4.1. Policy Scenario Setting
In this study, we analyze the situation of “resource curse” areas and set up energy consumption “dual control” policy scenarios. The base time of the model is set, and the software is considered. Based on economy, resource and environmental systems, initial policy scenario setting is set accordingly.
- (1)
- The “resource curse” regional division of China
The “resource curse” coefficient is adopted to measure the “resource curse” in China, and the formula is as follows:
where is the “resource curse” coefficient, is energy, is gross domestic product.
When the “resource curse” coefficient is greater than 1, it indicates that the relevant area is cursed. The larger the value is, the greater the deviation between energy and economic growth appears. To distinguish the different situations of “resource curse” in China, each province is divided into three conditions, including high, low and no “resource curse”, as shown in Table 3.
Table 3.
Regional “resource curse” in China.
According to the “resource curse” coefficient, three different regions, (0,1), (1,3) and (3,+), are divided. Among them, the regions including Shanghai and others belong to the no “resource curse” regions. Regions such as Henan and others belong to low “resource curse” regions, indicating economic growth is slightly lower than energy endowment conditions, and energy advantages cannot be fully converted into economic growth. The economic growth of regions including Xinjiang and others lags far behind energy endowment, as the “resource curse” mostly occurs in central and western regions.
- (2)
- Energy consumption “dual control” policy scenarios
The energy consumption “dual control” policy plays an important role in regulating energy use to achieve the binding and expected indicators of environmental protection. The reduction in energy consumption intensity is used as a binding index, and the total energy consumption management has certain flexibility. In this study, the energy output rate is selected to reflect the change in energy consumption intensity, and the total energy consumption management takes the total energy consumption as the goal.
In the dynamic CGE model, the specific policy scenario is set as the energy consumption per unit of GDP as the energy intensity control indicator and the per capita energy consumption upper limit standard as the energy intensity control. Based on the “14th Five-Year Plan”, regional energy total control and energy consumption intensity control standards are shown in Table 4.
Table 4.
Design of energy consumption “dual control” policy scenarios.
The base time of the model is 2020. Because the CGE model has good mid- and long-term simulation characteristics, the simulation period is set from 2025 to 2035, and the GAMS is adopted to simulate the impacts on the economy, resource and environmental systems.
- (3)
- Initial policy scenario setting
In the initial setting of the economic system, the 2007–2020 GDP growth rate and other indicators are used to describe the economic development, as shown in Table 5.
Table 5.
Growth rate of economic indicators over the year %.
In the initial setting of the energy system, the average trend of energy production and consumption is obtained through historical data analysis. From 2007 to 2019, China’s energy production and consumption are shown in Table 6.
Table 6.
Energy production and consumption over the years (10,000 tons of standard coal).
The environmental system is represented by indicators, such as wastewater, waste gas and industrial solid waste; the discharge status of major pollutants is judged based on the average annual growth, among which the discharge of wastewater, waste gas and solid industrial waste is increased by an average annual rate of 0.2%, 6.5% and 7.9%. The funds used for pollution control increased at a rate of 8.6%, as shown in Table 7.
Table 7.
Discharges of major pollutants over the years.
4.2. The Simulated Results by Energy Consumption “Dual Control” Policy
- (1)
- Impacts on elasticity of substitution and energy supply and demand
The impact of the energy consumption “dual control” policy on energy is reflected in the changes in the elasticity of energy substitution, energy consumption, and the relationship between the supply and demand of factors. The energy consumption “dual control” policy changes the substitution elasticity among several types of energy, thereby affecting the long-term trend of the change in the energy demand–supply relationship. The changes in the substitution elasticity among different energy sources are shown in Table 8.
Table 8.
The changes in elasticity of substitution among different energy sources.
It can be seen that the substitution elasticity between coal and oil does not change greatly, while the substitution relationship among coal, oil and clean energy gradually increases, and coal clean energy decreases from 1.6166 in 2025 to 1.6122 in 2035. From 1.5326 in 2025 to 1.5286 in 2035, the energy consumption “dual control” policy has a positive effect on accelerating energy substitutions.
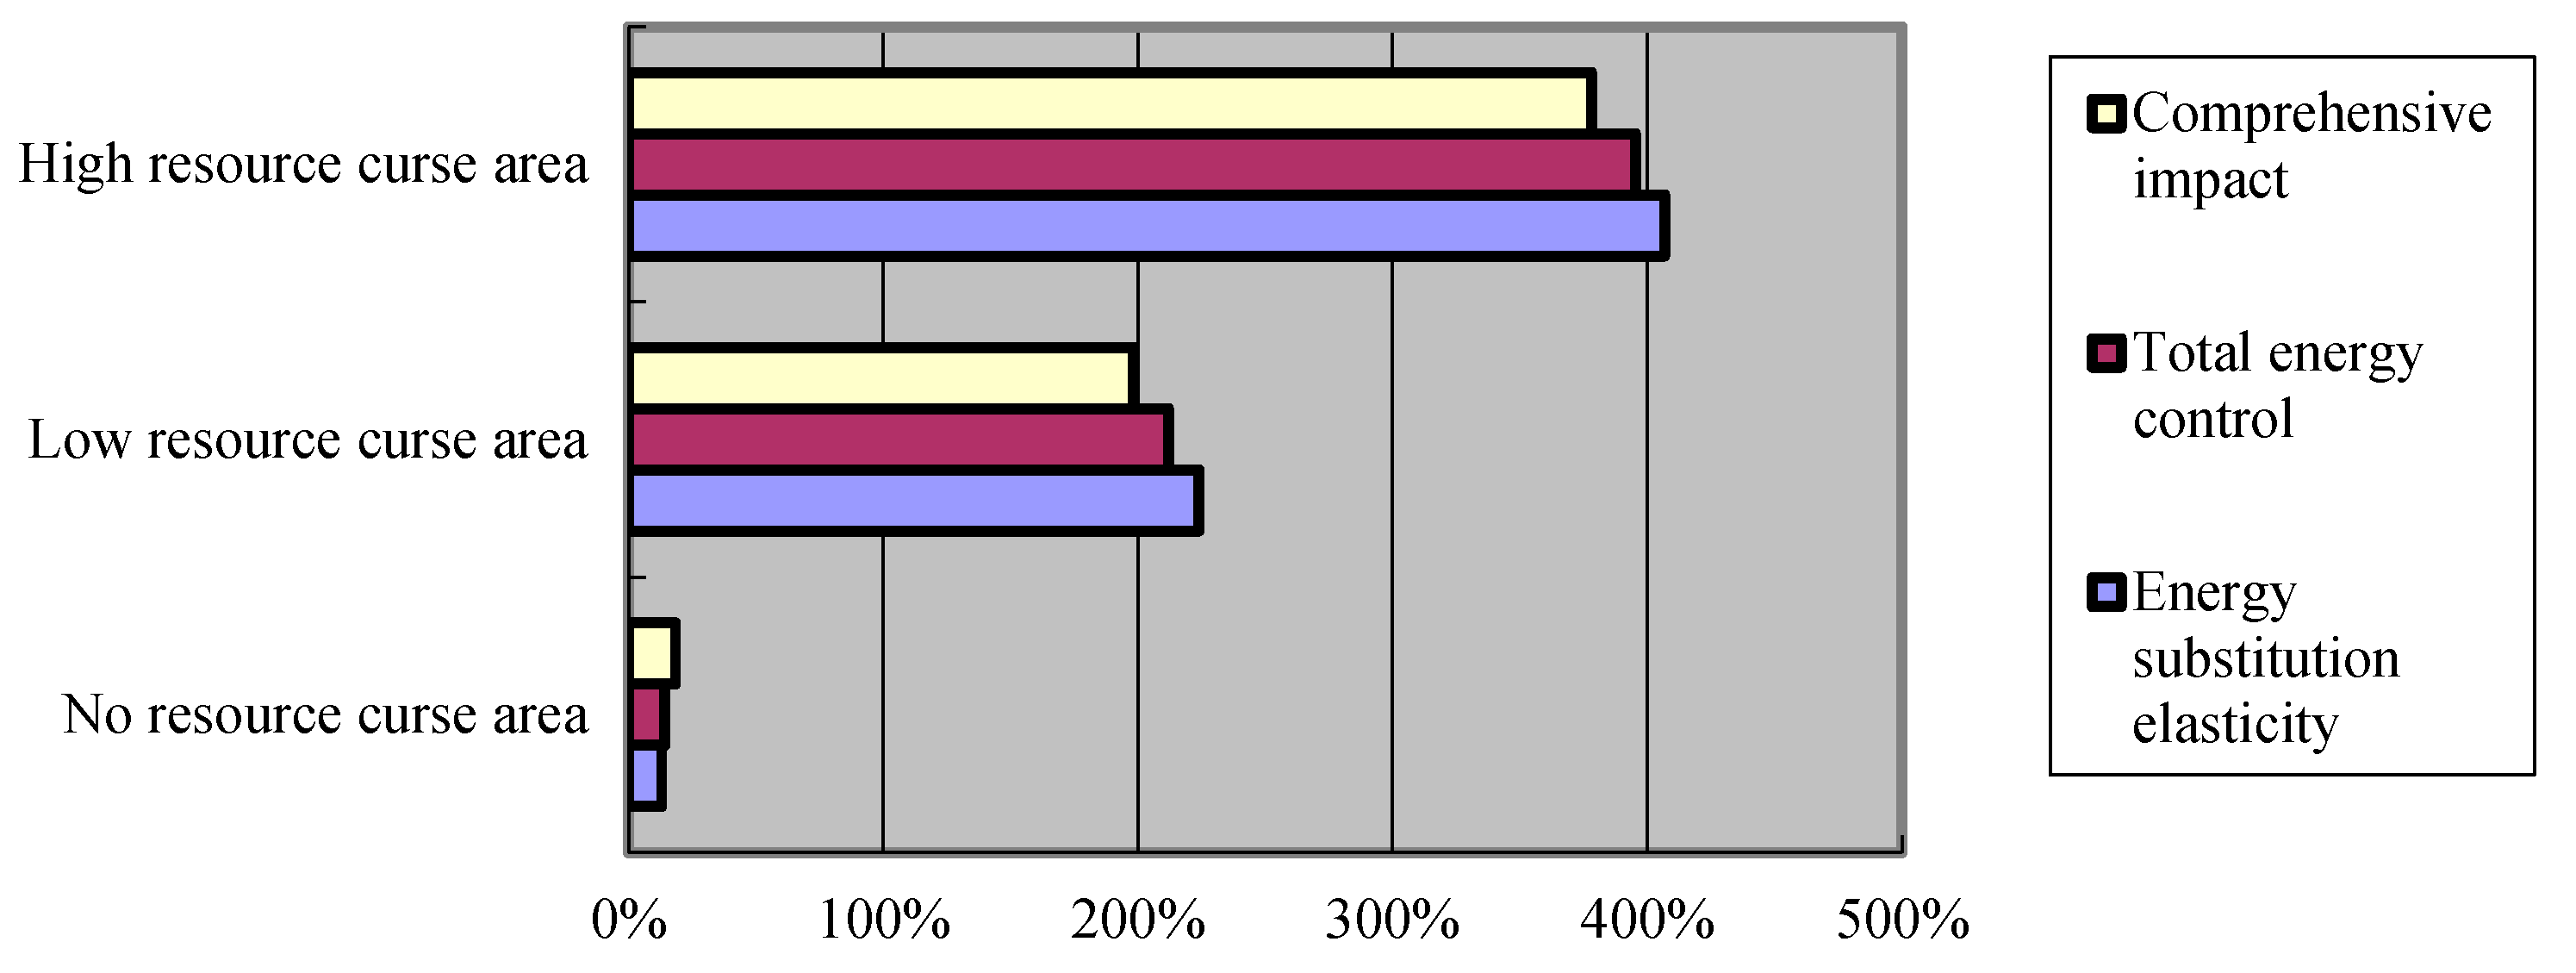
The detailed policies on regional energy consumption vary greatly. Compared with the total energy control, the impact of energy intensity control on regional energy consumption is greater and has more obvious changes in the ratio of energy supply and demand, as shown in Figure 2.
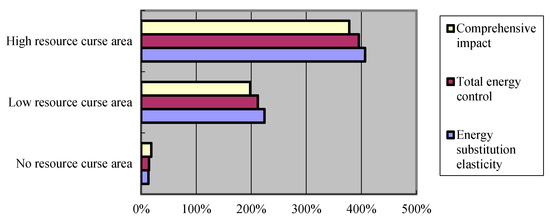
Figure 2.
Changes in the proportion of energy supply and demand in 2035.
Overall, the energy consumption “dual control” policy has a more obvious effect on energy consumption in the areas with no and low “resource curse”. From 2025 to 2035, energy consumption in areas without the “resource curse” will drop by 4.36% and 4.96%, respectively, and energy consumption in areas with high “resource curse” will drop by 1.57% and 1.98%, respectively. The decline in energy consumption in different regions under the control of energy intensity gradually decreased, and the cyclical fluctuation of energy consumption under the control policy of energy intensity decreased, which may be related to the political cycle of Chinese officials. The specific results are shown in Table 9.
Table 9.
The impacts on energy consumption in different regions %.
While the energy consumption “dual control” policy affects the proportion of energy supply and demand, the crowding-out effect of energy on factors such as capital and labor is gradually weakening. When the energy consumption intensity is controlled, the supply-and-demand ratio of capital elements in high “resource curse” areas increases from 80.15% in 2025 to 82.71% in 2035; when the total amount of energy is controlled, the capital element in the high “resource curse” area and the ratio of supply and demand increased by 7.60%, which means that after the implementation of the “dual control” policy, the role of energy input has begun to weaken, the input of capital elements has increased, and the energy consumption of the “dual control” policy has suppressed the crowding-out effect of capital, as shown in Table 10:
Table 10.
The changes in the ratio of supply and demand of capital %.
The impact of the energy consumption “dual control” policy on the supply-and-demand ratio of human capital factors is shown in Figure 3.

Figure 3.
The impact on the supply-and-demand ratio of human capital factors in 2035.
The energy consumption “dual control” policy obviously changed the supply-and-demand ratio of human elements. It is worth mentioning that in the areas without “resource curse”, the ratio of supply and demand of human capital elements varies greatly. The reason may be that the areas without “resource curse”, such as Jiangsu, Shanghai and Zhejiang, are mostly economically developed areas, which are more dependent on energy inputs. The control of energy consumption intensity effectively inhibits the development of high-energy-consuming industries, accelerates the process of industrial restructuring, and further increases the adjustment of the supply-and-demand ratio of human elements.
- (2)
- Impact on regional economic development
The impacts of the GDP growth rate are different in various regions through the energy consumption “dual control” policy. The key indicators such as GDP growth rate, total output and total investment will decline to some degree. The energy consumption “dual control” policy has greater impacts in no and low “resource curse” regions than high “resource curse” regions. In regions without the “resource curse”, GDP growth will drop by 1.15% and 0.88%, respectively, from 2025 to 2035. The total output and total investment will be affected more obviously, and the growth rate will be reduced. From 2025 to 2035, total output will drop by 2.26% and 1.56%, respectively; total investment will drop by 2.01% and 1.78%, respectively. Because the no “resource curse” regions are distributed in the central and eastern regions, which is developed and the demand for energy is large, the energy endowment of the relevant regions is limited, and it needs to be transferred from other regions.
In high “resource curse” regions, the relevant area has little energy demand, and the energy endowment is superior, which belongs to the energy output area. The total output is less affected by the energy consumption “dual control” policy. The GDP growth rate will be from 2025 to 2025. In 2035, it will increase by 0.69% and 0.42%, respectively, and the total investment will increase by 0.56% and 0.27%, respectively, from 2025 to 2035. The impacts of the energy consumption “dual control” policy on economic development are shown in Table 11.
Table 11.
The impacts on the economic development of different regions %.
Taken together, the energy consumption “dual control” policy has suppressed GDP growth and total output. The increase in the cost of energy use leads to lower profit margins and lowers the aggregate demand for consumption. Therefore, the energy consumption “dual control” policy has a significant impact on the growth rate of production and CDP. Since GDP is affected by a combination of factors such as investment, consumption, and import and export, the key indicators such as total output and total investment have fallen sharply, but the impact on long-term GDP growth has gradually weakened.
In detail, the impact of total energy control on the regional economy is smaller than that of the energy consumption intensity control. When energy consumption intensity control is adopted, indicators such as GDP growth rate and total consumption in no “resource curse” areas are less affected. The GDP growth rate will drop by −1.2553% and −0.9712%, respectively, from 2025 to 2035, but the indicators in the high “resource curse” region benefit from the dual control policy, and the GDP growth rate will increase by 0.7762% and 0.5427%, respectively, from 2025 to 2035.
Meanwhile, the impact of the energy consumption “dual control” policy on regional economic growth is quite different. The GDP growth of Shanghai, Jiangsu, Zhejiang, Shandong and Guangdong and other provinces has been significantly affected, and the GDP of some provinces has changed, as shown in Table 12.
Table 12.
The impact on the GDP of various provinces (2035).
In regions, such as Jiangsu, Shanghai, Zhejiang and Guangdong, the demand for energy is stronger, and the “dual control” policy of energy consumption has a negative impact on economic development, resulting in a decline in GDP growth.
- (3)
- Impact on environmental pollution
The energy consumption “dual control” policy has a significant inhibitory effect on the discharge of major pollutants. By 2035, the discharge of wastewater, SO2, CO2 and industrial solid waste will be reduced by more than 5%, as shown in Table 13.
Table 13.
Impacts on main pollutant emissions (2035).
The energy consumption “dual control” policy changes the substitution relationship between different energy sources and reduces the dependence of economic development on energy. At the same time, due to the improvements in energy utilization efficiency, it increases the utilization of emission reduction technologies and reduces CO2 emissions.
Affected by the energy consumption “dual control” policy, carbon emissions in different regions will decrease, as shown in Figure 4. Among them, the carbon emissions in low “resource curse” regions have the greatest decline, while in high “resource curse” regions, the “dual control” policy is conducive to regulating the energy consumption behavior, promote producers to focus on resource conservation, and reduce the discharge of major pollutants.

Figure 4.
The impacts on carbon emissions in different regions (2035).
- (4)
- Changes in regional “Resource Curse”
The energy consumption “dual control” policy directly regulates the relationship between energy supply and demand, which, in turn, affects the mode of economic growth and changes the regional “resource curse” coefficient. The area of “resource curse” has dropped significantly. The coefficient of “resource curse” in Anhui and Chongqing has changed from greater than 1 to less than 1, and the coefficient of “resource curse” has changed from greater than 1 to less than 1 in Jilin and Ningxia. The “dual control” policy has effectively alleviated the current dilemma of China’s regional “resource curse”. The changes in the regional “resource curse” coefficient (2035) are shown in Table 14.
Table 14.
Changes in the coefficient of “resource curse” in various provinces in China.
5. Conclusions
In this study, a dynamic CGE model is constructed to simulate the impact of the energy consumption “dual control” policy on China’s regional economic development, emission reduction and environmental pollution and, further, to analyze the changes in China’s “resource curse” areas. This study found the following: (1) The substitution elasticity between coal and oil did not change after the energy consumption “dual control” policy, while the substitution relationship among coal, oil and clean energy gradually increased, indicating that the energy consumption “dual control” policy has an effect on accelerating energy substitution. Under this condition, a comprehensive evaluation considering consumption-based and income-based perspectives is needed in future (Wen Wen, 2024) [47]. (2) The energy consumption “dual control” policy has restrained the GDP growth to a certain extent, and the total output and total investment have declined significantly, but the impact on the economic development is quite different. The effect of total energy control on regional economic development is smaller than that of energy consumption intensity control. (3) The energy consumption “dual control” policy has a significant inhibitory effect on the emissions of major pollutants, and carbon emissions will decrease. This conclusion is consistent with the current research viewpoint, which showed that environmental regulation can significantly promote the transition of clean energy consumption (Jinlong Shen, 2024) [48]. (4) The energy consumption “dual control” policy has played a positive role in breaking the regional “resource curse”. The areas with high and the low “resource curse” have become smaller, and the areas without the “resource curse” have increased significantly. Meanwhile, the findings also support the effectiveness of interventions for reductions in energy consumption (Florian Lange, 2024) [49].
This study gave some suggestions as follows: (1) Increase the flexibility of the “dual control” policy of energy consumption. Due to the strong dependence of China’s economy on energy, the “dual control” policy of energy consumption has a significant impact on regional economic development. Energy consumption standards and targets should be set according to industry characteristics and regional development levels. And differentiated energy consumption control strategies are also implemented by industry and region-based regions. For energy-intensive industries, stricter energy consumption standards should be established, while encouraging these industries to adopt new technologies and processes for energy-saving retrofits. For renewable energy projects, more support is needed to promote green development. (2) Establish an energy consumption budget management system. The carbon emission budget management systems at the provincial and municipal levels are a useful tool for promoting annual analyses and the target forecasting of carbon emission situations. The government should make rules for key industries to establish annual energy consumption budgets through regulation policy and manage energy use according to the budget. Speed up energy usage rights trading, to incentive companies to reduce costs by improving energy efficiency and reducing energy consumption. (3) Accelerate the establishment of a carbon footprint management system. Rules and standards for carbon footprint accounting should be clearly established, and companies should be encouraged to conduct carbon footprint accounting and improve market competitiveness through certification systems, such as carbon labeling. Meanwhile, the government should incentivize consumer choices towards low-carbon products and promote green consumption.
The research limitations and future scope include the following: (1) The transition from energy consumption dual control to carbon emission dual control policies increases the complexity of the model, and the new trend of policy changes in the future must be considered in CGE models. (2) Technological changes should be incorporated to affect the accuracy of the model’s predictions. For example, utilizing satellite remote sensing data to monitor and assess energy consumption and carbon emissions enhances the objectivity and precision of the data for CGE models.
Funding
This research was funded by the Chinese National Social Science Foundation (Grant No. 16CJY024), “Star of Zijin”, “Program for Young Principal Investigators” of Nanjing University of Science and Technology, Base of service-oriented Government Construction Research, Major Projects of Philosophy and Social Sciences in Universities of Jiangsu Province (Grant No. 2020SJZDA050) and Excellent young scientist foundation of Jiangsu Province.
Data Availability Statement
The original contributions presented in the study are included in the article, further inquiries can be directed to the corresponding author.
Conflicts of Interest
The author declares no conflicts of interest.
References
- Mignone, B.K.; Clarke, L.; Edmonds, J.A.; Gurgel, A.; Herzog, H.; Johnson, J.X.; Mallapragada, D.S.; McJeon, H.; Morris, J.; O’Rourke, P.R.; et al. Drivers and implications of alternative routes to fuels decarbonization in net-zero energy systems. Nat. Commun. 2024, 15, 3938. [Google Scholar] [CrossRef] [PubMed]
- Li, Y.; Sun, L.; Zhang, H.; Liu, T.; Fang, K. Does industrial transfer within urban agglomerations promote dual control of total energy consumption and energy intensity? J. Clean. Prod. 2018, 204, 607–617. [Google Scholar] [CrossRef]
- Hashemizadeh, A.; Ju, Y.; Abadi, F.Z.B. Policy design for renewable energy development based on government support: A system dynamics model. Appl. Energy 2024, 376, 124331. [Google Scholar] [CrossRef]
- Xu, A.; Song, M.; Wu, Y.; Luo, Y.; Zhu, Y.; Qiu, K. Effects of new urbanization on China’s carbon emissions: A quasi-natural experiment based on the improved PSM-DID model. Technol. Forecast. Soc. Chang. 2024, 200, 123164. [Google Scholar] [CrossRef]
- Zhen, W.; Yupeng, T.; Shuang, W.; Hong, C. Does green finance expand China’s green development space? Evidence from the ecological environment improvement perspective. Systems 2023, 11, 369. [Google Scholar] [CrossRef]
- Zhu, H.; Cao, S.; Su, Z.; Zhuang, Y. China’s future energy vision: Multi-scenario simulation based on energy consumption structure under dual carbon targets. Energy 2024, 301, 131751. [Google Scholar] [CrossRef]
- Zou, T.; Li, F.; Guo, P. Advancing effective energy transition: The effects and mechanisms of China’s dual-pilot energy policies. Energy 2024, 307, 132538. [Google Scholar] [CrossRef]
- Du, H.; Chen, Z.; Zhang, Z.; Southworth, F. The rebound effect on energy efficiency improvements in China’s transportation sector: A CGE analysis. J. Manag. Sci. Eng. 2020, 5, 249–263. [Google Scholar] [CrossRef]
- Pradhan, B.K.; Ghosh, J. A computable general equilibrium (CGE) assessment of technological progress and carbon pricing in India’s green energy transition via furthering its renewable capacity. Energy Econ. 2022, 106, 105788. [Google Scholar] [CrossRef]
- Zhao, X.; Hu, S.; Wang, H.; Chen, H.; Zhang, W.; Lu, W. Energy, economic, and environmental impacts of electricity market-oriented reform and the carbon emissions trading: A recursive dynamic CGE model in China. Energy 2024, 298, 131416. [Google Scholar]
- Mardones, C. Contribution of the carbon tax, phase-out of thermoelectric power plants, and renewable energy subsidies for the decarbonization of Chile—A CGE model and microsimulations approach. J. Environ. Manag. 2024, 352, 120017. [Google Scholar] [CrossRef] [PubMed]
- Gao, Z.; Zhao, Y.; Li, L.; Hao, Y. Economic effects of sustainable energy technology progress under carbon reduction targets: An analysis based on a dynamic multi-regional CGE model. Appl. Energy 2024, 363, 123071. [Google Scholar] [CrossRef]
- Sachs, J.D.; Warner, A.M. Natural Resource Abundance and Economic Growth; Center for International Development and Harvard Institute for International Development, Harvard University: Cambridge, MA, USA, 1997. [Google Scholar]
- Auty, R.M. Resource Abundance and Economic Development; Oxford University Press: Oxford, UK, 2001. [Google Scholar]
- Funk, C.; Treviño, L.J.; Oriaifo, J. Resource curse impacts on the co-evolution of emerging economy institutions and firm internationalization. Int. Bus. Rev. 2020, 30, 101753. [Google Scholar] [CrossRef]
- Bonet-Morón, J.; Pérez-Valbuena, G.J.; Marín-Llanes, L. Oil shocks and subnational public investment: The role of institutions in regional resource curse. Energy Econ. 2020, 92, 105002. [Google Scholar] [CrossRef]
- Wei, H.; Rizvi, S.K.A.; Ahmad, F.; Zhang, Y. Resource cursed or resource blessed? The role of investment and energy prices in G7 countries. Resour. Policy 2020, 67, 101663. [Google Scholar] [CrossRef]
- Wong, C.-S. Science mapping: A scientometric review on resource curses, Dutch diseases, and conflict resources during 1993–2020. Energies 2021, 14, 4573. [Google Scholar] [CrossRef]
- Leonard, A.; Ahsan, A.; Charbonnier, F.; Hirmer, S. The resource curse in renewable energy: A framework for risk assessment. Energy Strategy Rev. 2022, 41, 100841. [Google Scholar] [CrossRef]
- Ajide, K.B. Is natural resource curse thesis an empirical regularity for economic complexity in Africa? Resour. Policy 2022, 76, 102755. [Google Scholar] [CrossRef]
- Sun, X.; Ren, J.; Wang, Y. The impact of resource taxation on resource curse: Evidence from Chinese resource tax policy. Resour. Policy 2022, 78, 102883. [Google Scholar] [CrossRef]
- Xu, K.; Wang, J. Research on the relationship between the abundance of natural resources and the level of economic development. Econ. Res. 2006, 41, 78–89. [Google Scholar]
- Shao, S.; Yang, L. Natural resource development, endogenous technological progress and regional economic growth. Econ. Res. 2011, 46, 112–123. [Google Scholar]
- Yu, X.; Li, Y.; Chen, H.; Li, C. The impact of environmental regulation and energy endowment on regional carbon emissions from the perspective of “resource curse”. China Popul. Resour. Environ. 2019, 29, 52–60. [Google Scholar]
- Xue, Y.; Zhang, J.; Yun, L. Resource industry research on spatial agglomeration, extraction of conducting elements and the mediating effect of “resource curse”. China Manag. Sci. 2019, 27, 179–190. [Google Scholar]
- Zhao, W.; Bai, X.; Zheng, J. Is there a “resource curse” effect in R&D investment? Sci. Res. 2019, 37, 2176–2193+2304. [Google Scholar]
- Huang, Q.; Ma, L. Heterogeneous effects of environmental regulation in breaking the resource curse. China Environ. Sci. 2021, 41, 3453–3462. [Google Scholar]
- Xiong, R.; Wu, J. Has the government provided public services under the curse of resources? Financ. Trade Econ. 2020, 41, 19–34. [Google Scholar]
- Liang, Z.; Li, Z. Resource endowment and social intergenerational mobility: An empirical test of the resource curse hypothesis. China Popul. Resour. Environ. 2019, 29, 158–166. [Google Scholar]
- Ang, B.W. Is the energy intensity a less useful indicator than the carbon factor in the study of climate change? Energy Policy 1999, 27, 943–946. [Google Scholar] [CrossRef]
- Shen, X.; Chen, Y.; Lin, B. The impact of technological progress and industrial structure distortion on China’s energy intensity. Econ. Res. 2021, 56, 157–173. [Google Scholar]
- Bella, G.; Massidda, C.; Mattana, P. The relationship among CO2 emissions, electricity power consumption and GDP in OECD countries. Energy Policy 2014, 36, 970–985. [Google Scholar] [CrossRef]
- Cang, D.; Wei, X.; Cao, M.; Tan, L. Research on two-stage economic growth path based on energy substitution and environmental pollution control. China Manag. Sci. 2020, 28, 146–153. [Google Scholar]
- Ma, L.; Zhang, X. Spatial effect of haze pollution in China and its impact on economy and energy structure. China Ind. Econ. 2014, 4, 19–31. [Google Scholar]
- Zhou, P.; Ang, B.W.; Han, J. Total factor carbon emission performance: A Malmquist index analysis. Energy Econ. 2010, 32, 194–201. [Google Scholar] [CrossRef]
- Dai, Y.; Lu, B.; Feng, C. “Thirteenth Five-Year Plan”: China’s total energy consumption control and energy conservation. J. Beijing Inst. Technol. (Soc. Sci. Ed.) 2015, 7, 1–7. [Google Scholar]
- Wei, Y.; Liao, H. “Twelfth Five-Year” China’s energy and carbon emissions forecast and development. Proc. Chin. Acad. Sci. 2011, 26, 150–153. [Google Scholar]
- Zhang, W.; Zhu, Q.; Gao, H. Industrial structure upgrading, energy structure optimization and low-carbon development of industrial system. Econ. Res. 2016, 51, 62–75. [Google Scholar]
- Fan, Y.; Yi, B. Laws of energy transformation, driving mechanisms and China’s path. Manag. World 2021, 37, 95–105. [Google Scholar]
- Zheng, X.; Wu, S.; Li, F. Changes in economic structure and the future trend of China’s energy demand. Chin. Soc. Sci. 2019, 3, 92–112+206. [Google Scholar]
- Yang, M.; Xu, J.; Yang, F. Energy price fluctuation, dynamic accumulation of energy-efficient capital and capital-energy substitution relationship. Syst. Eng. Theory Pract. 2021, 41, 2284–2299. [Google Scholar]
- Li, H.; Xiong, Z. Ecological occupation, green development and environmental tax reform. Econ. Res. 2017, 52, 124–138. [Google Scholar]
- Liu, Z.; Ling, Y. Structural transformation, total factor productivity and high-quality development. Manag. World 2020, 36, 15–29. [Google Scholar]
- Xu, S.; Zhang, W. Impact of carbon tax on China’s economy and emission reduction effect under different rebate scenarios: Simulation analysis based on dynamic CGE. China Popul. Resour. Environ. 2016, 26, 46–54. [Google Scholar]
- Shi, M. The realization path and mechanism design of ecological product value. Environ. Econ. Res. 2021, 6, 1–6. [Google Scholar]
- Zhang, Z.; Zhang, G. The evolutionary logic of cooperation between local governments to control haze—A case study based on the joint prevention and control mechanism of air pollution. Environ. Econ. Res. 2021, 6, 97–114. [Google Scholar]
- Wen, W.; Yang, S.; Tang, Y.; Zhang, X.; Hu, Y.; Ben, Y.; Shen, Q. Evaluating carbon emissions reduction compliance based on ‘dual control’ policies of energy consumption and carbon emissions in China. J. Environ. Manag. 2024, 367, 121990. [Google Scholar] [CrossRef]
- Shen, J.; Zhang, Y.; Chen, X. Environmental regulation and energy consumption transition of rural residents: A case of China. Energy 2024, 310, 133195. [Google Scholar] [CrossRef]
- Lange, F.; Van Asbroeck, R.; Van Baelen, D.; Dewitte, S. For cash, the planet, or for both: Evaluating an informational intervention for energy consumption reduction. Energy Policy 2024, 194, 114314. [Google Scholar] [CrossRef]


Disclaimer/Publisher’s Note: The statements, opinions and data contained in all publications are solely those of the individual author(s) and contributor(s) and not of MDPI and/or the editor(s). MDPI and/or the editor(s) disclaim responsibility for any injury to people or property resulting from any ideas, methods, instructions or products referred to in the content. |
© 2024 by the author. Licensee MDPI, Basel, Switzerland. This article is an open access article distributed under the terms and conditions of the Creative Commons Attribution (CC BY) license (https://creativecommons.org/licenses/by/4.0/).