Abstract
Based on the perspective of joint operation between coal power enterprises and new energy power enterprises (JOCN), this paper constructs an evolutionary game model among coal power enterprises (CPEs), new energy power enterprises (NEPEs) and the government, and analyzes the influencing factors of the final strategy choices of various subjects through evolutionary simulation. The results show that: (1) The game among CPEs, NEPEs and the government in JOCN is a win–win game. (2) The probability of CPEs choosing to participate in the joint operation is positively correlated with additional operating income, government subsidies and environmental costs in coal power generation, while negatively correlated with additional operating costs and spillover effects. (3) The probability of NEPEs choosing to participate in the joint operation is positively correlated with additional operating income, government subsidies and the cost of power loss in new energy power generation, while negatively correlated with additional operating costs and spillover effects. (4) The probability of the government choosing to support joint operation is positively correlated with social welfare, and negatively correlated with the cost of governmental strict supervision. The research results can provide theoretical reference for enterprises and the government in the future transformations and policy formulation.
1. Introduction
The National Development and Reform Commission and the National Energy Administration have issued an “Implementation Plan for Promoting High-quality Development of New Energy in the New Era”, which calls for encouraging coal power enterprises (CPEs) to carry out a joint operation with new energy power enterprises (NEPEs) in order to promote a combination of coal and new energy (National Development and Reform Commission, 2022). To build a clean, low-carbon, safe and efficient new power system, it is necessary to accelerate the integration of coal power enterprises and new energy power enterprises. However, CPE-NEPE partnerships, as a new type of joint operation, are not yet mature and are still in the exploration stage.
“Joint Operation between Coal Power Enterprise and New Energy Power Enterprise (JOCN)” presents a development model that integrates multiple industries, with CPE aiming for clean, efficient, flexible, and foundational development, and NEPE focusing on system support. It actively explores coupled development models such as “coal power + new energy” [1]. Joint operation can achieve economies of scale in the energy industry and reduce operating costs; it can also promote industrial synergy and enhance the stability and risk resistance of the energy system. During the process of energy transition, if CPE and NEPE operate independently with investments that maximize their own interests, it may lead to investment imbalances and the loss of social welfare [2]. Under the layout of a joint operation, based on maximizing the interests of joint venture enterprises, a reasonable effective installed capacity can be formed through the flexible transformation of coal-fired units and the interconnection of adjacent power grids.
In terms of supervision, CPEs can rent capacity from NEPE stations to avoid the risks of unstable revenue from auxiliary services caused by market fluctuations. In terms of cost allocation, a joint operation will distribute the fixed costs and system costs of NEPEs to CPEs [3]. When the marginal cost of NEPEs is lower than that of CPEs, the orderly transition of energy and energy conservation can be achieved. In terms of low-carbon development, NEPEs can replace part of the coal consumption quota of CPE projects through their carbon reduction effects, as well as deepen the binding of CPE carbon emissions rights and NEPE green value to reduce the production costs of CPEs and shape a stable coal power market. To meet the requirements of sustainable energy development and energy supply, a joint operation between coal power enterprise and new energy power enterprise (JOCN) is one of the most effective root-cause strategies for energy low-carbon transformation.
In the context of energy decarbonization, CPEs, NEPEs, and the government are not entirely rational, and information is not fully transparent. Therefore, traditional game theory models are not suitable for modeling in this article. However, the evolutionary game theory model overcomes these shortcomings. It does not require the participants to be fully rational, nor does it require complete information symmetry. Evolutionary game theory is a theory that studies the dynamic process of a group over time, trying to explain how the group evolved to its current state. The factors that influence group evolution have both random and disruptive elements, as well as evolutionary regularities that emerge through the selection process [4]. The core of evolutionary game theory analysis is not the optimal strategy choice of individual players, but the adjustment process, evolutionary trend, and stability of the group members’ strategic choices [5]. Therefore, this article uses an evolutionary game theory model to construct a model of CPEs and NEPEs under government supervision in the context of energy decarbonization. Using MATLAB R2021a, the article simulates the evolutionary trends in different strategy combinations and parameter changes in the game subjects, trying to clarify the cooperation mechanism of JOCN under government supervision.
2. Literature Review
Research on government participation in energy structure adjustment has been a focus of the past decade, but there has been little analysis of the bargaining relationship between CPEs and NEPEs. A large amount of the literature is concentrated on quantitative studies of government participation in energy structure adjustment, the coordinated development of traditional energy and new energy, and the analysis of energy transition by using evolutionary game theory.
The relevant literature on the research subject of this article is mainly focused on the following aspects: how the government supports the development of new energy industry, the coordinated development of traditional energy and new energy, and the application of evolutionary game theory in energy transition.
First, how the government supports the development of new energy industry. Lawrenee compared the impact of government taxation on traditional energy and new energy, and found that tax policies can promote the development of new energy industry [6]. By constructing a CGE model containing coal resource tax, Tang indicated that policy reform will drive changes in the energy structure [7]. Nicolini showed that energy subsidy policies can effectively promote the development of renewable energy both in the long and the short term [8]. Zhang proposed a real options model to estimate the optimal subsidy for renewable energy projects to promote competition in the renewable energy industry [9]. Zhou believed that government subsidies have a promoting effect on the new energy industry, but should pay attention to the problem of homogeneous overcapacity caused by subsidies [10].
Second, the coordinated development of traditional energy and new energy. Fischer proposed that in the clean utilization of traditional energy and new energy power generation, the government’s policies include carbon trading markets, market allocation systems, carbon emission restrictions and government subsidies [11]. Sun constructed a three-stage game model among the government, CPEs and NEPEs to analyze the optimal solutions of the government subsidies and support prices in R&D for NEPE [12]. CAI studied the impact of parameter changes, such as government subsidies, the green degree of traditional energy and new energy products, and others, on the government and enterprises. By constructing a four-stage game model of production and consumption, Sun analyzed the optimal price and social welfare difference under the three modes of new energy subsidies (government, CPE and consumers) [13]. Zhao explored the cooperative and competitive relationship between the traditional energy industry and the new energy industry under the participation of the government by constructing two evolutionary game models: government and energy industry, and traditional energy industry and new energy industry [14].
Third, the application of evolutionary game theory in energy transition. Liu showed that the government and enterprises developing the new energy industry is a Nash equilibrium strategy combination, and government subsidies, technological innovation, and other factors will affect the development of new energy industry [15]. Zhang used evolutionary game theory to analyze the role of the government in new energy industry investment. The study showed that the government needs to play a guiding and supporting role in the early stage of new energy development, and the government and market should be switched in a timely manner at a later stage [16]. By constructing an evolutionary game model between enterprises and the government, Zheng studied the government’s policy support for new energy financing and investment in the context of new urbanization [17]. Chai built an evolutionary game model between the government and power generation enterprises, and the research showed that government subsidies promote the energy structure transformation of power generation enterprises. The proportion of renewable and clean energy utilization capacity depended on the expected benefits of the two energy sources, as well as the two types of government subsidies and the environmental benefits they bring [18].
In summary, this article attempts to construct an evolutionary game model among the coal-fired power industry, the new energy power industry, and the government, analyzing the impact of government intervention on the strategic choices of CPE and NEPE, searching for stable evolutionary game strategies, and exploring the possibility and development direction of JOCN to fill the gap in the literature.
3. Basic Assumptions and Model Construction
This article constructs a three-agents evolutionary game model of JOCN under government supervision, with the logical relationship between the entities shown in Figure 1.
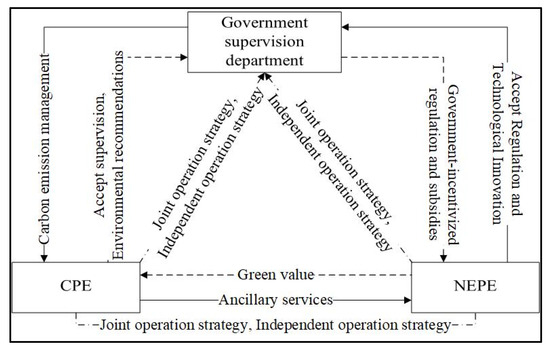
Figure 1.
Logical relationship diagram of a three-agents evolutionary game model.
The promotion of joint operation cannot be separated from the involvement of the government. In the process of energy transition, if CPEs and NEPEs are independently operated with investments that maximize their own interests, this will cause investment imbalances and the loss of social welfare. Therefore, the strict supervision and incentive measures of the government are particularly important. The government constrains CPEs through carbon emissions, manages NEPEs through subsidies and a renewable energy quota system, and incentivizes CPEs and NEPEs to form a joint operation. The low-cost supervision capacity provided by CPEs helps to absorb that of NEPEs. The green value and carbon reduction effect provided by NEPEs help to expand the profit channels and realize the long-term, low-cost, environmental value of CPEs.
3.1. Basic Assumptions
Based on the evolutionary game method, this article analyzes the interest conflict and the optimal choice among CPEs, NEPE sand government supervision [19,20,21,22,23]. We put forward the following assumptions:
Assumption 1.
The participants in the game include CPE, NEPE, and the government. All the agents in the game are rationally bounded, and their strategy choices tend to be stable and optimal over time. The agents all adopt two strategies: CPEs adopt a joint operation or non-joint operation; NEPEs adopt a joint operation or non-joint operation; and the government adopts strict supervision or loose supervision. It is assumed that CPEs choose joint operation with a probability of , then non-joint operation with , while NEPEs choose joint operation with a probability of , then non-joint operation with ; the government chooses strict supervision with a probability of , then loose supervision with . The value ranges of are [0, 1].
Assumption 2.
If the benefits of the joint operation for the game participants are less than their benefits gained from not participating, they will choose non-joint operation. CPEs and NEPEs pursue the maximization of corporate interests. CPEs and NEPEs will effectively alleviate the contradiction in the utilization of multiple energy categories, and effectively improve the operating losses of CPEs. The government will pursue the maximization of public interest [22].
3.2. Model Construction
According to the above research assumptions, the game model provides the payoff matrices for CPEs, NEPEs, and the government in their strategic behaviors [24,25,26,27,28]. The meanings of relevant parameters and symbols are explained in Table 1, and the evolutionary game payoff matrix is shown in Table 2.

Table 1.
Parameter settings and symbol explanations.

Table 2.
The payoff matrices of CPE, NEPE, and the government.
CPEs obtain the additional operating income through joint operation, which is denoted as ; the additional operating cost is denoted as . If CPEs choose joint operation, the additional subsidy provided by the government under strict supervision is denoted as . If CPEs choose non-joint operation, the spillover benefits to the CPEs caused by the NEPEs choosing joint operation is denoted as .
NEPEs establish a profit-sharing mechanism between CPE and NEPE within the joint operation. The additional operating income of joint operation is denoted as , and the additional cost is denoted as . Under strict supervision, the government provides an additional subsidy, denoted as . If NEPEs choose joint operation, the social welfare is represented by , otherwise, the spillover benefits to the NEPEs caused by the CPEs choosing joint operation is represented by .
Under the strict supervision, the government will order NEPEs that have chosen non-joint operation to rectify this, where the government’s strict supervision cost is denoted as . If both CPEs and NEPEs choose joint operation, it will better promote the optimal combination of coal power and new energy, jointly promoting China’s energy transformation; the social welfare is represented by . If neither agent chooses, social welfare is represented by .
If CPE chooses non-joint operation, the environmental cost and clean transformation cost caused by its carbon emissions is denoted as ; If NEPE chooses non-joint operation, the cost of power loss caused by its intermittent and difficult consumption is denoted as .
3.3. Evolutionary Game Analysis
① Building the replication dynamic equations
Due to the asymmetric information acquisition among CPEs, NEPEs and the government, the three agents will constantly learn through trial and error, and adjust their strategies by adjusting . Let represent the average expected returns of CPEs, NEPEs, and government, respectively [29,30,31,32].
<1> The average expected return of CPEs is expressed as:
where is the average return of a CPE when it chooses joint operation; is the average return of a CPE when it chooses non-joint operation, which can be obtained as follows:
According to the Malthusian dynamic equation, the replication dynamic equation for CPEs is:
When , , in which case x can take any value, and the CPE’s strategy choice is in a stable state.
When , , , in which case x = 1 is an evolutionary equilibrium point, and the strategic choice of the CPE is joint operation.
When , , , in which case x = 0 is the evolutionary equilibrium point, and the strategic choice of the CPE is non-joint operation.
Based on the assumption mentioned earlier (): The environmental cost and clean transformation cost caused by carbon emissions of the CPE will increase if it chooses non-joint operation. Therefore, it can be concluded from the above analysis that by reducing the additional operating cost incurred by the CPE, increasing the additional operating income through joint operation, or increasing additional subsidies provided by the government under the strict supervision, it is possible to make x tend to 1 [26,33].
<2> Similarly, the replication dynamic equation for a NEPE can be obtained as follows:
when , , in which case y can take any value, and the NEPE’s strategy choice is in a stable state.
When , , , in which case y = 1 is an evolutionary equilibrium point, and the strategic choice of the NEPE is joint operation.
When , , , in which case y = 0 is the evolutionary equilibrium point, and the strategic choice of the NEPE is non-joint operation.
Based on the assumption mentioned earlier (): the cost of power loss caused by the intermittent and difficult consumption of the NEPE will increase if it chooses non-joint operation. Therefore, from the above analysis, it can be concluded that by increasing the additional operating income and cost of the NEPE through joint operation, or increasing additional subsidies provided by the government under the strict supervision, can make y tend to 1.
<3> The replication dynamic equation for government can be obtained as follows:
When , , in which case z can take any value, and the government’s strategy choice is in a stable state.
When , , , in which case z = 1 is an evolutionary equilibrium point, and the strategic choice of the government is strict supervision.
When , , , in which case z = 0 is an evolutionary equilibrium point, and the strategic choice of the government is loose supervision.
From the above analysis, reducing the strict supervision cost of government for a NEPE choosing non-joint operation, and increasing social welfare after joint operation can cause z to tend to 1.
② Stability analysis of evolutionary games
The Jacobian matrix J of system in this article is obtained by partial derivation of respectively, as shown in Equation (7).
According to Lyapunov indirect method, the stability of the eight pure strategy equilibrium points in the evolutionary system is analyzed. If all the eigenvalues of the equilibrium point are negative, then the equilibrium point is the system evolution stability strategy (ESS). If at least one eigenvalue is greater than 0, it is an unstable point. If there is an eigenvalue that is 0, the equilibrium point is a saddle point.
By setting the evolutionary game system equal to 0 simultaneously, we obtain eight equilibrium points, namely (0, 0, 0), (0, 0, 1), (0, 1, 0), (0, 1, 1), (1, 0, 0), (1, 0, 1), (1, 1, 0), and (1, 1, 1). The stability analysis of the eight pure strategy equilibrium points is shown in Table 3.

Table 3.
Stability analysis of equilibrium points in game system.
Based on the above assumptions, it can be seen from Table 3 that have positive eigenvalues, which are unstable points. have an eigenvalue of 0, which is a saddle point. Therefore, cannot be the evolutionary stability strategy in this article. We will analyze separately [34,35,36].
<1> According to Table 3, the Jacobian matrix of the system at is:
To make as an asymptotically stable point, Equation (8) needs to be satisfied , , . To meet and , it requires increasing the costs and reducing the additional operating income of joint operation, reducing the cost of CPE’s clean transformation and the cost of NEPE’s power loss, which are obviously unreasonable. Therefore, the situation will not be discussed.
<2> For the equilibrium point , the Jacobian matrix is:
Similarly, to make an asymptotically stable point, Equation (9) needs to be satisfied , , . It requires increasing the additional cost when an NEPE chooses joint operation, increasing the spillover benefits to the CPE caused by NEPE choosing joint operation while CPE chooses non-joint operation, and reducing the additional operating income and the cost of power loss in joint operation of NEPE, which are unreasonable, too. Therefore, the situation will not be discussed.
<3> For equilibrium point , the Jacobian matrix is:
If Equation (10) satisfied , , , then is an asymptotic stable point. This indicates that when the sum of the additional operating income of the CPE, the environmental costs caused by the CPE’s carbon emissions, and the additional subsidies provided by the government are higher than the sum of the additional operating cost of the CPE and the spillover benefits of the NEPE, as well as when the sum of the additional operating income of the NEPE, the cost of power loss of the NEPE, and the additional subsidies provided by government are higher than the sum of the additional cost of the NEPE and the spillover benefits of the CPE, the strategy combination evolution will be stable at . This achieves the Pareto optimal state of “CPE choosing joint operation, NEPE choosing joint operation, and government implementing strict supervision”.
4. Simulation Analysis
To further explore the problem, this article conducts numerical simulation analysis, using MATLAB for the Pareto optimal state combination mentioned above, in order to verify the effectiveness of evolutionary game stability analysis and the sensitivity of each agent to parameters [24,28,33,34,37,38].
4.1. Evolutionarily Stable Strategy
Under the condition of satisfying the parameter setting conditions of Pareto optimality, this article considers the actual situation and relevant expert opinions comprehensively, and the initial values of the parameters are as follows: , , , . The above parameters are brought into the tripartite game evolution system, and numerical simulation analysis is conducted with MATLAB R2021a software. The results are shown in Figure 2.
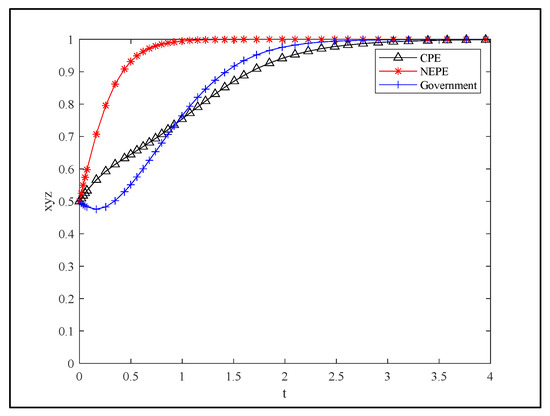
Figure 2.
Parameter evolution simulation results.
Figure 2 illustrates the evolutionary trend in the tripartite game under joint operation, where it can be seen that the initial NEPE had a stronger inclination to choose joint operation due to the low-cost supervision value of the CPE. The government initially preferred a loose supervision strategy, and as the other two entities’ willingness to choose joint operation increased, the government’s willingness to choose a strict supervision strategy is also increased. When the NEPE evolved to joint operation, the government’s rate of choosing strict supervision was faster than that of CPE choosing joint operation. Figure 2 shows that the system ultimately tends towards the ideal state of (1, 1, 1), where the CPE chooses joint operation, the NEPE chooses joint operation, and the government implements strict supervision, indicating the validity of the conclusion.
4.2. Influence Mechanism of Parameter Changes on System Evolution
In order to enable the CPE, the NEPE and the government to make the above strategic choices to promote the maximization of social welfare, it is necessary to further analyze the influencing factors of their decision-making and the mechanisms of the system’s evolution under the influence of various parameters.
① The influence of additional operating incomes of the CPE and the NEPE through joint operation on system evolution:
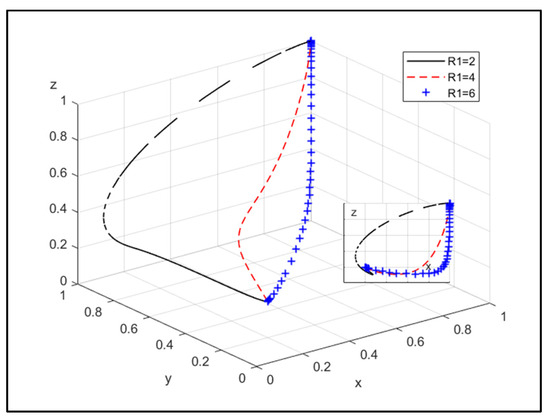
Figure 3.
The influence of the additional operating income of the CPE choosing joint operation.
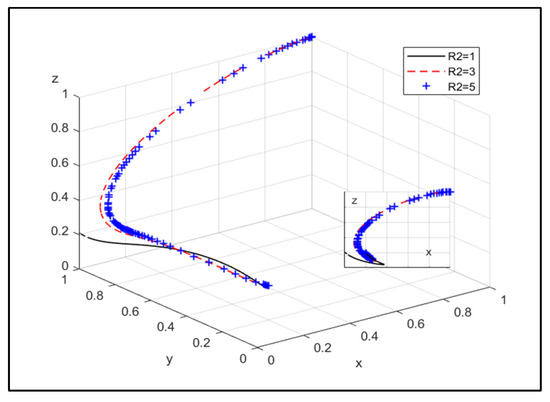
Figure 4.
The influence of the additional operating income of the NEPE choosing joint operation.
Figure 3 shows that with the increase in additional operating income that the CPE can obtain through joint operation, its willingness to choose joint operation becomes stronger, and government is more willing to choose strict supervision.
Figure 4 shows that with the increase in additional operating income that the NEPE can obtain through joint operation, its willingness to choose joint operation becomes stronger, and the government has a greater willingness to choose strict supervision.
Therefore, increasing the additional operating income of the CPE and the NEPE after joint operation can promote the probability of joint operation between the CPE and the NEPE.
② The influence of additional cost of CPE and NEPE through joint operation on system evolution:
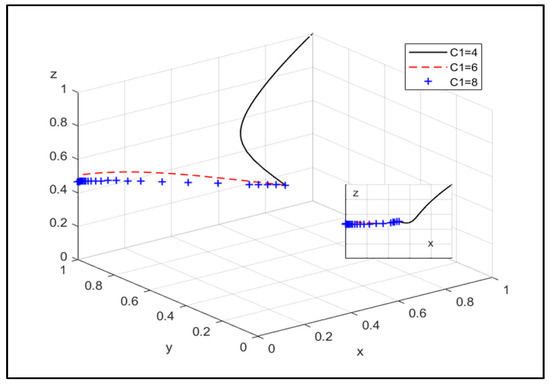
Figure 5.
The influence of the additional cost of the CPE choosing joint operation.
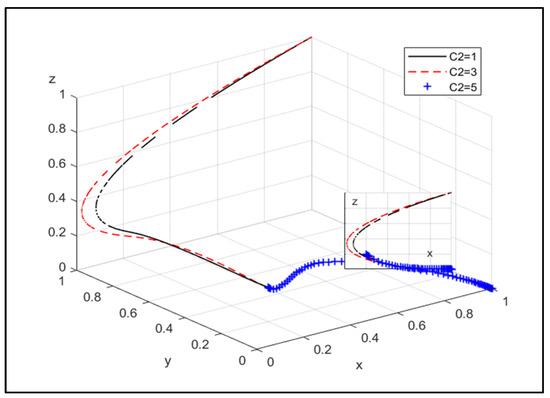
Figure 6.
The influence of the additional cost of the NEPE choosing joint operation.
Figure 5 indicates that as the additional cost is paid by the CPE for joint operation, its willingness to choose non-joint operation becomes stronger, and the willingness of the government to choose strict supervision will decrease.
Figure 6 indicates that as the additional cost is paid by the NEPE for joint operation, it is more willing to choose joint operation, and the government is more willing to choose strict supervision.
Therefore, by reducing the additional cost of the CPE and the NEPE after joint operation, it can promote both of them to choose joint operation. In probability, the reduction in additional cost after joint operation will make the willingness of the NEPE to choose joint operation stronger.
③ The influence of the additional subsidies provided by the government to CPE and NEPE under joint operation on system evolution:
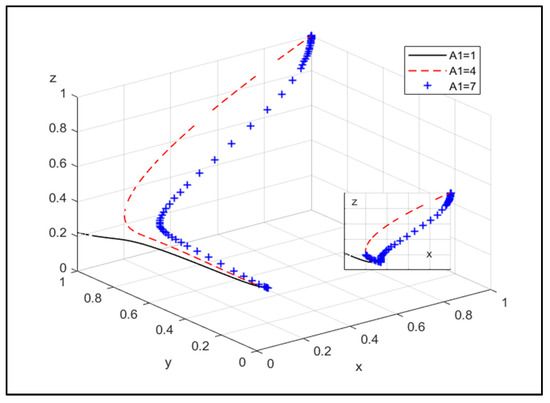
Figure 7.
The influence of additional subsidies provided by government to the CPE under JOCN.
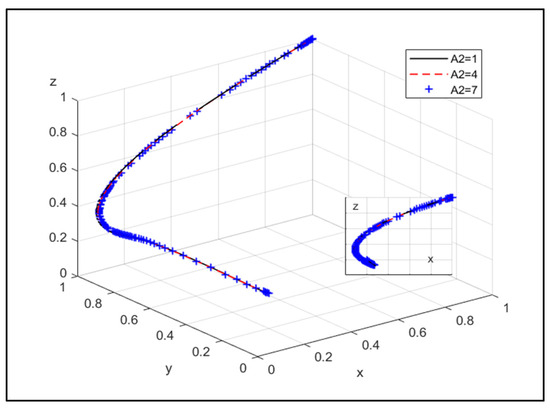
Figure 8.
The influence of additional subsidies provided by government to the NEPE under JOCN.
Figure 7 shows that with the increase in additional subsidies provided by government to CPE under joint operation, its willingness to choose joint operation becomes stronger, with the probability of joint operation being greatly increased by subsidies from the start. The willingness of government choose strict supervision will also increase.
Figure 8 shows that with the increase in additional subsidies provided by government to the NEPE under joint operation, it has a stronger willingness to choose joint operation, and government has a greater willingness to choose strict supervision.
Therefore, by increasing the additional subsidies provided by the government to the CPE and the NEPE under joint operation, it can encourage them to choose joint operation, and the effect of subsidies will make CPE’s willingness to choose joint operation stronger.
④ The influence of spillover benefits caused by the CPE or the NEPE encourages them to choose non-joint operation, but the other choice is not part of the system evolution:
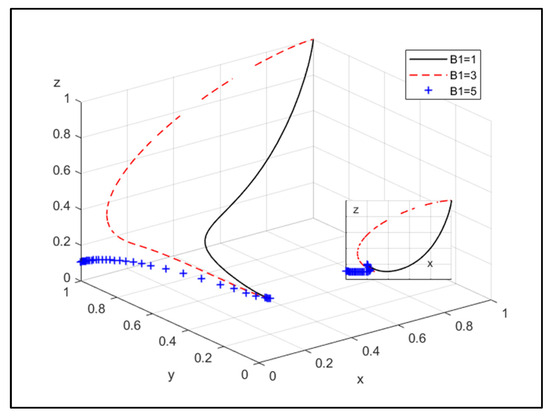
Figure 9.
The influence of spillover benefits of the CPE choosing non-joint operation, but not the NEPE.
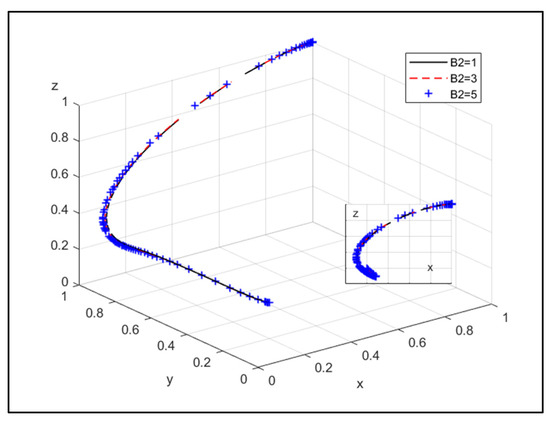
Figure 10.
The influence of spillover benefits of the NEPE choosing non-joint operation, but not the CPE.
Figure 9 indicates that as CPE chooses non-joint operation, the spillover benefits to the CPE caused by the NEPE choosing joint operation will increase. The willingness of the CPE to choose non-joint operation is stronger, and the decrease is significant. The government is more likely to choose loose supervision.
Figure 10 indicates that as the NEPE chooses non-joint operation, the spillover benefits to the NEPE caused by the CPE choosing joint operation will increase. The willingness of the NEPE to choose non-joint operation will decrease, and the possibility of the government choosing strict supervision will also decrease.
Therefore, by reducing the spillover benefits to the CPE or the NEPE, one will choose non-joint operation, but the other not can be encouraged to participate in the joint operation of the CPE and the NEPE.
⑤ The influence of environmental cost and the cost of power loss caused by CPE or NEPE chooses non-joint operation on system evolution:
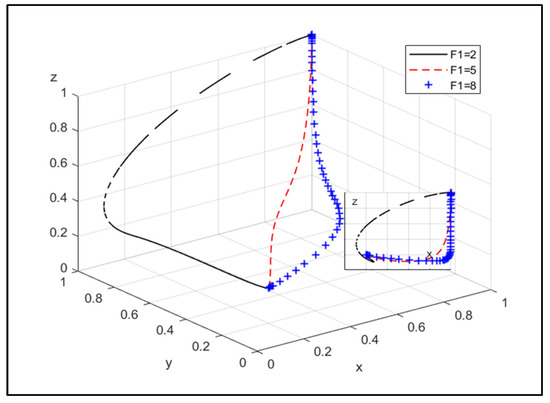
Figure 11.
The influence of environmental cost of the CPE choosing non-joint operation.
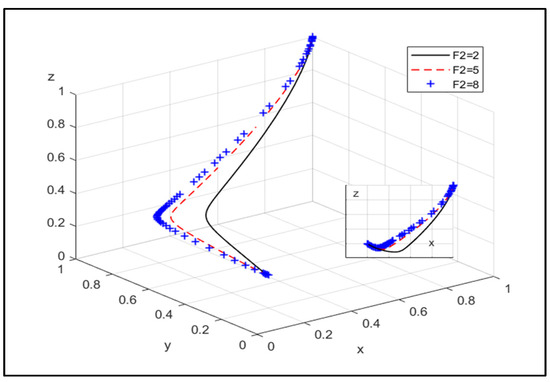
Figure 12.
The influence of the cost of power loss of the NEPE choosing non-joint operation.
Figure 11 shows that as the CPE chooses non-joint operation, the environmental cost and clean transformation cost caused by its carbon emissions will increase. The willingness of the CPE to choose joint operation is stronger, and the government is more likely to choose strict supervision.
Figure 12 shows that as the NEPE chooses non-joint operation, the cost of power loss caused by its intermittent and difficult consumption will increase. The willingness of the NEPE to choose joint operation and the government to choose strict supervision will increase.
Therefore, it can be concluded that as the environmental cost and the cost of power loss continue to increase for the CPE, or the NEPE chooses non-joint operation, the probability of the CPE and the NEPE choosing joint operation will increase.
⑥ The influence of social welfare changes when both the CPE and the NEPE choose joint operation upon system evolution:
Assign , as shown in Figure 13.
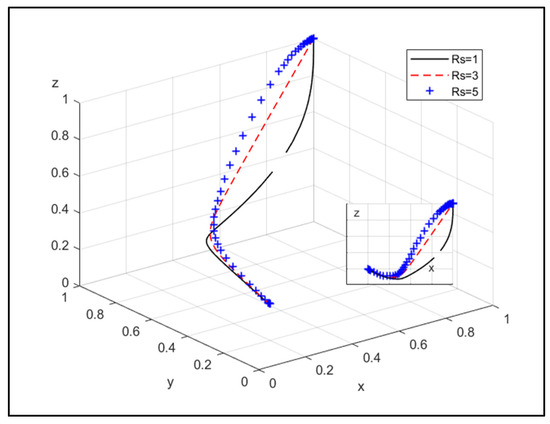
Figure 13.
The influence of social welfare when both the CPE and the NEPE choose joint operation.
Figure 13 indicates that as both the CPE and the NEPE choose joint operation, social welfare increases, the CPE’s willingness to choose joint operation is stronger, and the government has a greater willingness to choose strict supervision.
Based on the analysis, the improvement of social welfare brought about by joint operation between the CPE and the NEPE will continue to promote the probability of government support for joint operation.
⑦ The influence of the cost under government strict supervision to order an NEPE that chooses non-joint operation to rectify upon system evolution:
Assign , as shown in Figure 14.
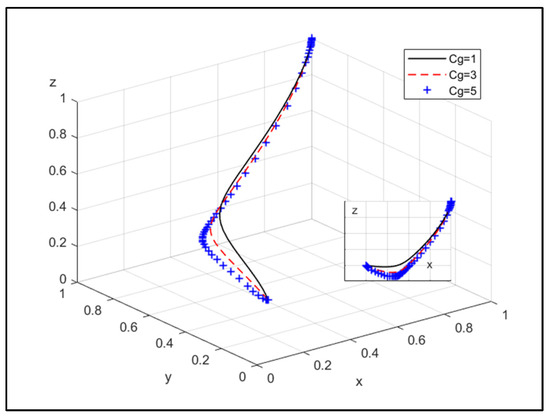
Figure 14.
The influence of the cost under government strict supervision to order an NEPE that chooses non-joint operation to rectify.
Figure 14 shows that as the government orders a NEPE that chooses non-joint operation to rectify under strict supervision, the cost will increase. It will lead to a lower willingness of the CPE to choose joint operation, and a lower willingness of the government to choose strict supervision.
Therefore, the increase in strict supervision cost by the government will reduce the probability of the government supporting the joint operation.
5. Conclusions and Countermeasure Suggestion
5.1. Conclusions
Regarding the problem of joint operation, this article constructs a tripartite evolutionary game matrix for the CPE, the NEPE and the government, obtains replications of the dynamic equations and Jacobian matrices, analyzes the stability strategy of the agents and the game system’s equilibrium combination, and uses the MATLAB R2021a simulation to analyze the parameter sensitivity [19,24,31,32]. The main conclusions are as follows:
① The evolution of strategies among the three agents in the game is influenced by other game participants, and the joint evolution of them determines the optimal evolution. The optimal equilibrium strategy is for the CPE and the NEPE to choose joint operation under government supervision. The benefit and loss brought by strict supervision and subsidies of the government, as well as the different strategies of cooperation and competition, affect the evolutionary equilibrium.
② The main factors affecting the CPE choosing joint operation are the additional operating income in the joint operation, the additional operating cost of low-carbon production, and the government’s environmental supervision intensity. The greater the additional operating income, the greater the government’s environmental supervision intensity; and the lower the additional operating cost of low-carbon production, the more likely the CPE chooses joint operation.
③ The main factors affecting the NEPE choosing joint operation are the additional operating income in the joint operation, the additional operating cost, and the government’s additional subsidy intensity. The greater the additional operating income, the lower the additional operating cost, and the greater the government’s additional subsidy intensity, the more likely NEPE chooses joint operation.
④ Whether the government takes supervision depends on the balance of its benefits and costs. When the government’s benefits from supervision exceeds its cost, government supervision is economically justified. Otherwise, the government chooses loose supervision. The rise of social welfare makes the government more inclined to create a supervision policy.
5.2. Countermeasure Suggestion
In order to promote the joint operation of the CPE and the NEPE, based on the above conclusions, the following recommendations are proposed:
① To enhance the profitability of the enterprises in joint operation and encourage technological innovation, the research findings show that the additional operating income level in the joint operation is an important factor affecting the game equilibrium. Currently, the profitability level of the CPE is generally higher than that of the NEPE, but there is a downward trend. Government subsidies can only be balanced in the short term; therefore, it is necessary for the NEPE to improve its comprehensive profitability level through technological innovation to better promote the optimal combination of JOCN.
② Fulfil the role of government supervision and guiding function, because the strict supervision and additional subsidy of the government are also important factors affecting the game equilibrium. When the market cannot spontaneously form the optimal equilibrium, it is necessary to fulfil the role of the government’s “visible hand” to formulate and issue supporting policies such as environmental tax subsidies and risk sharing incentives, and guide the establishment of a complete ancillary service market. However, the government may experience a situation of “failure” due to a decrease in social welfare and excessive supervision cost.
③ To promote the flexibility and energy-saving transformation of CPE, it is necessary for the government to provide reasonable compensation to the enterprise undergoing flexibility transformation to guide investment, in order to reduce the environmental and clean transformation cost of the CPE. The problem of excessive cost of power loss for the NEPE can be solved by developing distributed generation, which requires the government to establish a long-term mechanism and stabilize the market credibility of distributed generation.
Author Contributions
Conceptualization, L.Z.; methodology, L.Z.; software, J.C.; validation, J.C. and G.D.; formal analysis, J.C.; investigation, J.C.; resources, L.Z.; data curation, J.C. and G.D.; writing—original draft preparation, J.C. and G.D.; writing—review and editing, J.C., G.D. and L.Z.; visualization, J.C.; supervision, L.Z.; project administration, L.Z.; funding acquisition, L.Z. All authors have read and agreed to the published version of the manuscript.
Funding
This research was funded by: (1) the National Natural Science Foundation of China, grant number 71874187; (2) the Fundamental Research Funds for the Central Universities, grant number 2019XKQYMS81.
Data Availability Statement
The original contributions presented in the study are included in the article, further inquiries can be directed to the corresponding author.
Conflicts of Interest
The authors declare no conflict of interest.
References
- Lin, S.H. Study on the Impact of Coal-Electricity Integration on Energy Cost and Energy Security. Coal Econ. Res. 2022, 42, 11–16. [Google Scholar]
- Liu, P.K.; Gui, J.Q.; Mu, Y.P. Solving the “Coal-Electricity Contradiction”: Reflections on “Two Integration”. Coal Econ. Res. 2024, 44, 1–9. [Google Scholar]
- Yuan, H. Path Choice and Policy Suggestions for Cooperation. China Electr. Power Enterp. Manag. 2023, 41, 34–37. [Google Scholar]
- Yi, Y.Y. Research on the Behavior of Cooperation and Betrayal Based on Evolutionary Game Theory; Economic Science Press: Beijing, China, 2009. [Google Scholar]
- Xie, S.Y. Theory of Economic Game, 3rd ed.; Fudan University Press: Shanghai, China, 2010; pp. 208–249. [Google Scholar]
- Hill, L.J.; Hadley, S.W. Federal tax effects on the financial attractiveness of renewable versus conventional power plants. Energy Policy 1995, 23, 593–597. [Google Scholar] [CrossRef]
- Tang, L.; Shi, J.R.; Yu, L.A.; Bao, Q. Economic and environmental influences of coal resource tax in China: A dynamic computable general equilibrium approach. Resour. Conserv. Recycl. 2017, 117, 34–44. [Google Scholar] [CrossRef]
- Nicolini, M.; Tavoni, M. Are renewable energy subsidies effective? Evidence from Europe. Renew. Sustain. Energy Rev. 2017, 74, 412–423. [Google Scholar] [CrossRef]
- Zhang, M.M.; Zhou, D.Q.; Zhou, P.; Chen, H.T. Optimal design of subsidy to stimulate renewable energy investments: The case of China. Renew. Sustain. Energy Rev. 2017, 71, 873–883. [Google Scholar] [CrossRef]
- Zhou, Y.; Pu, Y.; Chen, S.; Fang, F. Government Support and the Development of Emerging Industries: A Case Study of New Energy. Econ. Res. 2015, 50, 147–161. [Google Scholar]
- Fisher, C. Combining policies for renewable energy: Is the Whole less than the sum of its parts? Discuss. Pap. 2010, 4, 51–92. [Google Scholar]
- Sun, P.; Nie, P. Regulation of the New Energy Industry: Dynamic Decision-Making between R&D Subsidies and Support Prices. Contemp. Financ. Econ. 2013, 34, 94–105. [Google Scholar]
- Sun, P.; Zhang, L. Who Should Foot the Bill for Price Subsidies in the New Energy Industry? J. Financ. Econ. 2014, 30, 90–97. [Google Scholar]
- Zhao, X.; Zhu, L.; Ding, L. Game Analysis of the Evolution of Government, New Energy Industry, and Traditional Energy Industry in Energy Structure Adjustment. J. Wuhan Univ. (Philos. Soc. Sci. Ed.) 2018, 71, 145–156. [Google Scholar]
- Liu, Y.H. Game Equilibrium between Government and Enterprises in the Development of the New Energy Industry. Quest 2013, 33, 53–55. [Google Scholar]
- Zhang, W.G.; Zheng, Y.L.; Wang, X.C. The Role of Government in the Investment System of New Energy: An Analysis Based on Evolutionary Game. Sci. Technol. Manag. Res. 2015, 35, 205–210. [Google Scholar]
- Zheng, Y.L.; Zhang, W.G. Research on the Evolutionary Game of New Energy Investment and Financing Mechanism under the New Urbanization. J. Chongqing Univ. (Soc. Sci. Ed.) 2014, 20, 15–24. [Google Scholar]
- Chai, R.R.; Li, G. Evolutionary Game Model of Energy Structure Transformation in Power Generation Enterprises: Renewable Clean Energy vs. Clean Utilization of Traditional Energy. Syst. Eng.-Theory Pract. 2022, 42, 184–197. [Google Scholar]
- Song, M.H.; Wang, W.C. Study on the Evolutionary Game Behavior between Enterprises and Governments under the Background of Energy Security. China Soft Sci. 2022, 37, 152–160. [Google Scholar]
- Smith, J.M.; Price, G.R. The logic of animal conflict. Nature 1973, 246, 15–18. [Google Scholar] [CrossRef]
- Wang, J.T.; Qu, S.Y.; Feng, Y.C. Research on innovation risk prevention and control of high-tech enterprises based on evolutionary game. Sci. Technol. Manag. Res. 2019, 39, 19–24. [Google Scholar]
- Xie, S.Y. Evolutionary Game Theory under Bounded Rationality. J. Shanghai Univ. Financ. Econ. 2001, 3, 3–9. [Google Scholar]
- Lu, J.C.; Ou-yang, H.X.; Han, L. Evolutionary Mechanism of Low-Carbon Transformation of Construction Enterprises under Multi-Subject Interactive Game. J. Beijing Inst. Technol. (Soc. Sci. Ed.) 2019, 21, 17–26. [Google Scholar]
- Zhao, X.G.; Ren, L.Z.; Wan, G. Renewable Energy Quota System, Strategic Behavior, and Evolution of Power Generation Enterprises. Chin. J. Manag. Sci. 2019, 27, 168–179. [Google Scholar]
- Niu, X.J.; Li, C.H. Strategic Positioning, Policy Framework, and Government Role in the Development of China’s New Energy Industry. Chin. Public Adm. 2014, 30, 100–103. [Google Scholar]
- Ding, L.L.; Zhang, X.T.; Bai, Y. Analysis of Equity Investment Decision-Making for CCUS Projects Considering Limited Attention under Government Participation. J. Manag. Eng. 2023, 38, 239–250. [Google Scholar]
- Li, J.F.; He, X.T.; Niu, W.; Liu, X.N. Analysis of the Joint Trading of Local Green Power Certificates, Carbon Emissions Rights, And Electricity Considering Demand Flexibility. Int. J. Electr. Power Energy Syst. 2024, 155, 109653. [Google Scholar] [CrossRef]
- Niu, H.W.; Liu, D.; Chen, G.J. Research on the Evolutionary Game of Electric Coal Supply and Demand Strategies under the Background of Dual Carbon and Energy Security. Smart Grid 2022, 50, 8–15. [Google Scholar]
- Ma, B.J.; Jiang, X.H. Stability Analysis of Asymmetric Evolutionary Games with Three Groups in 222 Format. Oper. Res. Manag. Sci. 2022, 31, 38–45. [Google Scholar]
- Huang, K.N. Evolutionary Game Theory and Evolutionary Economics. Econ. Res. 2009, 44, 132–145. [Google Scholar]
- Zhang, X.H.; Gan, D.M.; Huang, S.J. Investment Strategy for Carbon Emission Reduction in Thermal Power Generation Considering Minimum Profit. J. Manag. Sci. China 2019, 22, 69–81. [Google Scholar]
- Xu, J.Z.; Dong, Y. Evolutionary Game Analysis of Local Governments and Power Generation Enterprises under Carbon Trading Mechanism. J. Univ. Sci. Technol. China 2017, 47, 929–939. [Google Scholar]
- Sun, D.Y.; Geng, J.; Yang, S.C.; Zhang, L.Z. Challenges of Coordinated and Optimized Operation of Coal Power and New Energy and Other Diversified Resources in the New Power System. Power Syst. Technol. 2024, 48, 3105–3113. [Google Scholar]
- Jiao, J.L.; Chen, J.; Li, L.L.; Li, F.Y. Analysis of the Evolutionary Game between Local Governments and Enterprises under Carbon Emission Reduction Incentive Mechanism. Chin. J. Manag. Sci. 2017, 25, 140–150. [Google Scholar]
- Guttman, J.M. On the evolutionary stability of preferences for reciprocity. Eur. J. Political Econ. 2000, 16, 31–50. [Google Scholar] [CrossRef]
- Wang, G.; Chao, Y.C.; Cao, Y.; Jiang, T.L.; Han, W.; Chen, Z.S. A comprehensive review of research works based on evolutionary game theory for sustainable energy development. Energy Rep. 2022, 8, 114–136. [Google Scholar] [CrossRef]
- Li, Y.M.; Yang, C.; Ren, H.J.; Niu, D.D. Research on the Stochastic Evolutionary Game between Government and Enterprises in Renewable Energy Investment: Based on the Dynamic Carbon Price Perspective. China Environ. Sci. 2023, 44, 567–580. [Google Scholar] [CrossRef]
- Lin, B.Q.; Liu, Z.W. When Will CCS Be More Cost-Efficient than BESS? Based on China’s Low Carbon Transition of the Power Sector. Syst. Eng.-Theory Pract. 2024, 44, 1–24. [Google Scholar]
Disclaimer/Publisher’s Note: The statements, opinions and data contained in all publications are solely those of the individual author(s) and contributor(s) and not of MDPI and/or the editor(s). MDPI and/or the editor(s) disclaim responsibility for any injury to people or property resulting from any ideas, methods, instructions or products referred to in the content. |
© 2024 by the authors. Licensee MDPI, Basel, Switzerland. This article is an open access article distributed under the terms and conditions of the Creative Commons Attribution (CC BY) license (https://creativecommons.org/licenses/by/4.0/).