Abstract
Biodrying is an essential part of the mechanical–biological treatment process that minimizes moisture content and simultaneously maximizes heating value for refuse-derived fuel (RDF) production. Although the mechanical separation process operates effectively in Thailand’s RDF production, high organic content levels and their degradation cause moisture contamination in RDF, producing wet RDF. Aeration is essential for an effective biodrying process, and can reduce RDF’s moisture content as well as increase its heating value. To maximize the biodrying effect, aeration should be optimized based on the waste conditions. This study proposes a modified aeration-supplied configuration for wet RDF biodrying. The aeration rate was modified based on the period within the biodrying operation; the first period is from the beginning until day 2.5, and the second period is from day 2.5 to day 5. The optimal aeration supply configuration was 0.5 m3/kg/day in the first period and then 0.3 m3/kg/day until the end of the process; this configuration yielded the greatest moisture content decrease of 35% and increased the low heating value of the biodried product by 11%. The final moisture content and low heating value were 24.07% and 4787 kcal/kg, respectively. Therefore, this optimal aeration-supplied configuration could be applied to meet the moisture content and low heating value requirements of the RDF production standard for Thailand’s local cement industry.
1. Introduction
After the onset of the COVID-19 pandemic in December 2019, there were widespread changes in consumer behavior due to social distancing regulations, leading to a surge in demand for home delivery services of food and groceries, which caused a significant increase in the generation of plastic packaging waste, health waste (e.g., gloves and masks), and food waste [1]. Furthermore, the generation and management of municipal solid waste (MSW), both before and since the start of the COVID-19 pandemic, have become challenging environmental problems due to changing lifestyles and consumption habits. For example, before the pandemic, the waste produced by Thailand, especially that by the Bangkok Metropolitan Administration (BMA), comprised 50–60% food waste and 20–30% plastic waste, with an average amount of 2115 tons/day of plastic waste production being reported in 2019. Since the start of the COVID-19 pandemic and the resulting lockdown measures, the total amount of MSW decreased significantly due to the reduced food waste being produced by hotels and restaurants; however, the amount of plastic waste generated has risen. Plastic waste production increased to 3432 tons/day in 2020, representing a 62% increase compared to 2019. Although the COVID-19 pandemic restrictions have ended in Thailand, the trend of increasing amounts of plastic waste and food waste being generated is ongoing, and its composition is expected to be the same as during the pandemic [2].
At the On Nut waste transfer station in Bangkok, MSW is processed using mechanical–biological treatment (MBT) with a designed maximum capacity of around 1200 tons/day. MSW is mechanically pretreated to separate large objects, recyclables, non-biodegradable materials, and organic waste. The remaining waste stream after the sorting process, which comprises a mixture of non-biodegradable materials and organic waste, is transferred to the screening process. A particle size above 40 mm is defined as non-biodegradable material that is suitable for refuse-derived fuel (RDF) production [3]. The COVID-19 pandemic has significantly changed the compositions of MSW, with extensive non-biodegradable material produced due to the 63% increase in plastic waste reported in 2020 [2,4]. These changes represent both a challenge and an opportunity to convert non-biodegradable material into RDF. Due to the separation process of non-biodegradable materials described above, the organic waste is mixed and digested, and leachate from digestion is mixed into the waste stream. In addition, the separated non-biodegradable waste is highly contaminated with leachate; therefore, the non-biodegradable materials for RDF production contain a higher moisture content (MC) and have low heating values. These materials are unacceptable for usage as fuel for the cement production industry and at power plants.
To increase the utilization of waste via conversion into RDF, the quality of non-biodegradable materials should be improved by using drying technology treatments. The biodrying process is an alternative pretreatment method and has been widely developed. Biodrying aims to remove moisture from substances with a high MC by using heat generated during the breakdown of degradable materials in addition to forced aeration. A previous study examined several parameters that affect the biodrying process, e.g., the initial organic substance content, the initial MC, and the aeration rate, all of which were found to be significant. A range of monitoring parameters is also used to characterize bioactivity during the biodrying process, e.g., the temperature profile, the water reduction rate, and gas generation. Based on previous literature, the primary operational variable controlling the biodrying process is the aeration rate [5,6,7,8]. The matrix temperature, as a representation of self-heating in the biodried substance, can be controlled by adjusting the aeration rate. Huilinir et al. (2015) investigated the effects of the initial MC and aeration rate on the temperature profile of sewage sludge biodrying; their study found that a lower aeration rate and an initial MC of 68% achieved the highest temperature in the first three days. In addition, the highest water removal rate was reached with higher temperatures during the first two days [5]. Zhou et al. (2014) also studied sewage sludge composting. Their results showed that, from day 2 to day 3, the highest temperature in the matrix coincided with the highest water removal rate on day 3 and the highest oxygen consumption on day 3. This was achieved under intermittent airflow (8 min on/32 min off pattern for the operation pump) [6]. Yuan et al. (2018) studied MSW biodrying under different aeration methods (intermittent and continuous). In their study, the biodrying temperature was highest under the continuous aeration method between days 0 and 6, while the water removal rate reached its maximum values during days 3 and 6 [7]. In addition, Colomer-Mendoza et al. (2013) studied the effect of airflow rate on garden waste biodrying. They showed that higher airflow rates prevented the occurrence of a thermophilic phase; thus, physical phenomena primarily dried the waste [8].
Overall, previous research [5,6,7,8,9] found that the biodrying temperature was at its highest from the first day of biodrying to day 3, while the highest water removal rates occurred after 2–3 days; however, a key required aspect of this process is to determine the optimal aeration configuration. Low airflow rates at high biodrying temperatures allow maximum water vapor removal. Likewise, higher airflow rates allow for high evacuation rates of water vapor from the system. Although the temperature is controlled by aeration for effective moisture removal under ventilation, no research has been published to date on modifying aeration during the biodrying process. Therefore, this study investigates the aeration-supplied configuration (i.e., modifying the aeration rate during the biodrying process) for wet RDF.
2. Materials and Methods
The biodrying process is performed similarly to the initial stages of the composting process for MSW and sludge [10]. The biodrying process in this study involves microorganisms contained in wet RDF, which maintain bioactivity and the organic degradation process due to supplied aeration. This study focused on varying the aeration input to the matrix body during different periods, described as an “aeration-supplied configuration”. During these tests, no other materials (organic matter, water, etc.) were added, and only the aeration was varied during the experiment. The basic indicator values of the substrate, in addition to the pH, C/N ratio, oxygen content, MC, etc., were found to meet the basic conditions required for the stabilization process [11].
2.1. Lysimeter Design
A schematic representation of the biodrying lysimeter system used for the lab-scale wet RDF treatment experiments is shown in Figure 1. The lysimeter is composed of a square stainless steel structure with a width as well as depth of 50 cm and a height of 200 cm. It was fabricated in a 2.5 cm-thick polyurethane foam cover to minimize heat loss through the lysimeter’s side walls. The biodrying lysimeter unit consisted of three structural components. The first was the convertible lysimeter, which can treat a maximum of 0.375 m3 of wet RDF in one batch. A perforated metal plate was placed at the bottom of the device to support the waste material and ventilation. Secondly, an aeration component system was installed at the bottom of the lysimeter to supply and maintain uniform airflow throughout the lysimeter body. This system included a centrifugal pump (50 FCM 1/4 HP 1P, 220 V, 50 Hz), a flexible conduit, a ventilation pipe with a control valve, and a condensation pipe.
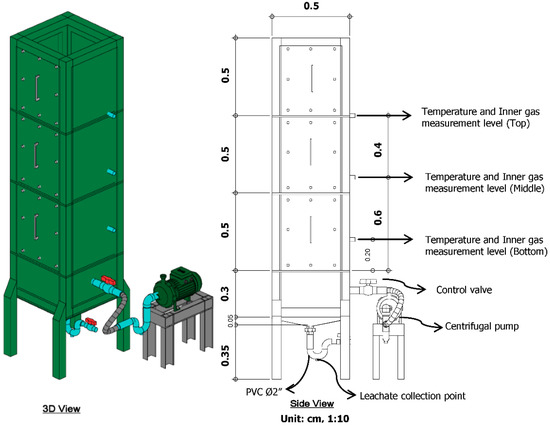
Figure 1.
A schematic representation of the biodrying lysimeter system used for treating wet RDF.
A ventilation pipe 14 cm in length and 5 cm in diameter was placed under the perforated metal plate. This pipe was perforated in its center with a 1 × 3 cm hole to measure the airflow rate. The airflow rate measurement was used to ensure that the designated area of the ventilation pile was experiencing laminar flow. In addition, a U-trap pipe with a diameter of 5.08 cm was connected to the ventilation pipe for condensate water collection. The third structural component of the lysimeter was a leachate collection point located at the bottom of the lysimeter body, which was fabricated using a U-trap pipe with a diameter of 5 cm. Three perforated pipes with diameters of 0.2 cm were placed at heights of 0.2 m, 0.6 m, and 1 m above the base of the lysimeter to measure inner gases [9]. The lysimeter design used here was modified from that used in the study of Payomthip et al. (2022) [12].
2.2. Feedstock Preparation and Analysis
In the feedstock preparation process, wet RDF, used here as feedstock, is produced at the MBT plant located in the On Nut waste transfer station. It is then transferred to the Waste to Energy plant of SCI Eco Services Co., Ltd. in Saraburi province, Thailand. At the Waste to Energy plant, wet RDF is shredded using the mechanical treatment unit and conveyed to the cement production process. The experiments in this study were performed in the early wet season between April and May, with an average relative humidity of 40–75%. The wet RDF used here has a relatively homogeneous composition comprising non-degradable materials, degradable materials, and other materials. The non-degradable materials were composed of 44.1% plastic bags, 12.04% fabric and napkins, and 11.38% packaging and plastic tubes. The degradable materials were 20.51% mixed food, garden, and paper waste. The other materials, representing 10.91% of the total wet RDF, were composed of unseparated waste.
Secondly, this study sampled wet RDF from the stockpile before it was loaded into the lysimeters, in which the biodrying process was performed. The wet RDF (before the biodrying process) and biodried product (after the biodrying process) were analyzed using the quartering method following the ASTM D5231-92 standard. Before the biodrying process, 20 kg of wet RDF was sampled from the stockpile to characterize its composition. In addition, 1.5 kg of wet RDF and 0.5 kg of degradable materials were collected to measure their chemical properties. The ultimate analysis was performed only for the degradable material and involved analyses of C, H, O, N, Cl, S, and ash content. The experiment included three lysimeters, with an average feedstock mass of 70.3 kg in each lysimeter. The feedstock was loaded equally to a height of 1.2 m. A thermogravimetric analyzer was used to measure the MC, volatile solid content, and ash content following the ASTM D7582 standard. In addition, the heating value was analyzed through the use of a bomb calorimeter according to the ASTM D2015 standard. The feedstock and biodried product were measured for each parameter following standard methods. The physicochemical characterization process used here was very similar to that reported by Bhatsada et al. (2022) [9], and the experimental conditions were controlled to ensure the reliability of the final results.
2.3. Experimental Design
In this study, three experiments were conducted, in which aeration-supplied configurations to the biodrying process were performed. The aeration configurations refer to the continuous negative ventilation supplied at a specified rate, which was then changed during the biodrying process. The study was divided into two periods: The first period was from the start of the experiment to day 2.5. In this period, the three experiments were set at the same aeration rate (0.5 m3/kg/day). The second period directly followed the first period, starting on day 2.5 until the end of the experiment on day 5. In the second period, different aeration rates were used. In Experiment I, the aeration rate was decreased to 0.3 m3/kg/day; in Experiment II, the aeration rate was maintained at 0.5 m3/kg/day; and in Experiment III, the aeration rate was increased to 0.7 m3/kg/day. These aeration configurations were selected based on the following assumptions: (1) the constant aeration rates used for each experiment in the first period maintained the same level of bioactivity in each case, and (2) reducing the aeration rate incubated the biodrying system to promote evaporation, whereas increasing the aeration rate forced a decrease in the MC via ventilation. The aeration rate changes were selected based on those reported in previous research in the literature. The studies of Huilinir et al. (2015), Zhou et al. (2014), Yuan et al. (2018), and Colomer-Mendoza et al. (2013) reported increased bioactivity, represented by increases in temperature, water reduction, and gas generation during days 2–5 [5,6,7,8]. The experimental design conditions are listed in Table 1. Before each experiment, the feedstock was measured for its physical and chemical characteristics, i.e., initial weight, bulk density, and MC. The initial low heating value (LHV) of each experiment varied from 4033 to 4239 kcal/kg. Experiment III had a lower LHV but a higher MC and volatile solid content. Although each experiment’s initial weight and bulk density of feedstock were varied, its volume was calculated to be the same at 0.30 m3. The experiments were performed for a total of five days, at which time the MCs and LHVs of the final biodried products were measured.

Table 1.
Aeration configuration and characteristics of the feedstock of the experiments in this study. The values I to III indicate the experiment number.
2.4. Experimental Monitoring
The temperature was monitored by using type K thermocouples at three vertical locations on the lysimeter, i.e., its top, middle, and bottom. Another sensor was placed outside the lysimeter to measure the ambient temperature. The temperature data were recorded hourly using a mini-data logger (Graphtec GL220). Significant temperature differences between each experiment and the ambient conditions were determined using the analysis of variance method [10] with 95% confidence in Excel 2010. A Biogas 5000 monitor (Geotech, UK) was used to measure the concentrations of carbon dioxide (CO2) and oxygen (O2) each day at three levels within the lysimeter. The flow of the pump was adjusted so that the Biogas 5000 monitor could overcome the maximum negative aeration from the lysimeter of 27.78 mL/min. Every day, before the gas concentration in the lysimeter was measured, the monitor was calibrated using ambient air for methane (CH4), CO2, O2, and hydrogen sulfide (H2S) levels to 0% by volume, 0% by volume, 20.8% by volume, and 0 ppm, respectively. A push gantry hoist and digital crane scales were used to measure the feedstock’s daily weight. In addition, the elevation of the feedstock inside the lysimeter was measured vertically by using a tape measure.
2.5. Performance Indicators
The temperature integration (T.I.) describes the temperature accumulation. Its value is based on the difference between the process temperature and the ambient temperature, and can be calculated as:
where Tm and Ta are the matrix and ambient temperatures on day i, respectively, and Δt is the time element [13,14].
where Wt is the weight of the waste on day t, SA is the cross-sectional area of the lysimeter, and Et is the elevation of the waste on day t.
where VSin is the volatile solid content in the feedstock and VSout is the volatile solid content in the biodried product in each layer.
where the organic degradation rate is in units of kg/h, Voutlet is the daily exhaust gas (m3/h), CO2,outlet is the CO2 concentration, and 1.34 is the conversion factor for organic degradation (kgsolid/m3 CO2) [11].
The biodrying index (B.I.) is defined as the proportion of the organic loss (O.C.) (kg) and water content loss (W.L.) (kg) in the final process [13,14].
3. Results
3.1. Temperature Evolution during the Biodrying Process
Temperature measurements were used to determine microbial activity, which resulted in heat, gas, and water. The water vapor released is due to heat production. Thus, the temperature directly correlates with the vapor saturation and regulates evaporation from the system into the environment. Figure 2 illustrates the hourly temperature measurements from the three experiments.
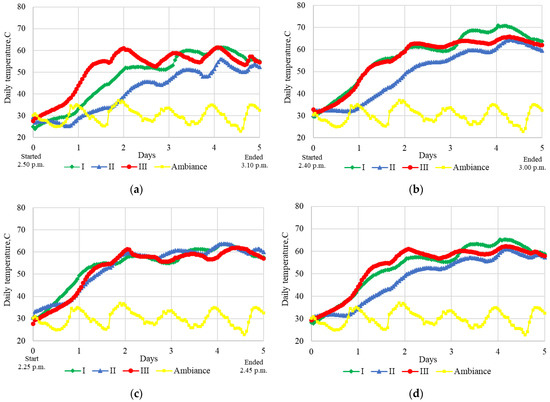
Figure 2.
Temperature evolution during the biodrying process of the (a) top layer, (b) middle layer, (c) bottom layer, and (d) average layer.
The experiments were carried out in the lysimeter conditions at stable temperatures (25–35 °C) and relative humidity (35% ± 10%), which did not interfere with the course of the experiments. In terms of the system’s temperature over the first two days, the temperature rose steadily and then began to fluctuate. The ambient temperature rose and decreased following a pattern of a sharp period of warming from 5:30 a.m. to 12:30 p.m. daily (7 h) and a longer cooling period from 12:30 p.m. to 5:30 a.m. (17 h), which are influenced by the effects of solar radiation, humidity, and wind speed [15,16]. The different stages in the experiments can be distinguished based on temperature patterns. In the mesophilic phase, the biologically generated temperature increases with the bioactivity of bacteria such as Bacillus macerans, Aspergillus flavus, and Micrococcus. The waste is most effectively stabilized when its temperatures rise to the highest level, which occurs in the thermophilic phase due to the activity of communities comprising species such as Enterobacter cloacae, Absidai corymbifera, and Bacillus licbeniformis [17,18]. In the thermophilic phase, especially in Experiments I and II, the system’s temperature was low in the warming period relative to that during the cooling period. This behavior is a result of (1) the greater water vapor evaporation capability in the warming period relative to the cooling period due to relative humidity differences in the ambient air (average relative humidity in the warming period = 48.38%, average relative humidity in the cooling period = 68.0%) [19] in addition to (2) low heat retention in the system due to lower levels of water vapor accumulation.
During the first period, the top and middle levels exhibited temperature differences due to variations in their initial parameters. The top layer of Experiment III had the highest temperature, consistent with its highest initial volatile solid (VS) content and MC, followed by those of Experiments I and II, respectively; however, more consistent behavior was recorded in the bottom layer because this layer was saturated with water in all of the experiments due to the effects of gravity and forced ventilation. In the second period, the temperatures in Experiment III decreased slightly, except for those in the middle layer, which remained steady during this period. This observation is due to the excess aeration during the experiment’s operation, which increased the dry air in the system and dissipated the heat as well as saturated vapor pressure, corresponding to physical drying [12]. The temperature of Experiment II (middle layer, average layer) continuously increased because of the continuous organic decomposition process [18]. The temperatures recorded in Experiment I increased continuously because decreasing the aeration rate reduces the ventilation effect while the saturated vapor and heating levels remain the same. This configuration is consistent with the biostabilization required for the composting process, while the conditions in the first stage are consistent with those required for biodrying [11,18].
The middle layer exhibited the highest temperature of 70 °C, followed by the top and bottom layers, in which values of 60 °C were recorded. The top layer has more area exposed to ambient conditions than the other layers do, resulting in the transfer of the system’s heat to the environment; however, the bottom layer accumulates water due to gravity and pumping, resulting in cooling in this layer. A homogeneous temperature for the average layer of each experiment was calculated. There were significant differences between all of the experiment pairs, i.e., Experiment I and Experiment II (p < 0.05), Experiment I and Experiment III (p < 0.05), and Experiment II and Experiment III (p < 0.05). In addition, significant differences were identified between all of the experiments and ambient conditions (p < 0.05).
Zhou et al. (2018) investigated the composting of municipal sewage sludge in a cuboid pile under varied intermittent ventilation conditions [20]. They observed that the middle of the waste pile reached the highest temperature relative to the top and bottom layers. Similar findings were found in this study. Wang et al. (2011) described the heat distribution in the waste pile layer due to positive aeration and ambient air; in their study, the top layer was found to be at a higher temperature than the bottom due to the effects of heat transfer from the bottom to the top of the system via aeration [21]; however, the present study was performed under negative aeration, in which the heat distribution was controlled by the ambient air contact area, water flow by gravity, and aeration force. Tom et al. (2016) studied the temperature during an MSW biodrying process with positive ventilation. Their results showed that the highest temperature was obtained from the bottom layer (55–60 °C) on days 2 to 3 [22]. In contrast, the daily temperature for wet RDF biodrying in the present study reached its maximum value of 70 °C in the middle layer on day 4. This is because the middle layer of the lysimeter can more effectively maintain heat dispersion without the interference of ambient air and humidity.
In addition, the influence of daily temperature under different aeration rates was identified. Cai et al. (2015) showed that the highest temperatures corresponded to lower aeration input rates in sewage sludge biodrying [23]. Sharara et al. (2012) compared aeration rates and temperature variations in the manure biodrying process and found that the higher the temperature, the lower the aeration rate [24]. Similar results were obtained in the present study: by reducing the aeration rate, the temperature increased. Zambra et al. (2011) explained this phenomenon as a result of the higher temperatures arising due to moisture loss following heat and mass transfer during low-aeration operation [25].
The heat accumulation values during the biodrying operation throughout the five studied days were calculated using Equation (1) and presented in terms of T.I. values based on the average temperatures. Figure 3a shows that the highest T.I. value was obtained from Experiment III (2670 °C), followed by Experiments I and II, with values of 2638 °C and 2072 °C, respectively. In addition, the effect of the change in the aeration rate on the T.I. values was calculated by splitting the data into two experimental periods. As shown in Figure 3b, the T.I. phases before and after day 2.5 indicate the effects of changes in the aeration rate. Experiment III displayed the highest cumulative temperature during the initial phase of the experiment due to its higher initial MC and VS availability, which improved the biodegradation process [9]; however, after the aeration rates were modified, Experiment I had the highest T.I. value. This occurred because reducing the aeration rate can increase temperature integration. There was a significant difference in the overall T.I. values between the experiments (p < 0.05). In the first period, the T.I. differences between the experiment pairs were not significant (Experiment I and Experiment II (p = 0.98), Experiment I and Experiment III (p = 0.95), and Experiment II and Experiment III (p = 0.53)). In contrast, there were significant T.I. differences recorded in the second period for all three of the above experiment pairs (p < 0.05).
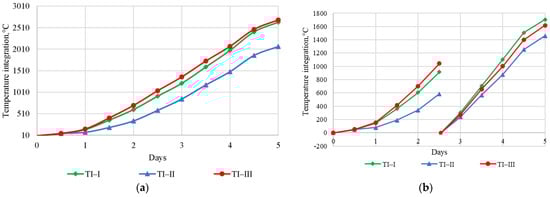
Figure 3.
Plots showing (a) overall temperature integration and (b) temperature integration by phase.
Payomthip et al. (2022) reported that increasing the aeration rate during the MSW biodrying process resulted in increased temperatures from day 2 to day 4 of the total 7-day operation [12]. The findings of the present study contrast with those of Payomthip et al., as a decrease in the aeration rate was found here to correspond to an increase in temperature when biodrying was performed. Yu et al. (2022) compared the effects of low-ventilation and high-ventilation conditions on the pile temperature during the sewage sludge biodrying process. In phase 1 (day 0 to day 3), low ventilation levels maintained higher pile temperatures than those of high ventilation levels; however, in phase 2 (days 3 to 10), high ventilation levels maintained higher pile temperatures than those corresponding to low ventilation levels [26]. It should be noted that the temperature phase of the study by Yu et al. was different from that investigated in this study.
3.2. Gas Generation and Concentration in the Biodrying Process
The inner gases measured at the top, middle, and bottom of the lysimeters corresponded to bioactivity in the organic degradation process. Specifically, the CO2 concentration represents a product of the decomposition process, while the O2 concentration represents the remaining O2 after microbial consumption for the decomposition process. The CO2 concentrations throughout the experiments are shown in Figure 4. In the middle layer, Experiment III displayed the highest CO2 concentration of 7.5%, followed by Experiments II and I with peak concentrations of 3.1% and 2.9%, respectively. The peak CO2 concentrations in the middle layer of each experiment are consistent with the experimental temperatures. The maximum CO2 concentrations in Experiment II and Experiment I were recorded in the middle layer and top layer, respectively.
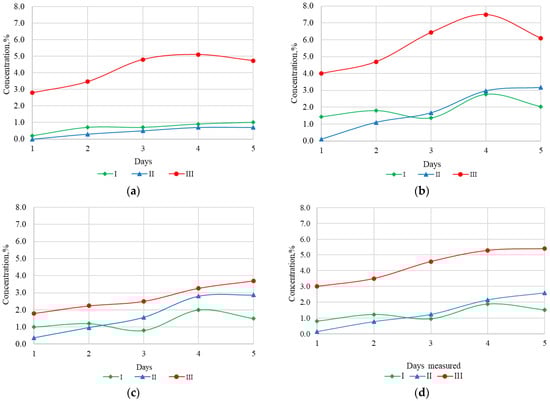
Figure 4.
CO2 concentrations during the biodrying process in the (a) top layer, (b) middle layer, (c) bottom layer, and (d) average layer.
The aeration-supplied configuration had a noticeable effect on inner gas generation. In the first period, the CO2 concentration increased and followed a continuous slope; however, in the second period the slope of each graph changed due to a change in the aeration rate. The CO2 concentration of Experiment I decreased on day 3 and then increased until the end of the experiment. In Experiment III, the slope of the increase in the CO2 concentration was steeper in the second period than in the first period. The observed patterns relate to changes in the aeration: in the second period of the study the aeration was decreased in Experiment I, whereas Experiment III received increased aeration, which stimulated bioactivity from day 2.5 onwards. Variable CO2 generation was demonstrated during the domestic waste biodrying process by Sutthasil et al. (2022), who reported that adding water to the feedstock resulted in the highest CO2 generation levels from day 2 to day 5 [27]. Ngamket et al. (2021) reported that higher temperatures in MSW solar greenhouse biodrying increased CO2 generation under less aeration than that studied here [28]. The present study shows that increases in the aeration rate increase CO2 generation.
High values of CO2 concentration correspond to high levels of bioactivity, which requires O2 for organic degradation. The residual concentrations of O2 are shown in Figure 5. In the middle layer, Experiment III had the lowest O2 concentration of 10.6% on day 4, followed by Experiments I and II with values of 16.5% on day 4 and 16% on day 5, respectively. At the top layer, the minimum O2 concentration of both Experiments I and II was 18.8%, recorded on day 5. For the average layer, the minimum O2 concentration of Experiment I was 17.49%, recorded on day 4; the minimum for Experiment II was 16.5% on day 5; and the minimum for Experiment III was 13.6% on day 5.
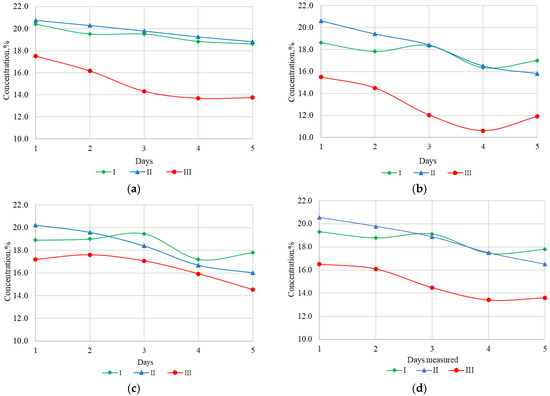
Figure 5.
Residual O2 concentrations recorded during the biodrying process of the (a) top layer, (b) middle layer, (c) bottom layer, and (d) average layer.
Increasing the aeration rate increases the oxygen demand of bioactivity, thus resulting in lower residual amounts of oxygen in the system. In contrast, reducing the aeration rate affects the low oxygen demand of the digestion process, resulting in high residual amounts of O2 in the system [29,30]; however, microorganisms adapt their degradation activity relative to the amount of oxygen entering the system. In addition, all of the aeration rates in this study corresponded to biodrying conditions because the residual oxygen level did not reach the ambient oxygen concentration in the environment (20.8% O2 in ambient air, as measured by a Biogas 5000 monitor).
As reported elsewhere [31,32,33], CO2 concentrations increased and O2 concentrations decreased with an increase in temperature, which represents a similar pattern to the results of this study. Orthodoux et al. (2015) observed strong relationships between temperature and CO2 generation as well as temperature and O2 concentration, with R-squared values of 0.66 and 0.69, respectively [33]. Mejias et al. (2017) reported increased oxygen uptake due to increased temperatures in the organic waste composting process [34]. The present study shows that increases in temperature result in increased O2 concentrations; this is in contrast to the findings of Mejias et al. because the increased O2 concentrations reported here correspond to low oxygen uptake. Zhou et al. (2014) found that an increase in the aeration rate corresponded to increases in temperature, micro-activity, and oxygen consumption [6]; however, the present study clearly identifies increased temperature and oxygen consumption in the period where the aeration rate was decreased.
3.3. Weight Loss and Elevation Change during the Biodrying Process
The weight and elevation of the matrix were measured daily throughout the experiment before the inner gas measurements were collected. As shown in Figure 6a, the maximum weight reduction was recorded in Experiment I (6.2%), followed by Experiments II and III with values of 5.9% and 5.1%, respectively. The reduction rate is represented by the slope of the linear relationship linking the weight loss values in each experiment. The slopes of Experiments I, II, and III were 1.36 (R2 = 0.99), 1.24 (R2 = 0.97), and 0.98 (R2 = 0.99), respectively. Therefore, the reduction rates of Experiments I, II, and III were 1.36%, 1.24%, and 0.98%, respectively.
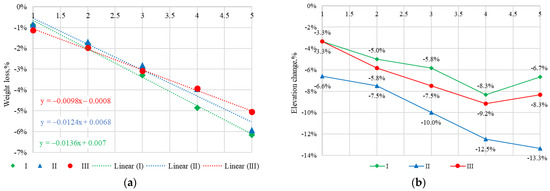
Figure 6.
Evolution of (a) weight loss and (b) elevation change during the biodrying process.
As shown in Figure 6b, the elevation of Experiment II decreased continuously from the beginning of the experiment until the end of the process, accounting for a 13.3% decrease. The elevations of Experiments I and III decreased continuously from the beginning of the experiment to day 4, with decreases of 8.3% and 9.2%, respectively; however, on day 5, their elevations increased again, corresponding to overall decreases of 6.7% and 8.3%, respectively. These changes are consistent with the O2 concentration results described in Section 3.2.
The increase of elevation in Experiment I occurred because reduced aeration increases the system’s temperature, causing the displacement of cold air into the matrix following the principles of heat and mass transfer [23,35,36]; however, the elevation increase observed in Experiment III could be caused by the displacement of ambient air into the matrix due to an increase in the air forcing process [37,38,39].
The daily matrix density values were also calculated using the elevation change, as described in Equation (2). The density is related to void space, which controls the permeability of the matrix to air (Li et al., 2019) [40]. The calculated matrix density values are shown in Table 2.
Table 2.
Matrix density (kg/m3) values during the biodrying process of each experiment.
The matrix density of Experiment II continuously increased from the beginning of the experiment to day 5 due to its stable aeration rate. The matrix density of Experiment I continuously increased from day 0 to day 3 and then dropped on day 4 because of the decrease in the aeration rate in the second phase of the experiment. Senthil et al. (2021) reported that increases in waste density correspond to more significant decreases in the MC of waste piles [41]. Tom et al. (2016) observed that the bulk density was achieved in 33 days, corresponding to a 52% density increase, and weight reduction became negligible on day 20 [22]. In the present study, the bulk density values recorded on day 5 were 236.35 kg/m3, 259.81 kg/m3, and 251.18 kg/m3 for Experiments I, II, and III, respectively.
3.4. Volatile Solid and Moisture Content Change in Each Layer of the Lysimeter
The degraded material in the lysimeter reflects the microorganisms’ digestion ability, which is reflected in the moisture and VS removal [23,42,43]. The VS and MC removal values of each experiment were analyzed at different levels in the lysimeters, as shown in Figure 7. The VS reduction was not only affected by the aeration rate but also by the influence of depth within the lysimeter. Each layer experienced differences in terms of its ambient air contact area, water flow by gravity, and aeration force.
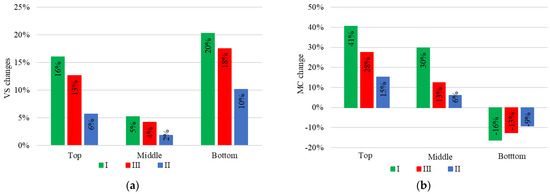
Figure 7.
Evolution of the decrease in (a) volatile solid and (b) moisture content of Experiments I, II, and III at three different levels. Note that positive values correspond to a decrease in these properties, while negative values represent an increase.
The maximum VS change occurred in the bottom layer of Experiment I at 20%, followed by Experiment III at 18%. The lowest VS change occurred in the middle layer of Experiment II, with a value of 2%. In terms of each layer, the VS changes in the bottom layer were typically the largest, followed by the top and middle layers. In addition, the influence of the modified aeration rate in each experiment had the following effects: decreasing the aeration rate during the biodrying process resulted in the largest reduction in VS content, while excess aeration rates during the biodrying process corresponded to effective VS removal. Zhou et al. (2018) found that VS degradation was faster under increased temperatures, with the VS loss corresponding to degraded material [20]. As shown in Figure 7a, Experiment I achieved the highest temperature, degradable material loss, and change in VS content, similar to the findings of Zhou et al. Yu et al. (2022) studied the effects of a high aeration rate (1.99 m3/kg/day) and low aeration rate (1.34 m3/kg/day) on VS changes in different sewage sludge biodrying phases. The second phase of the sewage sludge biodrying from day 2 to day 10 achieved the highest VS degradation under a low aeration rate of 8.8%, while for high aeration this figure was 6.7% [26]. Notably, the present study showed that the low aeration rate (Experiment I) in the second phase of the wet RDF biodrying process increased the VS reduction relative to the high aeration rate (Experiment III).
Throughout the experiment, water was not only removed by gravity drainage and aeration but also through evaporation, leaching, and condensation [40]. Under negative aeration, water flow may occur into the blower [44,45]. The U-trap used in this experiment was designed to prevent the condensation under the perforated metal plate from entering the blower; therefore, water removal at different layers of the lysimeter was influenced by the modification of the aeration rate. As shown in Figure 7b, the MC in the top and middle layers was reduced, whereas the MC in the bottom layer increased. In the top and middle layers, Experiment II had the largest reduction in the MC, with values of 41% and 30%, respectively, followed by Experiment III (28% and 13%, respectively) and Experiment I (15% and 6%, respectively). In contrast, the MC values in the bottom layers of Experiments II, III, and I increased by 16%, 13%, and 9%, respectively. The accumulated MC values in the bottom layer were lower than the minimum water content for micro-activity [18].
The increase in moisture recorded at the bottom of the lysimeters was due to water accumulation under the effects of gravity, leachate accumulation, and air forcing. In addition, the high temperatures at this level indicate that the water accumulation contributed to the system’s internal heat. The process of heating liquids to cause evaporation could occur in this scenario (Haug, 1993; Wang et al., 2011); however, the vaporization process was not completed during the experimental period in this study, resulting in high residual MC in the bottom layer and continuously rising temperatures.
Several studies have characterized moisture removal through evaporation and identified similar changes in temperature patterns, with the most vapor loss recorded on reaching the maximum temperature. For example, this pattern was observed by Zaman et al. (2021) on day 2 and day 6 [46], by Yuan et al. (2018) from day 3 to day 5 [7], by Sutthasil et al. (2022) during days 2 to 5 [27], by Li et al. (2022) on day 3 [47], and by Xin et al. (2022) in the range of days 4–6 [48]. Consistent with these studies, the highest average temperature was recorded in Experiment I between days 3 and 5, which also had the greatest MC loss. Unidirectional airflow has been investigated in vertical profiles under positive aeration, which tends to cause moisture accumulation in the top layer [21,49,50]. In contrast, under negative aeration, such as that used in this study, water molecules tend to accumulate in the bottom layer.
As shown in Figure 7a,b, two factors led to the observed changes in VS: (1) modification of the aeration rate during the experiment and (2) variations in the MC in the matrix at each level. Variations in the matrix’s MC had more of an effect on the changes in VS than changes in the aeration rate. In addition, the changes in VS can be classified as follows: (1) during the experiment, an increase in the MC and a decrease in the aeration rate as well as (2) an increase in the MC and an increase in the aeration rate. Zhao et al. (2010) showed that the airflow rate had a more significant impact on moisture removal than on VS loss, which was consistent with the trend observed in this study [49]. Yuan et al. (2018) reported that both continuous and intermittent aeration had no significant effect on VS degradation when the initial MC and aeration rate remained constant [7].
3.5. Determination of Organic Degradation during the Biodrying Process
Figure 8 shows the degradation rate of degradable material in each experiment as obtained from Equation (4). In the initial period, the organic degradation followed the same trend in all three experiments. Experiment III achieved the maximum organic content degradation, followed by Experiments II and I. In the second period, the organic degradation trend remained constant in Experiment II but changed in Experiments I and III. The degradation rate in Experiment I notably decreased to its minimum value on day 3 (5.9 g/h) before increasing and then stabilizing until the end of the experiment. Experiment III showed a noticeable increase in its degradation rate to achieve its maximum value on day 3 (40.48 g/h) before decreasing and then stabilizing until the end of the experiment. The degradation curves of the modified airflow rates (Experiments I and III) were adjusted to resemble the stable airflow rate (Experiment II), since day 3 was staged to be a maintained degradation period.
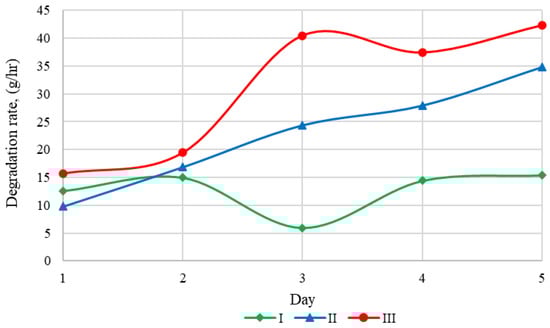
Figure 8.
The degradation rate of each experiment.
Several previous studies have investigated irregular matrix airflows during biodrying operations, i.e., intermittent aeration and interrupted airflows via pile turning, resulting in a maintained degradation stage. The study by Yuan et al. (2018) found variations in temperature during the operation under both continuous and intermittent airflow [7]. Yu et al. (2022) demonstrated a steady decrease in the MC even though a fixed airflow rate was used in an intermittent aeration mode [26]. Huilinir and Villegas (2015) reported that the temperature decreased and then increased within less than 12 h after pile turning [5]. Similar to this study, these findings demonstrate that modifying the aeration rate during the biodrying process strongly affects the degradation in the maintained stage even within timescales as short as 12 h.
3.6. Mass Change and Biodrying Index
The biodrying operation reduces the MC via air outflow, evaporation, and leachate generation, resulting in mass changes in the biodried product. To investigate the effects of modifying the aeration rate, the mass change of each experiment is shown in Table 3 The full biodried products were obtained by complete mixing following the quartering process. After the experiment ended, the greatest decrease in degradable material was recorded in Experiment I (27%), followed by Experiment II (22%) and Experiment III (2%).
Table 3.
Comparison of the mass changes recorded between the feedstock and biodried product.
In contrast, the greatest increase in the non-degradable material + other class was recorded in Experiment II at 10%, followed by Experiment I at 6%. This is because the degradation process produces water, which accumulates in materials such as cloth, diapers, and sanitary napkins, in addition to causing an increase in the non-degradable material’s weight. The MC in the mass decreased, with the largest reduction of 35% recorded in Experiment I, followed by Experiments III and II at 20% and 6%, respectively. In addition, the final MC in the degradable material was found to be relatively stable at 45% in Experiments I and II, followed by 43% in Experiment III. In the biodried product, the largest decrease in the MC was recorded in Experiment I (12.61 kg), which accounted for 50% of the initial MC, followed by Experiments III and II with values of 16.49 kg and 14.77 kg, corresponding to 42% and 37%, respectively. The greatest decrease in the dry degradable material was recorded in the biodried product obtained from Experiment II, accounting for 66%, followed by Experiments I and III with values of 61% and 26%, respectively. Therefore, the dry degradable material masses in the biodried products of Experiments I, II, and III were 4.53 kg, 4.19 kg, and 5.94 kg, respectively. Although the bottom of the lysimeter was configured for leachate collection, no leachate production was observed during the entire biodrying process.
Based on the aeration variations conducted in this study, decreasing the aeration rate during the biodrying process mostly affected the decrease in the MC and waste mass. This behavior was clearly demonstrated by the 35% decrease recorded from an initial MC of 37%. During the operation, the increased aeration rate in Experiment III promoted the physical transfer of the MC to the environment. Thus, these results indicate that the MC was more effectively removed by evaporation than by forced aeration, which was associated with higher temperature accumulation.
Based on the mass of feedstock and biodried product, the biodrying performance was evaluated using the B.I., which was calculated using Equation (5). The results are shown in Table 4. Experiment I exhibited the greatest loss in the MC and the lowest dry organic loss, corresponding to the best performance in terms of the B.I. with a value of 0.22. Experiments III and II had MC losses of 11.06 kg and 8.50 kg and corresponding dry organic losses of 3.98 kg and 3.86 kg, with B.I. values of 0.27 and 0.45, respectively.
Table 4.
Biodrying index values based on the proportion of dry organic loss and moisture loss.
Many studies have assessed the B.I. based on the proportion of water loss and volatile solid loss [5,42,49]. Although the organic loss and VS loss values in previous studies showed similar trends, the values of these indexes were different because of the different operating conditions used in the experiments. Huilinir and Villegas (2015) summarized that the initial MC has a greater effect on the B.I. than the aeration rate [5]; however, the results of the present study indicate a different trend. Although both decreases and increases in the aeration range during biodrying had a similar effect on the B.I., this study demonstrates that modifying the aeration rate had a more pronounced effect on the B.I. than constant aeration.
3.7. The Heating Value and Moisture Content in the Biodried Product
This study aimed to enhance the quality of wet RDF to meet the requirements of Thailand’s local cement industry. The primary criteria for RDF production were the maximum MC and minimum LHV, which should have values of 30% and 4500 kcal/kg, respectively. The key purpose of the biodrying process is to reduce the excess MC while simultaneously increasing the LHV. Due to the limited organic content in wet RDF for generating and stimulating heat production for converting water into vapor, the aeration characteristics supplied to the system played an important role in this study. The results in Figure 9 show the efficiency of the biodrying process, as reflected in the characteristics of the final biodried products. As shown in Figure 9a, the final MC values were 24.07%, 31.33%, and 33.83% for Experiments I, II, and III, respectively. The final LHVs of Experiments I, II, and III were calculated as 4787 kcal/kg, 4601 kcal/kg, and 4411 kcal/kg, respectively. In addition, as shown in Figure 9b, Experiment I achieved the lowest MC and the highest LHV, with a decrease and increase of 35% and 11%, respectively.
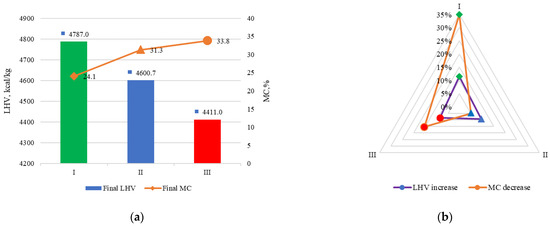
Figure 9.
Comparison of biodried products in terms of the (a) low heating value as well as moisture content and the (b) increases and decreases in these parameters.
Figure 8a shows each experiment’s trends in terms of the LHV and MC. This was analyzed in terms of the heating value, chemical composition, and water content. The LHV of fuel increases with the hydrogen content due to the combustion of water. In addition, the LHV is defined as the energy released from materials burned, which excludes the heat of vaporization of the water [51,52]. Therefore, the LHV and MC are proportional to each other. Figure 8b shows the changes in the LHV and MC, which reflect the overall performance of the biodrying process; as shown, biodrying had a more significant effect on the MC than on the LHV. In terms of the criteria for RDF production for Thailand’s local cement industry, Experiment I met the required standards due to providing lower MC and higher LHV values than the requirements stipulate; however, the results of Experiment II only satisfied the LHV criterion.
4. Conclusions
This study proposed an aeration-supplied configuration to stimulate heat for evaporation and ventilation to improve the biodrying performance of wet RDF. The modified aeration procedure was evaluated in terms of two main criteria: temperature evolution and gas generation. Decreases in the aeration rate could help to accumulate heat in the system to stimulate vapor evaporation, while excess aeration rates could force vapor removal via ventilation.
Reducing the aeration rate during the biodrying process resulted in maintained stable heat generation, which affected the following parameters: Greater MC removal was achieved due to evaporation rather than increased air force, corresponding to greater temperature accumulation. VS content and MC were simultaneously reduced under aeration, and the degradation rate stages stabilized in 12 h to maintain evenness.
Good performance of the aeration-supplied configuration was achieved by reducing the aeration rate during the biodrying process by 40% compared to the first period (0.5 m3/kg/day followed by 0.3 m3/kg/day). The biodried product from this configuration not only met the RDF production requirements for Thailand’s local cement industry in terms of the LHV and MC, but this configuration also minimized the energy consumption required for operating the biodrying process; however, as the final MC values are a critical parameter in Thailand’s standards for RDF production and are related to heat accumulation as well as vapor evaporation, the other aeration-supplied configurations studied were not acceptable for RDF production.
Author Contributions
A.B. performed the experiment. A.B. also calculated, drafted, and interpreted the data and analysis. S.P. and K.W. suggested the experimental design and calculations checked in this study. All of the co-authors read, revised the content, checked the grammar and language, approved the final manuscript, and agreed to this submission. All authors have read and agreed to the published version of the manuscript.
Funding
A part of this study was supported by (1) the National Research Council of Thailand (NRCT), (2) SCI Eco Services Co., Ltd., (3) the Joint Graduate School of Energy and Environment (JGSEE), King Mongkut’s University of Technology Thonburi, and (4) the Center of Excellence on Energy Technology and Environment (CEE), the Ministry of Higher Education, Science, Research and Innovation (MHESI).
Data Availability Statement
Not applicable.
Acknowledgments
This study would like to thank Tanik Itsaratorn who is a Ph.D. student at the Joint Graduate School of Energy and Environment (JGSEE), King Mongkut’s University of Technology Thonburi, Bangkok, Thailand, and SCI Eco Services Co., Ltd. for helping with the laboratory performance.
Conflicts of Interest
The authors declare no conflict of interest.
References
- Sharma, H.B.; Vanapalli, K.R.; Cheela, V.S.; Ranjan, V.P.; Jaglan, A.K.; Dubey, B.; Goel, S.; Bhattacharya, J. Challenges, opportunities, and innovations for effective solid waste management during and post COVID-19 pandemic. Resour. Conserv. Recycl. 2020, 162, 105052. [Google Scholar] [CrossRef] [PubMed]
- Liu, C.; Bunditsakulchai, P.; Zhuo, Q. Impact of COVID-19 on food and plastic waste generated by consumers in Bangkok. Sustainability 2021, 13, 8988. [Google Scholar] [CrossRef]
- Nithikul, J.; Karthikeyan, O.P.; Visvanathan, C. Reject management from a mechanical biological treatment plant in Bangkok, Thailand. Resour. Conserv. Recycl. 2011, 55, 417–422. [Google Scholar] [CrossRef]
- del Carmen Munguía-López, A.; Ochoa-Barragán, R.; Ponce-Ortega, J.M. Optimal waste management during the COVID-19 pandemic. Chem. Eng. Process. Process Intensif. 2022, 176, 108942. [Google Scholar] [CrossRef] [PubMed]
- Huiliñir, C.; Villegas, M. Simultaneous effect of initial moisture content and airflow rate on biodrying of sewage sludge. Water Res. 2015, 82, 118–128. [Google Scholar] [CrossRef]
- Zhou, H.B.; Chen, T.B.; Gao, D.; Zheng, G.D.; Chen, J.; Pan, T.H.; Liu, H.T.; Gu, R.Y. Simulation of water removal process and optimization of aeration strategy in sewage sludge composting. Bioresour. Technol. 2014, 171, 452–460. [Google Scholar] [CrossRef]
- Yuan, J.; Zhang, D.; Li, Y.; Li, J.; Luo, W.; Zhang, H.; Wang, G.; Li, G. Effects of the aeration pattern, aeration rate, and turning frequency on municipal solid waste biodrying performance. J. Environ. Manag. 2018, 218, 416–424. [Google Scholar] [CrossRef]
- Colomer-Mendoza, F.J.; Herrera-Prats, L.; Robles-Martinez, F.; Gallardo-Izquierdo, A.; Piña-Guzman, A.B. Effect of airflow on biodrying of gardening wastes in reactors. J. Environ. Sci. 2013, 25, 865–872. [Google Scholar] [CrossRef]
- Bhatsada, A.; Patumsawad, S.; Itsarathorn, T.; Towprayoon, S.; Chiemchaisri, C.; Phongphiphat, A.; Wangyao, K. Improvement of energy recovery potential of wet-refuse-derived fuel through bio-drying process. J. Mater. Cycles Waste Manag. 2022, 25, 637–649. [Google Scholar] [CrossRef]
- Pilnáček, V.; Innemanová, P.; Šereš, M.; Michalíková, K.; Stránská, Š.; Wimmerová, L.; Cajthaml, T. Micropollutant biodegradation and the hygienization potential of biodrying as a pretreatment method prior to the application of sewage sludge in agriculture. Ecol. Eng. 2019, 127, 212–219. [Google Scholar] [CrossRef]
- Haug, R.T. The Practical Handbook of Compost Engineering; Ann Arbor Science Publishers: New York, NY, USA, 1993. [Google Scholar]
- Payomthip, P.; Towprayoon, S.; Chiemchaisri, C.; Patumsawad, S.; Wangyao, K. Optimization of Aeration for Accelerating Municipal Solid Waste Biodrying. Int. J. Renew. Energy Dev. 2022, 11, 878–888. [Google Scholar] [CrossRef]
- Zhang, D.; Pinjing, H.E.; Liming, S.H.A.O.; Taifeng, J.I.N.; Jingyao, H.A.N. Biodrying of municipal solid waste with high water content by combined hydrolytic-aerobic technology. J. Environ. Sci. 2008, 20, 1534–1540. [Google Scholar] [CrossRef]
- Zhang, D.Q.; He, P.J.; Jin, T.F.; Shao, L.M. Bio-drying of municipal solid waste with high water content by aeration procedures regulation and inoculation. Bioresour. Technol. 2008, 99, 8796–8802. [Google Scholar] [CrossRef]
- Diez, F.J.; Correa-Guimaraes, A.; Chico-Santamarta, L.; Martínez-Rodríguez, A.; Murcia-Velasco, D.A.; Andara, R.; Navas-Gracia, L.M. Prediction of daily ambient temperature and its hourly estimation using artificial neural networks in an agrometeorological station in Castile and León, Spain. Sensors 2022, 22, 4850. [Google Scholar] [CrossRef]
- Denpetkul, T.; Phosri, A. Daily ambient temperature and mortality in Thailand: Estimated effects, attributable risks, and effect modifications by greenness. Sci. Total Environ. 2021, 791, 148373. [Google Scholar] [CrossRef]
- Polprasert, C. Organic Waste Recycling: Technology and Management; IWA Publishing: London, UK, 2007. [Google Scholar]
- Kluczek-Turpeinen, B. Lignocellulose Degradation and Humus Modification by the Fungus Paecilomyces inflatus. Ph.D. Thesis, Helsingin yliopisto, Helsinki, Finland, 2007. [Google Scholar]
- Thai Meteorological Department. Thailand Monthly Weather 2022. 2022. Available online: https://www.tmd.go.th/media/climate-monthly (accessed on 1 May 2022).
- Zhou, H.; Shen, Y.; Meng, H.; Gao, D.; Chen, T. Effect of air temperature and aeration strategy on water removal during sewage sludge composting. Dry. Technol. 2018, 36, 1474–1480. [Google Scholar] [CrossRef]
- Wang, K.; Li, W.; Guo, J.; Zou, J.; Li, Y.; Zhang, L. Spatial distribution of dynamics characteristic in the intermittent aeration static composting of sewage sludge. Bioresour. Technol. 2011, 102, 5528–5532. [Google Scholar] [CrossRef]
- Tom, A.P.; Pawels, R.; Haridas, A. Biodrying process: A sustainable technology for treatment of municipal solid waste with high moisture content. Waste Manag. 2016, 49, 64–72. [Google Scholar] [CrossRef]
- Cai, L.; Gao, D.; Hong, N. The effects of different mechanical turning regimes on heat changes and evaporation during sewage sludge biodrying. Dry. Technol. 2015, 33, 1151–1158. [Google Scholar] [CrossRef]
- Sharara, M.A.; Sadaka, S.; Costello, T.A.; VanDevender, K. Influence of aeration rate on the physio-chemical characteristics of biodried dairy manure-wheat straw mixture. Appl. Eng. Agric. 2012, 28, 407–415. [Google Scholar] [CrossRef]
- Payomthip, P. Biodrying of Municipal Solid Waste by Combined Air Suction and Mixing Technology. Ph.D. Thesis, The Joint Graduate School of Energy and Environment (JGSEE), King Mongkut’s University of Technology Thonburi(KMUTT), Bangkok, Thailand, 2021. [Google Scholar]
- Yu, B.; Chen, T.; Zheng, G.; Yang, J.; Huang, X.; Fu, L.; Cai, L. Water-heat balance characteristics of the sewage sludge bio-drying process in a full-scale bio-drying plant with circulated air. Waste Manag. 2022, 141, 220–230. [Google Scholar] [CrossRef] [PubMed]
- Sutthasil, N.; Ishigaki, T.; Ochiai, S.; Yamada, M.; Chiemchaisri, C. Carbon conversion during biodrying of municipal solid waste generated under tropical Asian conditions. Biomass Convers. Biorefin. 2022. [Google Scholar] [CrossRef]
- Ngamket, K.; Wangyao, K.; Patumsawad, S.; Chaiwiwatworakul, P.; Towprayoon, S. Quality improvement of mixed MSW drying using a pilot-scale solar greenhouse biodrying system. J. Mater. Cycles Waste Manag. 2021, 23, 436–448. [Google Scholar] [CrossRef]
- Cai, L.; Chen, T.B.; Gao, D.; Zheng, G.D.; Liu, H.T.; Pan, T.H. Influence of forced air volume on water evaporation during sewage sludge bio-drying. Water Res. 2013, 47, 4767–4773. [Google Scholar] [CrossRef]
- De Guardia, A.; Petiot, C.; Rogeau, D. Influence of aeration rate and biodegradability fractionation on composting kinetics. Waste Manag. 2008, 28, 73–84. [Google Scholar] [CrossRef]
- Sundberg, C.; Jönsson, H. Process inhibition due to organic acids in fed-batch composting of food waste–influence of starting culture. Biodegradation 2005, 16, 205–213. [Google Scholar] [CrossRef]
- Chang, J.I.; Hsu, T.E. Effects of compositions on food waste composting. Bioresour. Technol. 2008, 99, 8068–8074. [Google Scholar] [CrossRef]
- Orthodoxou, D.; Pettitt, T.R.; Fuller, M.; Newton, M.; Knight, N.; Smith, S.R. An investigation of some critical physico-chemical parameters influencing the operational rotary in-vessel composting of food waste by a small-to-medium sized enterprise. Waste Biomass Valorization 2015, 6, 293–302. [Google Scholar] [CrossRef]
- Mejias, L.; Komilis, D.; Gea, T.; Sánchez, A. The effect of airflow rates and aeration mode on the respiration activity of four organic wastes: Implications on the composting process. Waste Manag. 2017, 65, 22–28. [Google Scholar] [CrossRef]
- Ham, G.Y.; Matsuto, T.; Tojo, Y.; Matsuo, T. Material and moisture balance in a full-scale bio-drying MBT system for solid recovered fuel production. J. Mater. Cycles Waste Manag. 2020, 22, 167–175. [Google Scholar] [CrossRef]
- Zou, H.F.; Fei, Y.C.; Yu, M. Brief analysis of the heat and mass balance in sludge bio-drying process. In Advanced Materials Research; Trans Tech Publications Ltd.: Zurich, Switzerland, 2012; Volume 518, pp. 34–38. [Google Scholar] [CrossRef]
- Wang, K.; Li, W.; Li, Y.; Gong, X.; Wu, C.; Ren, N. The modelling of combined strategies to achieve thermophilic composting of sludge in cold region. Int. Biodeterior. Biodegrad. 2013, 85, 608–616. [Google Scholar] [CrossRef]
- Zumdahl, S.S.; DeCoste, D.J. Introductory Chemistry; Cengage Learning: Boston, MA, USA, 2014. [Google Scholar]
- Shah, M.M. Improved method for calculating evaporation from indoor water pools. Energy Build. 2012, 49, 306–309. [Google Scholar] [CrossRef]
- Li, Q.; Zhi, S.; Yu, X.; Li, Y.; Guo, H.; Yang, Z.; Zhang, S. Biodegradation of volatile solids and water mass balance of bio-drying sewage sludge after electro-dewatering pretreatment. Waste Manag. 2019, 91, 9–19. [Google Scholar] [CrossRef]
- Senthil, M.; Suresh, E. Physical characteristics of municipal solid wastes of perungudi landfill dump site for its sustainability. J. Maharaja Sayajirao Univ. Baroda 2021, 55, 182–191. [Google Scholar]
- Yang, B.; Zhang, L.; Jahng, D. Importance of initial moisture content and bulking agent for biodrying sewage sludge. Dry. Technol. 2014, 32, 135–144. [Google Scholar] [CrossRef]
- Rada, E.C.; Franzinelli, A.; Taiss, M.; Ragazzi, M.; Panaitescu, V.; Apostol, T. Lower heating value dynamics during municipal solid waste bio-drying. Environ. Technol. 2007, 28, 463–469. [Google Scholar] [CrossRef]
- Shao, L.M.; He, X.; Yang, N.; Fang, J.J.; Lü, F.; He, P.J. Biodrying of municipal solid waste under different ventilation modes: Drying efficiency and aqueous pollution. Waste Manag. Res. 2012, 30, 1272–1280. [Google Scholar] [CrossRef]
- Evangelou, A.; Gerassimidou, S.; Mavrakis, N.; Komilis, D. Monitoring the performances of a real scale municipal solid waste composting and a biodrying facility using respiration activity indices. Environ. Monit. Assess. 2016, 188, 302. [Google Scholar] [CrossRef]
- Zaman, B.; Hardyanti, N.; Samadikun, B.P.; Restifani, M.S.; Purwono, P. Conversion of municipal solid waste to refuse-derived fuel using biodrying. IOP Conf. Ser. Earth Environ. Sci. 2021, 623, 012003. [Google Scholar] [CrossRef]
- Li, J.; Ju, T.; Lin, L.; Meng, F.; Han, S.; Meng, Y.; Du, Y.; Song, M.; Lan, T.; Jiang, J. Biodrying with the hot-air aeration system for kitchen food waste. J. Environ. Manag. 2022, 319, 115656. [Google Scholar] [CrossRef]
- Xin, L.; Qin, Y.; Lou, T.; Xu, X.; Wang, H.; Mei, Q.; Wu, W. Rapid start-up and humification of kitchen waste composting by an innovative biodrying-enhanced process. Chem. Eng. J. 2023, 452, 139459. [Google Scholar] [CrossRef]
- Zhao, L.; Gu, W.M.; He, P.J.; Shao, L.M. Effect of air-flow rate and turning frequency on bio-drying of dewatered sludge. Water Res. 2010, 44, 6144–6152. [Google Scholar] [CrossRef] [PubMed]
- Sugni, M.; Calcaterra, E.; Adani, F. Biostabilization–biodrying of municipal solid waste by inverting air-flow. Bioresour. Technol. 2005, 96, 1331–1337. [Google Scholar] [CrossRef] [PubMed]
- Demirbas, A. Effects of moisture and hydrogen content on the heating value of fuels. Energy Sources Part A Recovery Util. Environ. Eff. 2007, 29, 649–655. [Google Scholar] [CrossRef]
- Erdoğan, S. LHV and HHV prediction model using regression analysis with the help of bond energies for biodiesel. Fuel 2021, 301, 121065. [Google Scholar] [CrossRef]
Disclaimer/Publisher’s Note: The statements, opinions and data contained in all publications are solely those of the individual author(s) and contributor(s) and not of MDPI and/or the editor(s). MDPI and/or the editor(s) disclaim responsibility for any injury to people or property resulting from any ideas, methods, instructions or products referred to in the content. |
© 2023 by the authors. Licensee MDPI, Basel, Switzerland. This article is an open access article distributed under the terms and conditions of the Creative Commons Attribution (CC BY) license (https://creativecommons.org/licenses/by/4.0/).