

Economic and Environmental Benefits of Energy Recovery from Municipal Solid Waste in Phnom Penh Municipality, Cambodia


Abstract
1. Introduction
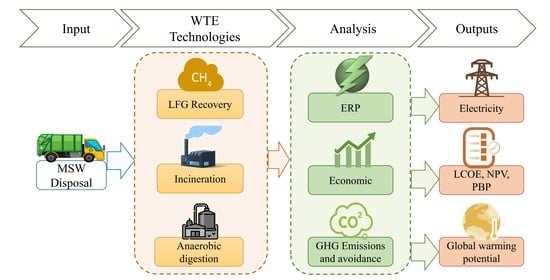
2. Methodologies
2.1. Status of MSWM in Phnom Penh Municipality
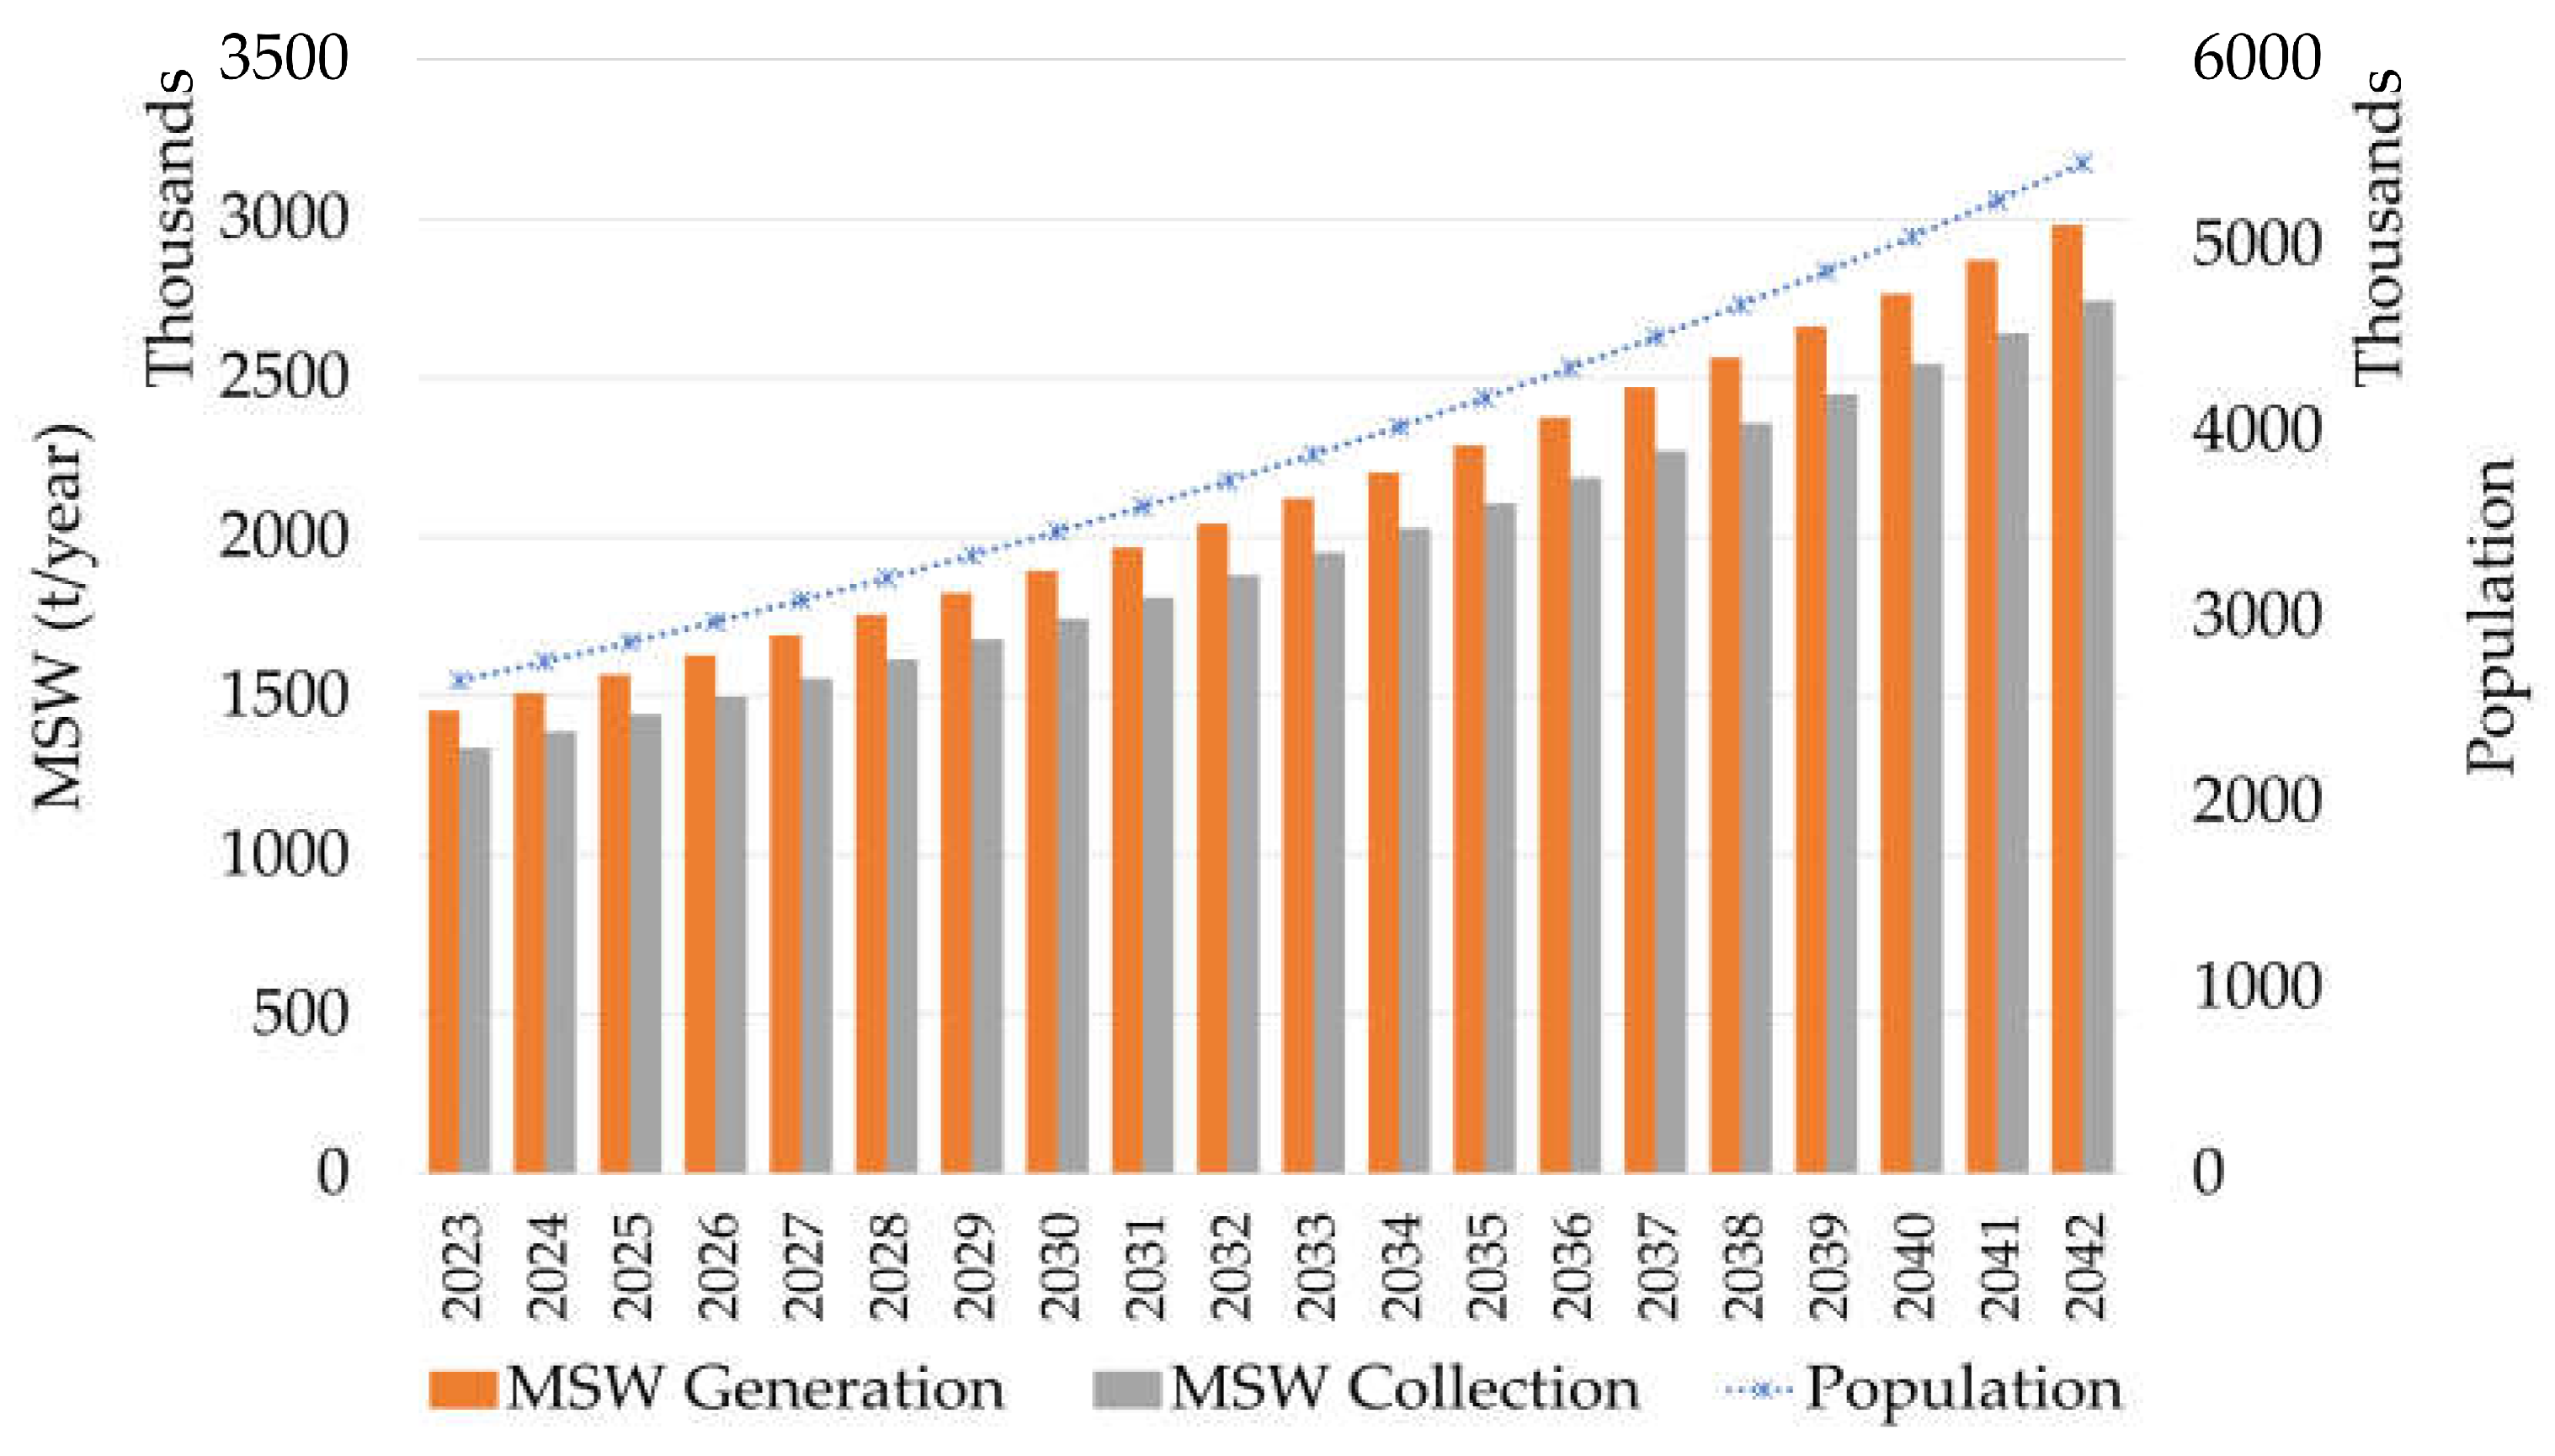
2.2. Waste Generation and Characteristics
2.3. Estimation of Energy Recovery Potential
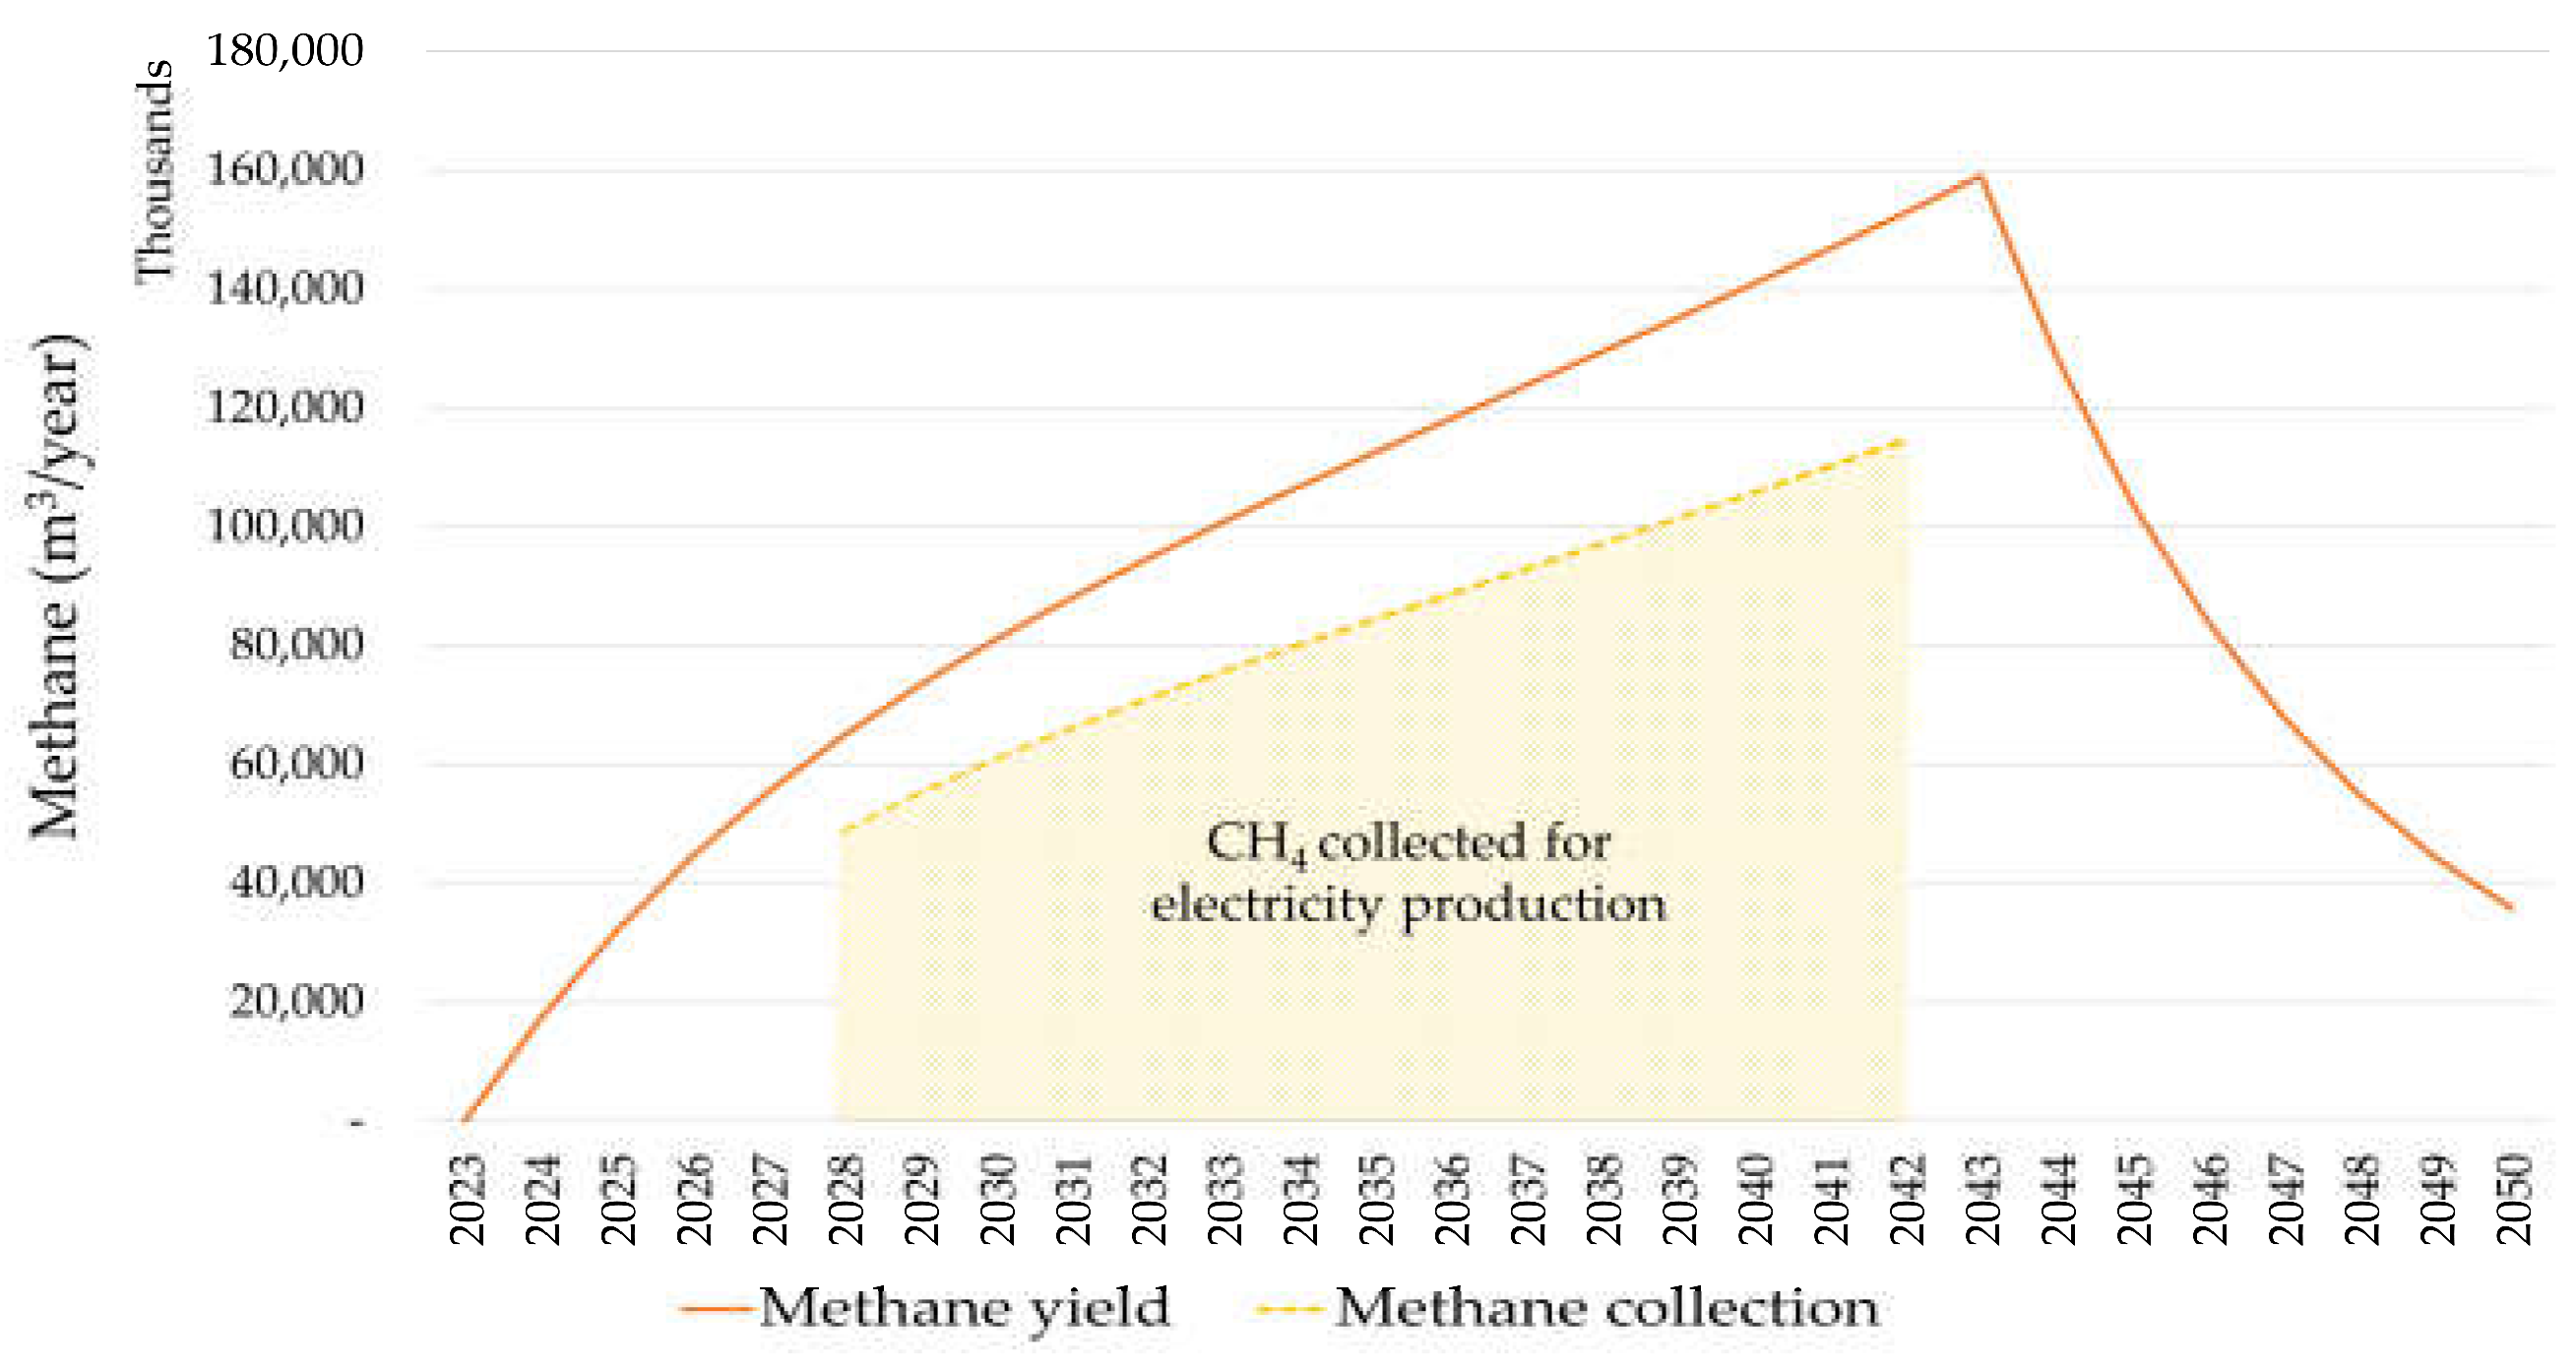
2.3.1. Energy Generation from LFG
2.3.2. Energy Generation from Incineration
2.3.3. Energy Generation from AD
2.4. Economic Feasibility Analysis
2.4.1. Net Present Value (NPV)
2.4.2. Payback Period (PBP)
2.4.3. Levelized Cost of Electricity (LCOE)
2.4.4. Capital Investment and Operating Expenditure
Investment and Operating Cost for LFG Recovery
Investment and Operating Cost for Incineration
Investment and Operating Cost for AD

| Parameter | Value |
|---|---|
| Electricity price (USD/kWh) | 0.095 a |
| Discount rate (%) | 10 b |
| Gate fee (USD/ton) | 1.00 |
| Internal use of electricity (%) | 20 c |
| Marginal tax rate (%) | 20 |
| Variable OPEX for LFG and AD (%) | 4.40 d |
| Variable OPEX for incineration (%) | 4.00 d |
| General inflation rate (%) | 5.48 |
2.5. Environmental Performance Evaluation
2.5.1. Direct GHG Emissions
2.5.2. GHG Emission Avoidance
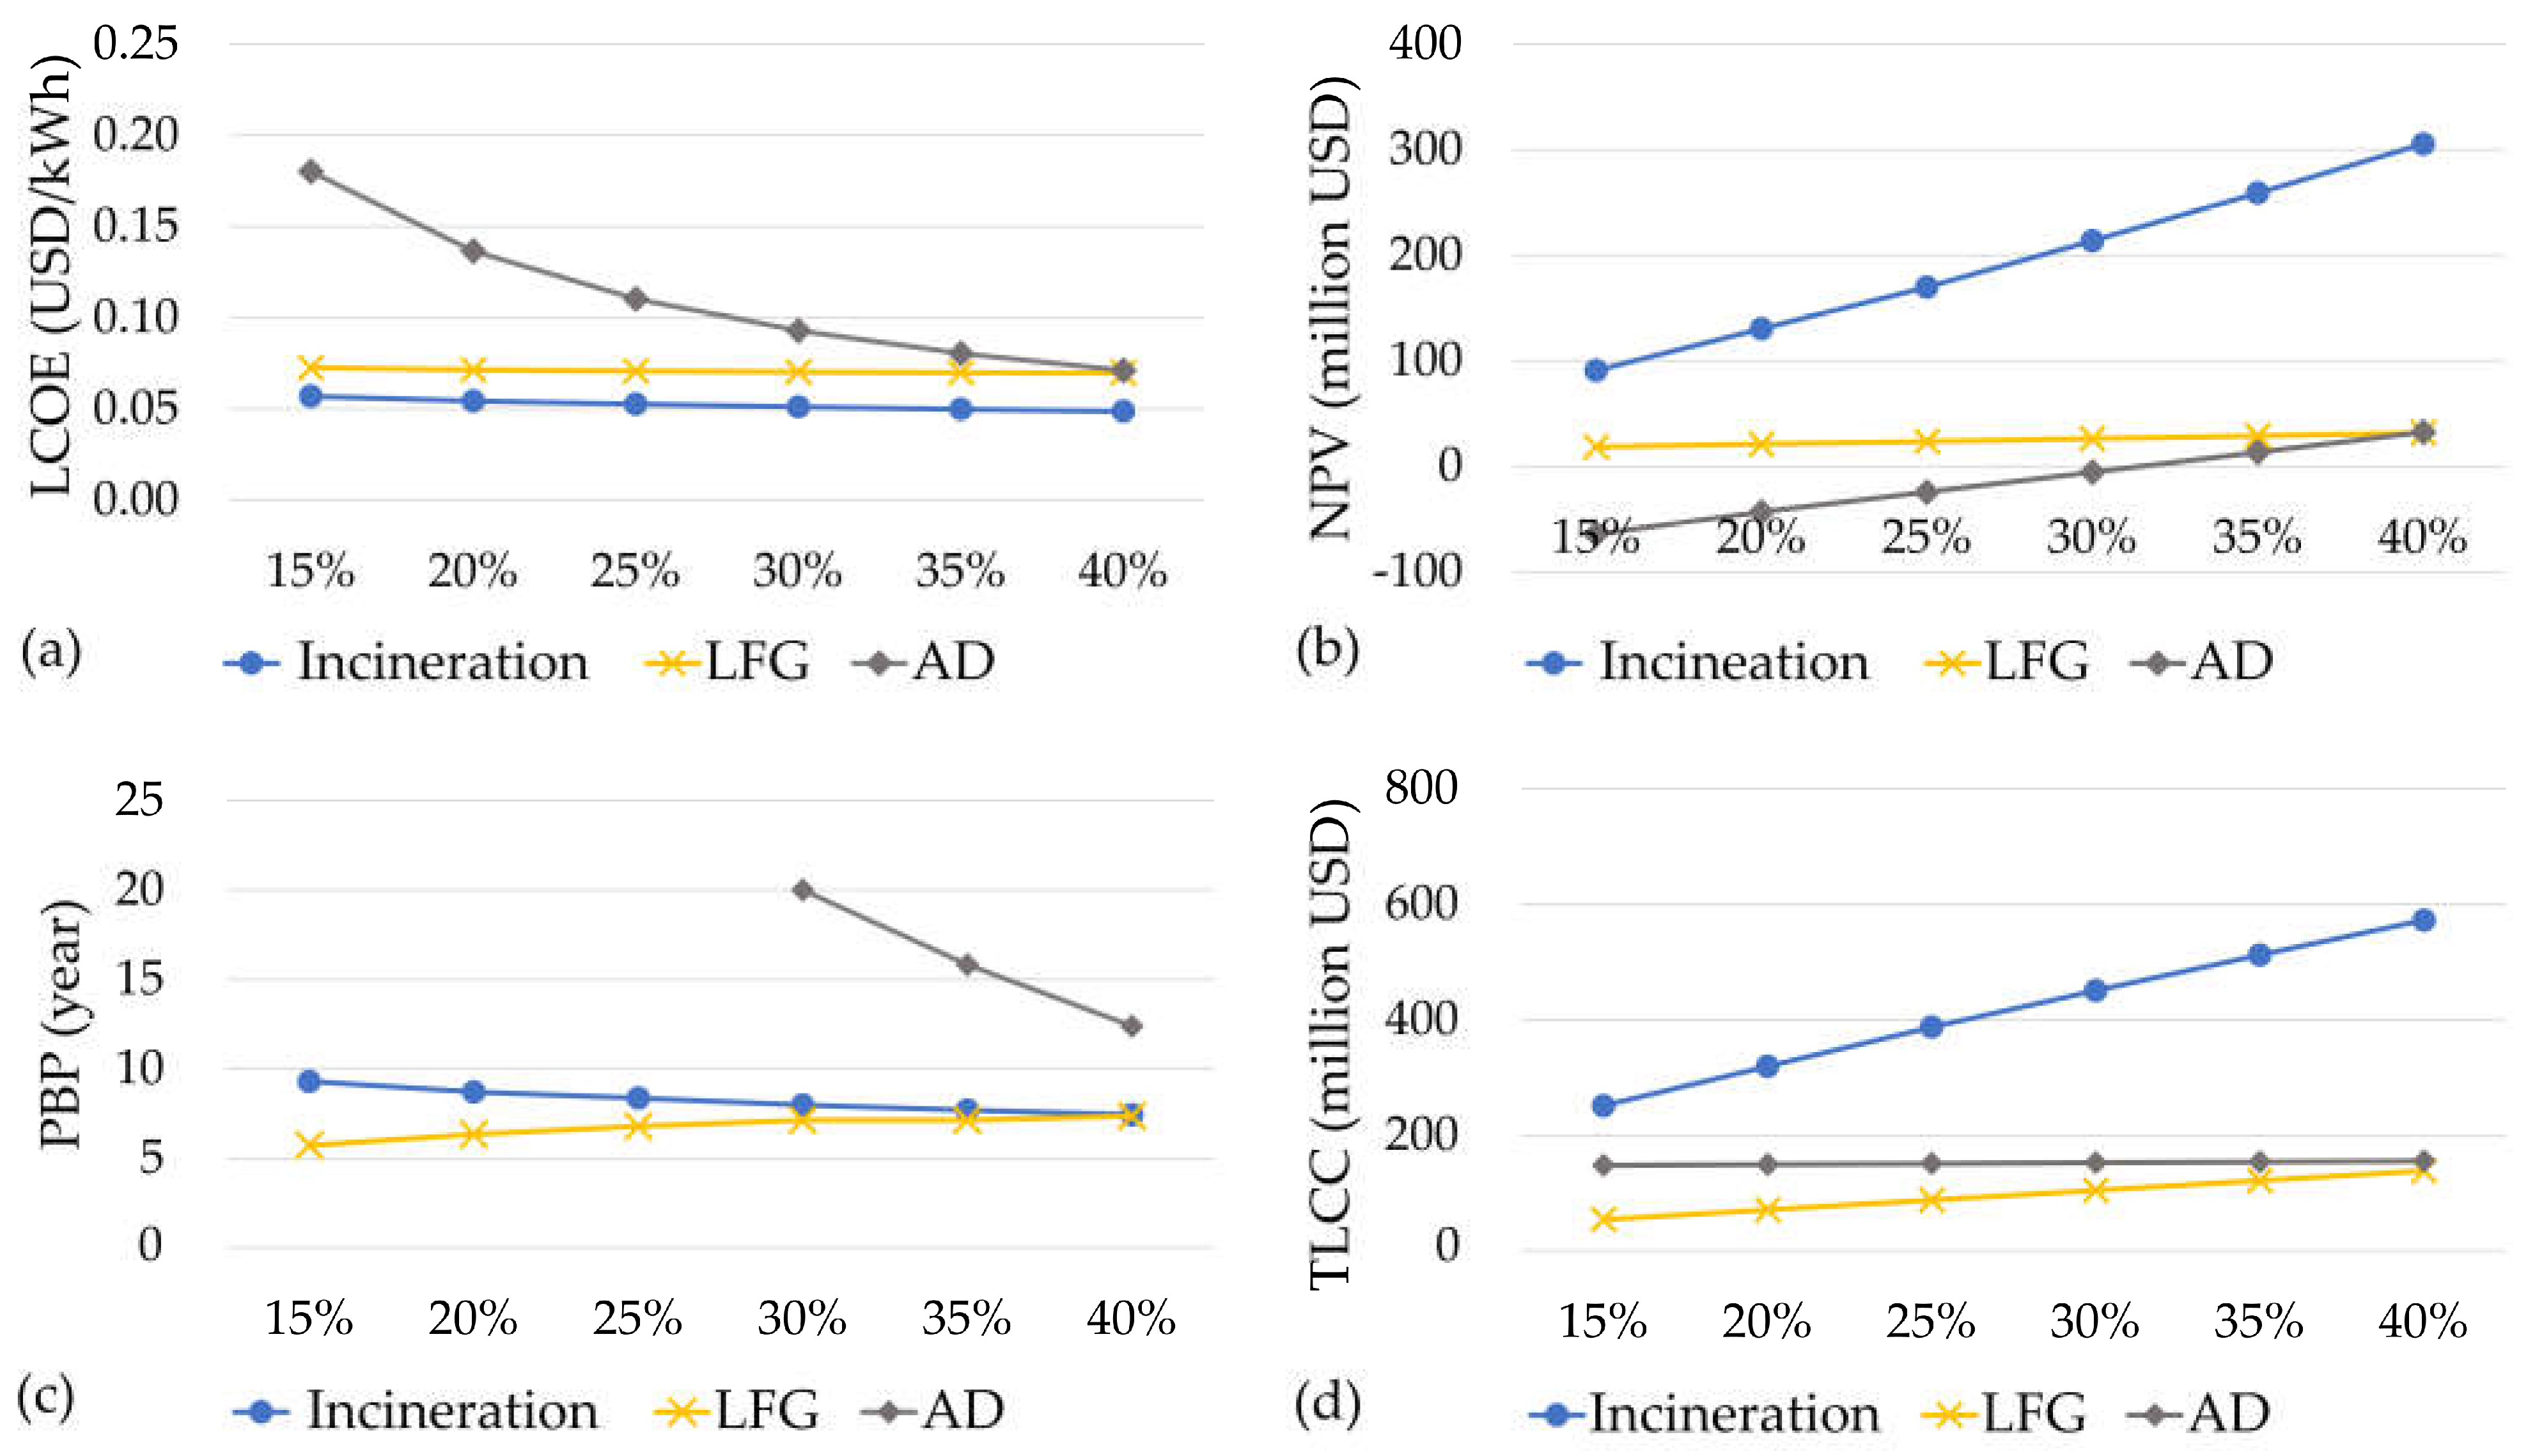
2.6. Sensitivity Analysis
3. Results and Discussion
3.1. MSW Generation Projection
3.2. Energy Recovery Potential
3.3. Economic Feasibility Assessment
3.4. Environmental Performance
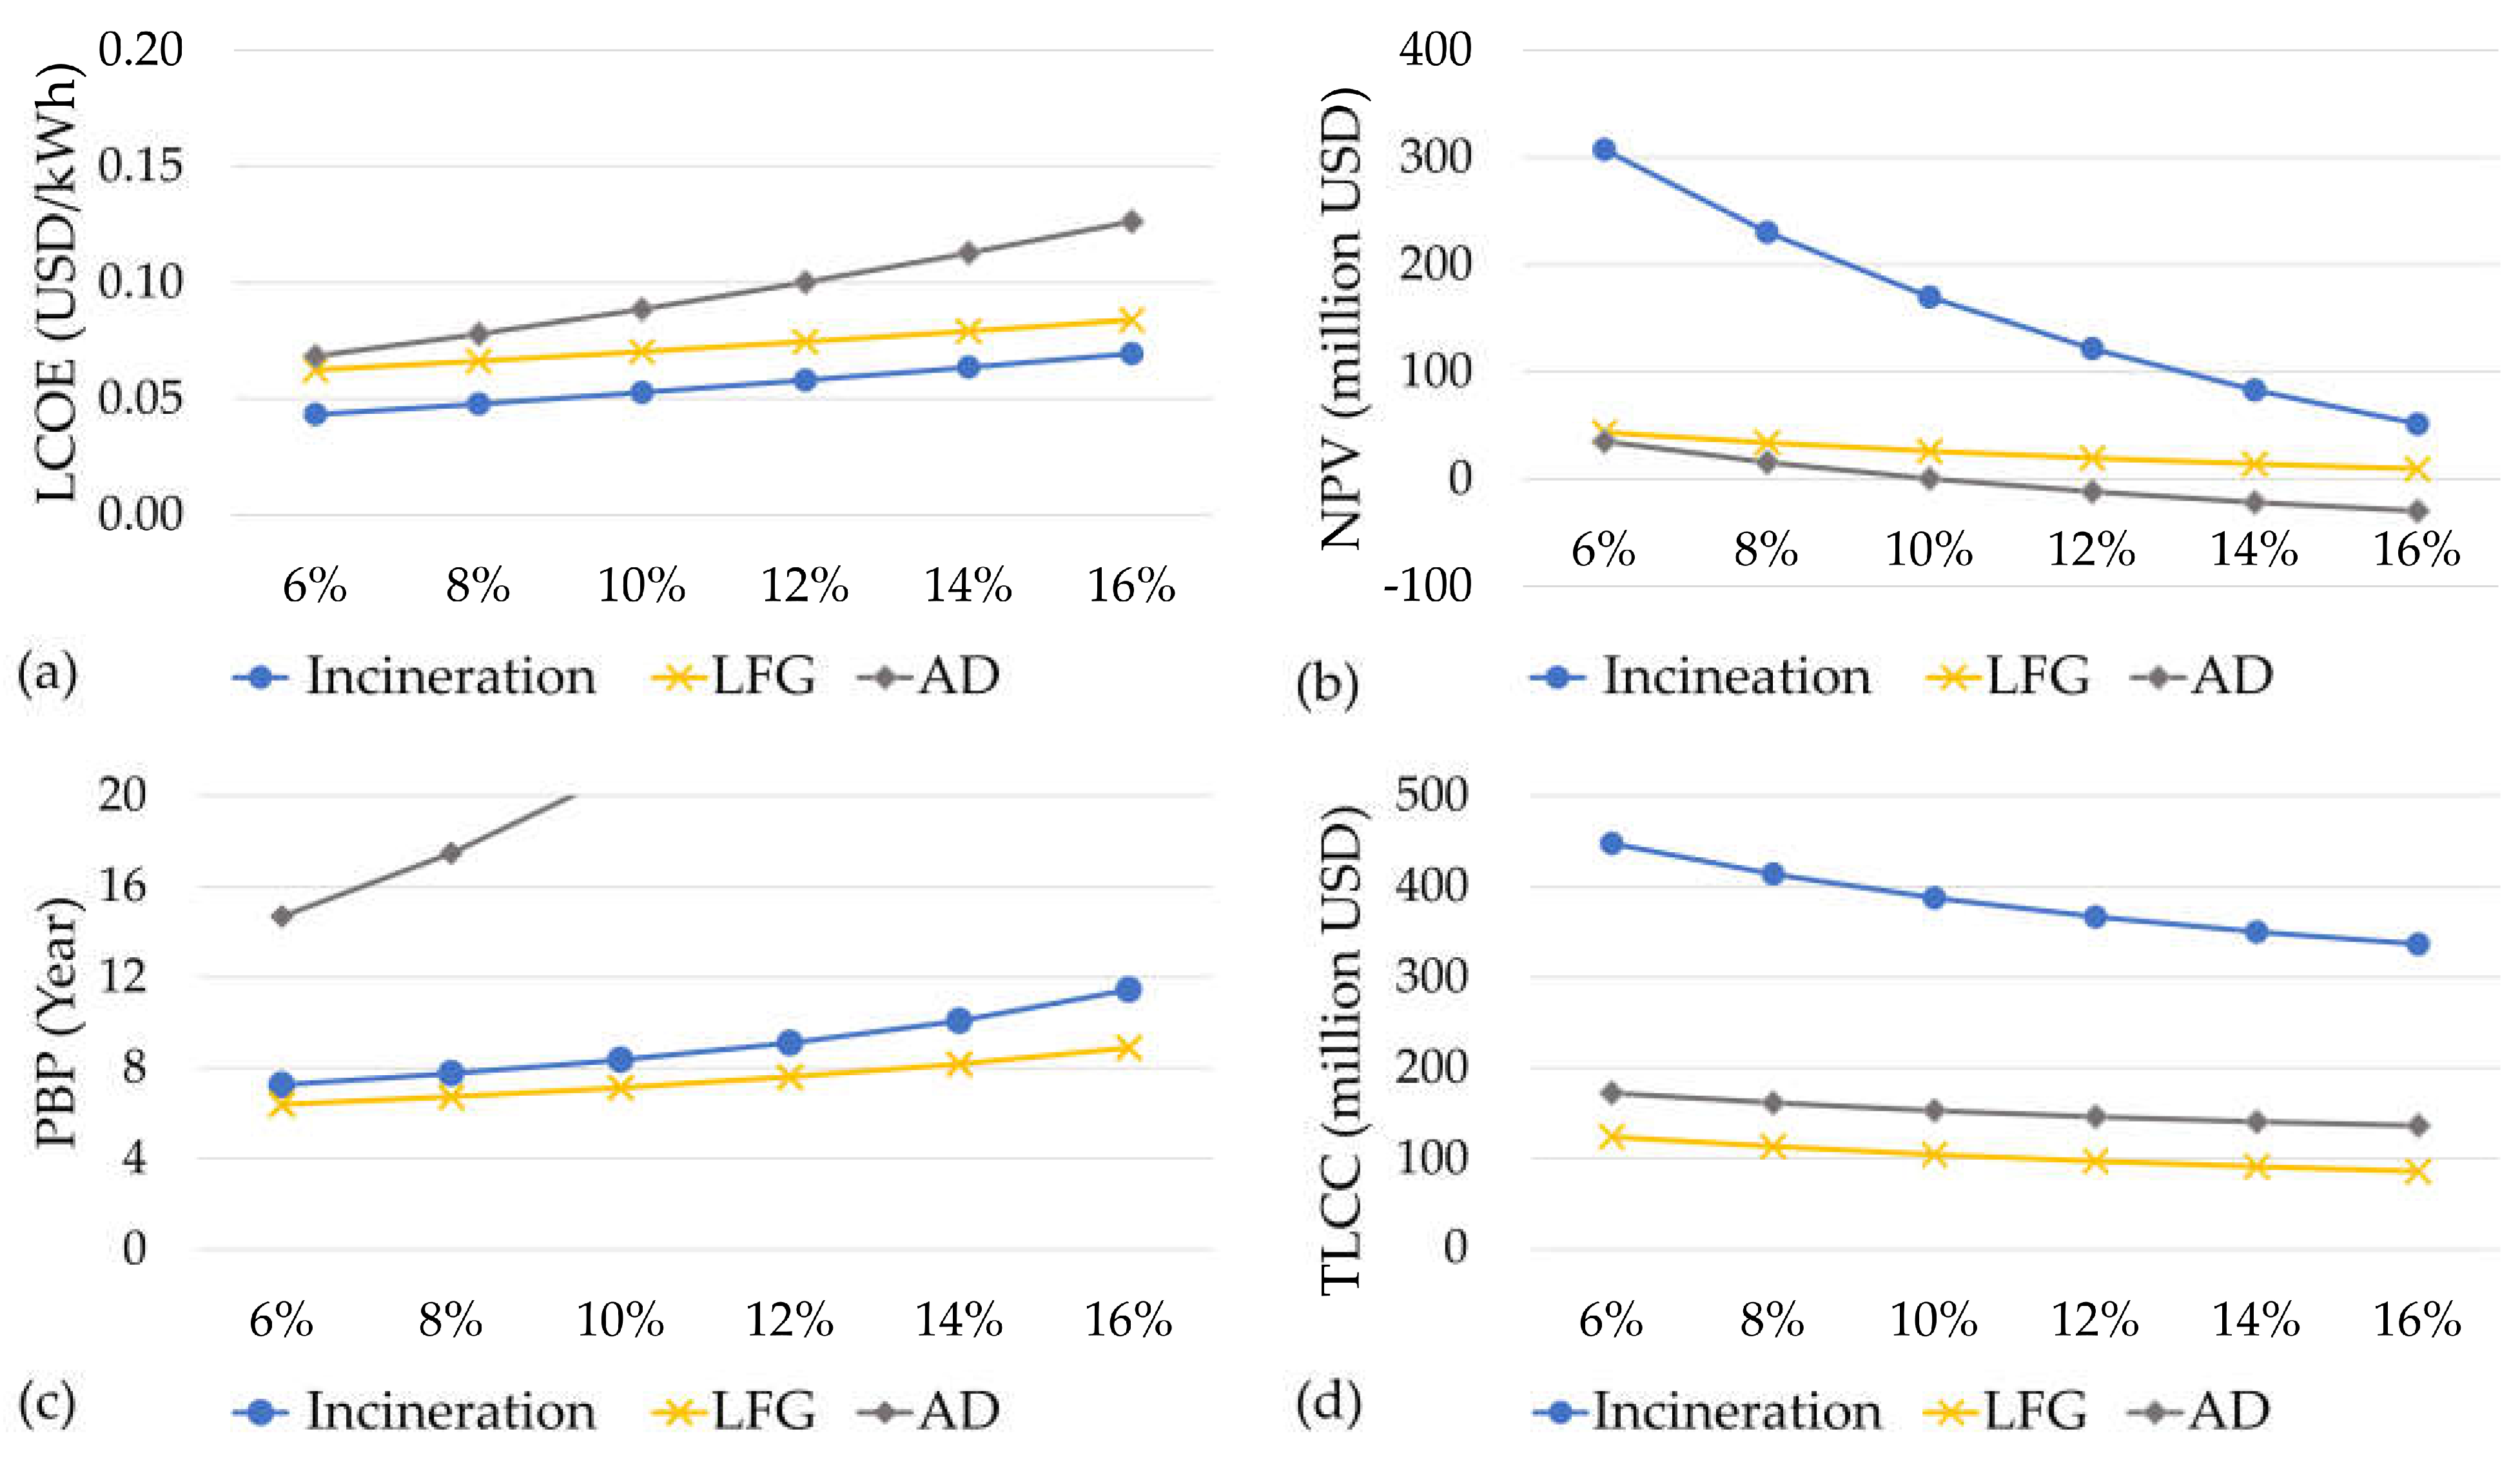
3.5. Sensitivity Analysis
4. Conclusions
Author Contributions
Funding
Institutional Review Board Statement
Informed Consent Statement
Data Availability Statement
Acknowledgments
Conflicts of Interest
Abbreviations
| AD | Anaerobic digestion | EFcoal-fired plant | Emission factor for coal power plant |
| CAPEX | Capital expenditure | EFN2O | Emission factor for N2O |
| CH4 | Methane | FCF | Fossil carbon fraction of waste, % |
| CO2 | Carbon dioxide | FIT | Feed-in tariff, USD/tMSW |
| ERP | Energy recovery potential | FCH4 | Fraction of methane, % |
| GHGs | Greenhouse gases | Feegate | Waste disposal fee at disposal site, USD/tMSW |
| GWP | Global warming potential | FRCH4 | Methane flow rate, m3/min |
| ICE | Internal combustion engine | GP(i) | Plant capacity of technology i, kW |
| IPCC | Intergovernmental Panel on Climate Change | k | Methane generation constant rate, per year |
| IRR | Internal rate of return | L0 | Potential methane generation capacity |
| LandGEM | Landfill Gas Emissions Model | OF | Oxidation factor, % |
| LCC | Life cycle costing | P0 | Initial investment cost, USD |
| LCOE | Levelized cost of electricity | Pn | Net cash flow, USD |
| LFG | Landfill gas | Ptax | Tax paid on the profit, USD |
| LHV | Low heating value | P(t) | Projected population |
| OPEX | Operation expenditure | P(0) | Population in the initial year of projection |
| MSW | Municipal solid waste | MCF | Methane correction factor, % |
| NPV | Net present value | Mi | Mass of waste, t |
| N2O | Nitrous oxide | O&Mcost | Operation and maintenance cost, USD |
| PBP | Payback period | O&Mfixed | Fixed operation and maintenance cost, USD |
| SRF | Solid refuse fuels | O&Mvariable | Variable operation and maintenance cost, USD |
| WTE | Waste-to-energy | QCH4(LFG) | Methane generation from landfill, m3 |
| QCH4(AD) | Methane generation from anaerobic digestion, m3 | ||
| Symbols | r | Population growth rate, % | |
| C(v) | Vertical gas extraction well cost, USD | Rcollection | Waste collection rate, % |
| C(w) | Wellhead and pipe installation cost, USD | Rev | Revenue, USD |
| C(k) | Knockout installation cost, USD | Rtax | Annual marginal tax rate, % |
| C(e) | Engineering cost, USD | TLCC | Total life cycle cost, USD |
| C(ICE) | Internal combustion engine installation cost, USD | Wcollected | Waste collected, t/day |
| CF | Capacity factor, % | Wf | Waste fraction, % |
| Dwell | Depth of the well, m | WGr | Waste generation per capita, kg/capita/day |
| DOC | Degradable organic carbon, % | Wn | Number of wells dug |
| DOCf | Fraction of degradable organic carbon, % | Yieldbiogas | Biogas yield, m3 |
| dm | Dry matter, % | λ | Methane collection efficiency, % |
| EAD | Emission from anaerobic digestion | ŋ | Electricity conversion efficiency, % |
| ECO2 | Emissions of CO2 | ρCH4 | Methane density, kg/m3 |
| EN2O | Emissions of N2O | α | Annual real discount rate, % |
References
- Hoornweg, D.; Bhada-Tata, P. What a Waste: A Global Review of Solid Waste Management; The World Bank: Washington, DC, USA, 2012. [Google Scholar] [CrossRef]
- Maalouf, A.; Mavropoulos, A. Re-assessing global municipal solid waste generation. Waste Manag. Res. 2022. [Google Scholar] [CrossRef] [PubMed]
- Kaza, S.; Yao, L.; Bhada-Tata, P.; Woerden, V.F. What a Waste 2.0: A Global Snapshot of Solid Waste Management to 2050; The World Bank: Washington, DC, USA, 2018. [Google Scholar]
- Trindade, A.B.; Palacio, J.C.E.; González, A.M.; Orozco, D.J.O.; Lora, E.E.S.; Renó, M.L.G.; del Olmo, O.A. Advanced Exergy Analysis and Environmental Assessment of the Steam Cycle of an Incineration System of Municipal Solid Waste with Energy Recovery. Energy Convers. Manag. 2018, 157, 195–214. [Google Scholar] [CrossRef]
- Hadidi, L.A.; Omer, M.M. A Financial Feasibility Model of Gasification and Anaerobic Digestion Waste-to-Energy (WTE) Plants in Saudi Arabia. Waste Manag. 2017, 59, 90–101. [Google Scholar] [CrossRef] [PubMed]
- Brunner, P.H.; Rechberger, H. Waste to Energy—Key Element for Sustainable Waste Management. Waste Manag. 2015, 37, 3–12. [Google Scholar] [CrossRef]
- Cucchiella, F.; D’Adamo, I.; Gastaldi, M. Sustainable Management of Waste-to-Energy Facilities. Renew. Sustain. Energy Rev. 2014, 33, 719–728. [Google Scholar] [CrossRef]
- Ayodele, T.R.; Ogunjuyigbe, A.S.O.; Alao, M.A. Economic and Environmental Assessment of Electricity Generation Using Biogas from Organic Fraction of Municipal Solid Waste for the City of Ibadan, Nigeria. J. Clean. Prod. 2018, 203, 718–735. [Google Scholar] [CrossRef]
- Gómez, A.; Zubizarreta, J.; Rodrigues, M.; Dopazo, C.; Fueyo, N. Potential and Cost of Electricity Generation from Human and Animal Waste in Spain. Renew. Energy 2010, 35, 498–505. [Google Scholar] [CrossRef]
- Asian Development Bank. Waste to Energy in the Age of the Circular Economy: Best Practice Handbook; Asian Development Bank: Metro Manila, Philippines, 2020. [Google Scholar] [CrossRef]
- Intergovernmental Panel for Climate Change. 2006 IPCC Guidelines for National Greenhouse Gas Inventories, Prepared by the National Greenhouse Gas Inventories Programme; Eggleston, H.S., Buendia, L., Miwa, K., Ngara, T., Tanabe, K., Eds.; IGES: Kanagawa, Japan, 2006; Volume 5. [Google Scholar]
- Ayodele, T.R.; Ogunjuyigbe, A.S.O.; Alao, M.A. Life Cycle Assessment of Waste-to-Energy (WTE) Technologies for Electricity Generation Using Municipal Solid Waste in Nigeria. Appl. Energy 2017, 201, 200–218. [Google Scholar] [CrossRef]
- Escamilla-García, P.E.; Jiménez-Castañeda, M.E.; Fernández-Rodríguez, E.; Galicia-Villanueva, S. Feasibility of Energy Generation by Methane Emissions from a Landfill in Southern Mexico. J. Mater. Cycles Waste Manag. 2020, 22, 295–303. [Google Scholar] [CrossRef]
- Kumar, A.; Sharma, M.P. Estimation of GHG Emission and Energy Recovery Potential from MSW Landfill Sites. Sustain. Energy Technol. Assess. 2014, 5, 50–61. [Google Scholar] [CrossRef]
- Cudjoe, D.; Han, M.S.; Chen, W. Power Generation from Municipal Solid Waste Landfilled in the Beijing-Tianjin-Hebei region. Energy 2021, 217, 119393. [Google Scholar] [CrossRef]
- De Silva, L.J.V.B.; dos Santos, I.F.S.; Mensah, J.H.R.; Gonçalves, A.T.T.; Barros, R.M. Incineration of Municipal Solid Waste in Brazil: An Analysis of the Economically Viable Energy Potential. Renew. Energy 2020, 149, 1386–1394. [Google Scholar] [CrossRef]
- Chakraborty, M.; Sharma, C.; Pandey, J.; Gupta, P.K. Assessment of Energy Generation Potentials of MSW in Delhi Under Different Technological Options. Energy Convers. Manag. 2013, 75, 249–255. [Google Scholar] [CrossRef]
- Dek, V.P.; Nguyen, V.Q.; Tran, D.K.; Tran, D.X. Challenges and Priorities of Municipal Solid Waste Management in Cambodia. Int. J. Environ. Res. Public Health 2022, 19, 8458. [Google Scholar] [CrossRef]
- Lombardi, L.; Carnevale, E.; Corti, A. A Review of Technologies and Performances of Thermal Treatment Systems for Energy Recovery from Waste. Waste Manag. 2015, 37, 26–44. [Google Scholar] [CrossRef]
- Electricity Authority of Cambodia. Report on Power Sector of the Kingdom of Cambodia 2021; EAC: Phnom Penh, Cambodia, 2021. Available online: https://eac.gov.kh/site/annualreport (accessed on 15 October 2022).
- National Institute of Statistics. General Population Census of the Kingdom of Cambodia 2019. 2020. Available online: https://www.nis.gov.kh/index.php/en/15-gpc/79-press-release-of-the-2019-cambodia-general-population-census (accessed on 20 September 2021).
- Seng, B.; Fujiwara, T.; Seng, B. Suitability Assessment for Handling Methods of Municipal Solid Waste. Glob. J. Environ. Sci. Manag. 2018, 4, 113–126. [Google Scholar] [CrossRef]
- US EPA. US EPA First-Order Kinetic Gas Generation Model Parameters for Wet Landfills; US EPA: Washington, DC, USA, 2005.
- Barlaz, M.A.; Chanton, J.P.; Green, R.B. Controls on Landfill Gas Collection Efficiency: Instantaneous and Lifetime Performance. J. Air Waste Manag. Assoc. 2009, 59, 1399–1404. [Google Scholar] [CrossRef]
- Amini, H.R.; Reinhart, D.R.; Mackie, K.R. Determination of First-Order Landfill Gas Modeling Parameters and Uncertainties. Waste Manag. 2012, 32, 305–316. [Google Scholar] [CrossRef]
- Ogunjuyigbe, A.S.O.; Ayodele, T.R.; Alao, M.A. Electricity Generation from Municipal Solid Waste in some Selected Cities of Nigeria: An Assessment of Feasibility, Potential and Technologies. Renew. Sustain. Energy Rev. 2017, 80, 149–162. [Google Scholar] [CrossRef]
- Al-Wahaibi, A.; Osman, A.I.; Al-Muhtaseb, A.H.; Alqaisi, O.; Baawain, M.; Fawzy, S.; Rooney, D.W. Techno-Economic Evaluation of Biogas Production from Food Waste via Anaerobic Digestion. Sci. Rep. 2020, 10, 15719. [Google Scholar] [CrossRef]
- Nubi, O.; Morse, S.; Murphy, R.J. Prospective Life Cycle Costing of Electricity Generation from Municipal Solid Waste in Nigeria. Sustainability 2022, 14, 13293. [Google Scholar] [CrossRef]
- Sin, S.; Aminov, Z.; Nguyen, V.G.; Tran, D.X. Feasibility of 10 MW Biomass-Fired Power Plant Used Rice Straw in Cambodia. Energies 2023, 16, 651. [Google Scholar]
- Alzate-Arias, S.; Jaramillo-Duque, Á.; Villada, F.; Restrepo-Cuestas, B. Assessment of Government Incentives for Energy from Waste in Colombia. Sustainability 2018, 10, 1294. [Google Scholar] [CrossRef]
- Xin, C.; Zhang, T.; Tsai, S.B.; Zhai, Y.M.; Wang, J. An Empirical Study on Greenhouse Gas Emission Calculations under Different Municipal Solid Waste Management Strategies. Appl. Sci. 2020, 10, 1673. [Google Scholar] [CrossRef]
- ACE. ASEAN CO2 Emissions from Coal-Fired Power Plants: A Baseline Study from Coal-Fired Power Plants; ASEAN Center for Energy: Jarkarata, Indonesia, 2021. [Google Scholar]
- PPCA; IGES; Nexus; UN Environment; CCCA. Phnom Penh Waste Management Strategy and Action Plan 2018–2035; Phnom Penh Capital Administration: Phnom Penh, Cambodia, 2018.
- Paleologos, E.K.; Caratelli, P.; El Amrousi, M. Waste-to-Energy: An Opportunity for a New Industrial Typology in Abu Dhabi. Renew. Sustain. Energy Rev. 2016, 55, 1260–1266. [Google Scholar] [CrossRef]
- Machado, S.L.; Carvalho, M.F.; Gourc, J.P.; Vilar, O.M.; Nascimento, J.C.F. Methane Generation in Tropical Landfills: Simplified Methods and Field Results. Waste Manag. 2009, 29, 153–161. [Google Scholar] [CrossRef] [PubMed]
- Emilio, E.P.; Fernández-Rodríguez, E.; Carrasco-Hernández, R.; Coria-Páez, A.L.; Gutiérrez-Galicia, F. A Comparison Assessment of Landfill Waste Incineration and Methane Capture in the Central Region of Mexico. Waste Manag. Res. 2022, 40, 1785–1793. [Google Scholar] [CrossRef]
- US EPA. Landfill Gas Energy Cost Model; Landfill Methane Outreach Program (LMOP); U.S. Environmental Protection Agency: Washington, DC, USA, 2016.
- IPCC. CH4 Emissions from Solid Waste Disposal; Background Paper; Institute for Global Environmental Strategies (IGES): Kanagawa, Japan, 2002; pp. 419–439. [Google Scholar]
- Chen, Y.-C.; Liu, H.M. Evaluation of Greenhouse Gas Emissions and the Feed-In Tariff System of Waste-to-Energy Facilities Using a System Dynamics Model. Sci. Total Environ. 2021, 792, 148445. [Google Scholar] [CrossRef]
- Bicks, A.T. Investigation of Biogas Energy Yield from Local Food Waste and Integration of Biogas Digester and Baking Stove for Injera Preparation: A Case Study in the University of Gondar Student Cafeteria. J Energy 2020, 2020, 8892279. [Google Scholar] [CrossRef]
- Chowdhury, T.H. Technical-Economical Analysis of Anaerobic Digestion Process to Produce Clean Energy. Energy Rep. 2021, 7, 247–253. [Google Scholar] [CrossRef]
- Alzate, S.; Restrepo-Cuestas, B.; Jaramillo-Duque, Á. Municipal Solid Waste as a Source of Electric Power Generation in Colombia: A Techno-Economic Evaluation under Different Scenarios. Resources 2019, 8, 51. [Google Scholar] [CrossRef]
- Abdallah, M.; Shanableh, A.; Shabib, A.; Adghim, M. Financial Feasibility of Waste to Energy Strategies in the United Arab Emirates. Waste Manag. 2018, 82, 207–219. [Google Scholar] [CrossRef] [PubMed]
- Tan, S.T.; Ho, W.S.; Hashim, H.; Lee, C.T.; Taib, M.R.; Ho, C.S. Energy, Economic and Environmental (3E) Analysis of Waste-to-Energy (WTE) Strategies for Municipal Solid Waste (MSW) Management in Malaysia. Energy Convers. Manag. 2015, 102, 111–120. [Google Scholar] [CrossRef]
- Holden, N.M.; Wolfe, M.L.; Ogejo, J.A.; Cummins, E.J. Introduction to Biosystems Engineering; ASABE in Association with Virginia Tech Publishing: Blacksburg, VA, USA, 2020; ISBN 978-1-949373-97-4. [Google Scholar]
- Xin-Gang, Z.; Gui-Wu, J.; Ang, L.; Yun, L. Technology, Cost, a Performance of Waste-to-Energy Incineration Industry in China. Renew. Sustain. Energy Rev. 2016, 55, 115–130. [Google Scholar] [CrossRef]
- Dong, J.; Tang, Y.; Nzihou, A.; Chi, Y. Key Factors Influencing the Environmental Performance of Pyrolysis, Gasification and Incineration Waste-to-Energy Technologies. Energy Convers. Manag. 2019, 196, 497–512. [Google Scholar] [CrossRef]
- Tan, S.T.; Lee, C.T.; Hashim, H.; Ho, W.S.; Lim, J.S. Optimal Process Network for Municipal Solid Waste Management in Iskandar Malaysia. J. Clean. Prod. 2014, 71, 48–58. [Google Scholar] [CrossRef]
- Agaton, C.B.; Guno, C.S.; Villanueva, R.O.; Villanueva, R.O. Economic Analysis of Waste-to-Energy Investment in the Philippines: A Real Options Approach. Appl. Energy 2020, 275, 115265. [Google Scholar] [CrossRef]


| Composition | Waste Properties | Waste Treatment | |||||||
|---|---|---|---|---|---|---|---|---|---|
| Fraction (%) a | Moisture (%) a | LHV (MJ/kg) a | Carbon Content (%) b | Fossil Carbon (%) b | DOC (%) b | LFG (%) | Incineration (%) | AD (%) | |
| Food waste | 49.18 | 78.77 | 0.33 | 38.00 | - | 15 | 49.18 | 49.18 | 49.18 |
| Wood and leaves | 6.69 | 57.12 | 0.56 | 49.00 | - | 43 | 6.69 | 6.69 | - |
| Mixed paper | 6.54 | 63.61 | 4.04 | 46.00 | 1.00 | 40 | 6.54 | 6.54 | - |
| Rubber and leather | 0.87 | 18.09 | 22.37 | 67.00 | 20.00 | 39 | 0.87 | 0.87 | - |
| Textiles | 8.02 | 44.28 | 14.87 | 50.00 | 20.00 | 24 | 8.02 | 8.02 | - |
| Nappies | 2.91 | 58.29 | 4.49 | 70.00 | 10.00 | 24 | 2.91 | 2.91 | - |
| Plastic | 21.13 | 18.37 | 34.78 | 75.00 | 100.00 | - | - | 21.13 | - |
| Glass | 1.42 | - | - | 3.00 | 50.00 | - | - | - | - |
| Metals | 1.05 | - | - | 3.00 | 50.00 | - | - | - | - |
| Others | 2.21 | 22.73 | 3.84 | 3.00 | 50.00 | - | - | - | - |
| Plant Type | OF (%) | LHV (MJ/m3) | ŋ (%) | λ (%) | CF (%) |
|---|---|---|---|---|---|
| LFG | 10 a | 37.2 b | 30 c | 75 d | 85 e |
| AD | - | 37.2 b | 30 c | 95 a | 85 e |
| Incineration | - | (see Table 1) | 25 c | - | 80 c |
| Parameters | Unit | Value |
|---|---|---|
| Landfill open | year | 2023 |
| Landfill closure year (with 80-year limit) | year | 2042 |
| Annual precipitation | mm | 1550 |
| Methane generation rate constant, k | Year−1 | 0.213 a |
| Potential methane generation capacity, L0 | m3/ton | 90 a |
| Nonmethane organic carbon concentration (NMOC) | ppmv as hexane | 600 |
| Fraction of methane (F) | % by volume | 50 b |
| MCF for unmanaged landfill–deep (>5 m waste) | 0.8 b | |
| Degradable organic carbon (DOC) | 0.15 a | |
| Fraction of degradable organic carbon (DOCf) | 0.77 c |
| Year | LFG (GWh) | Incineration (GWh) | AD (GWh) | Year | LFG (GWh) | Incineration (GWh) | AD (GWh) |
|---|---|---|---|---|---|---|---|
| 2023 | 660.94 | 162.59 | 2033 | 179.24 | 964.34 | 237.22 | |
| 2024 | 686.39 | 168.85 | 2034 | 189.80 | 1001.47 | 246.36 | |
| 2025 | 712.82 | 175.35 | 2035 | 200.06 | 1040.02 | 255.84 | |
| 2026 | 740.26 | 182.10 | 2036 | 210.16 | 1080.06 | 265.69 | |
| 2027 | 768.76 | 189.11 | 2037 | 220.18 | 1121.65 | 275.92 | |
| 2028 | 115.44 | 798.36 | 196.39 | 2038 | 230.22 | 1164.83 | 286.54 |
| 2029 | 130.50 | 829.09 | 203.95 | 2039 | 240.34 | 1209.68 | 297.58 |
| 2030 | 144.11 | 861.01 | 211.81 | 2040 | 250.62 | 1256.25 | 309.03 |
| 2031 | 156.60 | 894.16 | 219.96 | 2041 | 261.09 | 1304.61 | 320.93 |
| 2032 | 168.23 | 928.59 | 228.43 | 2042 | 271.81 | 1354.84 | 333.29 |
| WTE Plant Characteristics | Unit | LFG | Incineration | AD |
|---|---|---|---|---|
| Mass of input waste | Ton | 1,454,989 * | 1,869,482 | 964,502 |
| Operating time | h/year | 8760 | 8760 | 8760 |
| Lifespan of the WTE projects | Year | 15 a | 20 b | 20 b,c |
| Average electricity production within 2023–2042 | GWh/year | 197.89 | 968.91 | 238.35 |
| Plant capacity | MW | 23 | 111 | 27 |
| Financial Indicators | Unit | LFG | Incineration | AD |
|---|---|---|---|---|
| Cost | ||||
| Initial investment cost | USD | 31,716,738 | 227,474,483 | 101,373,259 |
| Fixed O&M cost | USD/year | 7,426,072 | 15,829,524 | 3,041,198 |
| Variable O&M cost | USD/year | 916,590 | 4,080,768 | 1,048,728 |
| Total life cycle cost | USD | 95,232,512 | 387,186,003 | 152,593,851 |
| Depreciation cost | USD/year | 2,114,449 | 11,373,724 | 5,802,066 |
| Tax | USD/year | 1,343,205 | 8,423,313 | 1,405,515 |
| Benefit | ||||
| Net present value (NPV) | USD | 25,472,926 | 169,858,819 | −5,556,540 |
| Payback period (PBP) | Year | 7.13 | 8.36 | >20 |
| Levelized cost of electricity (LCOE) | USD/kWh | 0.070 | 0.053 | 0.093 |
| Internal rate of return | % | 18.53 | 16.94 | 8.08 |
| Net cash flow | USD | 5,037,019 | 33,693,254 | 6,484,177 |
| Technology | Direct Emissions | Emission Avoidance | Net Emissions |
|---|---|---|---|
| LFG | 417,533 | 181,930 | 235,603 |
| Incineration | 975,554 | 890,750 | 84,803 |
| AD | 79,386 | 219,121 | −139,735 |
| Economic Parameter | Technology | −30% | −20% | −10% | 0% | +10% | +20% | +30% |
|---|---|---|---|---|---|---|---|---|
| NPV | Incineration | 22,461,015 | 71,593,616 | 120,726,218 | 169,858,819 | 218,991,420 | 268,124,021 | 317,256,622 |
| LFG | −1,856,129 | 7,253,556 | 16,363,241 | 25,472,926 | 34,582,611 | 43,692,296 | 52,801,980 | |
| AD | −41,815,814 | −29,729,389 | −17,642,965 | −5,556,540 | 6,529,884 | 18,616,309 | 30,702,733 | |
| PBP | Incineration | 16.63 | 12.38 | 9.95 | 8.36 | 7.22 | 6.36 | 5.69 |
| LFG | >20 | 11.16 | 8.65 | 7.13 | 6.10 | 5.34 | 4.75 | |
| AD | >20 | >20 | >20 | >20 | 17.68 | 14.68 | 12.62 | |
| IRR | Incineration | 9.98% | 12.46% | 14.77% | 16.94% | 19.03% | 21.05% | 23.02% |
| LFG | 7.7% | 11.73% | 15.29% | 18.53% | 21.56% | 24.44% | 27.2% | |
| AD | 2.78% | 4.73% | 6.48% | 8.08% | 9.57% | 10.98% | 12.32% |
Disclaimer/Publisher’s Note: The statements, opinions and data contained in all publications are solely those of the individual author(s) and contributor(s) and not of MDPI and/or the editor(s). MDPI and/or the editor(s) disclaim responsibility for any injury to people or property resulting from any ideas, methods, instructions or products referred to in the content. |
© 2023 by the authors. Licensee MDPI, Basel, Switzerland. This article is an open access article distributed under the terms and conditions of the Creative Commons Attribution (CC BY) license (https://creativecommons.org/licenses/by/4.0/).
Share and Cite
Pheakdey, D.V.; Quan, N.V.; Xuan, T.D. Economic and Environmental Benefits of Energy Recovery from Municipal Solid Waste in Phnom Penh Municipality, Cambodia. Energies 2023, 16, 3234. https://doi.org/10.3390/en16073234
Pheakdey DV, Quan NV, Xuan TD. Economic and Environmental Benefits of Energy Recovery from Municipal Solid Waste in Phnom Penh Municipality, Cambodia. Energies. 2023; 16(7):3234. https://doi.org/10.3390/en16073234
Chicago/Turabian StylePheakdey, Dek Vimean, Nguyen Van Quan, and Tran Dang Xuan. 2023. "Economic and Environmental Benefits of Energy Recovery from Municipal Solid Waste in Phnom Penh Municipality, Cambodia" Energies 16, no. 7: 3234. https://doi.org/10.3390/en16073234
APA StylePheakdey, D. V., Quan, N. V., & Xuan, T. D. (2023). Economic and Environmental Benefits of Energy Recovery from Municipal Solid Waste in Phnom Penh Municipality, Cambodia. Energies, 16(7), 3234. https://doi.org/10.3390/en16073234